analyzing deterrents to online retailing: a study of users
TRANSCRIPT

Global Business and Management Research: An International Journal
Vol. 7, No. 4 (2015)
21
Analyzing Deterrents to Online Retailing: A Study
of Users and Non Users in India
Urvashi Tandon
Research Scholar, School of Behavioural Sciences and Business Studies
Thapar University, P.O.Box 32, Patiala, India
Ravi Kiran
Professor and Head, School of Behavioural Sciences and Business Studies
Thapar University, P.O.Box 32, Patiala, India
Corresponding Author’s Email: [email protected]
A. N. Sah
Assistant Professor, School of Behavioural Sciences and Business Studies
Thapar University, P.O.Box 32, Patiala, India
Abstract
Purpose: The purpose of this paper is to empirically analyse the hindrances and inhibitions
which restrain Indians to purchase online.
Design/Methodology/Approach: Data was collected from 385 users and 100 non users of
online shopping from North Indian States of India. Random sampling method was used to
collect the data. The information obtained was subjected to various statistical tools like
ANOVA, Correlation, Factor analysis, and Chi-Square to analyze the data.
Findings: The results of the study highlight that there is a significant difference in the mean
ratings of both the groups for most of the deterrents to online shopping.
Practical Implications: The study has practical implications for online retailers. This study
will help online retailers in North India to recognize challenges for customer retention and
satisfaction. Thus, it will help online retailers to focus in the right direction to eliminate threats
and convert non shoppers to online shoppers.
Originality: This is one of the initial studies dealing with deterrents to online shopping from
all perspectives. Contrary to the research in developed countries highlighting online shopping
risk, fear of faulty products, poor logistics and delayed delivery as major deterrents, in this
study slow internet speed and inapt query handling emerge as deterrents for users as well as
non users. This study has also incorporated the perception of non users so that retailers can
convert them into online shoppers.
Keywords: Internet retailing, Online shopping, Gender, Users, Non-Users, Deterrents, India
1 INTRODUCTION
The development of Internet as a new channel of marketing has evoked interest from
practitioners and researchers all over the world. India as an emerging economy presents a
prospective market for online retailing. Online retailing although started in India in 2000 with
few sites like rediff.com, indiaplaza.com and bazee.com yet it gained impetus with the entry of
flipcart.com in 2007 post which a large number of online retailers entered the e-space triggering
a phenomenal increase in the number of online shoppers. Despite this, online retailing is still
at its emerging stage (0.1 % of total retail) and is projected to grow at accelerated pace to reach

Global Business and Management Research: An International Journal
Vol. 7, No. 4 (2015)
22
7-8% of total Indian retail market by 2020 (Singh et al. 2012). Online retailing market in India
stood at the level of 0.21 Bn USD in 2007 is expected to be around 13.5 Bn USD in 2017.
Modest estimates indicate that out of 19.6 million users who accessed internet for enquiring
details related to a specific product or service, nearly 73 percent actually bought a product or
service in the end (Varshney, Rashi 2013).
In India, the Internet has the potential to fundamentally revolutionize the way consumers shop
and buy goods and services which is anticipated to grow and reach 800 million users by 2020
(Internet and Mobile Association of India, 2012). Growing aspirations, changing lifestyles,
increase in purchasing power of people, awareness about global brands and fashion trends have
driven people to shop online. Limited availability of brands in tier II and tier III Indian cities
which are far away have driven even these consumers to go online and shop.
As the use of internet for sales and purchase of products continues to grow in India so does the
appearance of bottlenecks and challenges in day to day operations. Although a number of
researchers have adopted a usual approach to study factors influencing B2C customer
satisfaction which highlight the significance of variables like perceived usefulness (Devraj et
al. 2002; Ha and Stoel, 2008; Lin and Sun 2009; Liao and Shi, 2009; Wu, 2013), perceived
ease of use (Devraj et al. 2002; Rose et al. 2007; Lin and Sun 2009; Liao and Shi, 2009),
pleasure and playfulness (Prasad and Ansari, 2009; Khare and Rakesh, 2011), shared values
(Mukherjee and Nath, 2007), self-efficacy (Hernandez et al. 2010), trust (Chen and Dubinsky,
2003; Dash, 2012; Nair, 2009; Ha and Stoel, 2008; Wang and Head, 2007; Mukherjee and
Nath, 2007; Salo and Karjaluoto 2007; Wu, 2013). Research implies that customer satisfaction
in online atmosphere is appreciably higher than in traditional channels because of the ease of
use in acquiring information (Hernandez et al. 2010; Devraj et al. 2002). Although these studies
have made significant contributions towards explaining customer satisfaction and what factors
trigger online purchase but there is acute dearth of research aimed at understanding the
challenges in online shopping.
Previous studies have also identified major barriers towards online shopping like risk,
technology ignorance and touch and feel factor (Rajamma et al. 2009; Iyer and Eastman, 2006;
Hansen and Jensen, 2009; Pradas et al. 2013; Lian and Yen 2013; Qureshi et al. 2014). Most
of the academic research reported has been carried out in countries who had adopted online
shopping prior than India. Therefore, the results of these studies may not be applicable to
developing countries like India which differ in socio-cultural background as well as
technology. The findings of developed countries need to be validated for diverse cultures across
the developing countries also so that these may have a broad acceptance irrespective of culture.
Therefore the study has been undertaken to identify barriers to online shopping.
The study has significant contributions for researchers and online retailers. For academicians,
this study identifies barriers to online retailing in Indian context. The study this sets an outline
for further research as it is one of the initial study in emerging economies. The study also
includes new scale items like slow internet speed and inapt query handling which are the
concerns exclusive to developing nations. The study has enhanced our knowledge about under
researched area of barriers to online shopping. Online retailers can understand the reasons for
which Indians restrain from shopping online. This will help online retailers to design strategies
to rise above these barriers.
2 THEORETICAL BACKGROUND
Regardless of a remarkable and enthusiastic adaptation of Internet retailing in past few years,
still a considerable number of people in India circumvent online shopping. Consumers may be
contented with some facet of online shopping but are discontented with other facets. Therefore,
an in-depth analysis of the challenges of online shopping is the need of the hour. Consequently,
the purpose of this paper is to understand the hindrances and inhibitions which restrain people
from making online purchases.

Global Business and Management Research: An International Journal
Vol. 7, No. 4 (2015)
23
Based on earlier literature barriers to online retailing have been identified. Earlier researchers
have highlighted many inherent structural and functional weaknesses of internet retailing such
as problems related to faulty products and delivery (Teo, 2006; Forsythe and Shi, 2003
Batnagar et al. 2000; Tan 1999), unwillingness to reveal personal information over the web
despite assurances given by online retailers(Ranganathan and Ganpathy, 2002), online
shopping risk perceptions (Chen and Dubinsky, 2003; Nair , 2009; ) poor logistics (Grewal et
al. 2004), channel conflict (To and Ngai, 2008) , problems related to payment system and
language problems (Dawn and Kar, 2011). Trocchia and Janda (2000) considered that the
principal obstacles which make older consumers more reluctant to shop online are lack of IT
experience, resistance to change and their insistence on trying out the product before purchase.
Selvidge et al. (2002) noticed that longer waiting time (delay) in opening of web pages lead to
increase frustration which ultimately results in the participants failing to complete shopping
tasks. Anckar (2003) identified barriers to e-commerce and grouped them into five (distribution
efficiency, privacy, bargain hunting, shopping efficiency, information efficiency) and four
(shopping limitation, cost, financial risks) factors and differentiated between Internet adopters
and non adopters, as well as e-commerce adopters and non adopters. Garbarino and Strahilevitz
(2004) in their research found that women have higher level of perceived risk than men.
Forsythe and Shi (2003) highlighted product performance risk as a strongest deterrent to shop
online. Gerrand et al. (2006) stipulated that online shoppers are unable to access the actual
product and paying online perceived higher risk as compared to traditional brick and mortar
stores. Iyer and Eastman (2006) confirmed that older users were uncomfortable and had less
expertise in using computers, therefore were unable to do comparison shopping on internet. A
study by Singh et al. (2005) predicted that websites that adapt Indian culture were shown to be
perceived more favourably than others. However, a study by Dash and Saji (2008) conducted
among Indian consumers confirmed that higher presence in social media leads to low perceived
risk. Rajamma et al. (2009) from their research found that when consumer’s expectation about
risk (e.g security and privacy of the information asked) during checkout process are negatively
disconfirmed, they may get demotivated from complete transaction thus leading to shopping
cart abandonment. Hansen and Jensen (2009) studied shopping orientation and online clothing
purchases across four different gender allied purchasing contexts and found that perceived
difficulty in selecting items is an important barrier for women. Hernandez et al. (2010)
analysed whether individuals’ socioeconomic characteristics – age, gender and income –
influence their online shopping behaviour and results of the study showed that socioeconomic
variables moderate neither the influence of previous use of the internet nor the perceptions of
e-commerce; in short, they do not condition the behaviour of the experienced e-shopper.
Chattaraman et al. (2012) in his study on older customers identified six main barriers namely
perceived risk barriers, trust barriers, social support barriers, familiarity barriers, experiential
barriers and search barriers. Kachen et al. (2013) accentuated that online stores are perceived
to have competitive disadvantages with respect to shipping and handling charges, exchange
refund policy for returns, providing an interesting social and family experience, helpfulness of
sales people, post purchase service, and uncertainty about getting the right item. Pradas et al.
2013 studied the behaviour of B2C non-shoppers and indicated that there exist four types of
non B2C shoppers: skeptical/ distrustful non shoppers whose main concern is online safety and
security, infrastructure-conditioned non shoppers who lack resources to engage in online
shopping, product conditioned non shoppers who prefer to shop at traditional physical channels
and others. Lian and Yen (2013) in their survey on comparison of younger and older consumers
of Taiwan found major barriers as value, risk and tradition. Further, their research also
indicated that rejecters have highest barriers followed by opponents and postponers.
Online shoppers expect fast and efficient processing of their online transactions (Srinavasan et
al. 2002), however incomplete shopping procedures, long registration forms to be filled up,
shipping and handling charges that are not revealed until late transaction, technical glitches

Global Business and Management Research: An International Journal
Vol. 7, No. 4 (2015)
24
etc., are transaction related inconveniences which make transaction complex and cause
dissatisfaction. These disadvantages are not entirely overcome by online stores. To overcome
these disadvantages online retailers make use of privacy policies, consumer feedback, customer
support but the fact remains that even after an online retailer succeeds in winning the trust of
its customers by employing all trust winning strategies, a number of customers still leave
without completely purchase of the products (Rajamma et al. 2009). While shopping
physically, consumers can usually examine a product before purchasing and clarify doubts with
sales person but in case of online shopping, they are usually unable to do so. Hence, consumers
may need to spend more time and effort to find detailed information before buying them (Teo,
2006).
The literature reviewed is comprised of the empirical studies carried out by researchers of those
countries who adopted online retailing earlier than India. Only few studies are available in India
and these too are focussing on the factors that trigger online purchase and the question still
remains unrequited “Why Indians hesitate to shop online”? Although online shopping is
accompanied by good growth rate but still a number of people refuse online shopping.
Moreover, the objective of above studies has mainly been to analyse the deterrents of online
shopping at the beginning of the diffusion process, with limited coverage of bottlenecks in
penetration of the technology for improvement in the process. Some of the studies have been
carried out when the number of users was low or those users who had yet to familiarise fully
with the on line purchase environment. Hence, an understanding of significant rejection issues
of online shopping becomes imperative and it needs to be investigated further. Moreover, the
diffusion of internet in developed countries and models prevalent there cannot be generalised
for developing countries like India.
A lack of understanding regarding barriers in existing literature points to the need for the
research. Due to scarcity of research with respect to India, an in-depth and a complete
understanding of the barriers and problems becomes vital. Therefore, the objectives of the
present study are:
To examine the deterrents to online retailing on the basis of gender, age and education.
To analyse the characteristics of users and non users of online retailing.
To identify and analyse factors acting as impediments to online retailing.
The study has apparent benefits. Theoretically, the study highlights under researched area of
barriers to online shopping and managerially, the study will help online retailers in North India
to recognize challenges for customer retention and satisfaction. Thus, this study will help online
retailers to focus on the right direction to eliminate threats and convert non shoppers to online
shoppers. Further, steps to tackle these barriers have also been suggested.
3 RESEARCH METHODOLOGY
To achieve the above mentioned objectives of the study a self administered questionnaire was
developed to collect data from users as well as non users of online shopping. The literature
reviewed provided an initial source for the development of the key items of questionnaire. The
questionnaire had twenty questions covering barriers to online shopping. The questionnaire
was discussed with several academicians, management experts and scholars. This resulted in
some minor amendments in the original wording and sequence of items. Final questionnaire
had fifteen questions which were considered pertinent for both users and non users of online
shopping. Population of this research consisted of North Indian internet savvy consumers who
have adopted online shopping as well as those who have not adopted online shopping. In order
to guarantee the representativeness of the sample, random sampling method was used and
sample of users and non users of online shopping was drawn from all North Indian states. The
places of access chosen were offices, shopping malls, colleges and supermarkets. The
questionnaire was tested for its overall reliability and overall reliability score as depicted by

Global Business and Management Research: An International Journal
Vol. 7, No. 4 (2015)
25
Cronbach’s Alpha was 0.814. The survey was carried from March 2013 to January 2014. 2000
questionnaires were administered to youth including students, businessmen and service class
people. A total of 465 questionnaires from users were obtained out of which 385 were retained
for further analysis. Data was also collected from 100 non users of online shopping. Various
statistical tools like descriptive Statistics, ANOVA, factor analysis, correlation and chi-square
test were used to analyse the data.
4 RESULTS AND ANALYSIS
4.1 DEMOGRAPHIC PROFILE OF RESPONDENTS
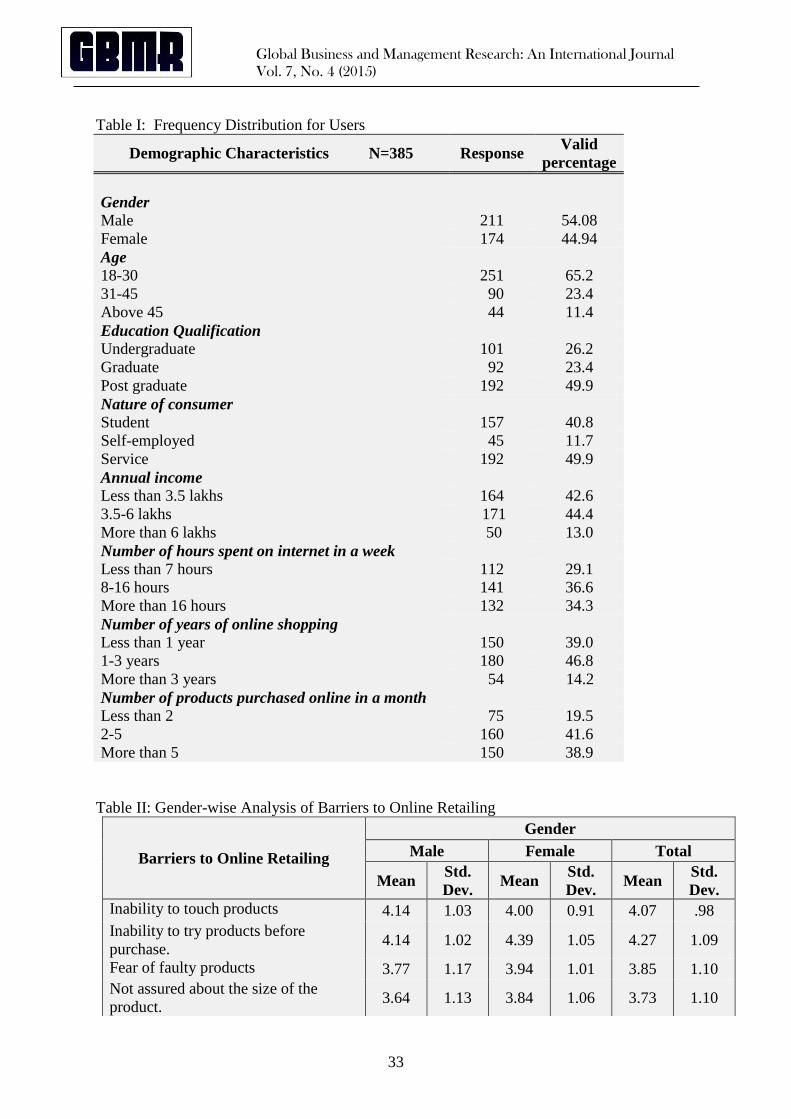
Table 1 shows the basic characteristics of the consumers surveyed. Out of the total 385 users
of online shopping, 54.08 percent were males and 45.2 percent were females. This is consistent
with Teo (2006) who explained that males are more likely to be interested in online shopping
than females. Among the respondents, 65.2 percent were between 18-30 years of age followed
by 23.4 percent in middle age group of 31-45 years of age and remaining 11.4 percent were
above 45 years of age. There is a need to encourage those above 45 years old to use the Internet
for online shopping. Education profile of respondents shows 49.9 percent were postgraduates
followed by 26.2 percent as undergraduates and remaining 23.9 as graduates. The nature of the
consumer showed 40.8 percent were students, 47.5 percent were in service and remaining 11.7
percent were self-employed. Majority of the respondents (44.4 percent) were having annual
income 3.5-6 Lakh followed by 42.6 percent having income less than 3.5 Lakh and remaining
12 percent having income above 6 Lakh. A sizeable number of respondents 36.6 percent spend
7-16 hours on internet in a week followed by 34.3 percent spending more than 16 hours on
internet which shows that majority of respondents are internet savvy. A substantial number of
respondents (46.8 percent) indicated that they have been shopping online from 1-3 years
followed by 39.0 percent who had been shopping from internet since 1 year. Majority of
respondents (41.6 percent) had purchased 2-5 products from internet followed by 38.9 percent
who had purchased more than five products from internet in last year. From above analysis it
appears that a considerable number of respondents were well educated i.e., postgraduates and
graduates, of young age and enjoying average income. The findings are consistent with
Swinyard and Smith (2003); Burroughs and Sabherwal (2002) and Teo, (2006) who found that
adopters of the Internet tend to be highly educated, have computer literacy and spend more
time on internet.
4.2 GENDER-WISE ANALYSIS ON IMPEDIMENTS TO ONLINE RETAILING
Overall results as depicted in table II indicate “Inability to try products before purchase” had
the highest average score 4.147 from males and 4.396 from females and is the strongest
inhibitor of online shopping. This was followed by “Inability to touch products” having mean
score of 4.142 by males and 4.0 by females. This is in consensus with prior studies like Gerrand
et al. 2006; Park et al. (2008) and Hansen and Jensen (2009). Next in the rating are “Fear of
faulty products”, “Inapt query handling” and “Not assured of size of the products.” This
supports the findings of Kachen et al. (2013), Lian and Yen (2013) which highlight risk of
faulty products as main deterrent to online shopping.
4.3 AGE WISE ANLYSIS OF BARRIERS TO ONLINE RETAILING
From age wise analysis as summarised in Table-III it can be inferred that “Inability to touch
products” and “Inability to try products before purchase” have been rated high by all age groups
as well. Thus there is need to focus on these barriers. For middle age group i.e., 31-45 years
old consumers consider “Posting their personal details online” is a strong inhibitor of online
shopping with mean score of 4.022. Age group above 45 have given high rating to “Inapt query
handling” followed by “Fear of faulty products.” This implies that people above the age of 45
exhibit less willingness to shop online due to distrust about products available on internet and

Global Business and Management Research: An International Journal
Vol. 7, No. 4 (2015)
26
process of online purchase due to non familiarity of the medium (Trocchia and Janda, 2000).
The results are consistent with the findings of Batnagar et al. 2000; Tan 1999 who considered
product risk among older users as a major deterrent of online shopping.
4.4 EDUCATION QUALIFICATION AND BARRIERS TO ONLINE SHOPPING
INSERT TABLE IV ABOUT HERE
From the results it was concluded that “inability to try product before purchase” was the main
inhibitor of online shopping. Next to follow were inability to touch products, fear of faulty
products, inapt query handling and not assured of size of the product.
4.5 RELATIONSHIP BETWEEN BARRIERS TO ONLINE RETAILING
In order to find out the relationships between variables, Pearson’s correlation coefficients were
calculated. Correlations of 1.00 on the diagonal indicate that every variable is “Perfectly and
Positively” correlated within itself. A positive and significant correlation also exists between
most of fifteen variables (Table V) for example, Inability to touch products showed unique
correlation with inability to try products. Similarly, not assured about size of product is also
highly correlated with lack of confidence in online retailing. Slow internet speed showed
similar pattern of relationship with tiresome browsing through internet, lack of confidence in
online shopping, difficulty in placing orders online and inapt query handling. Time consuming
to make changes to orders placed online is negatively but significantly associated with slow
internet speed. This implies that all the variables are well defined. After getting high correlation
values factor analysis was performed on users and non users to categorize barriers.
4.6 FACTOR ANALYSIS OF BARRIERS TO ONLINE RETAILING
After identifying behavioural relationships with reference to gender, age and education
qualification, and getting correlation matrix factor analysis was performed and it helped to
classify barriers into four factors:
Query handling and return procedures
Perceived Risk
Technology ignorance factor
Ignorance of consumer
These four factors explained 54.718 percent of variance. Query handling and return procedures
emerged as important factor accounting for 14.918 percent of variation. Many online retailers
donot inform about consumer’s rights regarding return procedures, the right of withdrawal,
after sales service and legal warranty on a durable product. Hence, difficulty in exchange of
faulty products with loading of .725 and inapt query handling with loading of .714 emerged as
strongest deterrents to online buying.
Perceived risk emerged as second important factor accounting for 14.500 percent of total
variance. Inability to try products before purchase (.825) and inability to touch products (.785)
had higher loadings than fear of faulty products (.673) and not assured of size of product (.524).
Fear of using debit card/ credit card comparatively had less loading (.491) but was included
due to its importance in understanding barriers. This agrees with the results of studies like
Garbarino and Strahilevitz 2004; Gerrand et al. 2006; Park et al. 2008; Hansen and Jensen,
2009; Chattaraman et al. 2012; Lian and Yen , 2013 who stated that risk negatively influences
online purchase among shoppers.
The third factor technology ignorance factor explained 14.226 percent of variation. In this sub-
factor of confidence in internet retailing (.762) loaded heavily as compared to difficulty in
placing orders online and slow internet speed. These findings support by Iyer and Eastman,
2006; Salo and Karjaluoto 2007; Gupta et al. 2009; Chattaraman et al. 2012; Lian and Yen,

Global Business and Management Research: An International Journal
Vol. 7, No. 4 (2015)
27
2013 who found that older users are uncomfortable with online shopping because of low
confidence in internet and non-familiarity of internet practices.
Ignorance of consumer has been recognised as fourth important factor explaining 11.074
percent of variation. Major features of this factor include posting personal details online inhibit
online shopping (.781) and inability to bargain (.773).
The solution’s KMO measure of sampling adequacy was 0.744 above the highest standard. The
value of Bartlett’s test of sphericity is 1292.116 (df: 105) and is significant at less than .01
percent, indicating that assumption of multivariate normality was met.
After performing factor analysis users and non users on the basis of barriers were also divided
into sub-groups: ‘Sceptical’ who are doubtful about query handling and return procedures;
‘Risk perceivers’ whose main concern is faulty products, inability to touch and feel products,
‘Technology ignorant’ who are not well versed with the procedures of online shopping and
‘Conformist’ who are disinterested in sharing their details online and look for more bargains
from traditional stores. To understand the relation of degree of each barrier and intention among
respondents, mean and standard deviation ware calculated. From the results it can be inferred
that females are more sceptical, perceive more risk, technology ignorant and more conformist
than males. Respondents of age group 18-30, with income less than 3.5 Lakh were found more
sceptical than others. Likewise, people above age group 45, postgraduates and with income
group less than 3.5 Lakh avoid online shopping due to perceived risk. Technology ignorant and
conformist group comprised of people with age group 31-45 and income more than 6 Lakh.
4.7 ANALYSIS OF VARIANCE (ANOVA) BETWEEN USERS AND NON USERS
OF INTERNET SHOPPING
After analysing the descriptive statistics and factor analysis, an effort was made to conduct
ANOVA analysis for the users and non users. The data for inhibitors was also collected from
100 non users to realise whether there was a significant difference in the mean ratings of both
the groups. The results are shown through table VIII.
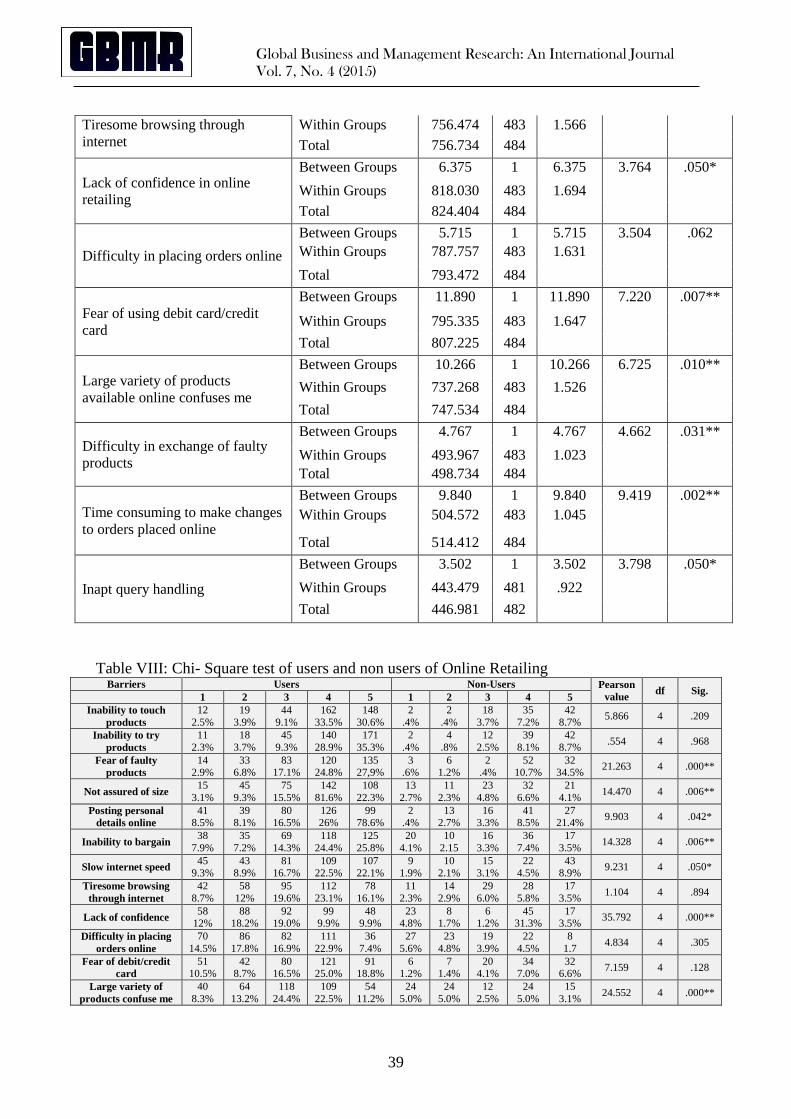
ANOVA results for users and non users highlight that there is a significant difference in the
mean ratings of both the groups as results are significant for most of the inhibitors. ANOVA
results are not significant for Inability to touch products, Inability to try products, Fear of faulty
products, Posting my personal details online inhibit shopping, Tiresome browsing through
internet and difficulty in placing orders online. Fear of debit card/ credit card had less item
loading but was found significant in ANOVA analysis showing its significance in the study.
Further, Chi-square test was performed to find association between users and non users of
online shopping. The Chi-square test revealed the significant association between users and
non users of online shopping with respect to Fear of faulty products (Pearson value 21.263),
Not assured of size of product (Pearson value 14.470), Inability to bargain (Pearson value
14.328) , Lack of confidence in online retailing (Pearson Value 35.792), Large variety of
products available online confuse me (Pearson value 24.552) and Time consuming to make
changes to orders placed online (Pearson value 20.021) at 99% level. This leads us to conclude
that users and non users consider these variables as deterrents to online shopping. On the other
hand, Posting personal details online (Pearson value 9.903), Slow internet speed (Pearson value
9.231) and difficulty in exchange were found significant at 95 percent confidence level.
Variables like Inability to touch products, Inability to try products, Tiresome browsing through
internet, Difficulty in placing orders online, Fear of debit/credit card and Inapt query handling
were found insignificant indicating there is no significant relationship between users and non
users with respect to these variables.
Overall results of mean scores of users and non users signify that “Inability to try products
before purchase” had highest mean followed by “Inability to touch products”. Both users and
non users considered “Inapt query handling” and “Fear of faulty products” as important
hindrance factors for online shopping. This highlights that consumers are apprehensive of

Global Business and Management Research: An International Journal
Vol. 7, No. 4 (2015)
28
defective products being handed over to them. Thus, it can be tackle by transparency in dealings
of online retailers and detailed policies of return, security and privacy need to be displayed on
websites.
DISCUSSION AND CONCLUSION
The results of the study present interesting insights on the users and non users of online
shopping. It also throws light on the factors inhibiting online shopping. The study empirically
identified fifteen variables as deterrents to online shopping through a self-structured
questionnaire. The barriers basket in the study essentially includes physical touch and try, fear
of faulty products and exchange difficulty besides inability to bargain, lack of confidence and
posting of details about credit/debit cards and other internet use problems and perceptions.
Compared with the results of the developed countries, this study the two deterrents which are
rated high are “Slow internet speed” and “Inapt query handling” which are still a major concern
in developing countries like India. This highlights that the models of developed countries
cannot be implemented as such for the developing countries.
The foremost objective of the study has been to identify deterrents to online retailing on the
basis of gender, age and education. The results of the study reveal that Internet users in India
are predominantly young, post graduate, and are adaptable to new technology. It is surprising
that gender-wise analysis, age-wise analysis and analysis on the basis of education qualification
identified Inability to try products before purchase and Inability to touch products as strongest
inhibitors of online shopping. But, there is limited availability of users above the age of 45.
There is a need to persuade those above 45 years old to adopt internet shopping. Older adults
may face problems related to use of internet for shopping also but this segment symbolizes a
profitable market. Since adults above the age of 45 have good leisure time and high disposable
income and once this segment performs one or more online purchase, their mind-set towards
online shopping may transform. Providing social support to people above 45 will help them to
assuage their perceived risks and augment their trust for online shopping. The results are
consistent with the findings of Trocchia and Janda, 2000; Batnagar et al. 2000; Tan 1999 There
is some variation in other results but these two factors are considered as strongest deterrents to
online shopping. Women considered Inability to bargain also among the top five barriers. By
nature Indians love to bargain and the tendency is more among Indian women. This supports
earlier study by Anckar 2003 who also identified bargain hunting as a barrier to online
shopping.
The next objective of the study was to analyse the differences in the impediments to online
retailing on the basis of users and non users. Again, Inability to try products before purchase
and Inability to touch products emerged as vital deterrents for both users and non users of
online shopping. Online retailing entitles a transformation in consumer’s current shopping
practices and they need some time to adjust to this buying behaviour. Online retailers need to
understand this adaptation on Indian consumers so that non users can be converted into users.
Inapt query handling and fear of faulty products have also emerged as critical restraints by both
users and non users of online shopping. Online retailers need to be little more considerate
towards customers’ needs. Competent sales support staff must handle queries of consumers
swiftly which will add trustworthiness to online businesses. Online retailers need to display
clear privacy policy, payment terms, guarantee, product return policy procedures and
statements about product quality. Online chat forums need to be includes in the website so that
any issue regarding purchase of product can be resolved promptly without any delay. In
addition online retailers can instil confidence providing help to first time user of online
shopping e.g. “First time user of Online Shopping? Click here”, making new users recognizable
with procedure of online shopping. Online chat with the first time user may also help in
reducing the fear of faulty products. These chat rooms, FAQs, and other events will improve

Global Business and Management Research: An International Journal
Vol. 7, No. 4 (2015)
29
customers’ needs for social interaction, and may inculcate confidence in new users to use online
shopping frequently.
Factor analysis analysed the factors acting as impediments to online shopping. The factors
identified through this study are: i) Query handling and return procedures ii) Perceived risk
iii) Technology ignorance factor iv) Ignorance of consumer. Query handling and return
procedures, and Perceived risk explained 29.418 percent of variation. These results have been
corroborated by studies of Chen and Dubinsky 2003; Garbarino and Strahilevitz 2004; Gerrand
et al. 2006; Nair 2009; Rajamma et al. 2009; Lian and Yen 2013;Chattaraman et al. 2012 as
they focussed on online shopping risk perceptions. Inability to touch products and inability to
try products before purchase loaded heavily followed by difficulty in exchange of faulty
products and inapt query handling. Salo and Karjaluoto (2007) also highlight lack of ability to
touch, smell or see the goods as vital barriers to online shopping. This may be handled by
providing accurate dimensions, measurement and size guides etc. especially for apparels.
Technology ignorance factor and ignorance of consumers explained 25.300 percent of
variation. Lack of confidence in online shopping, difficulty in placing orders online and slow
internet speed loaded highly which shows that unlike developed countries slow speed of
internet and ease of online shopping still acted as a major deterrent in this factor. These findings
support earlier researches by Hernandez et al. 2010; Iyer and Eastman 2006; Chattaraman et
al. 2012; Lian and Yen 2013 who found that lack of experience in internet impedes online
shopping. Moreover, internet users in India need simplified online shopping procedures. At
present uncomplicated shopping cart versions and simple check out procedures are compulsory
for inexperienced shoppers. In addition, online shoppers need to be more transparent regarding
the policy of replacements and good query handling software is the need of the hour. A right
focus on these issues will help e-tailers to improve their performance.
Hence it becomes imperative for online retailers to provide consumers with quality products,
excellent service and useful information based on communication technology to encourage
repetitive purchases. One such challenge tackled admirably by online retailers in India is
“Cash-on-Delivery” mode of payment as a safe and reliable way to pay for purchases. Cash –
on delivery mode of payment has helped to alleviate the fear of using debit card/ credit card.
In Indian society, people tend to be motivated from discussion with their friends, co-workers,
relatives and technically proficient classmates. Therefore, social influence may generate wide
consumer base. Adding social networking features enhance the credibility by providing online
customers alternative trustful source of information rendered by social networks (Lee and
Kozer 2012). Online retailers may provide incentive to these opinion leaders who would
encourage online consumers to use online shopping.
In summary, findings from this study could help to understand the behaviour of users and non
users of online shopping and hence implement strategies to overcome these barriers.
Comprehending perception of users and non users is significant in understanding consumer
behaviour which will infuse confidence among consumers about online shopping. These
findings will help online retailers to improve negative shopping experiences, improve post
purchase satisfaction and eventually increase customers of online shopping.
LIMITATIONS
The present study also has few limitations. An important limitation of the study is that this
study was conducted for respondents of North India. Although to remove this constraint an
effort was made to compare results with studies conducted in South and West as well. However,
the results cannot be generalised for the whole country as exposure of online retailing varies in
different parts of the country. Secondly, the limited availability of respondents above the age
of 45 was a factor that affected scope of the research and the type of analysis done.
Since online retailing is a multifaceted process as compared to brick and mortar store and future
studies should look to more related factors to form a comprehensive picture of impediments to

Global Business and Management Research: An International Journal
Vol. 7, No. 4 (2015)
30
online retailing. Further researchers can compare websites of online retailers with respect to
specific convenience, risk, waiting time and examine their effect on online purchases.
REFERENCES
Anckar, B. (2003), “Drivers and inhibitors to e-commerce adoption: exploring the rationality
of consumer behaviour in the electronic marketplace”, available at:
http://csrc.lse.ac.uk/asp/aspecis/20030002.pdf (accessed 13 October 2013),
Bhatnagar, A., Misra, S. and Rao, H. R. (2000), "On Risk, Convenience, and Internet Shopping
Behavior," Communications of the ACM, Vol. 43 No. 11, pp. 98-105.
BMI India Retail Report (August 8, 2012) retrieved from
http://www.marketresearch.com/Business-Monitor-International-v304/BMI-India-
Retail-Q4-7093789/ (accessed13 May 2013)
Burroughs, R.E. and Sabherwal, R. (2002), “Determinants of retail electronic purchasing: a
multi –period investigation”, Informs, Vol. 40 No.1, pp. 35-56.
Chattaraman V, Kwon Wi-Suk. and Gilbert J.E. (2012), “ Virtual agents in retail websites;
benefits of stimulated social interaction for older users”, Computers in Human
Behaviour, Vol. 28 No. 6, pp. 2055-2066.
Chen, Z. and Dubinsky, J.A. (2003), “A conceptual model of perceived customer value in e-
commerce: a preliminary investigation”, Psychology and Marketing, Vol. 20 No. 4, pp.
323-347.
Dash, Ajitabh. (2012), “Online shopping and customer satisfaction: an empirical
investigation”, International Journal of Research in Management, Economics and
Commerce, Vol. 2 No. 11, pp. 42-49.
Dash, S. and Saji, K. B. (2006), “The Role of Consumer Self-Efficacy and Website Social-
Presence in Customers' Adoption of B2C Online Shopping”. Journal of International
Consumer Marketing, Vol. 20 No. 2, pp. 33-48.
Dawn, S.K. and Kar, U. (2011), “E-tailing in India- its issues, opportunities and effective
strategies for growth and development”, International Journal of Multidisciplinary
Research, Vol.1 No. 3, pp. 101-115.
Devaraj, S., Fan, M. and Kohli, R. (2002), “Antecedents of B2C channel satisfaction and
preference: validating e-commerce metrics”, Information Systems Research, Vol. 13 No.
3, pp. 16-33.
Dholakia, R.R. and Zhao, M. (2010), “Effects of online store attributes on customer satisfaction
and repurchase intentions”, International Journal of Retail and Distribution
Management, Vol. 38 No.7, pp. 482-496.
Forsythe, S.M. and Shi, B. (2003), “Consumer patronage and risk perceptions in internet
shopping”, Journal of Business Research, Vol. 56 No.1, pp. 867-875.
Garbarino, E. and Strahilevitz, M. (2004), “Gender differences in the perceived risk of buying
online and the effects of receiving a site recommendation”, Journal of Business Research,
Vol. 57 No. 7, pp.768–775.
Gerrard, P., Cunningham, J. B., and Devlin, J. F. (2006), “Why consumers are not using
Internet banking: A qualitative study”, Journal of Services Marketing, Vol 20 No. 3, pp.
160–168.
Grewal, D., Iyer R. G. and Levy M. (2004), “Internet retailing: enablers, limiters and market
consequences”, Journal of Business Research, Vol. 5 No.7, pp.703-713.
Ha, S. and Stoel, L. (2009), “Consumer e-shopping acceptance: antecedents in a technology
acceptance model”, Journal of Business Research, Vol. 62 No.5, pp. 565-571.
Hansen, T. and Jensen M.J. (2009), “Shopping orientation and online clothing purchases: the
role of gender and purchase situation”, European Journal of Marketing, Vol. 42 No.
(9/10), pp. 1154-1170.

Global Business and Management Research: An International Journal
Vol. 7, No. 4 (2015)
31
Hernandez, B., Jimenez, J. and Martin, J.M. (2010), “Age, gender and income: do they really
moderate online shopping behaviour?”, Online Information Review, Vol. 35 No. 1, 2011
pp. 113-133.
Internet in urban India (Sept 2012) retrieved from http://www.iamai.in/reports1.aspx (accessed
20 October 2012)
Iyer, Rajesh and Jacqueline K. Eastman. (2006), “The Elderly and Their Attitudes toward the
Internet: The Impact on Internet Use, Purchase and Comparison Shopping”, Journal of
Marketing Theory and Practice, Vol. 14 No.1, pp. 57-67.
Kachen, Jacqueline J., Janes D. H. and Kevin C. (2013), “Bricks or clicks? Consumer attitude
towards traditional and online stores”, Global Economics and Management Review, Vol.
18 No. 1, pp. 12-21.
Khare, A. and Rakesh S. (2011), “Antecedents of online shopping behaviour in India: an
examination”, Journal of Internet Commerce, Vol. 10 No. 4, pp. 227-244.
Kiran. R., Sharma. A. and Mittal, K.C. (2008), “Attitudes, preferences and profile of online
buyers in India: changing trends”, South Asian Journal of Management, Vol. 15 No. 3,
pp. 275-96.
Lian, J. W. and Yen, D. C. (2013), “To buy or not to buy experience goods online: Perspective
of innovation adoption barriers”, Computers in Human Behavior, Vol. 29 No.3, pp. 665–
672.
Liao, Z. and Shi, X. (2009), “Consumer perceptions of internet-based e-retailing: an empirical
research in Hong Kong”, Journal of Service Marketing, Vol. 23 No.1, pp. 24-30.
Lin, T.R.G. and Sun, C.C. (2009), “Factors influencing satisfaction and loyalty in online
shopping: an integrated model”, Online Information Review, Vol. 33 No.3, pp. 458-475.
Nair, J.R. (2009), “E-Tailing paradigm: a diagnostic and prognostic study of e-tailing practices
in Bangalore metropolitan area”, Dharana: Bhavan’s Intrnational Journal of Business ,
Vol. 3 No. 1, pp. 32-59.
Pradas -Iglesias, S., Pascual-Miguel, F., Hernandez-Garcia, A., and Chaparro-Pelaez, J.
(2013), “ Barriers and drivers for non-shoppers in B2C e-commerce: A latent class
exploratory analysis”, Computers in Human Behavior, Vol. 29 No. 2, pp. 314–322.
Prasad, J.S. and Aryasri, A.R. (2009), “Determinants of shopper behaviour in e-tailing: an
empirical analysis”, Paradigm, Vol. 13 No. 1, pp. 73-83.
Rajamma, K.R., Paswan, K.A. and Hossain, M.M. (2009), “Why do shoppers abandon
shopping cart? Perceived waiting time, risk and transaction inconvenience”, Journal of
Product and Brand Management, Vol. 18 No. 3, pp. 188-197.
Ranganthan, C. and Ganapathy S. (2002), “Key dimensions of business-to-consumer
websites”, Information and Management, Vol. 39 No. 6, pp. 457-465.
Salo, J. and Karjaluoto, H.(2007) "A conceptual model of trust in the online environment",
Online Information Review, Vol. 31 No. 5, pp. 604 – 621.
Selvidge, P.R., Chaparro, B.S. and Bender, G.T. (2002), “The world-wide wait: effects of
delays on user performance”, International Journal of Industrial Ergonomics, Vol. 29,
pp. 15-20.
Singh, P., Anand, A., and Modi, A. E-tailing in India-pushing the retail frontier (August 2012)
retrieved from http://www.technopak.com/resources/retail/E-
tailing%20Report%202012.pdf pp 3-13. Singh, S.S., Dalal, N. and Spears, N. (2005), “Understanding web home page perception”,
European Journal of Information Systems, Vol. 14 No.3, pp. 288-302. Srinivasan, S.S., Anderson, R. and Ponnavolu, K. (2002), “Customer loyalty in e-commerce:
an exploration of its antecedents and consequences”, Journal of Retailing, Vol. 78 No.
1, pp. 41-50.
Swinyard, W.R. and Smith, S.M. (2003), “Why people don’t shop online: a lifestyle study of
Internet Consumer”, Psychology and Marketing, Vol. 20 No 7, pp. 567-597.

Global Business and Management Research: An International Journal
Vol. 7, No. 4 (2015)
32
Tan, J.J. (1999), “Strategies for reducing consumer’ risk aversion in Internet shopping”,
Journal of Consumer Marketing, Vol. 16 No. 2, pp. 163-180.
Teo, S.H.T. (2006), “To buy or not to buy online: adopters and non adopters of online shopping
in Singapore”, Behavioural and Information Technology, Vol. 25 No. 6, pp. 497-509.
To, M. L. and Ngai, E.W.T. (2006), “Predicting the organisational adoption of B2C e-
commerce: an empirical study”, Industrial Management and Data Systems, Vol. 106
No.8, pp.1133-1147.
Trocchia, P.J. and Janda, S. (2000),“A phenomenological investigation of internet usage
among older individuals”, Journal of Consumer Marketing, Vol. 17 No. 7, pp. 605-16.
Varshney, Rashi. India’s digital commerce market to grow 33% to $ 11.6 Bn in 2013, e-
commerce-market-to-grow-33-to-11-6b-in-2013-e- tailing to lead growth : IAMAI.
http://techcircle.vccircle.com/2013/05/06/indias-digital-tailing-to-lead-growth-iamai/
retrieved on 13-05-2013.
Wang, F. and Head, M. (2007), “How can web help build customer relationships? An empirical
study on e-tailing”, Information and Management, Vol. 44 No.2, pp.115-129.
Wu, Long-Ing. (2013), “The antecedents of customer satisfaction and its link to complaint
intentions in online shopping: an integration of justice, technology, and trust”,
International Journal of Information Management, Vol. 33 No. 1, pp. 166-176.
Global Business and Management Research: An International Journal
Vol. 7, No. 4 (2015)
33
Table I: Frequency Distribution for Users
Demographic Characteristics N=385 Response Valid
percentage
Gender
Male 211 54.08
Female 174 44.94
Age
18-30 251 65.2
31-45 90 23.4
Above 45 44 11.4
Education Qualification
Undergraduate 101 26.2
Graduate 92 23.4
Post graduate 192 49.9
Nature of consumer
Student 157 40.8
Self-employed 45 11.7
Service 192 49.9
Annual income
Less than 3.5 lakhs 164 42.6
3.5-6 lakhs 171 44.4
More than 6 lakhs 50 13.0
Number of hours spent on internet in a week
Less than 7 hours 112 29.1
8-16 hours 141 36.6
More than 16 hours 132 34.3
Number of years of online shopping Less than 1 year 150 39.0
1-3 years 180 46.8
More than 3 years 54 14.2
Number of products purchased online in a month Less than 2 75 19.5
2-5 160 41.6
More than 5 150 38.9
Table II: Gender-wise Analysis of Barriers to Online Retailing
Barriers to Online Retailing
Gender
Male Female Total
Mean Std.
Dev. Mean
Std.
Dev. Mean
Std.
Dev.
Inability to touch products 4.14 1.03 4.00 0.91 4.07 .98
Inability to try products before
purchase. 4.14 1.02 4.39 1.05 4.27 1.09
Fear of faulty products 3.77 1.17 3.94 1.01 3.85 1.10
Not assured about the size of the
product. 3.64 1.13 3.84 1.06 3.73 1.10

Global Business and Management Research: An International Journal
Vol. 7, No. 4 (2015)
34
Posting my personal details online
inhibits online shopping. 3.39 1.29 3.68 1.21 3.52 1.26
Inability to bargain 3.57 1.30 3.77 1.24 3.66 1.28
Slow internet speed 3.36 1.38 3.65 1.21 3.49 1.31
Tiresome browsing through internet 3.17 1.23 3.51 1.26 3.32 1.25
Lack of confidence in online retailing. 3.02 1.23 2.91 1.29 2.97 1.26
Difficulty in placing orders online 2.92 1.35 2.84 1.16 2.88 1.26
Fear of using debit card/credit card 3.49 1.34 3.31 1.28 3.41 1.31
Large variety of products available
online confuse me. 3.18 1.24 3.18 1.09 3.18 1.18
Difficulty in exchange of faulty
products. 3.63 1.07 3.70 1.01 3.66 1.04
Time consuming to make changes to
orders placed online. 3.62 0.95 3.84 1.01 3.73 0.98
Inapt query handling 3.71 0.93 3.94 0.98 3.82 0.96
Table III: Age-wise Analysis of Barriers to Online Retailing
Barriers to Online Retailing
18-30 years 31-45 Years Above 45
Years Total
Mean Std.
Dev. Mean
Std.
Dev. Mean
Std.
Dev. Mean
Std.
Dev.
Inability to touch products 4.09 1.03 4.05 0.87 4.04 0.93 4.07 0.98
Inability to try products before
purchase. 4.40 1.09 4.12 0.93 3.84 1.16 4.27 1.09
Fear of faulty products 3.80 1.05 4.01 1.09 3.79 1.35 3.05 1.10
Not assured about the size of the
product. 3.68 1.12 3.90 1.09 3.65 1.03 3.73 1.10
Posting my personal details online
inhibits online shopping. 3.35 1.25 4.02 1.14 3.47 1.33 3.52 1.26
Inability to bargain 3.63 1.32 3.85 1.17 3.45 1.26 3.66 1.28
Slow internet speed 3.45 1.29 3.62 1.34 3.43 1.40 3.49 1.31
Tiresome browsing through internet 3.28 1.24 3.42 1.34 3.38 1.20 3.32 1.25
Lack of confidence in online
retailing. 2.94 1.23 3.03 1.41 3.04 1.07 2.97 1.26
Difficulty in placing orders online 2.89 1.30 2.86 1.22 2.88 1.16 2.88 1.26
Fear of using debit card/credit card 3.35 1.32 3.61 1.32 3.31 1.21 3.41 1.31
Large variety of products available
online confuse me. 3.16 1.20 3.27 1.14 3.18 1.12 3.18 1.18
Difficulty in exchange of faulty
products. 3.70 1.06 3.80 0.97 3.15 0.96 3.66 1.04
Time consuming to make changes to
orders placed online. 3.78 0.99 3.70 0.99 3.43 0.89 3.72 0.98
Inapt query handling 3.91 0.91 3.68 1.06 3.52 0.91 3.81 0.96

Global Business and Management Research: An International Journal
Vol. 7, No. 4 (2015)
35
Table IV: Education Qualification and Barriers to online retailing
Barriers to Online Retailing
Undergraduate Graduate Post Graduate Total
Mean Std.
Dev.
Mean Std.
Dev.
Mean Std. Dev. Mean Std.
Dev.
Inability to touch products 3.83 1.15 4.06 1.00 4.21 0.85 4.07 0.98
Inability to try products before
purchase.
4.01 1.10 4.13 1.08 4.47 1.10 4.27 1.09
Fear of faulty products 3.88 1.05 3.67 1.11 3.92 1.12 3.85 1.10
Not assured about size of the
product
3.80 1.02 3.47 1.28 3.82 1.03 3.73 1.10
Posting my personal details
online inhibits online shopping.
3.33 1.24 3.53 1.28 3.64 1.26 3.52 1.26
Inability to bargain 3.79 1.25 3.53 1.21 3.66 1.32 3.66 1.28
Slow internet speed 3.56 1.29 3.46 1.32 3.46 1.32 3.49 1.31
Tiresome browsing through
internet
3.51 1.22 3.13 1.30 3.32 1.24 3.32 1.25
Lack of confidence in online
retailing.
3.14 1.23 2.86 1.21 2.93 1.29 2.97 1.26
Difficulty in placing orders
online
2.98 1.33 2.72 1.15 2.91 1.27 2.88 1.26
Fear of using debit card/credit
card
3.40 1.28 3.78 1.10 3.23 1.38 3.41 1.31
Large variety of products
available online confuse me.
2.82 1.21 3.65 0.98 3.16 1.18 3.18 1.18
Difficulty in exchange of faulty
products.
3.57 1.15 3.76 0.91 3.66 1.04 3.66 1.04
Time consuming to make
changes to orders placed
online.
3.85 0.96 3.79 0.88 3.61 1.04 3.72 0.98
Inapt query handling
3.95
0.87
3.88
0.89
3.72
1.02
3.81
0.96

Global Business and Management Research: An International Journal
Vol. 7, No. 4 (2015)
36
Table V: Correlation Matrix
Barriers to Online
retailing N=484
1
2
3
4
5
6
7
8
9
10
11
12
13
14
15
1
Pearson
Correlation 1 .537** .329** .272** .061 .127** .028 .073 .222** .115* .109* .121** .169** .032 .132**
Sig.(2 tailed) .000 .000 .000 .179 .005 .539 .107 .000 .011 .016 .007 .000 .485 .004
2
Pearson
Correlation .537** 1 .453** .265** .145** .160** .048 .112* .161** .109* .061 .066 .104* .014 .089
Sig.(2 tailed) .000 .000 .000 .001 .000 .290 .014 .000 .016 .183 .149 .023 .765 .049
3
Pearson
Correlation .329** .453** 1 .427** .251** .226** .107* .301** .266** .209** .173** .054 .103 .032 .070
Sig.(2 tailed) .000 .000 .000 .000 .000 .019 .000 .000 .000 .000 .237 .023 .489 .123
4
Pearson
Correlation .272** .265** .427** 1 .194** .356** .074 .209** .303** .295** .063 .070 .170** .006 .009
Sig.(2 tailed) .000 .000 .000 .000 .000 .105 .000 .000 .000 .165 .122 .000 .888 .848
5
Pearson
Correlation .061 .145** .251** .194** 1 .427** .130** .278** .107* .250** .155** -.005 .018 .125** .041
Sig.(2 tailed) .179 .001 .000 .000 .0000 .000 .000 .019 .000 .000 .907 .686 .006 .363
6
Pearson
Correlation .127** .160** .226** .350** .422** 1 .195** .306** .161** .196** .096* .025 .019 .145** -.029
Sig.(2 tailed) .005 .000 .000 .000 .000 .000 .000 .000 .000 .035 .589 .685 .001 .524
7
Pearson
Correlation .028 .048 .107* .074 .130** .195** 1 .335** .285** .156** .001 -.012 -.060 .171** -.017
Sig.(2 tailed) .539 .290 .019 .105 .004 .000 .000 .000 .000 .974 .790 .188 .000 .703
8
Pearson
Correlation .073 .112* .301** .209** .278** .306** .335** 1 .384** .349** .159** .155** .139** .095* .186**
Sig.(2 tailed) .107 .014 .000 .000 .000. .000 .000 .000 .000 .000 .000 .001 .002 .036 .000
9
Pearson
Correlation .222** .161** .266** .383** .107* .161** .285** .384** 1 .490** .203** .156** .090* -.031 .109*
Sig.(2 tailed) .000 .000 .000 .000 .019 .000 .000 .000 .000 .000 .000 .018 .492 .017
10
Pearson
Correlation .115* .109* .209** .295** .250** .196** .156** .349** .490** 1 .198** .297** .096* .113* .064
Sig.(2 tailed) .011 .016 .000 .000 .000 .000 .000 .000 .000 .000 .000 .034 .013 .161
11
Pearson
Correlation .109* .061 .173** .063 .155** .096* .001 .159** .203** .198** 1 .252** .313** .167** .173**
Sig.(2 tailed) .016 .183 .000 .165 .000 .035 .974 .000 .000 .000 .000 .000 .000 .000
12
Pearson
Correlation .121** .066 .054 .070 -.005 .025 -.012 .155** .156** .277** .252** 1 .301** .225** .244**
Sig.(2 tailed) .007 .149 .237 .122 .907 .589 .790 .000 .000 .000 .000 .000 .000 .000
13
Pearson
Correlation .169** .104* .103 .170 .018 .019 -.060 .139** .090* .096* .313** .301** 1 .317** .441**
Sig.(2 tailed) .000 .023 .023 .000 .685 .685 .188 .000 .048 .034 .000 .000 .000 .000
14
Pearson
Correlation .032 .014 -.032 .006 .125** .145**
-
.171** .095* -.031 .113 .167** .225** .317** 1 .404**
Sig.(2 tailed) .485 .765 .489 .888 .000 .000 .001 .036 .492 .013 .000 .000 .000 .000
15
Pearson
Correlation .132** .089* .070 .009 .041 .029 .017 .186** .109* .064 .173** .244** .441** .404** 1
Sig.(2 tailed) .004 .049 .123 .848 .363 .524 .703 .000 .017 .161 .000 .000 .000 .000

Global Business and Management Research: An International Journal
Vol. 7, No. 4 (2015)
37
** Correlation is significant at the 0.01 level (2-tailed) *Correlation is significant at the 0.05 level (2- tailed)
1-Inability to touch products 2-Inability to try products 3-Fear of faulty products 4-Not assured of size of the product 5-Posting personal details online inhibits online shopping 6- Inability to bargain 7-Slow internet speed 8- Tiresome browsing through internet 9-Lack of
confidence 10-Difficulty in placing orders online 11-Fear of debit card/credit card 12-Large variety of products available confuse me 13-
Difficulty in exchange of faulty products 14-Time consuming to make changes to orders placed online 15- Inapt query handling
Table VI: Factor Analysis of Barriers to Online Retailing
Barriers to online retailing
Query
handling
and return
procedures
Perceived risk
Technology
Ignorance
factor
Ignorance
of
consumer
i. Difficulty in exchange of
faulty products
ii. Inapt query handling
iii. Time consuming to make
changes to orders placed
online
iv. Large variety of products
available online confuses
me
.725
.714
.672
.592
Eigen value 2.238
% of Variation 14.918
i. Inability to try products
before purchase.
.825
ii. Inability to touch
products
.785
iii. Fear of faulty products
iv. Not assured of size of
product
v. Fear of using debit
card/credit card.
.673
.524
.491
Eigen value 2.175
% of Variation 14.500
i. Lack of confidence in
online retailing
ii. Difficulty in placing
orders online
iii. Slow internet speed
.762
.668
.614
iv. Tiresome browsing
through internet
.611
Eigen value 2.175

Global Business and Management Research: An International Journal
Vol. 7, No. 4 (2015)
38
Table VII: ANOVA results of users and non users
ANOVA
Barriers to Online Retailing Sum of
Squares df
Mean
Square F Sig.
Inability to touch products
Between Groups .412 1 .412 .435 .510
Within Groups 458.412 483 .949
Total 458.825 484
Inability to try products before
purchase
Between Groups .838 1 .838 .142 .706
Within Groups 2844.474 483 5.889
Total 2845.311 484
Fear of faulty products
Between Groups 3.351 1 3.351 2.903 .089
Within Groups 557.495 483 1.154
Total 560.845 484
Not assured about size of product
Between Groups 10.579 1 10.579 8.031 .005**
Within Groups 636.287 483 1.317
Total 646.866 484
Posting my personal details online
inhibits online shopping
Between Groups 5.070 1 5.070 3.368 .067
Within Groups 727.124 483 1.505
Total 732.194 484
Inability to bargain
Between Groups 16.617 1 16.617 9.740 .002**
Within Groups 824.034 483 1.706
Total 840.652 484
Slow internet speed
Between Groups 7.457 1 7.457 4.276 .039**
Within Groups 842.234 483 1.744
Total 849.691 484
Between Groups .260 1 .260 .166 .684
% of Variation 14.226
i. Posting my personal
details online inhibits
online shopping
.781
ii. Inability to bargain .773
Eigen value 1.661
% of Variation
Cumulative Variation
11.074
54.718
KMO and Bartlett’s Test
Kaiser-Meyer-Olkin Measure of Sampling Adequacy. 0.722
Bartlett's Test of Sphericity
Approx. Chi-Square 1580.138
df 105
Sig. 0.000
Global Business and Management Research: An International Journal
Vol. 7, No. 4 (2015)
39
Tiresome browsing through
internet
Within Groups 756.474 483 1.566
Total 756.734 484
Lack of confidence in online
retailing
Between Groups 6.375 1 6.375 3.764 .050*
Within Groups 818.030 483 1.694
Total 824.404 484
Difficulty in placing orders online
Between Groups 5.715 1 5.715 3.504 .062
Within Groups 787.757 483 1.631
Total 793.472 484
Fear of using debit card/credit
card
Between Groups 11.890 1 11.890 7.220 .007**
Within Groups 795.335 483 1.647
Total 807.225 484
Large variety of products
available online confuses me
Between Groups 10.266 1 10.266 6.725 .010**
Within Groups 737.268 483 1.526
Total 747.534 484
Difficulty in exchange of faulty
products
Between Groups 4.767 1 4.767 4.662 .031**
Within Groups 493.967 483 1.023
Total 498.734 484
Time consuming to make changes
to orders placed online
Between Groups 9.840 1 9.840 9.419 .002**
Within Groups 504.572 483 1.045
Total 514.412 484
Inapt query handling
Between Groups 3.502 1 3.502 3.798 .050*
Within Groups 443.479 481 .922
Total 446.981 482
Table VIII: Chi- Square test of users and non users of Online Retailing Barriers Users Non-Users Pearson
value df Sig.
1 2 3 4 5 1 2 3 4 5
Inability to touch
products
12
2.5%
19
3.9%
44
9.1%
162
33.5%
148
30.6%
2
.4%
2
.4%
18
3.7%
35
7.2%
42
8.7% 5.866 4 .209
Inability to try
products
11
2.3%
18
3.7%
45
9.3%
140
28.9%
171
35.3%
2
.4%
4
.8%
12
2.5%
39
8.1%
42
8.7% .554 4 .968
Fear of faulty
products
14 2.9%
33 6.8%
83 17.1%
120 24.8%
135 27,9%
3 .6%
6 1.2%
2 .4%
52 10.7%
32 34.5%
21.263 4 .000**
Not assured of size 15
3.1%
45
9.3%
75
15.5%
142
81.6%
108
22.3%
13
2.7%
11
2.3%
23
4.8%
32
6.6%
21
4.1% 14.470 4 .006**
Posting personal
details online
41 8.5%
39 8.1%
80 16.5%
126 26%
99 78.6%
2 .4%
13 2.7%
16 3.3%
41 8.5%
27 21.4%
9.903 4 .042*
Inability to bargain 38
7.9%
35
7.2%
69
14.3%
118
24.4%
125
25.8%
20
4.1%
10
2.15
16
3.3%
36
7.4%
17
3.5% 14.328 4 .006**
Slow internet speed 45
9.3%
43
8.9%
81
16.7%
109
22.5%
107
22.1%
9
1.9%
10
2.1%
15
3.1%
22
4.5%
43
8.9% 9.231 4 .050*
Tiresome browsing
through internet
42
8.7%
58
12%
95
19.6%
112
23.1%
78
16.1%
11
2.3%
14
2.9%
29
6.0%
28
5.8%
17
3.5% 1.104 4 .894
Lack of confidence 58
12% 88
18.2% 92
19.0% 99
9.9% 48
9.9% 23
4.8% 8
1.7% 6
1.2% 45
31.3% 17
3.5% 35.792 4 .000**
Difficulty in placing
orders online
70
14.5%
86
17.8%
82
16.9%
111
22.9%
36
7.4%
27
5.6%
23
4.8%
19
3.9%
22
4.5%
8
1.7 4.834 4 .305
Fear of debit/credit
card
51 10.5%
42 8.7%
80 16.5%
121 25.0%
91 18.8%
6 1.2%
7 1.4%
20 4.1%
34 7.0%
32 6.6%
7.159 4 .128
Large variety of
products confuse me
40
8.3%
64
13.2%
118
24.4%
109
22.5%
54
11.2%
24
5.0%
24
5.0%
12
2.5%
24
5.0%
15
3.1% 24.552 4 .000**

Global Business and Management Research: An International Journal
Vol. 7, No. 4 (2015)
40
Difficulty in
exchange
8
1.7%
53
11.0%
89
18.4%
145
30%
90
18.6%
1
.2%
7
1.4%
15
3.1%
53
11.0%
23
4.8% 10.507 4 .033*
Time consuming to
change orders
7 1.4%
44 9.1%
82 16.9%
168 34.7%
84 17.4%
10 2.1%
12 2.5%
20 4.1
46 9.5%
11 2.3%
20.021 4 .000**
Inapt query handling 2
.4%
39
8.1%
88
18.2%
152
31.4%
104
21.5%
1
.2%
9
1.9%
11
2.3%
43
8.9%
35
7.2% 7.916 4 .095
** Significance at the 0.01 level (2-tailed)
*Significance at the 0.05 level (2- tailed)
Table IX: Barriers to Online Retailing
Barriers to Online Retailing of Users and Non-Users
Users of online
shopping
Mean(SD)
Non Users of
online
shopping
Mean(SD)
Inability to touch products 4.08(0.99) 4.14(0.93)
Inability to try products before purchase. 4.27(2.69) 4.16(0.93)
Fear of faulty products 3.85(1.10) 4.05(0.95)
Not assured of size of product 3.73(1.11) 3.35(1.29)
Posting my personal details online inhibits online
shopping 3.52(1.27) 3.78(1.05)
Inability to bargain 3.66(1.29) 3.20(1,39)
Slow internet speed 3.49(1.32) 3.80(1.34)
Tiresome browsing through internet 3.32(1.26) 3.26(1.23)
Lack of confidence in online retailing 2.97(1.26) 3.25(1.45)
Difficulty in placing orders online 2.87(1.26) 2.60(1.32)
Fear of using debit card/credit card 3.41(1.32) 3.79(1.15)
Large variety of products available online confuse me 3.18(1.18) 2.81(1.43)
Difficulty in exchange of faulty products 3.66(1.04) 3.90(0.87)
Time consuming to make changes to orders placed online 3.72(0.99) 3.36(1.15)
Inapt query handling 3.81(0.96) 4.03(0.96)

Global Business and Management Research: An International Journal
Vol. 7, No. 4 (2015)
41
Figure 1: Mean score of users and non-users of Barriers to Online Retailing
To cite this article:
Tandon, U, Kiran, R., & Sah, A.N. (2015). Analyzing Deterrents to Online Retailing: A
Study of Users and Non Users in India. Global Business and Management Research:
An International Journal, 7(4), 21-41.