analyzing data, graphing and drawing...
TRANSCRIPT

Work Hard, Get Smart. Scientific Method Packet 3
1
Name: ____________________________________________ Date: _________________ Ms. Scherben/Science Bronx Preparatory Charter School/ _________________
Analyzing Data, Graphing and Drawing Conclusions
Date Assignment Grade Tables and Trends
________/14
Making Tables
________/20
Assessment Practice (Making Tables)
________ /6
Graphing 101 Tables to Graphs
________ /17
Graphing Line or Bar
________ /24
Don’t Be a Fool Stay in School ________ /20
Packet must be in complete sentences, unless specified.

Work Hard, Get Smart. Scientific Method Packet 3
2
Tables and Trends Aim:____________________________________________________________________________________________________
Brain Starter: What are some current trends that you know about?
In science trends are useful because they help us make ____________________________________________________________________________________________ When describing trends good words to use are: ___________________________________________________ or _____________________________________________________
Practice Ex. 1: What TREND does this data show? Every time the weight of the bench press
_____________________ the number of reps
______________________.
Can we make this trend more specific?
Every time the weight of the bench press
_____________________ by ______________, the number of reps
_____________________by________________.
Weight Bench Pressed (kg)
Number of Reps
100 32 115 24 130 16 145 8

Work Hard, Get Smart. Scientific Method Packet 3
3
Ex. 2 What TREND does this data show?
Can we be more specific? Why or why not?
Ex. 2: What TREND does this data show?
Ex. 4: What TREND does this data show? (Be Specific)
Mass of Object (kg)
Time it takes to fall in a vacuum (seconds)
2 4.9 42 4.9 82 4.9 122 4.9
Minutes on a Hot Plate
Temperature °C
0 25 5 30 10 35 15 40

Work Hard, Get Smart. Scientific Method Packet 3
4
Ex. 5 Protein and fiber are parts of a healthy diet. Using that information, which of the types of flour is the HEALTHIEST? _________________________________________________________________ Ex. 6 What CONCLUSION can you make based on the information above? _________________________________________________________________

Work Hard, Get Smart. Scientific Method Packet 3
5
Making Predictions from Data
Ex.1: Find out how much the table changes each time.
Amount of water (liters)
Tree Growth (meters)
2 5 4 10 6 15 8 20
What is the trend? _________________________________________________________________
_________________________________________________________________
Ex.2: Complete the table after finding out how much the table changes each time.
Time Burned (hours)
Height of Candle (centimeters)
1 50 3 30 7 20
What is the trend? _________________________________________________________________
_________________________________________________________________
Changes by ________each time
Changes by _________
each time
Changes by ________each time
Changes by _________
each time

Work Hard, Get Smart. Scientific Method Packet 3
6
Ex.2: Complete the table after finding out how much the table changes each time.
Number of Classes Skipped
Average Grade
0 100 90 2 3
What is the trend? _________________________________________________________________
_________________________________________________________________
Ex.4: Complete the table after finding out how much the table changes each time.
Voltage (Volts) Current (Amps) 2 20 4 40 6 60 8 80
What is the trend? _________________________________________________________________
_________________________________________________________________
What would the current be if the voltage was 10? __________________
Changes by ________each time
Changes by _________
each time
Changes by ________each time
Changes by _________
each time
Work Hard, Get Smart. Scientific Method Packet 3
7
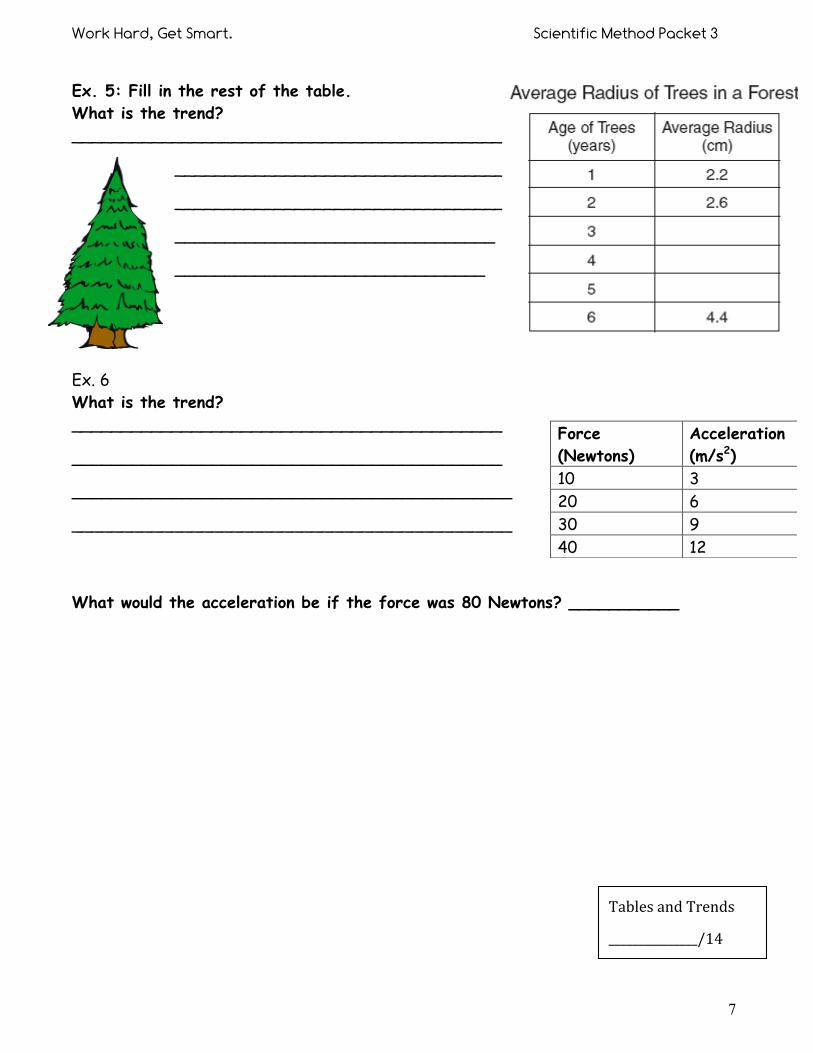
Ex. 5: Fill in the rest of the table. What is the trend? _________________________________________________________
________________________________________________________
________________________________________________________
________________________________
_______________________________
Ex. 6 What is the trend? ___________________________________________
___________________________________________
____________________________________________
____________________________________________
What would the acceleration be if the force was 80 Newtons? ___________
Force (Newtons)
Acceleration (m/s2)
10 3 20 6 30 9 40 12
Tables and Trends
_______________/14
______________/17

Work Hard, Get Smart. Scientific Method Packet 3
8
Making Tables Aim:_____________________________________________________________________________________________________
Brain Starter: Check out this table of hypothetical computers (DigiTek, Compex, and Cyberdyne). Answer the following questions about the table above.
1. Which computer has the cheapest extra gigabyte of Random Access Memory (RAM)?
2. If you wanted to buy a computer
without extra RAM or hard drive space, which computer is the best to buy?
3. Which computer is the most expensive if you buy it with all the extra options?
4. Which computer is the best deal if you really need extra RAM but not extra drive space?
5. How much would it cost to buy a Compex computer with an extra 70GB of hard drive space (but no extra RAM)?
Practice Makes Perfect
Ex. 1. Rashawn wants to test if a weight of a basketball affected how far he could throw it. a. Identify the independent variable:_________________________________________________
b. Identify the dependent variable: ___________________________________________________
c. What are three things that Rashawn would have to keep constant?
Work Hard, Get Smart. Scientific Method Packet 3
9
1) ____________________________________________________________________________________
2) ____________________________________________________________________________________
3) ____________________________________________________________________________________
d. What is your hypothesis?
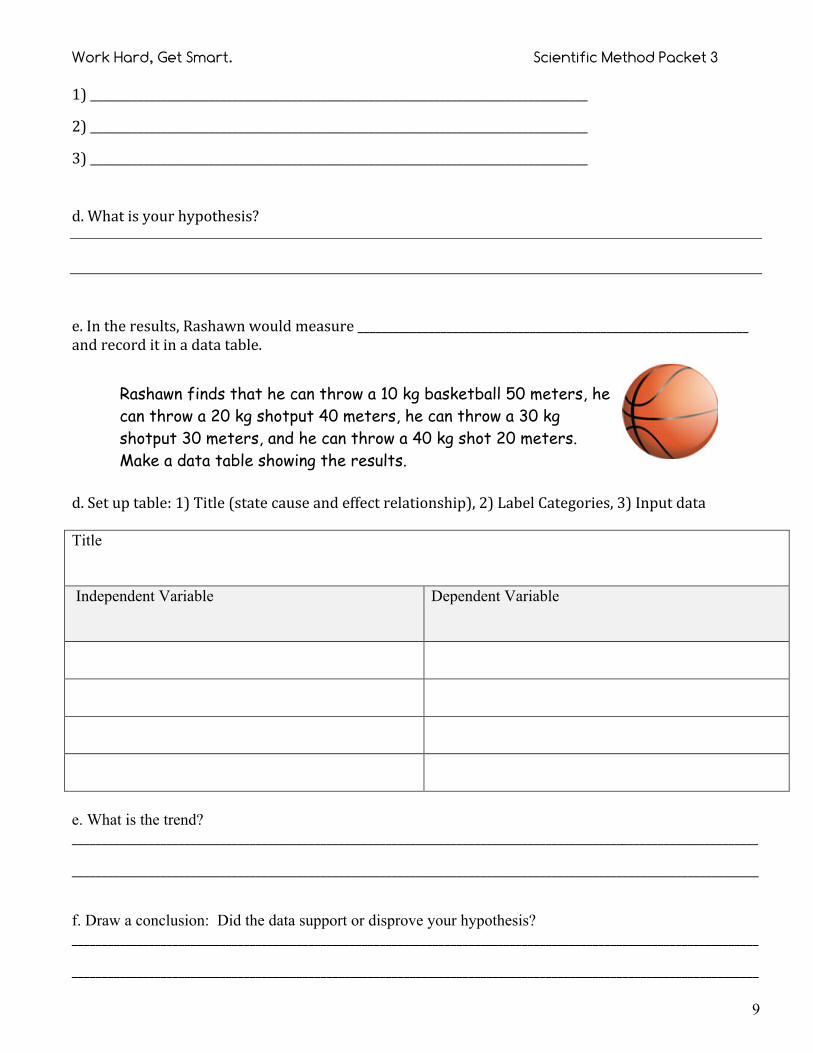
e. In the results, Rashawn would measure __________________________________________________________________ and record it in a data table.
Rashawn finds that he can throw a 10 kg basketball 50 meters, he can throw a 20 kg shotput 40 meters, he can throw a 30 kg shotput 30 meters, and he can throw a 40 kg shot 20 meters. Make a data table showing the results.
d. Set up table: 1) Title (state cause and effect relationship), 2) Label Categories, 3) Input data Title Independent Variable
Dependent Variable
e. What is the trend? ____________________________________________________________________________________________________________________
____________________________________________________________________________________________________________________
f. Draw a conclusion: Did the data support or disprove your hypothesis? ____________________________________________________________________________________________________________________
____________________________________________________________________________________________________________________

Work Hard, Get Smart. Scientific Method Packet 3
10
Ex. 2: Jennifer was conducting the experiment testing the question: “What is the effect of different colors of light on plant height?” In her experiment she was going to test red, yellow, green and blue light for six days. She measured the plants after each day.
a. Identify the independent variable: ___________________________________________________
b. Identify the dependent variable: ____________________________________________________
c. What are three things that Jennifer would have to keep constant?
1) ____________________________________________________________________________________
2) ____________________________________________________________________________________
3) ____________________________________________________________________________________
d. What is your hypothesis?
e. In the results, Jennifer would measure __________________________________________________________________ and record it in a data table.
d. Set up table: 1) Title (state cause and effect relationship), 2) Label Categories, 3) Input data Title

Work Hard, Get Smart. Scientific Method Packet 3
11
Practice putting your observations into the data table above.
Day 1: Red 2cm, Yellow 2cm, Green 2cm, Blue 2cm Day 2: Red 2cm, Yellow 2cm, Green 3cm, Blue 3cm Day 3: Red 3cm, Yellow 2cm, Green 4cm, Blue 3cm Day 4: Red 3cm, Yellow 2.5cm, Green 4.5cm, Blue 3.5cm Day 5: Red 3.5cm, Yellow 3cm, Green 5cm, Blue 3.5cm Day 6: Red 3.5cm, Yellow 3.5cm, Green 5.5cm, Blue 4cm e. Were there any trends? (Hint you can compare different plants but they have to be on the same day) ____________________________________________________________________________________________________________________
____________________________________________________________________________________________________________________
f. Draw a conclusion: Did the data support or disprove your hypothesis? ____________________________________________________________________________________________________________________
____________________________________________________________________________________________________________________
Making Tables
_______________/20
______________/17

Work Hard, Get Smart. Scientific Method Packet 3
12
Assessment Practice. Directions: Read the following passage and use the information given to answer the questions. 22. Amanda made this entry in her laboratory notebook: “We are doing an experiment to determine if the size of soil particles affects the amount of water that flows through soil. We poured 100 milliliters (mL) of water through four different types of soil. The equipment is shown below.
We got the following results: With gray soil, the average particle size was 2.0 millimeters (mm) and 80 mL of water flowed through. We then used tan soil. Its average particle size was 0.5 mm and 40 mL of water flowed through. With brown soil, 60 mL of water flowed through. Brown soil has an average particle size of 1.5 mm. In our last trial we used black soil. It has an average particle size of 1.0 mm and 50 mL of water flowed through.” a Using the data table below, organize the results to show the average particle size and the amount of water that flowed through for each type of soil. Be sure to include column headings, data, and units in the table. [6 points]
b What is the dependent variable in this experiment? [2 points] _______________________________________. c What conclusion can be drawn from the data that the students collected? [4 points]
Assessment Practice
_______________/6

Work Hard, Get Smart. Scientific Method Packet 3
13
Graphing 101 Aim:___________________________________________________________________________________________________
Brain Starter:
Ex7: What is the trend? _______________________________________
_______________________________________
_______________________________________
______________________________________
How much dissolved oxygen would there be if the temperature was 45°C? _______________
Types of Graphs
Temperature (°C)
Amount of Dissolved Oxygen (mg/L)
10 1000 15 950 20 900 25 850

Work Hard, Get Smart. Scientific Method Packet 3
14
This year in science we are going to focus on two types of graphs. They are ______________________________ and _____________________________________graphs.
Graphs
Scientists use graphs because ….
Bar graphs are used when the independent variable is
_________________________ and the dependent variable is
______________________________.
Line graphs are used when the independent variable
is _________________________ and the
dependent variable is
______________________________.

Work Hard, Get Smart. Scientific Method Packet 3
15
Parts of a Graph
Check l ist for Graphs
Graph Element
Criteria √
Title Communicates experiments purpose; identifies variables being investigated.
x-axis correctly labeled with the name/unit of independent variable
Label axes
y-axis correctly labeled with the name/unit of dependent variable
x-axis correctly divided into a scale for a line graph or into categories for a bar graph
Determine scales for axes
y-axis correctly subdivided into a scale Plot data points Data pairs correctly plotted.
Analyze trends Trend is described accurately.
Graphing 101 ______________/5

Work Hard, Get Smart. Scientific Method Packet 3
16
Tables to Graphs
Length of Pieces of Rope
If it takes twenty-one inches of rope to go all the way around the fence post, how many times will the orange rope go around the post? Which piece of rope is 15 yards long? Which piece or pieces of rope are more than 12 feet long but less than 22 feet long?
The Weekly Growth of a Plant.
At the end of which week(s) was the plant taller than 2 centimeters? At the end of which week(s) was the plant no more than 8 centimeters tall?
Color Rope Length (in feet) green 15 red 19 orange 13 yellow 21
End of Week Height (cm) #1 2 #2 8 #3 10 #4 12 #5 14

Work Hard, Get Smart. Scientific Method Packet 3
17
How tall was the plant at the end of week #5? Number of Books Owned
Which of the children own at least 68 books? Michael received three books on his birthday. On the same day, Michael gave Nicole four books. How
many books does Michael have? If Emma gave ten books to Daniel, how many books would Daniel have?
Monthly Rain Fall in Muddytown
Between which two months did the monthly rainfall total increase by 1 inch?
Which month had the lowest monthly rainfall?
Which month had the most monthly rainfall?
Number of Books Owned Name Number
David 60 Eric 100 Nicole 68 Daniel 52 Michael 44 Destiny 96 Emma 88
Monthly Rain Fall in Muddytown
Month Rain (inches) Jan 6 Feb 7 Mar 16 Apr 22 May 24 Jun 18 Jul 10 Aug 9 Sep 7 Oct 6 Nov 5 Dec 9

Work Hard, Get Smart. Scientific Method Packet 3
18
Challenge A group of students were trying to figure out if the temperature of the water affected the speed of a crawfish. They set up 8 tanks of water and kept them at different temperatures. They then placed crawfish in each tank and made them swim and measured their speed. Using the data at the left, construct a graph that shows the relationship between water temperature and crawfish speed. Don’t forget to:
1) Create a title 2) Label your axes 3) Make an appropriate scale 4) Mark an X at each data point and connect them with a line
Water Temp (oC)
Crawfish Speed (m/s)
15 1.0
20 1.7
25 2.0
30 2.5
35 2.5
40 1.9
45 1.5
50 1.2
Tables to Graphs
______________/17
Work Hard, Get Smart. Scientific Method Packet 3
19
Graphing: Line or Bar? Aim:_____________________________________________________________________________________
Brain Starter:
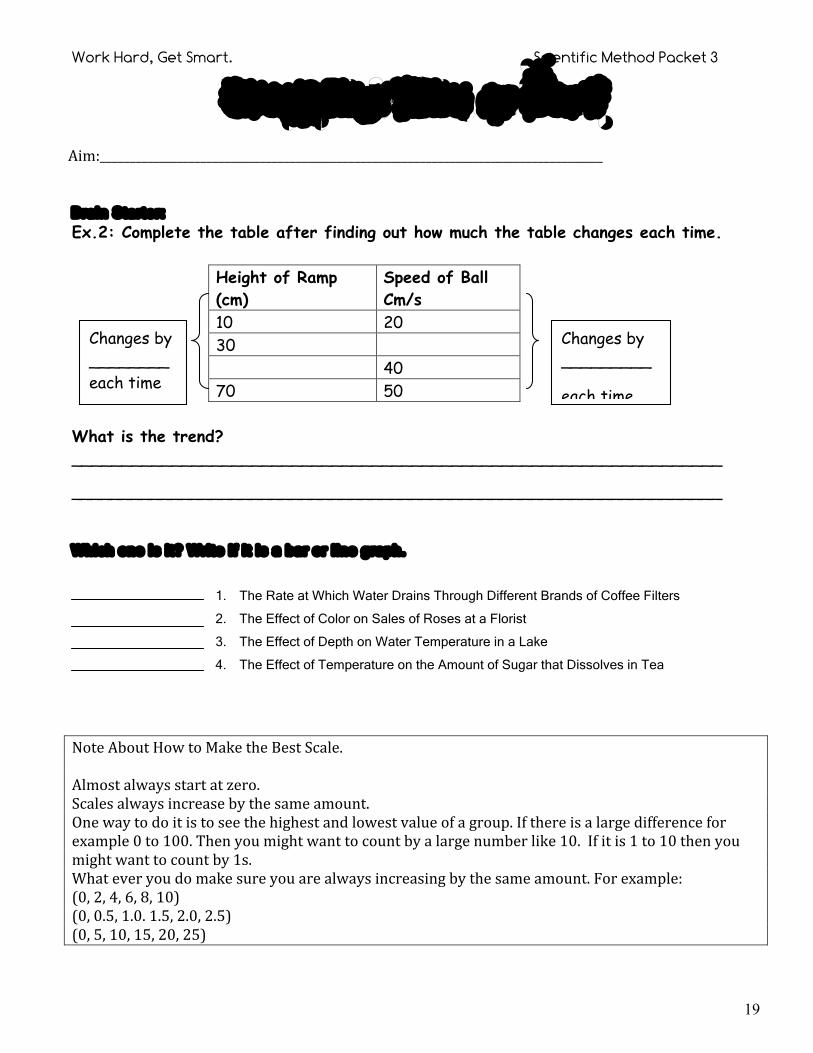
Ex.2: Complete the table after finding out how much the table changes each time.
Height of Ramp (cm)
Speed of Ball Cm/s
10 20 30 40 70 50
What is the trend? _________________________________________________________________
_________________________________________________________________
Which one is i t? Write if i t is a bar or l ine graph.
1. The Rate at Which Water Drains Through Different Brands of Coffee Filters
2. The Effect of Color on Sales of Roses at a Florist
3. The Effect of Depth on Water Temperature in a Lake
4. The Effect of Temperature on the Amount of Sugar that Dissolves in Tea
Note About How to Make the Best Scale. Almost always start at zero. Scales always increase by the same amount. One way to do it is to see the highest and lowest value of a group. If there is a large difference for example 0 to 100. Then you might want to count by a large number like 10. If it is 1 to 10 then you might want to count by 1s. What ever you do make sure you are always increasing by the same amount. For example: (0, 2, 4, 6, 8, 10) (0, 0.5, 1.0. 1.5, 2.0, 2.5) (0, 5, 10, 15, 20, 25)
Changes by ________each time
Changes by _________
each time

Work Hard, Get Smart. Scientific Method Packet 3
20
Graph the following charts as either a line or bar graph. Make sure to check off all of the steps.
Gasoline Mileage of Different Compact Cars Compact Car Manufacturer
Miles to the Gallon
Ford 40 Porsche 25 Toyota 20 BMW 30
If you were looking to buy a car that was good on gas, what would be your top two choices and why? Use the data to explain your answer. ____________________________________________________________________________________ ____________________________________________________________________________________
Graph Element Criteria √ Title Clearly identifies what was being measured
x-axis correctly labeled with the name/unit of independent variable Draw and label axes y-axis correctly labeled with the name/unit of dependent variable
x-axis correctly subdivided—into a scale for a line graph, into categories for a bar graph
Determine scales for axes
y-axis correctly subdivided into a scale Data points correctly written. Plot data points Data pairs correctly plotted.
Analyze Trends Trend or Data was analyzed accurately and clearly.

Work Hard, Get Smart. Scientific Method Packet 3
21
The Effects of Temperature on the Germination of a Radish Seeds
Temperature ( C) Average Germination Rate (%) 0 0 5 5
10 15 20 30 30 45
Describe the trend. ____________________________________________________________________________________ ____________________________________________________________________________________
Graph Element Criteria √ Title Clearly identifies what was being measured
x-axis correctly labeled with the name/unit of independent variable Draw and label axes y-axis correctly labeled with the name/unit of dependent variable
x-axis correctly subdivided—into a scale for a line graph, into categories for a bar graph
Determine scales for axes
y-axis correctly subdivided into a scale Data points correctly written. Plot data points Data pairs correctly plotted.
Analyze Trends Trend or Data was analyzed accurately and clearly.
Line or Bar
__________/24
______________/17

Work Hard, Get Smart. Scientific Method Packet 3
22
Name Date:
Science Bronx Prep/ _____________________
Dont Be a Fool , Stay In School. Statistical Evidence that Grades Pay.
Create a graph from the following charts. Determine which one is a line and bar graph. Use the check list to make sure your graphs are complete and correct.
Chart 1. Chart 2.
Graph Check List Graph Element Criteria Graph 1 Graph 2 Title Communicates experiments purpose; identifies variables being
investigated.
x-axis correctly labeled with the name/unit of independent variable
Draw and label axes
y-axis correctly labeled with the name/unit of dependent variable
x-axis correctly subdivided—into a scale for a line graph, into categories for a bar graph
Determine scales for axes
y-axis correctly subdivided into a scale Data points correctly written. Plot data points Data pairs correctly plotted.
Analyze Trends Described the trend accurately using the terms increase or decrease.
Level of Education Yearly Income High School Dropout $20,000 High School Graduate $26,000 Some College $32,000 College Graduate $44,000 Graduate degree $57,000
Years in school Yearly Income 11 or less $20,000 12 $26,000 13 $28,000 14 $30,000 15 $32,000 16 $44,000 17 $46,000 18 $57,000

Work Hard, Get Smart. Scientific Method Packet 3
23
Describe the trend. _________________________________________________________________ _________________________________________________________________

Work Hard, Get Smart. Scientific Method Packet 3
24
Describe the trend. _________________________________________________________________ _________________________________________________________________
Don’t Be a Fool
__________/20
______________/17

Work Hard, Get Smart. Scientific Method Packet 3
25
Prepare for a quiz and test soon. Question Box