analyzing current requirements and technologies in air
TRANSCRIPT

FEBRUARY 2009emAir & Waste Management Association
THE MAGAZINE FOR ENVIRONMENTAL MANAGERS
Analyzing Current Requirements and Technologies in Air Quality Monitoring
INSIDE: Greenhouse Gas Regulation under the Clean Air Act, p. 30

A&WMA'S 102ND
ANNUALCONFERENCE& EXHIBITION
JUNE 16-19, 2009DETROIT, MICHIGAN
CONFERENCE SPONSOR
Mark your calendar nowand stay tuned for additional details!
Visit www.awma.org/ACE2009for more information.
In these uncertain economic times, furthering your professional
education, presenting and publishing your work, and networking with colleagues in the
field have never been more critical.
Join us in Detroit for the Air & Waste Management Association’s 102nd Annual
Conference & Exhibition (ACE) and discover the latest in environmental innovation, re-
establish your professional relationships, and stay ahead of the game–all while having
some fun at ACE 2009!
One of the most exciting parts of every Annual Conference & Exhibition is the
bustling exhibit hall, filled with hundreds of exhibitors displaying the newest products
and services. From instrumentation and testing services to control equipment and
leading industry publications, our exhibitors have the environmental industry covered.
Interested in exhibiting? Visit www.awma.org/exhibitors to find out more about this
year’s Exhibition.
2 em february 2009 awma.orgCopyright 2009 Air & Waste Management Association
FeaturesCurrent Issues in Air Quality MonitoringNew technology and new requirements are changing U.S. air quality monitoring. In this month’s EM, two feature articles discuss measurement of fine particles, a third covers the current status of coarse particle monitoring, and a fourth article introduces the work underway to meet the U.S. Environmental ProtectionAgency’s (EPA) multipollutant monitoring requirements. Page 5
Finally, a Continuous FEM for PM2.5by David Gobeli, Michael Meyer, Herbert Schloesser, and Thomas Pottberg, Met One Instruments Inc.Page 6
Is it Time to Upgrade the PM2.5 Federal Reference Method?by Dirk Felton, New York State Department of Environmental ConservationPage 10
PM10-2.5 Monitoring in Support of EPA’s PM NAAQSby Joann Rice and Beth Hassett-Sipple, U.S. Environmental Protection AgencyPage 16
Planning for NCore Monitoringby Jim McGaughey, Joette Steger, Mark Yirka, and Carlton Blakley, North Carolina Division of Air QualityPage 24
COLUMNSInside the Industry—How to Recession-Proof Your Business . . . . . . . . . . . 34by Anthony Buonicore and Dianne Crocker
IT Insight—Balancing Business Needs and Information Security . . . . . . . . . . . . . . . . . . . . . . 36by Jill Gilbert
ASSOCIATION NEWSAnnual Conference Preview. . . . . . . . . . . . . . . . . . . . 38Students and Young Professionals: ACE Is the Place to be in June!Conference Highlights: Better Air Quality for Asian Cities 2008. . . . . . . . . . . . . . . . . . . . . . . . . . . . . 40by Miriam Lev-On and David Calkins
Regulating Green-house Gases Underthe Clean Air Act:An Industry Perspectiveby John Kinsman and Bill Fang, Edison ElectricInstitute
A complicated web of litigation, regulation, andlegislation is moving forward that could lead to the regulation ofgreenhouse gas (GHG)emissions under theClean Air Act. Key deci-sions regarding GHGcontrol could be made in2009 by the new admin-istration, the U.S. Con-gress, the courts, andstates. This article takes a look at the hotly con-tested issue from the perspective of the powergeneration industry. Page 30
Cover photos:Top photo: Howard University atBeltsville, MD, MDE NCORE station,Thermo PM 2.5 sequential sampler.Field Tech: Chris Smith, Maryland Department of the Environment. Photographer: Dave PreeceMiddle left photo: a Tekran mercuryanalyzer and controller. Bottom photo: Tekran mercury monitor.Middle left photo: Tekran 2537B mer-cury analyzer and methane and totalhydrocarbon analyzer. Photographer:Dirk FeltonMiddle right and bottom photos: Tekran1130 and 1135 reactive gas and partic-ulate mercury collector, PM-2.5 FRM,and a wet deposition mercury collector.Photographer: Dirk Felton
EM, a publication of the Air & Waste Management Association (ISSN 1088-9981), is published monthly with editorial and executive offices at One Gateway Center, 3rd Floor, 420 Fort Duquesne Blvd., Pittsburgh, PA 15222-1435. ©2009 Air & Waste Management Association. All rights reserved. Materials may not be reproduced, redistributed, or translated in any form without prior written permission of the Editor. Periodicals postage paid at Pittsburgh and at an additional mailing office. Postmaster: Send address changes to EM, Air & Waste Management Association, OneGateway Center, 3rd Floor, 420 Fort Duquesne Blvd., Pittsburgh, PA 15222-1435. GST registration number: 135238921. Subscription rates are $265/year for nonprofit libraries and nonprofit institutions and $405/year for all other institutions. Additional postage charges may apply. Pleasecontact A&WMA Member Services for current rates (1-800-270-3444). Send change of address with recent address label (6 weeks advance notice) and claims for missing issues to the Membership Department. Claims for missing issues can be honored only up to three months for domes-tic addresses, six months for foreign addresses. Duplicate copies will not be sent to replace ones undelivered through failure of the member/subscriber to notify A&WMA of change of address. A&WMA assumes no responsibility for statements and opinions advanced by contributors to thispublication. Views expressed in editorials are those of the author and do not necessarily represent an official position of the Association.
In Memoriam . . . . . . . . . . . . . . . . . . . . . . . . . . . . . . . . 43Doug Wolf
The Member Minute. . . . . . . . . . . . . . . . . . . . . . . . . . 52Mike Durham
DEPARTMENTSMessage from the President . . . . . . . . . . . . . . . . . . . . . . . . . 3Letters . . . . . . . . . . . . . . . . . . . . . . . . . . . . . . . . . . . . . . . . . . 4EPA Research Highlights. . . . . . . . . . . . . . . . . . . . . . . . . . . 42Washington Report . . . . . . . . . . . . . . . . . . . . . . . . . . . . . . . 44News Focus . . . . . . . . . . . . . . . . . . . . . . . . . . . . . . . . . . . . . 45IPEP Quarterly. . . . . . . . . . . . . . . . . . . . . . . . . . . . . . . . . . . 48Advertisers’ Index . . . . . . . . . . . . . . . . . . . . . . . . . . . . . . . . 48Professional Development Programs . . . . . . . . . . . . . . . . . 49JA&WMA Table of Contents . . . . . . . . . . . . . . . . . . . . . . . 49Calendar of Events . . . . . . . . . . . . . . . . . . . . . . . . . . . . . . . 51
NEXT MONTH:
Can the environmental industry survive the global economic downturn?
Printed on Recycled Paper
emAir & Waste Management Association
THE MAGAZINE FOR ENVIRONMENTAL MANAGERS

awma.org february 2009 em 3Copyright 2009 Air & Waste Management Association february 2009 em 3
I’ll admit a bias right up front: I’m an analytical chemist.Hence, I tend to get a bit excited about instrumentalanalysis generally and air monitoring in particular!
The theme of this month’s EM is air monitoring technology.What could be more appropriate, as we see the U.S. Environmental Protection Agency (EPA) faced with amassive undertaking in determining how to monitor andmeasure greenhouse gas emissions? Add to that theagency’s call in recent months for increased monitoringof air quality near schools and the expectation that theObama administration will be pretty focused on the science of things. Monitoring is often the starting pointfor just about everything we do…at least when it comesto figuring out solutions. And that is what our Associationis all about.
Even in these bleak economic times, I hope for a renais-sance in monitoring and measuring. There needs to bea morsel left for monitoring and measurement investmentin spite of the seemingly endless bailout line in Washington.Fine particulate matter (PM2.5) emission measuring iswoefully short of funds. I vividly recall “grilling” StevePage, the boss of EPA’s Office of Air Quality Planningand Standards, at an Environmental Council of the Statesmeeting in 2007 about when EPA was going to developadequate emission factors for PM2.5—data desperatelyneeded by states and businesses for implementationplans and permitting. He responded like a good soldier,but I knew the agency was fighting some difficult budgetissues even then. The agency needs to find the means toinvest now in monitoring and measuring across theboard. That investment could then be leveraged with resources from states and the private sector.
ADVERTISINGMalissa [email protected]
EDITORIAL Andy Knopes, CAEEditorLisa BucherManaging Editor
EDITORIAL ADVISORY COMMITTEEA. Gwen Eklund, ChairTRCAnn McIver, QEP, Vice ChairCitizens Energy GroupFerdinand B. AlidoNavistar Inc.John D. BachmannVision Air ConsultingJane C. BartonPatterson ConsultantsPrakash Doraiswamy, Ph.D.State University of New York at AlbanyJennifer B. Dunn, Ph.D.URS Corp.Steven P. Frysinger, Ph.D.James Madison UniversityJohn D. KinsmanEdison Electric InstituteAshok KumarUniversity of ToledoMiriam Lev-On, Ph.D.The LEVON GroupJulian A Levy, Jr.Exponent Inc.Mingming LuUniversity of CincinnatiCharles E. McDadeUniversity of California at DavisPaul J. MillerNortheast States for Coordinated Air
Use ManagementDan L. Mueller, P.E.CDM Inc.Chris Pepper Jackson WalkerS.T. RaoU.S. Environmental Protection AgencyDaniel R. WeissDuke Energy IndianaSusan S.G. WiermanMid-Atlantic Regional Air
Management Association
PUBLICATIONS COMMITTEEJudith C. Chow, ChairDesert Research Institute
A&WMA HEADQUARTERSAdrianne Carolla, CAEExecutive Director
Air & Waste Management AssociationOne Gateway Center, 3rd Floor420 Fort Duquesne Blvd.Pittsburgh, PA 15222-14351-412-232-3444; 412-232-3450 (fax)[email protected]
Monitoring and Measuring—Where Our Profession Beginsby Rick [email protected]
Industry has seen the writing on the wall for some time,in regard to carbon regulation. In the United States,Canada, and Mexico, states, provinces, and tribes haveadvanced carbon emission protocols ahead of federal action through efforts like The Climate Registry. And California Senator Barbara Boxer’s requirement for EPAto require greenhouse gas reporting by June 2009 hasdefinitely created some badly needed certainty. But reporting without a better monitoring and measuring infrastructure could lead us in the wrong directions.
A&WMA’s members have been at the forefront in thisfield for decades, and we will use that strength to workwith government (at all levels), industry, consultants, andthe public to advance technical solutions. We must alsocollaborate on reporting protocols that are credible, yetstraight forward. Emission monitoring and high-qualityestimation techniques are the key to providing a credible“carbon currency.”
A&WMA has conferences in March and August relatedto greenhouse gas emissions and there are several otherregional and affiliated meetings during the year. Checkout all the currently scheduled events listed in the calendaron page 51 and online at www.awma.org/events.
Don’t forget that monitoring and measuring (M&Ms!) iswhere it’s at. Getting smart now will provide an edge forthe future, even in today’s economy.
emawma.org
em • message from the president

4 em february 2009 awma.orgCopyright 2009 Air & Waste Management Association
water wells. The perchlorate prioritization protocol devel-oped by CA PWG demonstrates a practical, interagencyresponse for rapidly assessing potential real-world exposuresto perchlorate in drinking water. Although risk issues werebriefly discussed in the article by Racca et al. (p. 27), CAPWG did not attempt to address risk assessment issues,toxicological evaluations, or remediation technologies.
Toxicological evaluations and remediation technologiesare subjects being addressed by others and the reader isadvised to refer to various and plentiful literature studieson the two subjects. These documents include the Inter-state Technology & Regulatory Council (ITRC) guidancefound in the article by Racca et al. (p. 31) and the U.S.Department of Defense’s Strategic Environmental Research and Development Program and EnvironmentalSecurity Technology Certification Program (SERDP/ESTCP)initiative described in the article by Unger and Leeson (p. 22).
Readers interested in the most recent discussions regardingthe EPA reference dose for perchlorate are advised to readand/or comment on the Office of Inspector General’s Scientific Analysis of Perchlorate, dated December 2008.This document is available online at www.epa.gov/oig/recent.htm.
The attempt during the preparation of the December2008 issue was to focus on the aspects of perchlorate thatare not readily available in the literature.
Ashok KumarProfessor and Chairman, The University of Toledo
Dear EM,I was greatly disappointed in the articles on per-chlorate risk and remediation (EM December2008, pp. 21–31). The articles did not attemptto describe or evaluate any of the risk evalua-tions of perchlorate in drinking water. More information on perchlorate risk and the U.S.Environmental Protection Agency’s (EPA) eval-uations can be obtained from Wikipedia thanfrom A&WMA’s publication that purports to be“the magazine for environmental managers.”You did your readers a disservice when you didnot address the circumstances under which remediation would be warranted.
Robert F. Boland, P.E.Principal, Boland Environmental Management, LLC
From the December Issue Coordinator:I appreciate the comments by Mr. Boland. I agree thatmore information on risk evaluations related to drinkingwater is available on the Internet. It appears that Mr.Boland expected a discussion focused on the various toxicological studies of perchlorate, and the state and federal regulatory agency risk evaluations for perchloratederived from those studies. The purpose of the CaliforniaPerchlorate Working Group (CA PWG) was to identifyperchlorate releases that may have impacted drinking
em • letters
Portable TDLAS Ambient Air
The new Spectra-1 open path gas monitor series offers the performance you expect from a tuneable diode laser spectrometer. Detectable gases: CH4, CO2, NH3, HF, HCN, C2H2, C2H4, C2H6, others. Portable or Fixed Monitoring Greenhouse Gas Monitoring RS-232 Data Output Onboard Data Storage USB Stick Data Downloading 5 to +500 Meter Path Lengths
$19,825.00 (Single Qty. Price)
PPKKLL TTeecchhnnoollooggiieess IInncc.. (780) 910-4932 www.pkltechnologies.com

awma.org february 2009 em 5Copyright 2009 Air & Waste Management Association
em • feature
Susan S.G. WiermanExecutive DirectorMid-Atlantic Regional Air Management [email protected]
Prakash Doraiswamy, Ph.D.Research ScientistAtmospheric Sciences Research CenterState University of New York, [email protected]
New technology and new requirements are changing U.S. air quality monitoring. In thisissue of EM, two feature articles discuss the measurement of fine particles, a third coversthe current status of coarse particle monitoring, and the final article introduces the work underway to meet the U.S. Environmental Protection Agency’s (EPA) multipollutant monitoring (“NCore”) requirements.
Current Issuesin Air Quality Monitoring
Fine Particle MonitoringTo assess compliance with fine particle (PM2.5) airquality standards, EPA requires states to use filter-based Federal Reference Method (FRM) samplers.As documented by many studies (e.g., Chow et al.1
and references therein), the FRM may lose semi-volatile mass. Recent advances in monitoring en-able real-time measurement of “total” PM2.5 mass,including the semivolatile component.1-3 One suchcontinuous method—the Beta-Attenuation Monitor(BAM)—was recently approved by EPA as a Fed-eral Equivalent Method (FEM), while anothermethod (the Filter Dynamics Measurement System) is pending designation.
Gobeli et al. (page 6) summarize the federal equivalency designation of the BAM. Next, Felton(page 10) delves into the designation process,examining the differences between the FRM usein the designation process and as operated bystate/local agencies, and questioning the continueduse of the FRM. Continuous instruments typicallymeasure higher concentrations than the FRM andallow almost immediate access to information onair quality. This difference could be important to sensitive individuals in areas subject to high particle concentrations.
Coarse Particle Monitoring and New FederalRequirements for Multipollutant MonitoringDuring the 2006 review of the National AmbientAir Quality Standard (NAAQS), EPA considered,but did not adopt, a standard for coarse particles(PM10-2.5, particulate matter between 2.5 and 10 µmin aerodynamic diameter). EPA has now developeda new PM10-2.5 FRM, and Rice et al. (page 16)
provide an update on coarse particle monitoringand ongoing research.
EPA’s NCore requirements will come into effectover the next few years, requiring significant investments by state/local agencies in advancedmonitoring equipment. NCore sites will give researchers and the public a wide range of air qualitydata, facilitating multipollutant air quality manage-ment. McGaughey et al. (page 24) provide us witha first look at one state’s efforts to meet the chal-lenges of implementing these requirements.
Final ThoughtsWe thank the authors for their contributions to thisissue. EM hopes to cover monitoring issues eachyear and provide a forum for discussion of ongoingair quality monitoring issues. State and local agen-cies will be under a tight timeline over the next twoyears satisfying monitoring requirements for NCoreand the new NAAQs for lead. For example, the leadNAAQS will require significant new monitoring todetermine compliance. Half the new monitors are tobe installed by January 2010 and the remainder inthe following year. EM welcomes the submissionof letters or articles on these and other air qualitymonitoring issues.
References1. Chow, J.C.; Doraiswamy, P.;
Watson, J.G.; Chen, L.-W.A.;Ho, S.S.H.; Sodeman, D.A.Advances in Integrated andContinuous Measurementsfor Particle Mass and ChemicalComposition; J. Air & WasteManage. Assoc. 2008, 58,141-163.
2. Solomon, P.A.; Sioutas, C.Continuous and Semicontinu-ous Monitoring Techniquesfor Particulate Matter Massand Chemical Components:A Synthesis of Findings fromEPA’s Particulate Matter Su-persites Program and RelatedStudies; J. Air & Waste Manage.Assoc. 2008, 58, 164-195.
3. Solomon, P.A.; Sioutas, C.Continuous and Semi-Contin-uous Methods for PM Massand Composition; EM April2006, 17 –23.

6 em february 2009 awma.orgCopyright 2009 Air & Waste Management Association
em • feature
by David Gobeli, Michael B.Meyer, Herbert Schloesser,and Thomas Pottberg
David Gobeli, Ph.D., is theproduct director for the BAM-1020 monitor, Michael B.Meyer is executive director,Herbert Schloesser, Ph.D., isvice president of the ParticulateAir Business Division, andThomas Pottberg is presidentand a principle, all with MetOne Instruments Inc., Grants Pass, OR. E-mail: [email protected].
The U.S. Environmental Protection Agency (EPA) first promulgated fine particulate matter(PM) as a criteria pollutant as part of the National Ambient Air Quality Standards (NAAQS)revisions in 1997.1 The indicator chosen for fine PM was PM2.5, or the total mass concentration of PM less than or equal to 2.5 micrometers (µm) aerodynamic equivalentdiameter. The final PM2.5 rule established a strict definition of the PM2.5 Federal Reference Method (FRM) sampler.
FINALLY,a Continuous FEM for PM2.5
awma.org february 2009 em 7Copyright 2009 Air & Waste Management Association
This gravimetric, low-volume (1m3/hr), filter-based (46.2-mm diameter polytetrafluoroethylene [PTFE] filter) FRMsampler was often referred to as the “gold standard” andis a hybrid based on a combination of design and performance specifications. Experience, however, wouldlater indicate that the FRM sampler and associated filterhandling and laboratory processing would not define agold standard, but simply a “method by definition” forthe determining PM2.5 by gravimetry. An extensive national PM2.5 air monitoring network was establishedbetween 1998 and 2000.
The concept of the Class III Federal Equivalent Method(FEM) was also introduced as part of the 1997 rules. ThisFEM category opened the door for continuous and semicontinuous monitors to gain EPA method designationfor use in the national PM2.5 air monitoring network. Atthe time of introduction of the Class III FEM concept,EPA opted not to provide specific test criteria, thus ef-fectively slamming shut the door. It was not until 2006that Class III FEM test criteria would finally be estab-lished, some nine years after the PM2.5 NAAQS rule wasput forth. These test criteria were issued as part of EPA’sSeptember 2006 action to amend its national air qualitymonitoring requirements.2
Because no PM2.5 FEM monitors existed for many yearsafter PM2.5 regulations were introduced in 1997, thoseinvolved with regulatory compliance for PM had to rely,in large part, on manual PM2.5 FRM samplers. FRMsamplers cannot provide real-time or near-real-timePM2.5 data. In addition, PM2.5 FRM samplers require farmore human intervention than a PM2.5 FEM monitorwould. Handling, storing, weighing, conditioning, andtransporting of filters presents significant cost, quality,and logistical challenges for those entities involved in thedesign, funding, and quality control of PM2.5 monitoringprograms. Since EPA regulations are often the basis forregulations outside the United States, the developmentof a PM2.5 monitor capable of obtaining FEM designationis likely to generate global interest.
Clear and concise test procedures now exist that allowthe manufacturers of continuous PM2.5 monitors toapply for and receive FEM designation. A beta attenuationmonitor (BAM-1020 by Met One Instruments Inc.) hasbecome the first to receive this regulatory approval. Presumably, instruments with such designation could beused instead of PM2.5 FRM manual, gravimetric samplers for enforcement and compliance purposes.
Class III FEM RequirementsThe full details of the PM2.5 Class III FEM test requirementsare published in the Code of Federal Regulations (CFR).3
The test procedure requires that three of the candidateFEM method instruments be collocated with three single-channel FRM samplers to assess comparability.Five test campaigns at four test locations are mandatory.These locations are specified by EPA so that the tests provide challenging and diverse conditions in terms ofaerosol character and climate, and include winter testsites in California, the Midwest, and higher elevationWestern regions. Also required are summer test sites inthe same California location and another in a North-eastern or Mid-Atlantic city.
Each test campaign requires a minimum of 23 acceptabledata sets with 24-hr PM2.5 concentrations in the range of3–200 micrograms per cubic meter (µg/m3). Equivalencyof the candidate monitor relative to the FRM is determinedthrough strict additive and multiplicative bias requirementsthat statistically define an acceptance polygon.
After the field tests are completed, a comprehensiveFEM designation application is submitted by the appli-cant to EPA. The required application contents are de-scribed in detail in the aforementioned CFR. Once EPAreceives the application package, it has 120 days to respond. If the response includes a request for additionalinformation or testing the counter is reset to an addi-tional 120 days, pending receipt of the new documents.It should be noted that although the FEM designation isfor daily PM2.5 measurements, the application is required to contain hourly information from each can-didate monitor in order to assess short-term precisionand character of the method. Keep in mind that EPA onlyhas a daily and annual NAAQS for PM2.5.
There are a couple of subtle yet important requirementsof the Class III FEM testing criteria. One is that a singlechannel (as opposed to a sequential) FRM sampler mustbe used during each field test campaign. In addition, EPAmandates that FRM filter samples be retrieved promptlyand analyzed. FRM filters used in the regulatory air monitoring stations can be left in the sampler some 96–177 hours after the end of the sample collection and before retrieval. Also, the filter mass measurement can occur up to 30 days after retrieval. These differencesmay introduce additional bias of the regulatory air monitoring stations’ FRM measurement relative to anapproved FEM.
The developmentof a PM2.5 monitorcapable of obtainingFEM designation islikely to generateglobal interest.

8 em february 2009 awma.orgCopyright 2009 Air & Waste Management Association
The FEM CandidateBackgroundBeta attenuation is one method used routinely to monitorambient PM continuously. The method was first developedmore than 60 years ago as a process control instrument inthe manufacturing of paper. Approximately 40 years ago,it was adapted for use in ambient particulate monitoring.4
Indeed, a number of beta attenuation mass (BAM) moni-tors have received EPA PM10 FEM designation.
The principle of operation of BAM monitors has been reported in detail elsewhere.4-7 In general, high-energyelectrons emitted through radioactive decay are known asbeta rays. When matter is placed between a radioactivesource and a device designed to detect beta rays, the betarays are attenuated. The magnitude of the reduction in detected beta particles is a function of the mass of the absorbing matter between the beta source and the detec-tor. For a BAM monitor, the absorbing mass is the collectedPM. With the PM mass and the sample volume measured,the resulting PM mass concentration is determined.
BAM-1020Met One Instruments’ BAM-1020 monitor was putthrough EPA PM2.5 FEM test campaigns during winter/summer from late 2006 into 2007. The BAM-1020monitor uses a 14C beta ray source that has a half-life of5,730 years, thus the beta output of the unit remains extremely stable over the useable life of the monitor. Themonitor was configured with an FRM-type PM10 size selective inlet, followed by a PM2.5 very sharp cut cyclone(VSCC) size fractionator. An integrated “smart heater”
system maintained the sample filter relative humidity at or below 35% to be consistent with the FRM filterconditioning requirements. The sample filter spot is advanced once per hour. This helps eliminate the loss of volatile particle mass by minimizing undesirable artifact formation that may occur with a longer filter residence time.
Test ProcedureSitingThe selected test winter sites were California (Bakersfield),Utah (Logan), and Michigan (Allen Park). The Bakersfieldand Allen Park sites are used by the California Air Resources Board (CARB) and the Michigan State Depart-ment of Environmental Protection. The Logan site was ata local government authority and in close proximity tomonitoring sites maintained and operated by the State ofUtah. The summer test sites were California (Bakersfield)and Connecticut (New Haven, which is operated by theConnecticut Department of Environmental Protection). Allsites were pre-approved by EPA. Photos of representativetest site locations are shown in Figures 1 and 2.
FRM SamplersEach of the four test sites used triplicate PM2.5 FRMsamplers (PQ-200 by BGI Instruments Inc.) equippedwith PM2.5 VSCC inlets, and each sampler was set upand calibrated according to manufacturers’ instructions.Samplers were sited such that their inlets were between1m and 1.5m apart, in accordance with the CFR. AllFRM samplers were deployed on the roofs of the sheltersthat contained the BAM-1020 candidate monitors.
Figure 2. Inside photo of a BAM-1020 at a representative test site.Figure 1. Outside photo of a representative test site (FRMs shown on left,BAM-1020 inlets on right).

awma.org february 2009 em 9Copyright 2009 Air & Waste Management Association
Candidate MonitorsAt each of the three test sites, triplicate BAM-1020 mon-itors were deployed in temperature-controlled sheltersand set up in accordance with the procedures set forthin the manufacturer’s operating manual. Inlet tubes extended through the roofs of the shelters to permitsampling at the same elevation as the FRM samplers.Shelter temperatures were maintained at approximately20 °C for the duration of the test.
Data CollectionThe FRM samplers and the BAM-1020 monitors wererun daily. Start times varied from site to site. 23 validhourly PM2.5 averages were used to generate each dailyaverage for the BAM-1020 monitor (EPA test criteriaallow 22–25 hr for a valid daily average). FRM samplerswere also run for 23 hours to permit filter replacementand servicing on a daily basis during the one-hour downtime. For the most part, data collection was uninter-rupted. Occasional days were missed due to power, site,or instrument issues.
Data ValidationFRM data were validated in accordance with the proce-dures set forth in the operation manual, weighing labora-tory, and EPA quality assurance documents. Daily data setsconsisted of two or three valid FRM results and two orthree valid BAM daily averages, as specified in the CFR. Tobe considered valid data, FRM daily means of the triplicatesamplers must have exceeded 3 µg/m3. In addition, FRMresults must pass an outlier test. No such outlier test wasallowed for the BAM-1020 results. BAM-1020 data werequalified by verifying that no alarm flags indicating instrument malfunction occurred during measurement.
Test ResultsA minimum of 23 valid, daily data sets were required foreach test campaign (46 for the combined winter/summer
location). Linear regressions were performed on eachcompleted data set. The results of the linear regressionsare shown in Table 1. In Table 1, n is the number of validdata sets collected at the test site, m is the slope of a linearregression of the BAM-1020 versus the FRM, b is the y-intercept in µg/m3, and r2 is the correlation coefficient.The data represent the mean of triplicate BAM-1020monitors and the mean of the triplicate FRMs for eachvalid day. The multiplicative and additive biases observedat all test sites were within EPA acceptance polygon (seeFigure 3). In addition, EPA requirements for precisionwere met at each of the test sites.
ConclusionThe BAM-1020 monitor became the first automated,continuous method to earn Class III FEM designation(EQPM-0308-170) on March 12, 2008. PM2.5 FEMmonitors such as the BAM-1020 offer the ability to providehigh time-resolved continuous data that more closelyrepresent the PM2.5 to which humans are exposed. Thisis due to less time for interaction between the sampleand surrounding environment and PM2.5 measurementcloser to the time of human exposure. It is interesting tonote that the gas-phase criteria pollutants are for themost part measured using only automated continuousreference or equivalent methods. The possibility now exists to augment or replace the PM2.5 FRM with the newautomated continuous PM2.5 FEMs. em
Table 1. Linear regression results.
Site n m b r2
Bakersfield, CA 50 0.9620 -.0761 0.9916
Logan, UT 42 0.9598 -.8627 0.9801
Allen Park, MI 30 0.9404 -.9552 0.9943
New Haven, CT 29 1.020 0.585 0.9977
Figure 3. EPA PM2.5 acceptance polygon.
References1. National Ambient Air Quality
Standards for Particulate Mat-ter. Final Rule; Fed. Regist.1997, 62, 38652-38752.
2. National Ambient Air QualityStandards for Particulate Mat-ter. Final Rule; Fed. Regist.2006, 71, 61236-61328.
3. Ambient Air Monitoring Ref-erence and Equivalent Meth-ods. 40 CFR Part 53.
4. Williams, K.; Fairchild, C.; Jakle-vic, J. Dynamic Mass Measure-ment Techniques. In AerosolMeasurement. Principles, Tech-niques, and Applications;Willeke, K., Baron, P., Eds.; VanNostrand Reinhold: New York,1993; pp. 296-312.
5. Gleason, G.I.; Taylor, J.D.;Tabern, P.L. Absolute betacounting at defined geome-tries; Nucleonics 1951, 8, 12.
6. Lilienfeld, P. Design and oper-ation of dust measuring instru-mentation based on thebeta-radiation method; Staub-Reinhalt Luft 1975, 35, 458.
7. Macias, E.S.; Husar, R.B. High-resolution online aerosol massmeasurement by the beta at-tenuation technique. In Proc.2nd Internat. Conf. on Nucl.Methods in Environ. Research;Vogt, J.R.; Meyer, W., Eds.;CONF-740701, 1970; pp.413.
Data Set Slope and Intercept, and Limits
Slope0.8
8
6
4
2
0
-2
-4
-6
-80.9
Inte
rcep
t, ug
/m3
1.0 1.1 1.2
10 em february 2009 awma.orgCopyright 2009 Air & Waste Management Association
em • feature
Is It Timeto Upgrade the PM2.5Federal Reference Method?

awma.org february 2009 em 11Copyright 2009 Air & Waste Management Association
by Dirk Felton
Henry (Dirk) Felton is a Research Scientist III with theNew York State Department ofEnvironmental Conservation’sBureau of Air Quality Surveil-lance, Albany, NY. E-mail: [email protected].
Disclaimer: The views expressedin this article are those of theauthor and do not reflect theviews and or policies of theState of New York.
The fine particulate matter (PM2.5) FederalReference Method (FRM) has in many respects been a great success. When themethod was implemented, there was somedoubt that the state and local monitoringagencies that routinely provide air qualitydata would be able to manage a program,which often distinguishes one location fromanother by just a few µg/m3. As it turns out,data from the FRM program are consistent,and have been successfully used to deter-mine nonattainment boundaries, in studiesof health effects and in the assessment ofsource contribution.
So, is there a need to upgrade the PM2.5 FRM? TheFRM method is a gravimetric, filter-based method. Theanswer, in part, may depend on the needs of the specificmonitoring agency. The FRM program has high opera-tional costs associated with the necessary field serviceand laboratory weighing, and a long delay between ambient measurements and when data are available.Newer automated instruments have a high initial cost,but they have the advantage of much lower operationalcosts and can provide data in near-real-time. Automatedinstruments designated as Federal Equivalent Methods(FEMs) can replace the instruments used for compliancemonitoring and the instruments used to provide hourlydata. Agencies use hourly data for public health mes-saging, source attribution studies, and PM2.5 forecasting.The use of FEMs can offer significant cost savings duringthese fiscally tight times. It is likely that FRMs will continueto have a place in monitoring networks where filter sam-ples are necessary for component chemical analysis.
Is There a Bias between the FRM and FEMs?One of the main problems with the current PM2.5 FRMis the lack of a physical standard to determine the accu-racy of the measurement. Actual atmospheric PM2.5 is acombination of solids and liquids ranging from relativelynonvolatile species, such as ammonium sulfate, elementalcarbon, and metallic compounds, to much more volatilecomponents, such as organic carbon, water associatedwith hygroscopic aerosol species, and ammonium nitrate.The filter-based FRM measurement does not capture allof the volatile components of PM2.5. Some of this massis lost from the filter due to evaporation during sampling,
after sampling, and during the post-weighing process. Inside-by-side comparisons, the FRM is sometimes biasedhigh, but in the majority of cases, it is biased low in com-parison to other measurement technologies.1 The newcontinuous measurement technologies have an advantageover the FRM because they provide near-real-timehourly concentrations of PM2.5. This significantly reducesthe opportunity for adsorption, or more likely, evaporationfrom the collection media before a measurement is made.
The bias between the FRM and the newer continuousmeasurement technologies is difficult to characterize.2
This is apparent in the shortcomings of the continuousdata adjustment schemes that are designed to adjust thedata from continuous instruments to more closely matchthe FRM data. Data adjustments are often attempted outof necessity because the FRM data are not usually availablefor days or weeks after sampling is completed. Most of these data adjustment techniques use previously collected data to determine the relationship between the measurements at similar locations and in similar meteorological conditions to adjust the continuous datain near-real-time.
Invariably, these schemes fail because they cannot adequately predict the amount of mass lost from theFRM filter prior to final weighing. The amount of masslost from the sampling filter is dependant on the amountof volatile PM components in the atmosphere during thesampling period, as well as the difference between theambient conditions during the sampling period versusthe conditions in the laboratory during final filter weigh-ing. This means that the bias between the FRM and thecontinuous instruments tends to be greatest in areas withsignificant sources of local emissions in the summermonths. The local emissions tend to provide a higherproportion of volatile PM2.5 and the warmer summertemperatures create favorable conditions for evaporationfrom the FRM’s sampling filter during and after the sampling period. This combination makes the bias verysignificant in large urban areas in the warmer monthswhen the PM2.5 concentrations tend to be elevated relative to other seasons.
This bias has been discussed in many research papers,but the issue was not recognized as a problem in theregulatory framework until earlier this year when the U.S.Environmental Protection Agency (EPA) approved a ClassIII PM2.5 Federal Equivalent Method (FEM) instrument.It is a beta attenuation monitor (BAM), known as theBAM-1020 manufactured by Met One Instruments Inc.(Grants Pass, OR). Currently, the application for another

12 em february 2009 awma.orgCopyright 2009 Air & Waste Management Association
Class III FEM, a filter dynamic tapered element oscillatingmicrobalance, known as the 1405 DF TEOM manufac-tured by Thermo Fisher Scientific (Franklin, MA), is pendingat EPA and could be approved later this year.
Problems with the FEM Approval ProcessThe PM2.5 FRM is a design-based method. The attributesof the sampler, including every part from the inletthrough to the bottom of the filter holder, is preciselyprescribed in the Code of Federal Regulations (CFR).3
This method of design philosophy has allowed multiplevendors to build FRM instruments that are reasonablyconsistent with one another for use at monitoring loca-tions across the country and in all weather conditions.The design method philosophy cannot be carried over tocontinuous instrumentation because each of the vendorssubmitting applications uses a different measurementtechnique. The FEM method approval process is based,by necessity, on performance, rather than design. Thismeans that a candidate FEM will only be approved if itcan reasonably emulate the data from the filter-basedFRM at a representative number of locations across thecountry. This would normally be an adequate techniqueto determine equivalency, however, for PM2.5, the con-tinuous instruments are being compared to a referencemethod that is not itself compared to a physical standardand, in fact, only captures a varying percentage of thevolatile components of the ambient PM2.5 mass.
The PM2.5 equivalent method approval process is contained in the aforementioned CFR and is very similarto the process used for PM10 FEMs. The candidate instrument vendors must operate three filter-based FRMsamplers and three candidate samplers at four locationsfor a minimum of 23 sample days per location. The locations are generally specified in the CFR and includeareas that are intended to cover the varying mix ofPM2.5 components found across the country, includingcities in the West, Midwest, and Northeast. The fourthlocation is Los Angeles, or California’s Central Valley, because it has relatively high concentrations of PM2.5,nitrates, and organic carbon. This site is the only one thatincludes both a summer and winter sampling campaign.The resulting data from these field campaigns are statis-tically compared to EPA’s test specifications and a deter-mination is made as to whether or not the candidatemethod is equivalent.
The equivalency determination process seems straight-forward enough, but there were a few details left out of the test protocols that have thrown the results of the process into jeopardy. The test specifications did not
require that the vendors operate their comparison FRMsamplers with a protocol identical to that used by stateand local agencies. State and local agencies operate FRMsamplers from midnight to midnight and typically leavethe filter in the sampler for two to six days after the sampling period. The filters are subsequently removed,refrigerated, and sent to the lab for weighing under controlled temperature and relative humidity. The vendorswere not allowed to use sequential samplers, so they operated their single-event, filter-based FRMs on a sched-ule more convenient for daily collection. They chose anhour each morning for filter exchange and immediatelyplaced the filters in a chilled cooler for shipment to thelab. This was permitted under the test specifications, buteliminated the holding time that filters generally spend insamplers. This decreased the loss of volatile PM2.5 mass.
Figure 1 shows the concentrations determined from thefilter samplers collected by the candidate sampler vendorsand the samples collected by the State of ConnecticutDepartment of Environmental Protection (CTDEP) andthe New York State Department of Environmental Conservation (NYSDEC) at the same locations. The samplecollection periods differ by 9 or 10 hours because of thedifference in the collection interval, but because thesesamples are collected every day, they should both averagethe same concentration over the entire campaign andhave nearly the same high and low concentrations duringepisodes. As it turns out, the vendor FRMs collect approximately 8% more mass than the regulatoryagency FRMs for the same period. More significantly,the bias between the vendor FRM concentrations andthe regulatory agency FRMs is much greater on the dayswith the highest PM2.5.
Figure 2 shows the difference between the vendor andregulatory agency FRMs, as well as the sorted FRM concentration for each day. The data in this plot werecombined from the Met One equivalency test in NewHaven, CT, and the Thermo Fisher equivalency test inQueens, NY. These tests were both conducted in July2007. The linear regression indicates that the expecteddifference between the vendor and the state and localagency FRMs increases as the PM2.5 concentration increases. It is clear that this bias is much more significanton days when regulatory agencies are most likely tomeasure a concentration that exceeds the 24-hr PM2.5National Ambient Air Quality Standards (NAAQS).
Regulatory Implications for Using FEMsRegulatory agencies awaiting the designation of a continuous Class III FEM do not have to wait any longer.
The use of FEMscan offer significantcost savings duringthese fiscally tighttimes.

awma.org february 2009 em 13Copyright 2009 Air & Waste Management Association february 2009 em 13
This is good news for state and local air monitoring agencies that need to reduce staffing and program costs,as well as for the majority of agencies that routinely monitor PM2.5 concentrations well below the NAAQS.However, regulatory agencies that choose to use a PM2.5Class III FEM at a compliance monitoring site could besurprised by higher than expected PM2.5 concentrationson days when the proportion of volatile PM2.5 is high.The PM2.5 24-hr NAAQS is in the form of a 98th percentile, which means that the standard could be exceeded with only a few high concentration days peryear. So, the performance of the FEMs on these highconcentration days relative to the FRM can potentiallychange the attainment status of an area.
Most agencies do not know whether the bias betweenthe new FEMs and FRM is significant in their area. Thisproblem is exasperated by the FEM tests, which cannotbe used to predict how well the FEMs work in variousparts of the country. EPA has addressed this issuethrough an implementation guidance memo for Class IIIFEMs.4 The guidance describes how the FEMs can beused at a monitoring site for evaluation for up to twoyears collocated with a FRM. The problem with thisguidance is that there is no advice for what to do if theFEM and the FRM do not compare well enough tomeet the original equivalency specifications. One of theconclusions of the implementation memo is that stateand local agencies should discuss the issue with theirRegional EPA Office before the decision is made to operate a Class III FEM.
How to Upgrade the FRMThe Met One BAM and the Thermo Fisher 1405 DFwork as designed, agree well with one another, andprovide data that includes a higher proportion of thevolatile mass than the FRM. The preferred way to address this difference is to modify the FRM, so that it retains substantially more of the volatile componentsof PM2.5.
The successful elements of the FRM design, such as thesize selective inlet and volumetric flow control, can all beleft intact. The FRM needs to have the added ability tocool the sampling filter at the end of the sampling period. This could easily be done by incorporating aPeltier cooler to keep the filters cold after the samplingperiod has ended. A dryer may also have to be used toprevent condensation from occurring while the filter is inthe sampler. The result of an improved FRM will be aPM2.5 dataset more consistent for regulators and moreresponsive to researchers’ needs.
Figure 1. Filter sampler concentrations collected in New Haven, CT, and Queens, NY.Notes: The top plot shows CTDEP FRM data (hollow diamonds), which tend to be lower than the triplicate vendor FRMdata (filled triangles) and the vendor FEM data (crosses) during the summer FEM field campaign in New Haven, CT.The lower plot shows the FRM and FEM test data from Queens, NY.
Figure 2. The absolute value difference between the vendor and regulatory agency FRMsNotes: The plot shows the absolute value difference between the vendor and regulatory agency FRMs PM2.5
concentration for each day of the two campaigns in the Northeast (filled squares). The PM2.5 data (hollow diamonds)are sorted from lowest to highest. The linear regression (R2 = 0.4) indicates that the expected difference between thevendor and the state and local agency FRMs increases as the PM2.5 concentration increases.
Daily State Agency and Daily Vendor Triplicate FRM Data:FEM Test New Haven, CT
ug/m
3
6/23/07 6/27/07 7/1/07 7/5/07 7/9/07 7/13/07 7/17/07 7/21/07
60
50
40
30
20
10
0
Daily State Agency Collection and Daily Triplicate Vendor FRM Data:FEM Test Queens NYC
ug/m
3
40
30
20
10
0
6/1/07 6/5/07 6/11/07 6/17/07 6/23/07 6/29/07 7/5/07 7/11/07 7/17/07
FEM Equivalency Test Data: Sorted PM-2.5 Concentration and BiasBias = Vendor FRM - CT DEP and NYSDEC FRM data
ug/m
3
Sorted Conc and Bias
60
50
40
30
20
10
0

awma.org february 2009 em 15Copyright 2009 Air & Waste Management Association
ConclusionBeyond the regulatory implications of measuring moreof the volatile components of PM2.5, there are other compelling reasons to use FEMs in place of the FRM.The FEMs provide hourly data which are, of course,more useful for pollutant tracking studies and for public reporting purposes; a vital mission for every air qualityagency today. The FEMs also measure a quantity that ispotentially more relevant for public health studies thanthe FRM. The original purpose for monitoring PM2.5concentrations was to determine compliance with ahealth-based standard. What if the air quality standardwas set based on a filter-based measurement not capturing the most harmful components of PM2.5? Sincewe know that there are health effects associated with relatively low PM2.5 concentrations, it seems we shouldbe concerned if we may be missing a significant portion
of PM2.5 on the highest concentration days. If there is, infact, a stronger correlation with health effects with FEMdata than with FRM data, it may be that we are under-estimating the associated risk of living in urban areas.
The Met One BAM and the Thermo Fisher 1405 DFrepresent a true technological advancement over filter-based samplers, the basis for FRM sampling for morethan 30 years. As these new technologies get morewidely deployed, users will come to expect high-qualityhourly data that is consistent and comparable no matterwhat instrument or which monitoring agency providesthe data. 24-hr filter-based FRM data are likely to become irrelevant unless upgraded to make the data atleast consistent with these new technologies. em
References1. Schwab, J.J.; Felton, H.D.; Rattigan, O.V.; Demerjian, K.L. New York State Urban and Rural Measurements of Continuous PM2.5 Mass by
FDMS, TEOM, and BAM; J. Air & Waste Manage. Assoc. 2006, 56, 372-383.2. Felton, H.D.; Rattigan, O.V. Modifying 50 ºC TEOM Data to be More “FRM like” for AQI Reporting using a Nonlinear Correction based on
the Julian Day. Presented at the 2005 AAAR Meeting, February 7-–11, 2005, Atlanta, GA (17PH-28).3. Ambient Air Monitoring Reference and Equivalent Methods. 40 CFR Part 53.4. “Implementing Continuous PM2.5 Federal Equivalent Methods (FEMs) and Approved Regional Methods (ARMs) in State or Local Air Monitoring
Station (SLAMS) Networks”; Memorandum from Richard A. Wayland, Director, Air Quality Assessment Division, Office of Air Quality Planningand Standards, U.S. Environmental Protection Agency, Research Triangle Park, NC, to Regional Air Division Directors, dated July 24, 2008.
Applying scientific solutions to environmental challenges.
Drug discovery & development
Education & training research
Survey research & services
Statistics research
International development
Economic & social research
Advanced technology research
Energy research
Environmental research
Health research
Laboratory & chemistry services
www.rti.org/everywhere
>
h &carrceeaesy rreeeyvurrvSS
ainingrraion & ttrucattiddEEd
evvey & derryevveocug disrruD
esicvre& s
hcarrceeaesg rre
ntmeploope
ental rreonmeirrovnE
yggyrrgneEEn
yggylooghnoeced tteancvvaddvA
ialoconomic & scEEc
evveional denattirrnentteIIn
sicisttitattiS
hcarrcees
hcarrceeaesy rre
hcarrceeaesy rre
hcarrceeaesl rre
ntmeploope
hcarrceeaess rre
inyllyppppAAp> ottoionslutosificnttiiecsng nglehalcntalonmeirrovne esgge
yrryeveg//ei.orrgti.rwwww.
yrrymisttrhey & corryattoaborraL
altheHHe
ental rreonmeirrovnE
erreheyw
esicvrey s
hcarrceeaesh rre
hcarrcees inyllyppppAAp> o ttoions lutosific nttiiecsng nglehalcntalonmeirrovne es.gge
AcknowledgmentThe author thanks Met One Instruments Inc., Thermo FisherScientific, CTDEP, and NYS-DEC for providing data used in this article.

16 em february 2009 awma.orgCopyright 2009 Air & Waste Management Association
Current National Ambient Air Quality Standards (NAAQS) for particulate matter(PM) use PM2.5 and PM10 as the indicators to provide protection against exposuresto fine and coarse particles, respectively. PM2.5 is the indicator for fine particles thatgenerally refers to particles less than or equal to 2.5 micrometers (μm) in diam-eter. PM10 is the indicator for coarse particles that generally refers to particles lessthan or equal to 10 μm in diameter. In a review of the PM NAAQS completedin 2006,1 the U.S. Environmental Protection Agency (EPA) revised the level of the24-hr PM2.5 NAAQS to 35 μg/m3 and retained the level of the annual PM2.5standard at 15 μg/m3 to provide public health and welfare protection againstexposures to fine particles. EPA also retained the primary and secondary 24-hrPM10 standards at 150 μg/m3 to continue to provide protection against exposuresto thoracic coarse particles. Given that the available evidence did not suggest anassociation between long-term exposures to thoracic coarse particles at currentambient levels and adverse effects, EPA revoked the annual PM10 standard.
em • feature
by Joann Rice and Beth Hassett-Sipple
Joann Rice is an environmen-tal scientist in the Air QualityAssessment Division and BethHassett-Sipple is an environ-mental health scientist in theHealth and Environmental Impacts Division, both with theU.S. Environmental ProtectionAgency’s (EPA) Office of AirQuality Planning and Standardsin Research Triangle Park, NC.E-mail: [email protected].
Disclaimer: The views expressedin this article are those of theauthors and do not necessarilyreflect the views and policies of EPA. The article has beensubjected to the agency’s peerreview and is approved for publication.
PM10-2.5 Monitin Support of EPA’s PM
awma.org february 2009 em 17Copyright 2009 Air & Waste Management Association
As part of this NAAQS review, EPA proposed anew indicator for thoracic coarse particles definedto include particles between 2.5 and 10 μm in diameter, PM10-2.5, and qualified to focus on themix of thoracic coarse particles generally presentin urban environments.2 For reasons discussed inthe preamble to the final rule1 and after extensiveevaluation of the evidence, consideration of availablealternative standards, advice and recommendationsof Clean Air Science Advisory Committee (CASAC),and consideration of public comments, EPA concluded that retaining PM10 as the indicator forthoracic coarse particles was most appropriate.
Although the standards for thoracic coarse particlesdo not use a PM10-2.5 indicator, the 2006 revisionsto the PM NAAQS included a new Federal ReferenceMethod (FRM) for the measurement of PM10-2.5in ambient air. One of the reasons for not finalizinga PM10-2.5 standard in 2006 was the limited bodyof evidence on effects associated with thoraciccoarse particles from studies using PM10-2.5 meas-urements. With the new PM10-2.5 FRM, researcherswill likely include PM10-2.5 measurements in healthand welfare studies to inform future reviews of thePM NAAQS. This new PM10-2.5 FRM also provides
a basis for approving Federal Equivalent Methods(FEMs) and will be important in the developmentof PM10-2.5 speciation sampling methods.
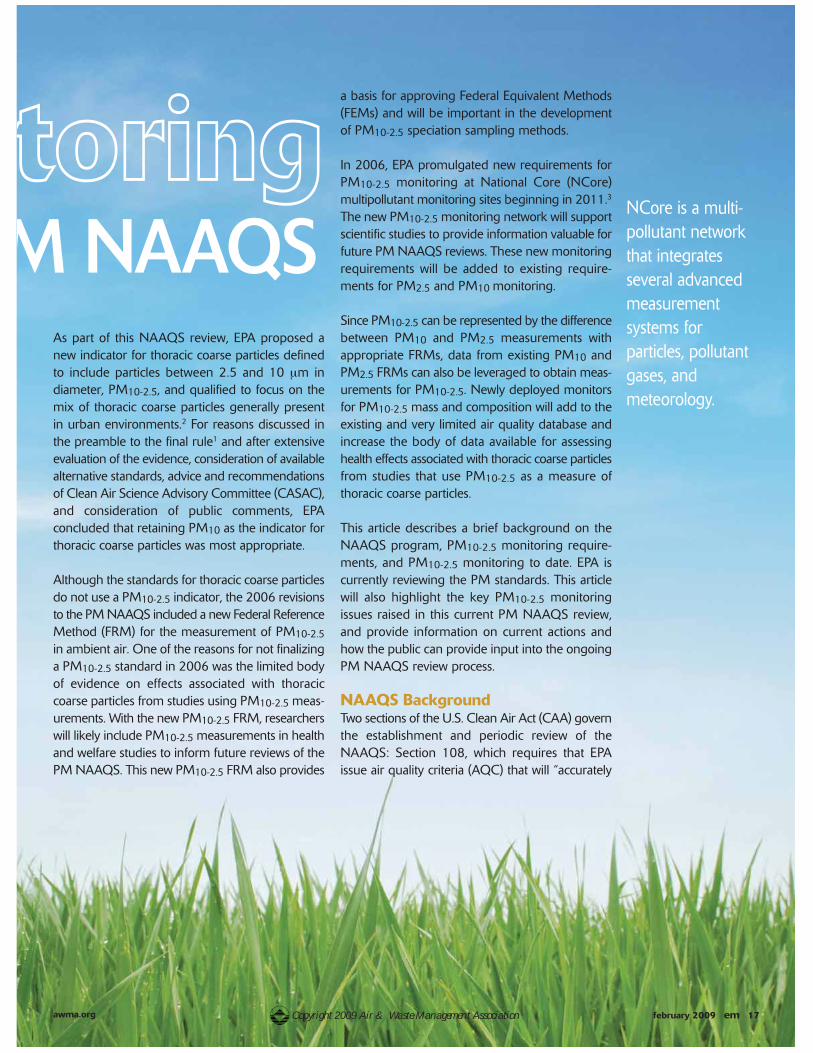
In 2006, EPA promulgated new requirements forPM10-2.5 monitoring at National Core (NCore)multipollutant monitoring sites beginning in 2011.3
The new PM10-2.5 monitoring network will supportscientific studies to provide information valuable forfuture PM NAAQS reviews. These new monitoringrequirements will be added to existing require-ments for PM2.5 and PM10 monitoring.
Since PM10-2.5 can be represented by the differencebetween PM10 and PM2.5 measurements with appropriate FRMs, data from existing PM10 andPM2.5 FRMs can also be leveraged to obtain meas-urements for PM10-2.5. Newly deployed monitorsfor PM10-2.5 mass and composition will add to theexisting and very limited air quality database andincrease the body of data available for assessinghealth effects associated with thoracic coarse particlesfrom studies that use PM10-2.5 as a measure of thoracic coarse particles.
This article describes a brief background on theNAAQS program, PM10-2.5 monitoring require-ments, and PM10-2.5 monitoring to date. EPA iscurrently reviewing the PM standards. This articlewill also highlight the key PM10-2.5 monitoring issues raised in this current PM NAAQS review,and provide information on current actions andhow the public can provide input into the ongoingPM NAAQS review process.
NAAQS BackgroundTwo sections of the U.S. Clean Air Act (CAA) governthe establishment and periodic review of theNAAQS: Section 108, which requires that EPAissue air quality criteria (AQC) that will “accurately
NCore is a multi-pollutant networkthat integrates several advancedmeasurement systems for particles, pollutantgases, and meteorology.
toringM NAAQS

18 em february 2009 awma.orgCopyright 2009 Air & Waste Management Association
reflect the latest scientific knowledge useful in indicating the kind and extent of all identifiable effects on public health or welfare which may beexpected from the presence of such pollutant inthe ambient air, in varying quantities”; and Section109, which requires EPA to set two types of NAAQS:
• primary (health-based) NAAQS that are to beambient air quality standards, which in the judg-ment of the EPA Administrator, based on theAQC and allowing an adequate margin of safety,are requisite to protect public health; and
• secondary (welfare-based) NAAQS that are tobe ambient air quality standards, which in thejudgment of the EPA Administrator, based onthe AQC, are requisite to protect public welfarefrom any known or anticipated adverse effects. Welfare effects, as defined by the CAA, includevisibility impairment, as well as effects on wildlife,crops, vegetation, soils, water, and man-madematerials.
The CAA requires that EPA review the AQC andNAAQS at five-year intervals and promulgate newstandards, as may be appropriate to ensure thatthey provide requisite health and environmentalprotection. NAAQS have been set for PM and five other common air pollutants: ozone, nitrogen
dioxide, carbon monoxide, sulfur dioxide, and lead.
PM10-2.5 NAAQS Monitoring RequirementsIn 2006, along with revising the PM NAAQS, EPAalso finalized revisions to the ambient air monitoringregulations.3 The final monitoring rule contains arequirement for PM10-2.5 mass and speciationmonitoring at NCore multipollutant sites by January1, 2011, with Annual Monitoring Network Plansdue July 1, 2009. This rule increases the numberof speciation monitoring sites from about 20 to 75and shifts the focus from urban monitoring to bothurban and rural monitoring locations. Manually-operated PM10-2.5 mass and speciation samplersmust operate on at least a 1-in-3 day schedule andbe collocated with PM2.5 speciation samplers atNCore sites. Since EPA is requiring PM10-2.5 massand speciation monitoring primarily for scientificpurposes, it is appropriate to have monitoring at a variety of urban and rural locations to increasethe diversity of areas that will have chemical species data.
NCore4 is a multipollutant network that integratesseveral advanced measurement systems for particles,pollutant gases, and meteorology (see Figure 1).NCore puts emphasis on multipollutant monitoring,
Figure 1. Candidate NCore sites, as of October 2007.
The CAA requiresthat EPA review the NAAQS at five-year intervals.

awma.org february 2009 em 19Copyright 2009 Air & Waste Management Association
continuous monitoring methods, and importantpollutants previously not included in pollutantmonitoring networks, such as reactive oxides of ni-trogen (NOy) compounds. When completed, thismodified network will meet a number of importantneeds that include improving data flow and timelyreporting to the public; providing inputs forNAAQS compliance determinations; supportingthe development of emissions strategies; improv-ing inputs for evaluating accountability for controlprograms; and providing data to support scientificand health- and/or welfare-based research studies.
PM10-2.5 Monitoring to DateThe PM10-2.5 FRM, or approved FEMs if available,will be implemented for mass measurements at therequired NCore stations by January 1, 2011. Despitethis long period of implementation, there are already a number of collocated PM10 and PM2.5low-volume FRMs operating across the countrythat are essentially providing the PM10-2.5 FRMmeasurement by the difference method. Twenty-four
sites across four states (Iowa, North Carolina, Connecticut, and Montana) are currently collectingPM10-2.5 mass data to support special studies andmonitoring implementation using collocated PM10and PM2.5 samplers and posting these data intothe EPA Air Quality System.
PM10-2.5 speciation is required at NCore; however,there is currently no routine chemical speciationnetwork for characterizing the specific componentsof thoracic coarse particles. A few PM10-2.5speciation monitoring special studies are inprogress to inform development of the PM10-2.5speciation monitoring program. EPA continues toevaluate the performance of commercially-availabledichotomous and continuous monitors to supportPM10-2.5 mass and speciation monitor development.PM10-2.5 speciation monitoring will require themeasurement of different species and possibly different sampling and analysis methods than currently used in the PM2.5 program. Therefore,EPA is in the process of planning a PM10-2.5
www.metone.com • 541-471-7111
The FIRST U.S. EPA-designated continuous PM-2.5 monitor…only from Met One InstrumentsThe BAM-1020 particulate matter (PM) mass concentration monitor is the only unit of its kind to receive U.S. EPA’s designation as a Class III Federal Equivalent Method (FEM) for PM-2.5 (EQPM-0308-170). An FEM for PM-10 as well, the BAM-1020 monitor providescontinuous, hourly measurements for real time pollution alerts and regulatory and research applications—faster than conventional samplers and without laboratory analysis.
• Rugged and dependable; field-tested for long-term, unattended use• Easy to install, operate and maintain, and requires no site-selective adjustments• Improved sensitivity and accuracy• Manufactured in the United States and certified worldwide
Met One Instruments, Inc. has been a world leader in the research, development and manufacture of meteorological instruments, particulate monitors, data loggers and environmental software for over 30 years.
20 em february 2009 awma.orgCopyright 2009 Air & Waste Management Association
speciation monitoring pilot program with state/local monitoring agency partners at a few locations.This pilot program will aid our understanding ofthe issues associated with PM10-2.5 speciationmonitoring and help to determine the most appropriate strategy for long-term monitoring ofPM10-2.5 species at NCore sites.
PM10-2.5 Monitoring Issues in theCurrent PM NAAQS ReviewThe current PM NAAQS review will explore anumber of policy-relevant issues associated withmeasuring and characterizing fine and thoraciccoarse particles in ambient air. As part of the review process, EPA prepared an Integrated ReviewPlan (IRP) that presented the current design of thereview and specified the schedule for the entire review, the process for conducting the review, andthe key policy-relevant science issues that will guidethe review.5 Specific monitoring-related issues associated with measuring and characterizing fineand thoracic coarse particles in ambient air relatedto the review of the PM NAAQS were included inSection 7 of the IRP. EPA will draw upon the infor-
mation presented in the PM Integrated Science Assessment (ISA) to inform the evaluation of appropriate monitoring methods and network design for PM, including consideration of the avail-able information on probe siting criteria that couldbest support the current or alternative PM standards.The PM10-2.5 issues related to monitoring networkdesign, sampling methods, and data reportingwere provided in the IRP and are summarizedbelow.
The minimum number of required monitors forPM is stated in the U.S. Ambient Air MonitoringRegulations.3 EPA negotiates with state air agenciesto determine the total number of monitors neededto represent an area’s air quality. The requirementsfor PM10-2.5 mass and speciation monitoring atNCore sites include a provision for both urban andrural monitoring locations. Issues related to thePM10-2.5 network design that will be examined inthe current PM NAAQS review include considera-tion of factors to identify the size of a PM10-2.5mass and speciation monitoring network thatwould be sufficient to spatially characterize urbanand rural areas (e.g., number of monitors, geo-graphic distribution); identification of additionalsampling and statistical techniques that are avail-able to help determine the minimum number ofPM10-2.5 monitors needed across an area to adequately assess issues of spatial and temporalvariability; consideration of criteria to inform appropriate monitor placement for thoracic coarseparticle characterization of PM10-2.5, including thedistance relative to sources, measurement scale,and inlet height; and whether data from PM10-2.5monitors located nearly adjacent to sources shouldbe excluded from comparison with a potentialPM10-2.5 NAAQS.
Sampling method issues for consideration includeidentification of new information that is available toinform options and technologies for sampling andanalysis of components of thoracic coarse particles;operational experiences learned in the PM2.5speciation network and the multisite evaluations ofPM10-2.5 monitors that would be useful to informsampler design and laboratory analysis methodsbeing considered for PM10-2.5 speciation; PM10-2.5speciation sampling artifacts that may be encoun-tered; sampling methods or technologies that areavailable and appropriate for collection of particlesfor PM10-2.5 speciation; whether the collection
There is currentlyno routine chemicalspeciation networkfor characterizingthe specific compo-nents of thoraciccoarse particles.
Donate just 20 minutes a week
and inspire the next generation
of A&WMA members!
MentorNet is seeking science and
engineering professionals working
in industry or government to
mentor students and young
professionals looking to break into
the environmental field.
Visit www.mentornet.netto get started.

awma.org february 2009 em 21Copyright 2009 Air & Waste Management Association
and qualitative/quantitative analysis of biologicalmaterials is appropriate; and if time-resolved meas-urements are needed to evaluate the evidence fora causal relationship between observed health outcomes and ambient thoracic coarse particle concentrations. Related to an expected increase inthe number of low-volume PM10 samplers withthe transition to PM10-2.5 measurement by the difference method, information on precision andbias from high- and low-volume PM10 samplersshould be evaluated to demonstrate whether a sig-nificant advantage for low-volume samplers existsand whether a phase-out of high-volume samplersfor PM10 should be considered.
Public Input into the NAAQS Review ProcessSince the last PM NAAQS review, EPA has madea number of changes to the process that it uses toreview the NAAQS. These changes focus on ad-dressing key policy-relevant issues and timeliness,consideration of the most up-to-date scientific information in the decision-making process, distinctions between scientific and policy judgments,
and characterization of uncertainties in scientificand technical information. In making these changes,EPA consulted with CASAC and considered publiccomments.6
The new process is being applied to the currentPM NAAQS review and contains four major com-ponents: the IRP, an ISA, a risk and exposure assessment, and a policy assessment/rulemaking.Several opportunities in the NAAQS review processprovide for both CASAC and public comments oneach of the major products or outputs from the review, including solicitation of public commentson the proposed rule.
Figure 2 provides a flow diagram of the currentprocess and indicates points where CASAC reviewand public comment are requested. With respect tothe current PM NAAQS reviews, recent milestonescompleted include a final IRP5 issued in March2008 and a first draft ISA7 released in December2008. We anticipate a proposed rulemaking inearly 2011, with final rulemaking in late 2011 tocomplete this review.

22 em february 2009 awma.orgCopyright 2009 Air & Waste Management Association
ConclusionAlthough the standard for thoracic coarse particlesdoes not use PM10-2.5 as the indicator, a new FRMfor PM10-2.5 was promulgated and provides a basisfor approving FEMs and promotes collection of scientific data to support future PM NAAQS reviews.The FRM will also be important in the develop-ment of PM10-2.5 speciation sampling methods.PM10-2.5 mass and speciation monitoring at NCoresites is not required until January 2011; however,some monitoring for special purposes is in place tohelp inform the development of long-term PM10-2.5monitoring programs.
Initially, PM10-2.5 mass monitoring is being doneby state agencies using existing low-volume PM2.5and PM10 FRM sampling systems. A few PM10-2.5speciation monitoring special studies are in progressto inform development of the PM10-2.5 speciation
monitoring program. EPA is developing an imple-mentation plan for a thoracic coarse particle speci-ation network that will be part of the NCorenetwork.
The current PM NAAQS review will explore a num-ber of key policy-relevant issues associated withmeasuring and characterizing fine and thoraciccoarse particles in ambient air. EPA will draw uponscientific information developed during this reviewto inform the evaluation of appropriate PM10-2.5monitoring methods and network design. em
References1. National Ambient Air Quality Standards for Particulate Matter; Fed. Regist. 2006, 71, 61144 (October 17, 2006).2. National Ambient Air Quality Standards for Particulate Matter; Fed. Regist. 2006, 71, 2620 (January 17, 2006).3. Revisions to Ambient Air Monitoring Regulations; Fed. Regist. 2006, 71, 61236 (October 17, 2006).4. National Core Multipollutant Monitoring Network. See www.epa.gov/ttn/amtic/ncore/index.html.5. Integrated Review Plan for the National Ambient Air Quality Standards for Particulate Matter; EPA 542/R-08-004; U.S. Environmental Protection
Agency: Washington, DC, March 2008; available at www.epa.gov/ttn/naaqs/standards/pm/s_pm_2007_pd.html.6. Review of the National Ambient Air Quality Standard (NAAQS) Process. See www.epa.gov/ttn/naaqs/review.html.7. Integrated Science Assessment for Particulate Matter: First External Review Draft; EPA/600/R-08-139; U.S. Environmental Protection Agency:
Washington, DC, December 2008; available at http://cfpub.epa.gov/ncea/cfm/recordisplay.cfm?deid=201805.
Figure 2. Current NAAQS review process.

Order Now !Member price $168Nonmember Price $178
To place your order:Online at www.awma.org/go/onlinelibrary (secure site)E-mail [email protected] A&WMA Publications Order Department at+1-412-232-3444, ext. 6001.Order Number OTHP-01R: Air Pollution Engineering Manual,Second EditionEdited by Wayne T. Davis, Ph.D., University of TennesseeCopyright April 2000, John Wiley & Sons Inc.Shipping costs additional.
First comprehensive revision since 1992
Air PollutionEngineeringManualSecond EditionEight years in the making, this second editionis a vital source of information on air pollutioncontrol issues for industries worldwide affectedby regulations, including the Clean Air Act.
Learn about the latest emission factors and controlmeasures for reducing air pollutants.
Read about the fundamental technological andregulatory information you need to comply with recentair pollution standards for industry and government.
View more than 500 detailed flowcharts and photos.
Utilize the extensive listing of Internet resources.
Experts from diverse fields cover:
biological air pollution controlemission control methods for a multitudeof industries, ranging from woodprocessing and brick, ceramic andpharmaceutical manufacturing to graphicarts, metallurgy, waste and wastewaterchanges in emission factors for eachsource category, including particulatematterupdated MACT regulations andtechnologies, and more!
This book is a must for industryand government professionals,and a great gift for recent orsoon-to-be graduates!
Another PremierPublication from
Air & Waste Management AssociationConnecting the World’s Leading
Environmental Professionals
www.awma.org

24 em february 2009 awma.orgCopyright 2009 Air & Waste Management Association
em • feature
by Jim McGaughey, JoetteSteger, Mark Yirka, andCarlton Blakley
Jim McGaughey and CarltonBlakley are environmentalchemists with the AmbientMonitoring Section, Dr. JoetteSteger is the project and procedures branch supervisorof the Ambient MonitoringSection, and Mark Yirka is an electronics technician withthe Electronics and CalibrationBranch of the Ambient Moni-toring Section, all with theNorth Carolina Division of AirQuality in Raleigh, NC. E-mail:[email protected].
The U.S. Environmental Protection Agency’s (EPA) National Ambient Air Monitoring StrategyNational Community Representative (NCore) program is a network that is currently underdevelopment. It is being designed to promote a true, multipollutant monitoring infra-structure for future multiple pollutant-based air program management initiatives. Whencomplete, NCore will meet a number of important data needs, including improved flowand timely reporting of data to the public; continued determination of National AmbientAir Quality Standards (NAAQS) compliance; improved development of emissions controlstrategies; enhanced accountability for the effectiveness of emission control programs;and more complete information for scientific, public health, and ecosystem assessments.1-3
Planningfor NCore Monitoring

awma.org february 2009 em 25Copyright 2009 Air & Waste Management Association
NCore will consist of three levels of monitoringsites: Levels 1, 2, and 3. Level 1 sites will be few innumber and will be research oriented. Level 2 siteswill be the backbone of the network and will inte-grate several advanced measurement systems forparticles, inorganic gases, and meteorology, andwill consist of approximately 75 sites located mostlyin urban areas. These sites are to provide meas-urements that are representative of well-mixed airregimes that are not overly influenced by localsource emissions or topographical phenomena andwill focus on the implementation of high-sensitivitygaseous monitors for carbon monoxide (CO), sulfur dioxide (SO2), and total reactive oxides ofnitrogen (NOy)—precursors to ozone (O3) and particulate matter (PM) formation. Level 3 sites willfocus primarily on specific pollutants, such as O3and PM, and may number more than 1000.2,3
The proposed monitoring types for the NCore sitesare provided in Table 1. Final site selection is not required until July 1, 2009, and these sites are notrequired to be in operation until January 1, 2011.1
This date seems to be far into the future, but not sowhen considering that the NCore monitoring planis due July 1, 2009. The following discussion addressesthe activities that the North Carolina Division of AirQuality (NCDAQ) has begun for an NCore siteand is planning to accomplish in the next year. Thetopics listed below are those that the NCDAQ hasinitially targeted. As we began addressing eachtopic, questions arose that were not covered in sufficient detail in currently available EPA materials.
Site SelectionIt is anticipated that most NCore sites will be inurban areas (representing a parcel with dimensionsof approximately 5–50 km). This requirement isdiscussed in the latest EPA Code of Federal Regu-lations (effective December 18, 2006) in 40 CFRPart 58.1 Many states may already have an activesite that is part of their State and Local Air Moni-toring Stations (SLAMS) network and meets thisEPA requirement, as is the case with NCDAQ. Thespecific location of the site must meet the monitorsiting requirements, including distance from roads,buildings, and trees. Additionally, the site monitorsmust be positioned to meet minimum/maximumdistances from each other and have probe inlets atspecific heights above the ground. PM monitorsare typically positioned in an open area with indi-vidual environmentally controlled outdoor shelters,
while continuous gaseous monitors are housed in atemperature-controlled building or a small walk-instructure.
It was necessary for NCDAQ to modify our existingsite to meet all of the NCore requirements. First, itwas necessary to move some trees and removeothers. This required some negotiation with adjacentproperty owners. Second, we constructed a ground-level 16x16 feet wooden deck on which the particulate monitors will be positioned. This allowssufficient room to incorporate up to nine individualmonitors, as well as the quarterly EPA PM2.5 FederalReference Method (FRM) audit monitor. The needfor sufficient electrical power was also consideredand separate 20-amp circuits were installed.
Monitor SelectionMonitors for the measurement of PM are either filter-based (manual) or continuous. Filter-basedmethods are FRMs and will not be addressed here.Several continuous PM monitors are available andhave been in use for many years. Two of the mostcommonly used units are the tapered-element oscillating micro-balance (TEOM) manufactured byThermo Environmental and the beta attenuationmonitor (BAM) manufactured by Met One Instru-ments. The Met One BAM 1020 has just recentlyreceived EPA approval as a Federal EquivalentMethod (FEM),4 while the TEOM is currentlyunder consideration for FEM. NCDAQ has severalTEOM 1400A/B units in operation and is currentlyevaluating three BAM 1020 units in a comparisonstudy with collocated FRM and TEOM units.
The gaseous monitors to be used, in particular, areredesigned monitors for SO2, CO, and NOy.These monitors are available from at least two man-ufacturers and are described in detail in the EPAtechnical assistance document.2 These monitors aretermed “trace level” and are capable of measuringsub-parts per billion (ppb) levels of SO2 and NOy andlow parts per million (ppm) levels of CO. Measuringconcentrations at these low levels brings additionalmonitoring and quality control challenges.
An example of one such quality control activity isthe determination of the method detection limit(MDL).2 The MDL determination is required initiallyat deployment and then annually thereafter, andrequires the collection of at least seven data sets ofconcentration values at a level that is approximately
Monitors for themeasurement ofPM are either filter-based or continuous.

26 em february 2009 awma.orgCopyright 2009 Air & Waste Management Association
2.5 to 5 times the noise level of the instrument.The data are to be collected at equally spaced intervals over a period of no less than five days. Ifthe instrument is being used to generate data tosupport the NAAQS requirements, then imposingthis additional quality control requirement may require some logistical adjustment to a normal operating schedule.
Calibration ChallengesGenerating accurate and reproducible low-levelconcentrations of calibration gases can be a chal-lenge. As a result, NCDAQ was required to evaluatethe configuration of our current gas dilution cali-brators as to the selection of the proper mass flowcontrollers (MFCs). One criterion invoked was theselection of properly sized MFCs to be used within5–95% of the operating range. A second criterionwas the selection of MFCs that were compatiblewith our existing calibrators. We selected a 50-stan-dard cubic centimeter per minute (sccm) MFC forthe introduction of the calibration gas and a 20-standard liter per minute (slpm) MFC for the dilu-ent gas (i.e., pollutant-free air). Operating at thelower end of the 50-sccm MFC for the calibrationgas and the upper end of the 20-slpm MFC forthe diluent gas, we were able to consistentlyachieve the low concentration levels required (i.e.,<10 ppb SO2).
To calibrate the gas dilution calibrators, the flowrates generated by the MFCs must be periodically
verified to an accuracy of ±2%. Thus, the identifi-cation of a National Institute of Standards andTechnology (NIST) traceable flow meter was thenext challenge. After an extensive search and tech-nical discussions with various manufacturers,NCDAQ selected electronic, digital mass flow meters (MFMs) with ranges of 0–20 slpm and 0–100 sccm. Additional NIST-certified flow calibra-tion points were requested from the manufacturerto bracket our flow range needs. These electronicMFMs also provide the means to collect and store the resulting flow readings electronically fordownload to a software spreadsheet to provide additional reporting flexibility.
An additional challenge was the generation ofhighly purified pollutant-free air to be used for zeroing the trace-level instruments and preparinggaseous standards with the gas dilution calibrators.The generation of this clean “zero” air is critical tothe operation of the trace analyzers that are to beused with the NCore program. The latest informationprovided by EPA at the most recent Precursor GasWorkshop, June 5–6, 2007,3 states that “zero” airshould contain concentrations of CO, SO2, andNOy that are less than the lower detectable level(LDL) for each instrument. These levels are: 40 ppbfor CO; 0.1 ppb for SO2; and 0.05 ppb for NOy.
Thermo Environmental Model 111 Zero Air generators are currently being used by NCDAQ togenerate a constant supply of purified air for use
Generating accurate and reproducible low-level concentration of calibration gases can be a challenge.
Table 1. Proposed NCore monitor types.
Parameter Comment
PM 2.5 Speciation (PM Fine) Organic and elemental carbon, major ions, trace metals(24-hr average every third day)
PM 2.5 FRM mass (PM Fine) 24-hr average (daily or every third day)
Continuous PM 2.5 mass 1 hr average 24-hr/day/7-day/week
PM (10-2.5) mass (PM Coarse) Waiting for EPA standard
PM (10-2.5) mass (PM Coarse) Speciation Waiting for EPA standard
Carbon Monoxide (CO) Continuous trace-level monitoring (i.e., <1 ppm)
Sulfur Dioxide (SO2) Continuous trace-level monitoring (i.e., < 10 ppb)
Ozone (O3) Continuous monitoring
Total reactive nitrogen oxides (NOy) Continuous trace-level monitoring (i.e., <40 ppb)
Ammonia (NH3) Under consideration
Nitric Acid (HNO3) Under consideration
Surface Meteorology Wind speed and direction, temperature, and relative humidity
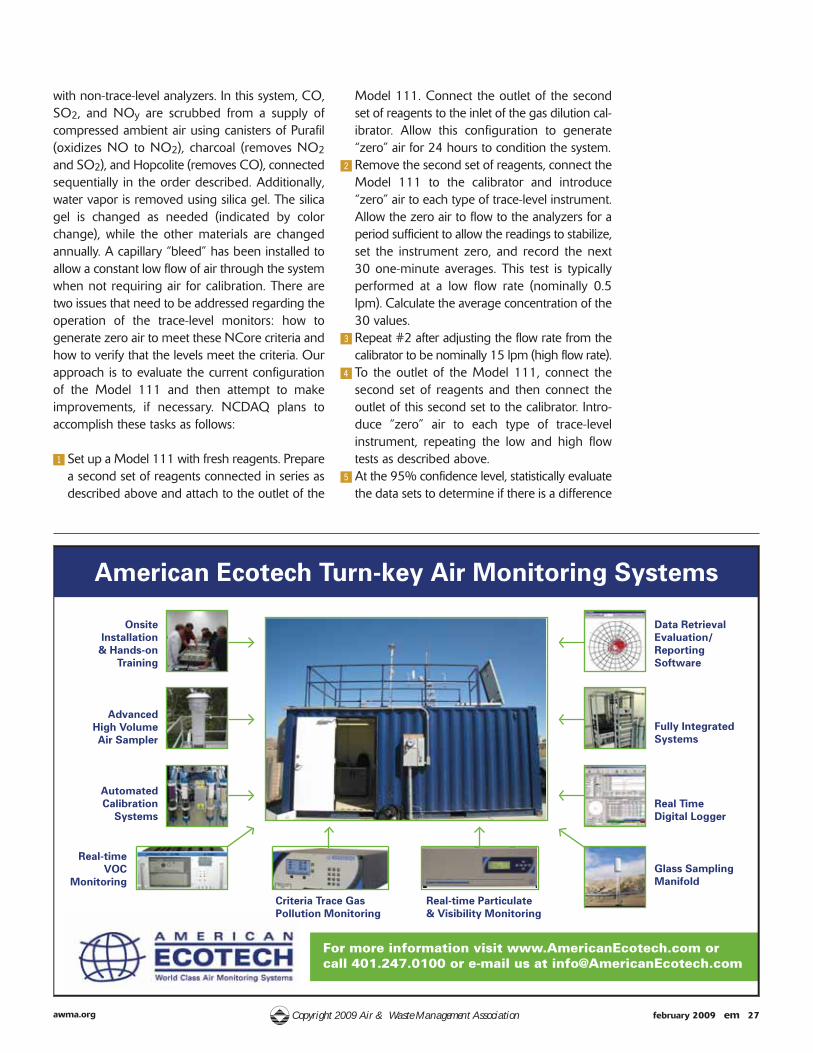
awma.org february 2009 em 27Copyright 2009 Air & Waste Management Association
with non-trace-level analyzers. In this system, CO,SO2, and NOy are scrubbed from a supply of compressed ambient air using canisters of Purafil (oxidizes NO to NO2), charcoal (removes NO2and SO2), and Hopcolite (removes CO), connected sequentially in the order described. Additionally,water vapor is removed using silica gel. The silicagel is changed as needed (indicated by colorchange), while the other materials are changed annually. A capillary “bleed” has been installed toallow a constant low flow of air through the systemwhen not requiring air for calibration. There aretwo issues that need to be addressed regarding theoperation of the trace-level monitors: how to generate zero air to meet these NCore criteria andhow to verify that the levels meet the criteria. Ourapproach is to evaluate the current configurationof the Model 111 and then attempt to make improvements, if necessary. NCDAQ plans to accomplish these tasks as follows:
! Set up a Model 111 with fresh reagents. Preparea second set of reagents connected in series asdescribed above and attach to the outlet of the
Model 111. Connect the outlet of the secondset of reagents to the inlet of the gas dilution cal-ibrator. Allow this configuration to generate“zero” air for 24 hours to condition the system.
@ Remove the second set of reagents, connect theModel 111 to the calibrator and introduce“zero” air to each type of trace-level instrument.Allow the zero air to flow to the analyzers for aperiod sufficient to allow the readings to stabilize,set the instrument zero, and record the next 30 one-minute averages. This test is typicallyperformed at a low flow rate (nominally 0.5lpm). Calculate the average concentration of the30 values.
# Repeat #2 after adjusting the flow rate from thecalibrator to be nominally 15 lpm (high flow rate).
$ To the outlet of the Model 111, connect the second set of reagents and then connect theoutlet of this second set to the calibrator. Intro-duce “zero” air to each type of trace-level instrument, repeating the low and high flowtests as described above.
% At the 95% confidence level, statistically evaluatethe data sets to determine if there is a difference

28 em february 2009 awma.orgCopyright 2009 Air & Waste Management Association
between the two averaged values for singlescrubbing/two flow rates, dual scrubbing/twoflow rates, and single scrubbing versus dualscrubbing. Review the data to determine if dualscrubbing is better than single scrubbing and ifhigher flow rates produce poorer quality “zero” air.
^ Compare the Model 111 (in either single or dualscrubbing mode) zero air to an independentsource. This independent source can be a cylin-der of commercially available “Ultra Pure ZeroAir” with additional scrubbing, such as describedabove, or purified air produced by the NCDAQhydrocarbon lab with similar scrubbing.
& Once it is determined which configuration provides the cleanest air, that system will be designated as the system to be used for the generation of “zero” air at the NCore site andfor conducting performance audits.
Other IssuesEPA recommends that the concentration data generated by the gaseous analyzers be collectedin a digital format. Analog signals are subject tosmall voltage fluctuations as the result of beingnear or exposed to external electromagnetic fields.This can be problematic when trying to measure
A&WMA offers members and nonmembers access to awealth of technical environmental information through itsOnline Library. The library allows users to search, purchase,or download a range of more than 11,000 products offeredby A&WMA, including the latest technical books, CDs, andeducational materials, as well as thousands of papers andarticles from A&WMA conference proceedings, the Journal,and EM.
Below is a sampling of the air quality monitoring technologyinformation that is currently available through A&WMA’sOnline Library.
Visit the Online Library today at secure.awma.org/ OnlineLibrary.
Don’t forget that A&WMA members receive discounts onmost items in the Online Library.
Symposium on Air Quality Measurement Methods and Technology - 2008Published 2008 by A&WMAA&WMA Order Code: CP-178-CD
Ambient Air Pollution by Paolo Zannetti, Dhari Al-Ajmi, Saud Al-RashiedPublished 2007 by EnviroComp InstituteA&WMA Order Code: IMO-162-CD
Fundamentals of Air Pollution, Fourth Edition by Daniel ValleroPublished 2007 by Academic PressA&WMA Order Code: QEP-03
Air Quality Modelling: New Methods for a New Reality—ProceedingsPublished 2004 by A&WMAA&WMA Order Code: VIP-130-CD
Air Quality, 4th Edition by Thad GodishPublished 2004 by CRC PressA&WMA Order Code: DS-157
Air Pollution Control: A Design Approach, Third Edition by C. DavidCooper, F.C. AlleyPublished 2002 by Waveland Press, Inc.A&WMA Order Code: DS-107
Canadian Clean Air Policy ConferencePublished 2002 by A&WMAA&WMA Order Code: VIP-109
Guideline on Air Quality Models Conference: A New BeginningPublished 2001 by A&WMAA&WMA Order Code: VIP-107-CD
Air Pollution Control Technology Handbook by Karl B. Schnelle, Jr.,Charles A. BrownPublished 2001 by CRC PressA&WMA Order Code: DS-90
Air Pollution Engineering Manual by Wayne T. Davis, EditorPublished 2000 by John Wiley & SonsA&WMA Order Code: OTHP-01R
Continuous Emission Monitoring, Second Edition by James JahnkePublished 2000 by John Wiley & SonsA&WMA Order Code: DS-83
Make the Online Library Your First Stop for Air Quality Information!

awma.org february 2009 em 29Copyright 2009 Air & Waste Management Association
concentrations in the low-ppb range. Other ad-vantages of using a digital format include
• monitors can be interconnected using serial cables,thus reducing the amount of wiring;
• instrument diagnostics can be “polled” in additionto concentration data;
• data system values always match the analyzervalues; and
• the layout facilitates remote access capabilities.
ConclusionThe deadline of January 1, 2011, to have theNCore sites operational seems a long way off.However, each state agency should initiate theplanning process and develop a timeline to address
various topics such as site location, site preparation,monitor selection, preparation of quality assuranceplans, and monitor the evaluation and generationof low-ppb concentrations for instrument calibra-tion, as soon as possible. The most valuable lessonslearned to date by NCDAQ have been related tothe operation of the gaseous monitors and the ancillary functions of calibration, calibration verifi-cation, and the generation of “zero” air. We feelcertain that additional information and guidancewill be forthcoming as each state agency and EPA work through these issues over the next twoyears. em
References1. Ambient Air Quality Surveillance. 40 CFR Part 58.2. Technical Assistance Document for Precursor Gas Measurements; EPA-454/R-05-003; U.S. Environmental Protection Agency: Washington, DC,
2005; available online at www.epa.gov/ttn/amtic/precur.html.3. EPA Precursor Gas Workshop: NCore Multi-Pollutant Site Implementation Training, June 5–6, 2007, Research Triangle Park, NC. See
www.epa.gov/ttn/amtic/precur.html.4. Gobeli, G.; Meyer, M.; Schloesser, H.; Pottberg, T. Finally, a Continuous FEM for PM2.5; EM February 2009, 6.
THEENVIRONMENTAL
CHALLENGEINTERNATIONAL
2009
Think you have what it takes to tacklereal-world environmental problems?
How would you handlea garbage disputebetween two cities?
If you’re a college student and you think you’re up to the challenge, take part in the Air & WasteManagement Association’s (A&WMA) Environmental Challenge International!
Here’s how it works. We give you an environmental problem, then you build a team, examine the problem,study the issues, and generate and present a practical solution at A&WMA’s 102nd Annual Conference &Exhibition in Detroit, MI, June 16-19, 2009.
Over $15,000 was awarded to the winning teams last year, so don’t miss your chance to participate!
Visit www.awma.org/ACE2009 to view the problem and register your team.
AcknowledgmentThe authors thank HokeKimball and Dr. Arun Shen-drikar of NCDAQ for theircontinuing work in planningand implementing the vari-ous aspects of this project.

30 em february 2009 awma.orgCopyright 2009 Air & Waste Management Association
em • feature
by John Kinsman and Bill Fang
John D. Kinsman is senior director of environment andWilliam L. Fang is deputygeneral counsel and climateissue director, both with theEdison Electric Institute inWashington, DC. E-mail: [email protected];[email protected].
Regulating Greenhouse GasesUnder the Clean Air ActAn Industry PerspectiveA complicated web of litigation, regu-lation, and legislation is moving forwardthat could lead to the regulation ofgreenhouse gas (GHG) emissions underthe Clean Air Act (CAA). Key decisionsregarding GHG control could be madein 2009 by the new Administration, theU.S. Congress, the courts, and states.
Massachusetts vs. EPAThe U.S. Supreme Court issued its landmark decisionin Massachusetts vs. EPA in April 2007,1 on thetopic of regulating motor vehicle GHG emissions,holding that the U.S. Environmental ProtectionAgency (EPA) must decide whether to make an endangerment finding (i.e., a finding that GHGsare air pollutants that cause or contribute to air pollution that endangers public health or welfare),make a finding of no endangerment, or providesome reasonable explanation as to why it cannot orwill not exercise its discretion. EPA seemingly wason the verge of proposing a finding when Congresspassed, and the President signed into law in December 2007, the Energy Independence andSecurity Act of 2007,2 which set a mandatory renewable fuel standard requiring producers to useat least 36 billion gallons of biofuel in 2022, and anational fuel economy standard of 35 miles pergallon by 2020.
At the same time, there was a growing realizationof the substantial implications for stationary sourcesdue to regulating motor vehicle GHG emissionsunder the CAA. Congress has followed these developments closely. During a March 13, 2008,hearing of the House Select Committee on EnergyIndependence and Global Warming,3 ChairmanEdward J. Markey (D-MA) lamented EPA’s lack ofprogress in responding to the court decision, andnumerous members of Congress have pushed for
a decision since. Seventeen states tried to acceleratean EPA response via a January 23, 2008, letter toEPA,4 and California, plus other petitioners in Massachusetts vs. EPA, filed a “writ of mandamus”petition with the D.C. Circuit Court of Appeals,5
which asked the court to order EPA to make an endangerment finding within 60 days, which thecourt rejected. Subsequently, EPA announced inspring 2008 that it would implement a regulatoryinformation-gathering process through an AdvanceNotice of Proposed Rulemaking (ANPR),6 which isdiscussed below.
California WaiverOn December 19, 2007, EPA AdministratorStephen L. Johnson denied California’s petition fora waiver to set its own carbon dioxide (CO2) limitsfor new automobiles, claiming that California’s climate change situation is not “compelling and extraordinary” compared to that of other states. Afinal notice was published in the Federal Registeron March 6, 2008.7 Members of the Californiacongressional delegation were particularly unhappywith the decision. Led by California, numerousstates have appealed EPA’s decision, which will beheard by the D.C. Circuit Court of Appeals as California vs. EPA (No. 08-1178), with final briefsdue on March 6, 2009.
StatesThe battle over policy-making on GHGs also con-tinues in individual states, particularly regarding thepermitting of new fossil-fuel power plants. For example, on June 30, 2008, a Superior Courtjudge in Georgia ruled that CO2 is “subject to regulation” under the CAA and a Best AvailableControl Technology (BACT) analysis is neededregarding the 1200-MW coal-based Longleafplant.8 Subsequently, the Georgia Court of Appealsagreed to review the ruling. Meanwhile the Governor of Kansas rejected a permit applicationfor expansion of a coal-based plant by Sunflower

awma.org february 2009 em 31Copyright 2009 Air & Waste Management Association
Electric Corp.9 and several environmental groupsare pursuing a well-organized campaign opposingnew plants. On the other hand, some states havefound, echoing EPA, that GHGs are not regulatedunder the CAA. For example, the Arkansas Depart-ment of Environmental Quality granted a draft per-mit for the 600-MW ultra-supercritical coal-basedJohn W. Turk plant,10 which is being appealed.
CongressCongress has held four hearings focused on theCalifornia waiver, Massachusetts vs. EPA, or on thestrengths and weaknesses of regulating GHGsunder the CAA. An April 10, 2008, a hearing of theHouse Subcommittee on Energy and Air Quality11
featured the strong words of Rep. John Dingell (D-MI), who said that if Congress fails to act, law-suits will force EPA to regulate GHGs under theCAA; regulating GHGs under the CAA could causea “glorious mess” and shut down or slow downindustry and the economy; and it would be “insane” to leave this judgment to the long andcomplex regulatory and litigation process, whichcould amount to 100 rulemakings and thus no certainty. Other witnesses claim that, although congressional action would be far preferable, theCAA can be made to work.
Besides its oversight activities, Congress is consideringthe role of the CAA in legislative proposals. For example, the proposed climate change discussiondraft language of Reps. Dingell and Rick Boucher(D-VA)12 would deny the use of National AmbientAir Quality Standards (NAAQS) and hazardous airpollutant (HAPs) CAA provisions to regulate GHGs,while declaring that New Source Review (NSR) andprevention of significant deterioration (PSD) wouldnot apply to GHGs.
Executive Branch, Including EPAThe executive branch is considering the scientificlinks between climate change and air quality, aswell as regulation of GHG under the CAA andother laws.
Studies and reports by EPA and other governmentagencies have identified possible impacts of climatechange on air quality, primarily higher temperaturecausing increased ozone concentrations (e.g., upto 10 parts per billion by 2050), called by some a“climate penalty.”13 There have been calls for statesand EPA to start considering the impacts of climate
change as they develop their strategies for meetingNAAQS, despite the facts that climate change impacts on air quality are uncertain and would besmall in the near term.
EPA is in the process of declining to promulgateGHG performance standards for petroleum refineries and Portland cement plants, although thefinal refinery decision is the subject of several petitions for review before the D.C. Circuit Court ofAppeals.14 In addition, in 2006, EPA declined to seta CO2 New Source Performance Standard (NSPS)for utility and industrial boilers. This decision wasbeing heard by the D.C. Circuit Court of Appeals(No. 06-1322), but, after the Massachusetts vs. EPAdecision, the agency took the rule back on voluntaryremand on September 24, 2007 (with no schedulefor action).15
EPA’s Environmental Appeals Board (EAB)—the finalagency decision-maker on administrative appealsunder all major environmental statutes—is consid-ering several cases involving GHGs and the CAA,most significantly the Sierra Club’s challenge of thePSD permit for the Bonanza plant of DeseretPower Electric Cooperative. Sierra Club challengedEPA Region 8’s decision not to require BACT forCO2 control. On November 13, 2008, the EAB re-manded to Region 8 the permit, finding that theregional office erred in concluding that it was required, as a result of a historical EPA interpretationon this issue, to decide that it had no authority toimpose a BACT limit for CO2. The EAB added that“we recognize that this is an issue of national scopethat has implications far beyond this individual per-mitting proceeding,” and that EPA should considera national response. The EAB also found that “thestatute does not dictate whether the agency mustimpose a BACT limit for CO2 in the permit.”16
EPA Administrator Johnson issued a memorandumon December 18, 2008, to EPA’s Regional Admin-istrators in response to the EAB Deseret decision,finding that the regulatory term “regulated NSR pollutant” and the statutory term “subject toregulation under the Act” apply only for those pollutants subject to actual emission controls requirements under the CAA or EPA regulations.17
As a result, as of December 18, EPA regions andstates could issue PSD permits without consideringBACT for CO2. Numerous environmental groupsfiled a petition for reconsideration, arguing that it is
Congressional action could yieldGHG benefitsmore quickly thanCAA regulation.

32 em february 2009 awma.orgCopyright 2009 Air & Waste Management Association
a de facto final rule that required notice and com-ment rulemaking and that it is not in accordancewith the CAA, and have sought review of thememo by the U.S. Court of Appeals for the Districtof Columbia Circuit.
Other power plant cases involving CO2 control before the EAB include Northern Michigan University(for a 10-MW circulating fluidized-bed boiler), withoral arguments held October 22, 2008; the EPARegion 9 permit for the New Mexico Desert Rockfacility on Navajo land; and the Seminole GeneratingStation in Florida. Among these cases, claims aremade that GHGs already are regulated under theCAA (due to Section 821 monitoring under the1990 CAA Amendments, EPA landfill gas NSPSregulations, EPA approval of a Delaware state airquality plan, and appropriations language that requires EPA to develop an economy-wide GHGemissions registry).18
On July 30, 2008, EPA published in the FederalRegister its ANPR asking for input on regulation ofGHGs under the CAA, with comments due November 28.19 The notice is unique in that it includes comments opposing such action fromother government agencies, such as the Depart-ments of Agriculture, Commerce, Transportation,and Energy, and the Council on EnvironmentalQuality. In a preface, EPA Administrator Johnsonstates that the CAA is “ill-suited for the task of reg-ulating global greenhouse gas emissions.” Someenvironmental groups and academics believe thatalthough congressional action would be far prefer-able, the CAA can be made to work. Industrygroups generally contend that the CAA is thewrong tool for achieving effective GHG regulation,for the reasons described below.
An Industry PerspectiveOnly comprehensive legislation can balance GHGreductions with economic efficiency, funding, andincentives for technology development, and avoidany overlap among multiple federal statutory authorities and state climate law and policies.Congressional action could yield GHG benefitsmore quickly than CAA regulation, given the longtime frames necessary to complete all aspects ofCAA regulation and the certainty of long litigation-related delays. Furthermore, if CAA regulation wereless flexible than congressional legislation, it couldcause increased global GHG emissions by forcing
energy-intensive industries to shift operations tocountries that have no mechanism for regulatingGHGs, or that use energy less efficiently. Also, reg-ulations under the CAA likely would not providethe certainty needed to make the enormous investments needed to bring about emissions reductions, because they would rely on uncertain,novel interpretations of the CAA to bring aboutpreferred outcomes.
Regulating GHGs under CAA stationary source(Title I) programs has many uncertainties and pitfalls. For example, regarding NAAQS, this approach makes little sense for GHGs becausestates have little or no control over the level ofGHGs in the atmosphere, and thus no control overtheir ability to attain compliance with a NAAQS.Further, the NAAQS attainment deadlines wouldbe unworkable for GHGs, and the standard-settingprocess does not allow for costs and feasibility tobe considered when setting the standards. If thisapproach were to be pursued, setting only a secondary NAAQS would be more scientificallyjustified and allow greater regulatory flexibility.
Regarding NSPS, this approach would not applyeconomy-wide, meaning that EPA’s response wouldbe only partial and would not likely achieve theleast-cost GHG reductions. Section 111 regulationscould lead to very costly controls because EPA hasstated that systems need not be actually in use orachieved in practice at potentially regulated sourcesor even at a commercial scale. Further, when considering efficiency improvements, EPA ignoresthe fact that such activities would trigger the CAA’sNSR requirements. If such problems could be min-imized, the NSPS approach shows the greatestpromise if implemented in a cap-and-trade manner.Regarding HAPs, of all of the primary stationarysource control programs in Title I, Section 112 carries the most inflexible and stringent requirementsfor regulated sources.
Were EPA to regulate GHGs under any major provision of the CAA, the domino effect implicationsunder the PSD and NSR nonattainment programslikely would be severe. There would be an enormousincrease in the number of construction and modi-fication activities that would trigger PSD review,with tremendous manpower and financial burdenson permit applicants and on state and local permittingauthorities. Further, it is not clear what would be
The NSPS approach showsthe greatest promise if implemented in a cap-and-trademanner.

awma.org february 2009 em 33Copyright 2009 Air & Waste Management Association
considered BACT for GHG purposes. Similarly, application of Title V monitoring and permitting requirements to sources based on their GHG emis-sions would create similar administrative problemsas in the PSD context. In addition, regarding TitleV fees, revenues would be grossly excessive forwhat is needed to process permits for GHG sources.Although EPA discusses several regulatory optionsfor mitigating some of the effects, the agency’slegal theories are uncertain and would be challenged in court.
2009 and BeyondThe future holds great uncertainty regarding howGHGs will be dealt with under the CAA. EPAunder the Administration of President Obama willhave the tasks of evaluating the public commentson the ANPR and responding to the Massachusettsvs. EPA decision regarding endangerment. An advisor to President Obama has been reported tosupport regulation of GHGs under the CAA ifCongress has not acted within 18 months. Presi-dent Obama also reportedly would grant the California waiver. EPA could consider regulatingsectors such as petroleum refiners, cement kilns,and power plants using NSPS and could reconsider
its interpretive memorandum in response to theEAB Deseret decision. The EAB will hear additionalcases involving GHG regulation under the CAA. Ifand when GHGs are regulated under the CAA, newand modified sources could be affected almostimmediately under PSD requirements, and soonthereafter through Title V permitting requirements.
Meanwhile, Congress will consider legislation thatwill be linked to the CAA in unknown ways. Westrongly believe that comprehensive federal legis-lation is preferable to the use of the CAA for accomplishing our nation’s climate goals, becausewell-designed climate legislation can considerGHG emissions reductions economy-wide withinthe context of the current and projected economicsituation, the availability of technology, the reliabilityof the country’s power sector and energy supply,and other relevant factors that do not readily fit ina CAA context.
Finally, with continued federal uncertainty, statesand regions will take regulatory and legislative actions further addressing GHGs on a patchworkbasis, with fossil-fuel power plants among the mostlikely affected regulated entities. em
References1. The State of Massachusetts et al. vs. U.S. Environmental Protection Agency, U.S. Supreme Court No. 05-1120. Argued November 29, 2006—
Decided April 2, 2007. See www.supremecourtus.gov/opinions/06pdf/05-1120.pdf.2. Energy Independence and Security Act of 2007, Pub.L. 110-140, December 2007.3. Select Committee on Energy Independence & Global Warming hearing, “Massachusetts vs. U.S. EPA Part II: Implications of the Supreme Court
Decision,” March 13, 2008. See http://globalwarming.house.gov/pubs/?id=0033.4. See http://ag.ca.gov/cms_attachments/press/pdfs/n1518_johnson_letter_draft.pdf for a copy of the letter, dated January 23, 2008.5. See www.mass.gov/?pageID=cagopressrelease&L=1&L0=Home&sid=Cago&b=pressrelease&f=2008_05_27_epa_reply_brief&csid=Cago for
press release announcing the petition.6. Advance Notice of Proposed Rulemaking: Regulating Greenhouse Gas Emissions under the Clean Air Act; EPA-HQ-OAR-2008-0318; U.S. Envi-
ronmental Protection Agency: Washington, DC, July 11, 2008. See www.epa.gov/climatechange/anpr.html.7. California State Motor Vehicle Pollution Control Standards; Notice of Decision Denying a Waiver of Clean Air Act Preemption for California’s 2009
and Subsequent Model Year Greenhouse Gas Emission Standards for New Motor Vehicles. Final Notice; Fed. Regist. 2008, 73 (45), 12156-12169. See http://edocket.access.gpo.gov/2008/E8-4350.htm.
8. Longleaf Energy Associates vs. Friends of the Chattahoochee, Docket No. OSAH-BNR-AQ-0732139-60, Georgia Superior Court, June 30, 2008.See www.osah.ga.gov/documents/longleaf.pdf.
9. Swanson, E. Energy Debate, Round 2: Kansas Legislature Likely to Consider Coal-Fired Plants Again This Year; Dodge City Daily Globe, January 7, 2009. See www.dodgeglobe.com/localnews/x497780053/Energy-debate-round-2.
10. See www.adeq.state.ar.us/ftproot/Pub/commission/p/08-006-P%20AEP%20Service%20Corp.%20&%20SWEPCO-Sierra%20Club%20&%20Audubon(Consolidated)/2008-12-01_Exhibit_2_ADEQ_Response_to_Comments.pdf.
11. House Subcommittee on Energy and Air Quality hearing, “Strengths and Weaknesses of Regulating Greenhouse Gas Emissions Using ExistingClean Air Act Authorities,” April 10, 2008. See http://energycommerce.house.gov/index.php?option=com_content&task=view&id=199.
12. Climate Change Draft Legislation, dated October 7, 2008. See http://energycommerce.house.gov/index.php?option=com_content&task=view&id=953.13. See http://es.epa.gov/ncer/science/globalclimate/02_22_07_event.html.14. Environmental Integrity Project vs. EPA, Nos. 08-1279, 08-1281 (D.C. Cir. 2008).15. See http://ag.ca.gov/globalwarming/pdf/steam_generating_units.pdf.16. See http://yosemite.epa.gov/oa/EAB_Web_Docket.nsf/PSD%20Permit%20Appeals%20(CAA)/ C8C5985967D8096E85257500006811A7/
$File/Remand...39.pdf.17. See http://edocket.access.gpo.gov/2008/pdf/E8-31114.pdf.18. More information on each of the cases currently before the U.S. Environmental Protection Agency’s Environmental Appeals Board can be found
online at www.epa.gov/eab/.19. Advance Notice of Proposed Rulemaking: Regulating Greenhouse Gas Emissions under the Clean Air Act; Fed. Regist. 2008, 73, 44354 (July
30, 2008). See http://edocket.access.gpo.gov/2008/pdf/E8-16432.pdf.
Were EPA to regulate GHGsunder any majorprovision of theCAA, the dominoeffect implicationslikely would be severe.
34 em february 2009 awma.orgCopyright 2009 Air & Waste Management Association
em • inside the industry
How to Recession-ProofYour BusinessNews about the economy seems to get worse by the day. In the latest bit of dismal news, reportsare circulating that today’s recession is the longest—and most severe—the United States has seensince the end of World War II. To avoid setting a new record, recovery would need to take rootby this coming May, and the latest forecasts make that scenario an unlikely one. Commercial realestate transactions are forecast to be down one-third below 2008 levels, property values continueto fall, record-high job losses are being posted, and there’s virtually no credit being extended toanyone. 2009 could turn out to be one of the toughest years we’ve faced in the environmentalconsulting world in a long time, and there’s unfortunately not much we can do about it. What’san environmental consultant to do? Either sit around lamenting how slow business is, or focus onthe things we can control. Below is a list of tips for surviving the recession and positioning yourfirm for growth.
Increase Client OutreachConsulting is above all a relationship-driven business.That means you’ve got to actively cultivate meaningfulrelationships with a great deal of personal outreach bybeing there for your clients, touching base periodically,and bringing value to your communications. You can dothis in any of a number of ways, including sending arti-cles of interest on key industry topics, alerting clients toupcoming webinars or conferences, and sharing new expertise that you or your firm have obtained. This typeof communication can be much more valuable in today’s market than just picking up the phone to ask anold client, “Do you have any work for me?” Also, whenthe market does pick back up again (and it will…it always does), there’s a good chance clients will rememberyou for reaching out in an informative way during thedownturn.
Find the Bright SpotsThere are a number of environmental issues that aregaining momentum right now. At the top of the list areclimate change, energy efficiency, and greenhouse gasemission reductions. Recent studies indicate that com-panies that score well on various environmental metricsalso demonstrate above-average return on investmentand stock performance. So, even as the U.S. governmentrecently failed to pass legislation limiting carbon
emissions, U.S. companies, led by giants like GeneralElectric, Wal-Mart, Google, and DuPont Chemical, havebeen launching new green initiatives. Environmentalconcerns have suddenly emerged as a dominant driverof global corporations, signaling a new level of seriousnessabout “sustainability,” which opens up myriad opportu-nities for environmental consultants.
Green building and Leadership in Energy and Environ-mental Design (LEED) certification is another area gettinga great deal of attention. More than 100 cities alreadyhave their own climate change/green building initiatives,approximately half of which have specific green buildingrequirements. What this means to your clients is that if they are refinancing or buying a building, they need to pay attention to whether the building complies withapplicable local green building initiatives. Opportunitiesare already emerging for consultants to verify LEED principles and LEED certification strategies for builders,lenders and investors; analyze the financial impact of LEEDcertification; provide professional opinions on sustain-ability features of buildings and the cost to maintain performance; and provide compliance assistance relatedto local “green” codes and ordinances. Now is the timeto build expertise in new areas so that your firm has theskill set it needs to stay competitive as new markets gaintraction. A number of consultants are pursuing LEED
by Anthony Buonicoreand Dianne Crocker
Anthony J. Buonicore,P.E., DEE, QEP, is chairmanand CEO of the BuonicoreGroup, a real estate andenvironmental risk management consultingcompany. E-mail: [email protected] P. Crocker ismanaging director of theMarket Research Group at Environmental Data Resources Inc. (EDR) inMilford, CT. E-mail:[email protected].

awma.org february 2009 em 35Copyright 2009 Air & Waste Management Association
accreditation so that they possess the skills necessary tomeet client needs in these areas.
Reactivate Past ClientsIt’s likely that you have clients whom you have workedwith once and then never had contact with again. And itmay not be because the client was dissatisfied with yourservice. Instead, those clients may not be aware of theother services you have to offer that they could use. E-newsletters can be an extremely effective way of keep-ing past, present, and even future clients up to date onwhat your company is doing, the latest trends impactingtheir business, and new areas of expertise.
Avoid Competing on PriceIn a recession, price competition becomes even morepronounced. Avoid playing this game at all costs. Stackthe cards in your favor by being unique in a way thatclients value. It could be that you’re the only consultantin the area offering a one-stop shop or who can guaranteeresults on a quick turnaround or offer some specializedlocal expertise. Maybe you have stellar referrals frompast clients that your competitors do not. Whatever it is,make your offer unique and don’t compete on price.Once you lower your prices, it is very difficult to raisethem when the market recovers.
Engage Existing EmployeesWhen business is down, it can be tempting to cut laborcosts by laying off staff. This should be done as an absolute last-resort measure. Do everything you can tomake sure employees are engaged and committed totheir job despite the tough economic climate. Focus yourlimited resources on keeping and rewarding key talent.These are the people you need most now to get youthrough the difficult times. When the market improves,your firm will need to be able to meet clients’ demandswithout having to go out looking for qualified staff to fillpositions vacated during the recession.
Keep Recruiting Quality ConsultantsSimilarly, maintain your recruitment stance during therecession. You may not be actively looking for new hires,but if you discover excellent candidates, it still mightmake sense to recruit. Plus, you want your staff andprospective new hires to view your firm as a successfullygrowing one, even during difficult times.
Resist the Temptation to Slash MarketingThe economy is going to continue to struggle. This
means fewer projects overall being fought over by thesame number of consulting firms. Stealing market shareaway from the competition should therefore be your primary focus. If you stop marketing altogether, yourfirm will not be noticed. Do everything you can to makemarketing efforts more efficient and cost effective. And,give priority to plans designed to generate short-termrevenue, as well as position the firm for longer term opportunities.
Get Linked-InThere are a number of business networking sites in allkinds of fields, including real estate, architecture, and environmental consulting. It’s a free way to get yourname out there, get in touch with prospective clients,and keep up with market trends. The best thing aboutthem is that they’re typically free. They merely requiresome upfront time to connect with other professionals,prospective clients, and industry insiders.
Unless your company is already recession-proof, theseare some things you should be thinking about now tokeep it going. It will be time well spent! em
EM readers are industry leaders with buying
power. Contact Malissa Goodman at
412-904-6012, to find out how advertising
in EM can get your company the
exposure it needs in 2009.
REACH OVER
8,500ENVIRONMENTALPROFESSIONALSEACH MONTH!
Now is the time to build expertisein new areas likeLEED to stay competitive.

36 em february 2009 awma.orgCopyright 2009 Air & Waste Management Association
em • it insight
We use smart phones and handheld devices to stay connected when out of the office and flashdrives to take files on the road. We log onto wireless networks and routinely back up notebookcomputers onto small, portable hard drives. We export data from enterprise databases to spread-sheets for further analysis or reporting. We want information at hand 24/7 for decision support,yet the technologies that make it accessible can let sensitive information leave the organization.Information security, part of a growing strategic initiative called “data governance,” is a top business priority.
A Fine BalanceInformation technology (IT) lets us work and col-laborate in ways that we could not have imaginedjust a few years ago. Networks, hardware, and soft-ware provide anytime, anywhere access and dataportability. We use networks to deploy, access, anduse information, software applications, and re-sources. The amount of information grows eachyear, and we extend access to users within and out-side of our organizations. Good data governancerequires increased diligence in protecting informa-tion. The challenge is to provide access to infor-mation, applications, and systems, while balancingthe acceptable level of risk and optimizing costs(see Figure 1).
Enterprise information is a precious commoditythat helps businesses gain competitive advantage.Likewise, IT can provide an advantage. As envi-ronment, health, and safety (EH&S) managers, aswith other business functions, we must protect information assets from security vulnerabilities. Wewant to avoid threats such as e-discovery, businessinterruption, fines, and other legal actions that canresult from information theft or loss.
Leaky PipesThink of information management as a system ofreservoirs and pipes to deliver data when someoneturns on the tap. Then consider that parts of thesystems are not on a preventive maintenanceschedule, so leaks may occur. Further, system usersmay fill a “to-go cup” with some of the information.
Most organizations suffer from “data leakage,”much of it unintentional. Data leakage can occurwhen notebook computers, smart phones, andother portable gadgets are lost or stolen. Data leak-age can result from transporting data on CDs, flashdrives, and portable hard drives or transposingdata from one system to another. Portable datastorage—particularly unsecured devices—opens the door to e-discovery (see IT Insight “E-Discovery Rules Reach Beyond Litigation,” EMAugust 2007, p. 24).
TransparencyThousands of internal and external EH&S compli-ance requirements call for good data governance—or, to put it in terms that EH&S professionalsunderstand, managing information from cradle tograve. We must know where the information resides, who has access to it, who modifies it andwhen, and what is reported. We strive for total datatransparency (i.e., a single version of the truth).Common practices like using spreadsheets andone-off databases, using local hard drives, portablehard drives, and flash drives defeat transparency.
Potential business risk from data leakage makes agood case for using secure enterprise software. Information resides in a single database armed withsecurity, backup, and recovery measures. Peoplewho need to access the information are issued auser ID and password. This works well, until some-one decides to export data from the enterprise application to a spreadsheet. With today’s robust
awma.org
Balancing Business Needsand Information Security
by Jill Barson Gilbert
Jill Barson Gilbert, QEP,is president of Lexicon Systems, LLC. E-mail:[email protected].

awma.org february 2009 em 37Copyright 2009 Air & Waste Management Association
ad hoc reporting tools and dashboards, this shouldnot be necessary.
E-mail, Internet, and the World Wide WebA 2005 study by research company IDC foundthat Web browsing is the single largest threat to information security. An EH&S professional’s dailyroutine includes the Internet. We try to access aWeb site, only to have it blocked. We find an articlethat can be viewed, but not downloaded. As longas software contains security vulnerabilities, hackerswill continue to generate malware. As viruses, Trojans, and other malware make enterprise infor-mation vulnerable to theft or attack, we have security software in place.
Keeping up with malware—generally conveyed viae-mail, the Internet, and the World Wide Web—isan uphill struggle. An entire industry exists, whosepurpose is to identify malware, write programs tocombat it, and distribute malware databases daily.Computer Associates, McAfee, and Symantec aresome of the vendors who combat malware.
Until recently, the chief method to address theissue was to “blacklist” identified threats. This reac-tive approach has limitations; its effectiveness de-pends on identifying the malware before it invadescomputers and networks. Today, several vendorssell “whitelisting” software that takes a proactive approach (see sidebar “Malware 101” opposite).
Data Governance Helps Manage RiskSound data governance is the best way to managerisk associated with information. Organizationsmust develop, implement, and enforce data governance policies and procedures. They musteducate staff—particularly those who access the information—about information access and security.And organizations must keep physical security,hardware, and software controls up to date. It doesnot matter how good your information security solutions are, unless they are active, up-to-date, andtheir use is enforced.
The Information Age and its technical capabilitieshave inherent risks. EH&S professionals must im-plement and enforce data governance policies andprocedures to manage these risks, while balancingthe needs of different stakeholders to access andshare information. em
awma.org
Malware 101Malware is not defective software, but software developed for malicious purposes. Here are a few common terms:
Malware: short for malicious software, a program or file designed to damageor disrupt a system, such as a virus, worm, or a Trojan horse. A general termused by computer professionals to mean a variety of forms of hostile, intrusive,or annoying software or program code, computer viruses, worms, Trojanhorses, most rootkits, spyware, dishonest adware, crimeware, and other malicious and unwanted software.
Computer virus (virus): a computer program that can copy itself and infecta computer without permission or knowledge of the user. Viruses usuallycorrupt or modify files on a targeted computer.
Trojan horse (Trojan): malware that appears to perform a desirable functionbut, in fact, performs undisclosed malicious functions. A worm or a virusmay be a Trojan horse.
Computer worm (worm): a self-replicating computer program that uses anetwork to send copies of itself to other computers on the network, possiblewithout user intervention. A worm does not need to attach itself to an existingprogram and usually causes harm to the network, if only by consumingbandwidth.
Antivirus software: tracks and quarantines harmful objects based uponblacklisting and active scanning for known threats and suspicious behavior.
Blacklisting: an IT security approach where a “black list” identifies bannedapplications and other executable programs.
Whitelisting: an IT security approach where a “white list” identifies safe applications and executables.
Figure 1. IT must address multiple, often conflicting, business goals.Source: Sun Microsystems Inc., The Complete Buyer’s Guide for Identity Management, October 2008.

38 em february 2009 awma.orgCopyright 2009 Air & Waste Management Association
em • annual conference preview
ACE 2009 is the perfect place to do all of thesethings while also having a great time! The YP andstudent programs for 2009 have just the right mixof intensive technical sessions and courses, and relaxed social and networking events. Whetheryou’re looking for career advice, technical knowledge,or a new contact or two, ACE is the place to be in June.
Get RecognizedExceptional students and YPs have manyopportunities at ACE to be rewarded for their work.Each year, a deserving YP is awarded the Out-standing Young Professional Award at the annualHonors and Awards Luncheon. Master’s anddoctoral students can participate in the PlatformPaper Award program, and be nominated for thefirst-ever Master’s and Doctoral Thesis Awards.
Undergraduate, master’s, and doctoral students canparticipate in the Student Poster Contest, and build
their professional portfolios and win great prizes byparticipating in one of ACE’s most exciting events, theEnvironmental Challenge International (ECi), a teamcompetition that asks student teams to develop amultidisciplinary solution to a “real-life” environmentalissue. This year’s ECi asks student teams to solve agarbage dispute between two dueling cities. If youthink you’re up to the challenge, visit www.awma.org/ACE2009 to find out more about this problem. OverUS$15,000 in prize money was awarded last year,so don’t miss your chance to participate!
Advance Your CareerCareers and job opportunities are always on theminds of YPs and students hoping to break intothe field. With the worldwide economic instabilityimpacting all job markets, networking and seekingadvice from professionals has taken on renewedimportance. ACE is a great place to gain valuablecareer advice and to make connections that couldlead to jobs in the future.
Students and Young Professionals:ACE Is the Place to be in June!
Need assistancefunding your trip?Help A&WMA andwork as a sessionmonitor to receivediscounted conferencerates. Visit the ACEWeb site for moreinformation or todownload the monitorregistration form.www.awma.org/ACE2009
A&WMA’s 2009 Annual Conference & Exhibition (ACE) is the perfect place forstudents and young professionals (YPs) to get the latest technical informationand have their voices heard by industry leaders and A&WMA leadership. Inthese uncertain economic times, there has never been a more urgent need forcurrent and future environmental professionals to network with colleagues inthe field, present and publish work, and further their professional education.
Driving Environmental Progress: What Can Students Do?A&WMA’s High School Essay Contest
A&WMA’s 2009 High School Essay Contest gives students nationwide in grades 9–12 the chance toshare their thoughts on environmental issues and win great prizes. Essays can be up to six pagesin length, and should describe the role that students can play in driving environmental progress.
The author of the best essay will win US$400, receive a first-place certificate, and have an excerpt of their essay published in EM. Awards will be announced during the Student Awards Ceremony and Reception at ACE.
Essays are due on Earth Day, April 22, 2009. Visit www.awma.org/go/essaycontest09 for more information.

awma.org february 2009 em 39Copyright 2009 Air & Waste Management Association
If you’re looking for personalized advice, bringyour resume to the conference and join Julie Sharp,an associate professor at Vanderbilt University, for aresume critique. YPs are invited to attend “ShiftingGears—A YP Panel Discussion on Career Options,”and to join a career coach and a panel of youngprofessionals. Hear personal stories from profes-sionals who have changed careers as they sharethe positive and negative aspects of making thejump. Throughout the week there are plenty of opportunities for students and YPs to mingle withseasoned veterans and exchange career adviceand business cards.
Don’t Forget to Have FunThough we encourage attendees to soak in asmuch technical information as possible during theconference, we know that attending your choice ofthe over 500 technical sessions offered at ACE canget overwhelming. Make sure that you get all ofthe technical information you came for, while alsomaking time to kick back and relax with yourpeers. This year’s conference offers plenty of funsocial opportunities for all attendees, includingsome designed just for students and YPs!
• End a busy day at ACE and join your fellow students and YPs for dinner and drinks at one ofDetroit’s finest brew pubs, the Detroit Beer Com-pany, located in the heart of the theatre and sta-dium district. Relax and mingle with your peersfrom around the world while enjoying some ofthe local flavor of Detroit.
• Another exciting event just for students and YPsis the kayak tour through the Rouge River. Offered on Monday and Friday, this seven-mile
excursion will give participants a unique view ofthe Ford Rouge Plant, Zug Island, and other localindustrial sites.
These are just a sampling of the events offered atACE, so be sure to visit www.awma.org/ACE2009to find out more about this year’s conference. em
Save on expenses and time in 2009 – Attend oneof A&WMA’s e-learning courses and enhance yourprofessional knowledge from the comfort of yourown home or office!
A&WMA’s e-learning courses run throughout theyear and cover a wide range of timely industrytopics. Courses include:
• Boilers, Process Heaters, and Air QualityRequirements
• NOx Control for Industrial and Utility Applications• Environmental Practices Review• Internal Environmental Auditor
www.awma.org/go/e-learning
Relax and minglewith your peersfrom around the world while enjoying some of the local flavorof Detroit.
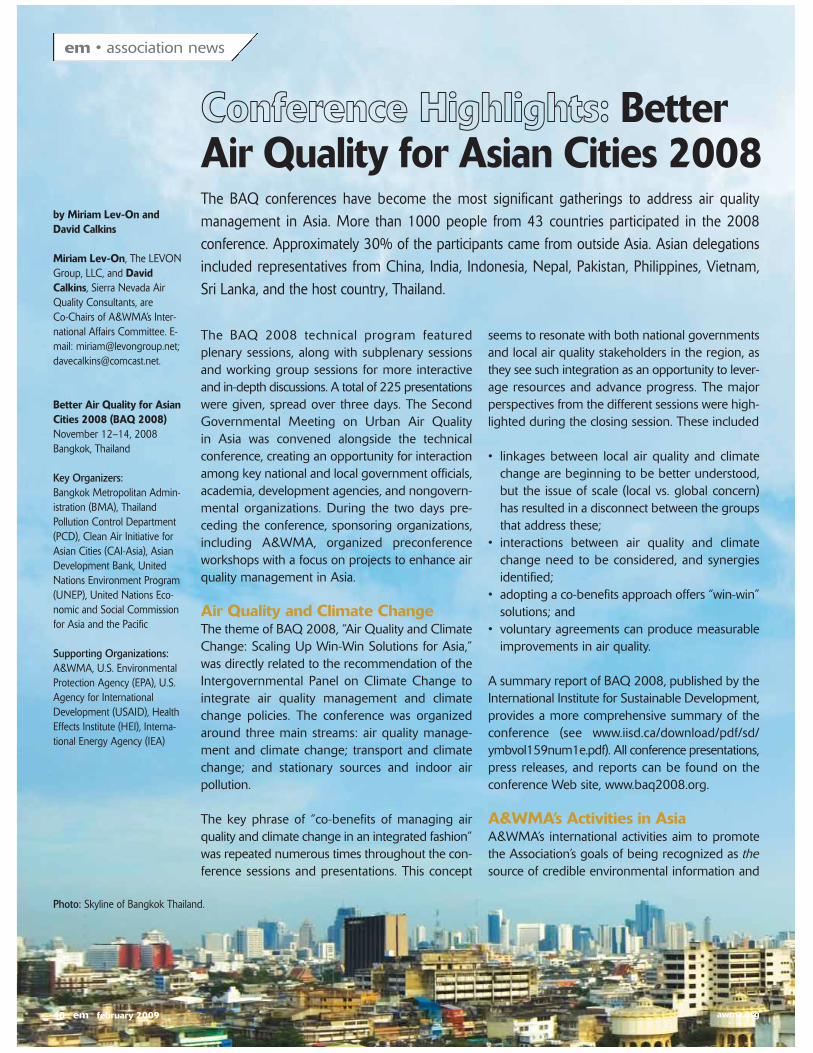
em • association news
The BAQ conferences have become the most significant gatherings to address air quality management in Asia. More than 1000 people from 43 countries participated in the 2008 conference. Approximately 30% of the participants came from outside Asia. Asian delegationsincluded representatives from China, India, Indonesia, Nepal, Pakistan, Philippines, Vietnam, Sri Lanka, and the host country, Thailand.
The BAQ 2008 technical program featured plenary sessions, along with subplenary sessionsand working group sessions for more interactiveand in-depth discussions. A total of 225 presentationswere given, spread over three days. The SecondGovernmental Meeting on Urban Air Quality in Asia was convened alongside the technical conference, creating an opportunity for interactionamong key national and local government officials,academia, development agencies, and nongovern-mental organizations. During the two days pre-ceding the conference, sponsoring organizations,including A&WMA, organized preconferenceworkshops with a focus on projects to enhance airquality management in Asia.
Air Quality and Climate ChangeThe theme of BAQ 2008, “Air Quality and ClimateChange: Scaling Up Win-Win Solutions for Asia,”was directly related to the recommendation of theIntergovernmental Panel on Climate Change to integrate air quality management and climatechange policies. The conference was organizedaround three main streams: air quality manage-ment and climate change; transport and climatechange; and stationary sources and indoor air pollution.
The key phrase of “co-benefits of managing airquality and climate change in an integrated fashion”was repeated numerous times throughout the con-ference sessions and presentations. This concept
seems to resonate with both national governmentsand local air quality stakeholders in the region, asthey see such integration as an opportunity to lever-age resources and advance progress. The majorperspectives from the different sessions were high-lighted during the closing session. These included
• linkages between local air quality and climatechange are beginning to be better understood,but the issue of scale (local vs. global concern)has resulted in a disconnect between the groupsthat address these;
• interactions between air quality and climatechange need to be considered, and synergiesidentified;
• adopting a co-benefits approach offers “win-win”solutions; and
• voluntary agreements can produce measurableimprovements in air quality.
A summary report of BAQ 2008, published by theInternational Institute for Sustainable Development,provides a more comprehensive summary of theconference (see www.iisd.ca/download/pdf/sd/ymbvol159num1e.pdf). All conference presentations,press releases, and reports can be found on theconference Web site, www.baq2008.org.
A&WMA’s Activities in AsiaA&WMA’s international activities aim to promotethe Association’s goals of being recognized as thesource of credible environmental information and
40 em february 2009 awma.org
Conference Highlights: Better Air Quality for Asian Cities 2008
by Miriam Lev-On andDavid Calkins
Miriam Lev-On, The LEVONGroup, LLC, and DavidCalkins, Sierra Nevada AirQuality Consultants, are Co-Chairs of A&WMA’s Inter-national Affairs Committee. E-mail: [email protected];[email protected].
Better Air Quality for AsianCities 2008 (BAQ 2008)November 12–14, 2008Bangkok, Thailand
Key Organizers:Bangkok Metropolitan Admin-istration (BMA), Thailand Pollution Control Department(PCD), Clean Air Initiative forAsian Cities (CAI-Asia), AsianDevelopment Bank, United Nations Environment Program(UNEP), United Nations Eco-nomic and Social Commissionfor Asia and the Pacific
Supporting Organizations:A&WMA, U.S. EnvironmentalProtection Agency (EPA), U.S.Agency for International Development (USAID), HealthEffects Institute (HEI), Interna-tional Energy Agency (IEA)
Photo: Skyline of Bangkok Thailand.
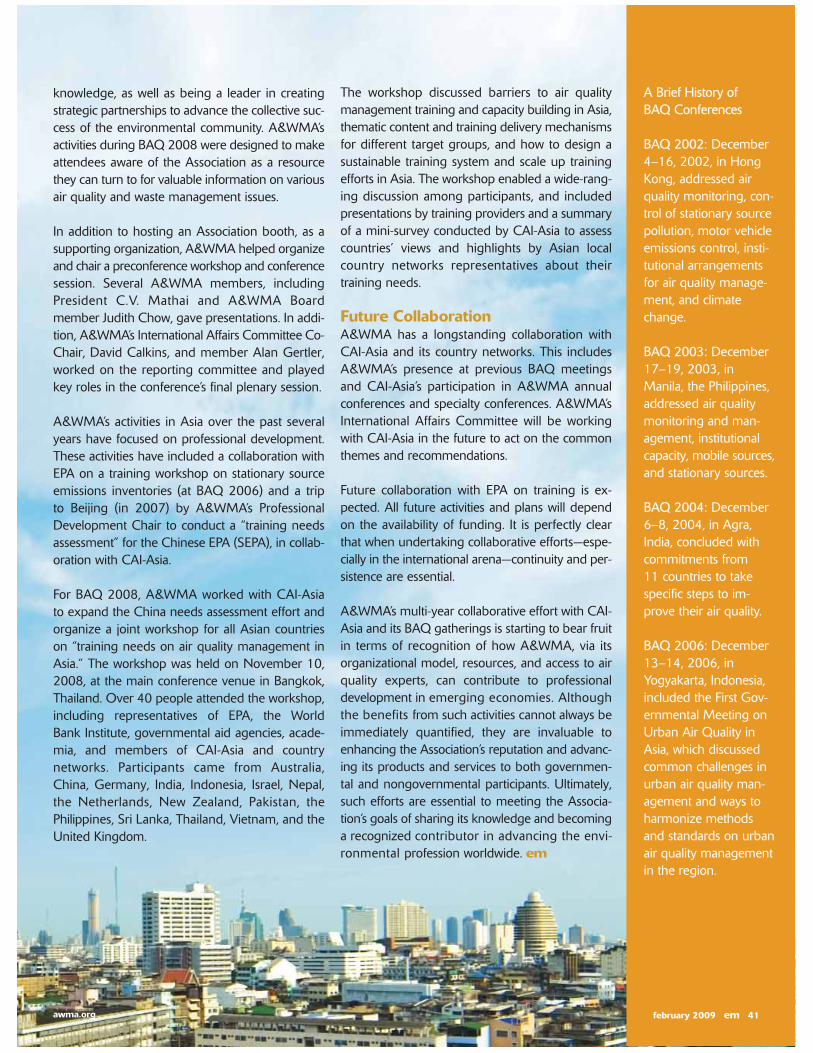
knowledge, as well as being a leader in creatingstrategic partnerships to advance the collective suc-cess of the environmental community. A&WMA’sactivities during BAQ 2008 were designed to makeattendees aware of the Association as a resourcethey can turn to for valuable information on variousair quality and waste management issues.
In addition to hosting an Association booth, as asupporting organization, A&WMA helped organizeand chair a preconference workshop and conferencesession. Several A&WMA members, includingPresident C.V. Mathai and A&WMA Board member Judith Chow, gave presentations. In addi-tion, A&WMA’s International Affairs Committee Co-Chair, David Calkins, and member Alan Gertler,worked on the reporting committee and playedkey roles in the conference’s final plenary session.
A&WMA’s activities in Asia over the past severalyears have focused on professional development.These activities have included a collaboration withEPA on a training workshop on stationary sourceemissions inventories (at BAQ 2006) and a trip to Beijing (in 2007) by A&WMA’s Professional Development Chair to conduct a “training needsassessment” for the Chinese EPA (SEPA), in collab-oration with CAI-Asia.
For BAQ 2008, A&WMA worked with CAI-Asia to expand the China needs assessment effort andorganize a joint workshop for all Asian countrieson “training needs on air quality management inAsia.” The workshop was held on November 10,2008, at the main conference venue in Bangkok,Thailand. Over 40 people attended the workshop,including representatives of EPA, the World Bank Institute, governmental aid agencies, acade-mia, and members of CAI-Asia and country networks. Participants came from Australia, China, Germany, India, Indonesia, Israel, Nepal, the Netherlands, New Zealand, Pakistan, the Philippines, Sri Lanka, Thailand, Vietnam, and the United Kingdom.
The workshop discussed barriers to air qualitymanagement training and capacity building in Asia,thematic content and training delivery mechanismsfor different target groups, and how to design asustainable training system and scale up trainingefforts in Asia. The workshop enabled a wide-rang-ing discussion among participants, and included presentations by training providers and a summary of a mini-survey conducted by CAI-Asia to assesscountries’ views and highlights by Asian local country networks representatives about their training needs.
Future CollaborationA&WMA has a longstanding collaboration withCAI-Asia and its country networks. This includesA&WMA’s presence at previous BAQ meetingsand CAI-Asia’s participation in A&WMA annualconferences and specialty conferences. A&WMA’sInternational Affairs Committee will be workingwith CAI-Asia in the future to act on the commonthemes and recommendations.
Future collaboration with EPA on training is ex-pected. All future activities and plans will dependon the availability of funding. It is perfectly clearthat when undertaking collaborative efforts—espe-cially in the international arena—continuity and per-sistence are essential.
A&WMA’s multi-year collaborative effort with CAI-Asia and its BAQ gatherings is starting to bear fruitin terms of recognition of how A&WMA, via its organizational model, resources, and access to airquality experts, can contribute to professional development in emerging economies. Althoughthe benefits from such activities cannot always beimmediately quantified, they are invaluable to enhancing the Association’s reputation and advanc-ing its products and services to both governmen-tal and nongovernmental participants. Ultimately,such efforts are essential to meeting the Associa-tion’s goals of sharing its knowledge and becominga recognized contributor in advancing the envi-ronmental profession worldwide. em
awma.org february 2009 em 41
A Brief History of BAQ Conferences
BAQ 2002: December4–16, 2002, in HongKong, addressed airquality monitoring, con-trol of stationary sourcepollution, motor vehicleemissions control, insti-tutional arrangementsfor air quality manage-ment, and climatechange.
BAQ 2003: December17–19, 2003, inManila, the Philippines,addressed air qualitymonitoring and man-agement, institutionalcapacity, mobile sources,and stationary sources.
BAQ 2004: December6–8, 2004, in Agra,India, concluded withcommitments from 11 countries to takespecific steps to im-prove their air quality.
BAQ 2006: December13–14, 2006, in Yogyakarta, Indonesia,included the First Gov-ernmental Meeting onUrban Air Quality inAsia, which discussedcommon challenges inurban air quality man-agement and ways toharmonize methodsand standards on urbanair quality managementin the region.

42 em february 2009 awma.orgCopyright 2009 Air & Waste Management Association
Verifying New Technologiesfor Air Pollution andGreenhouse GasesIn an ever-increasing number of areas, the potential for aligning market forces with envi-ronmental protection is growing. Many venturecapitalists point to the development of “green”technologies as one of the few bright spots ina slowing economy. New technologies for preventing, controlling, and monitoring air pollution and greenhouse gases are among themost attractive targets.
One of the biggest hurdles to successfully bringing newtechnologies into the marketplace, however, is developingthe credible, high-quality performance data that purchasers,regulatory bodies, financiers, and vendors require beforeinvesting in new technologies. To help new technologiesenter a risk-adverse marketplace, the U.S. EnvironmentalProtection Agency (EPA) established the EnvironmentalTechnology Verification (ETV) Program.
The ETV ProgramEstablished in 1995, the goal of the ETV Program is to accelerate the acceptance of new environmental technologies entering the marketplace by supplying dataverifying their performance.
The program is managed by EPA’s National Risk Man-agement Research Laboratory (NRMRL), part of theagency’s Office of Research and Development. NRMRLengineers and scientists provide oversight of verificationtests, assuring the credibility of the program as a whole,including quality assurance processes and data. ETV verification establishes or proves the truth of performanceof a technology under specific, predetermined criteriaand testing protocols.
Verification reports and statements are free and open tothe public through the ETV Web site, www.epa.gov/etv.
The ETV Program operates through a number of public–private partnerships between EPA and private, nonprofittesting and evaluation organizations. Working together,technical experts from EPA and their partners developefficient and quality-assured protocols and test plans forverifying technology performance. ETV partners are responsible for planning and performing the verificationtests, as well as developing verification reports and
statements designed to effectively communicate test results to interested stakeholders and end-users.
Technology Verification CentersETV operates verification centers that test technologiesacross a broad range of categories. The centers operatewith the assistance of stakeholder committees whosemembers are drawn from diverse backgrounds, such asstate and local regulatory agencies, industry, academia,environmental groups, and investment companies.Stakeholders help prioritize environmental technologyneeds, identify commercially available products that meetthose needs, and develop test plans. Once a technologycategory has been prioritized for verification, a call forvendors is announced and vendor applications are received. Then, input from stakeholders is incorporatedinto a test/quality assurance plan that is reviewed by participating vendors and EPA representatives. An appropriate test location(s) is selected and the equipmentis tested using procedures outlined in the test/quality assurance plan. A verification report and statement aredeveloped by the ETV centers and reviewed by EPA, theparticipating vendor, and peer reviewers.
Vendors and others in the private sector, as well as federal,state, and local government agencies share costs to complete protocols and verifications.
Verification Centers for AirTwo ETV centers focus exclusively on verifying technolo-gies related to air: the Air Pollution Control TechnologyCenter and the Greenhouse Gas Technology Center.
Air Pollution Control Technology Center (APCT). Oper-ated in cooperation with RTI International, APCT verifies theperformance of commercial-ready technologies designedto control stationary and mobile air pollution sources and tomitigate the effects of air pollutants. Control technologiesAPCT addresses include diesel engine emission control devices, outdoor wood-fired hydronic heaters, dust sup-pression and soil stabilization products, paint overspray arrestors, and indoor pollution mitigation products.
APCT readily shares its findings with stakeholders andpotential users of tested technologies. The APCT Website, http://epa.gov/etv/center-apc.html, posts the namesof stakeholder group and technical panel members, as wellas the minutes from their meetings, verification protocols,test/quality assurance plans, verification reports, verificationstatements, recent publications, and other relevant documents. To date, APCT has verified the performanceof 52 technologies and posted the verification results onits Web site.
em • epa research highlights
Two ETV centersfocus exclusivelyon verifying tech-nologies relatedto air: the Air Pollution ControlTechnology Center and theGreenhouse GasTechnology Center.

awma.org february 2009 em 43Copyright 2009 Air & Waste Management Association
The center also maintains a database of contact informa-tion of more than 900 air pollution control technologydevelopers, vendors, and other interested parties. Pleasecontact APCT through the Web site to be added to thedatabase.
Greenhouse Gas Technology Center (GHG). Operatedin cooperation with Southern Research Institute, GHGprovides independent performance testing of technolo-gies that produce, mitigate, monitor, or sequester green-house gas emissions. Since 1997, GHG has locatedpromising greenhouse gas mitigation and monitoringtechnologies, subjected them to independent, third-partyperformance testing, and provided the results to thepublic free of charge. The center has completed or initi-ated verifications of 36 environmental technologies, suchas microturbines, fuel cells, and ground-source heatpumps for distributed generation; and fuel additives forincreased fuel efficiency. For more information on thesetechnologies or on the center, visit the GHG Web site atwww.epa.gov/etv/center-ggt.html.
Other Verification CentersWhile APCT and GHG focus their efforts exclusively oninvestigating technologies for air, other ETV verificationcenters include air technologies as part of a broader suiteof verification efforts. The Advanced Monitoring SystemsCenter (AMS), operated in cooperation with Battelle, verifies the performance of commercial-ready technolo-gies that monitor contaminants and natural species inair, water, and soil. The center tests both field-portableand stationary monitors, as well as innovative technolo-gies that can be used for site characterization. To date,AMS has verified 60 technologies for monitoring air
contaminants such as ammonia, particulate matter, hydrogen sulfide, dioxin, and others. The AMS Web siteis www.epa.gov/nrmrl/std/etv/center-ams.html. OtherETV centers include the Drinking Water Systems Center,the Water Quality Protection Center, and the newly-formed Materials Management and Remediation Center.
International interest in verification is growing. In additionto the U.S. ETV Program led by EPA, Canada, the Euro-pean Union, Japan, Korea, the Nordic countries, and thePhilippines have developed fully operating or pilot verification programs. Additional countries have also expressed interest in developing verification programs.
Learn More About ETVSharing research results and outcomes with interestedstakeholders and end-users is one of ETV’s primarygoals. The ETV Web site provides verification reports and statements, protocols and test plans, stakeholder information, meeting summaries, and other importantresources.
In addition, ETV distributes monthly newsletters usingthe program’s listserv, ETVoice, to inform subscribersabout the availability of new information on recent tech-nology verifications, future events, vendor solicitations,and highlights of the ETV Program. To join the listserv,send a blank e-mail to [email protected].
Teresa Harten, Abby Waits, Scott Fogle, and Patrick Hurdcontributed to this month’s column. It was written byAaron Ferster, Science Writer-Editor with EPA’s Office ofResearch and Development in Washington, DC. em
For more information on the research discussed in this column, contact DeborahJanes, Public Information Officer, U.S. EnvironmentalProtection Agency (B205-01),Office of Research and Development, Research Triangle Park, NC 27711;phone: 1-919-541-4577; e-mail: [email protected]. Disclaimer: Although this textwas reviewed by EPA staff andapproved for publication, itdoes not necessarily reflect official EPA policy.
In Memory of A&WMA MemberDouglas A. (Doug) Wolf1961 – 2008
Doug Wolf joined the Association in September 2000 and was an active member of the Genesee Finger
Lakes Chapter, part of the Niagara Frontier Section, until the time of his death in November 2008. Doug
was a senior environmental project engineer with Corning Inc. in Corning, NY. He loved the outdoors, was
an avid hunter, and a motorcycle enthusiast. Doug is survived by his wife Sabra and daughter Jamie. In lieu
of flowers, the family has requested that donations be made to Jamie’s college fund. The Chapter has agreed
to match donations to the fund up to US$500.

44 em february 2009 awma.orgCopyright 2009 Air & Waste Management Association
NASA Scientist Calls Carbon Tax Best Way to Curb GHGsA tax on GHG emissions combined with otheremissions-reducing measures is the best way to reduce GHG concentrations to a safe level, saidJames Hansen, NASA’s top climate scientist, at abriefing hosted by the Environmental and EnergyStudy Institute.
A cap-and-trade program is the central element ofthe congressional bills that have gained tractionover the past year. However, Hansen and otherspeakers said a cap-and-trade program offers toomany opportunities for manipulating the system,would be too expensive, and would not providesufficient incentive for technological innovation. Thespeakers suggested an upstream carbon tax—onethat would be levied on the producers of oil, gas,and coal rather than on those who use the fuels.
A carbon tax has long been trumpeted by econo-mists as the solution that would make the mostsense economically, but politically, the cap-and-trade system has received more attention. Somehave argued that a cap-and-trade system is betterfor the environment than a carbon tax. Hansensaid benefits of the tax would outweigh the costs.
DOJ Says EPA Has Authority to OrderDefense Site CleanupsA letter from the U.S. Department of Justice (DOJ)confirming the U.S. Environmental Protection
Agency’s (EPA) authority to issue cleanup orders tothe U.S. Department of Defense (DOD) means thatfederal facilities long in need of remediation will getthe attention they need, an EPA official said. SusanBodine, assistant EPA administrator for solid wasteand emergency response, said DOD and EPA havebeen unable to reach a federal facilities agreementon the cleanup of installations on EPA’s National Priorities List of Superfund sites. Those sites includeFort Meade in Maryland, Maguire Air Force Basein New Jersey, and Tyndall Air Force Base in Florida.
In May, DOD wrote a letter to the DOJ asking the attorney general to resolve a dispute with EPA concerning four orders issued by EPA under the Resource Conservation and Recovery Act and theSafe Drinking Water Act. EPA issued final orders tothe Pentagon in 2007 ordering cleanups of thesites. DOD argued that EPA did not have the legal authority to compel the cleanup.
But in the letter to the DOD, Steven G. Bradbury,principal deputy assistant attorney general, quotingthe U.S. Code, wrote that EPA is permitted to issue“such orders as may be necessary to protect publichealth and the environment.” Federal facilitiesagreements are required under the ComprehensiveEnvironmental Response, Compensation, and Liabil-ity Act, and they are enforceable by EPA. em
Compiled by Mark WilliamsThe Bureau of National Affairs, Inc.
Greenhouse gas (GHG) emissions from the energy andindustrial sectors increased by 1.4%, or 102.7 million metrictons, from 2006 to 2007, according to an annual reportreleased by the Energy Information Administration (EIA),the statistical arm of the U.S. Department of Energy. Thereport noted that most of the increase came from an increase in emissions of carbon dioxide.
GHG intensity, a measure of how much GHG is used permillion dollars of domestic product, decreased by 0.6%from 2006. That decrease is the smallest since 2002. According to the report, GHG intensity has decreased an
average of 2.1% per year since 2002, for a total of 9.8%from 2002 to 2007. President Bush set a goal of reducingGHG intensity 18% by 2012.
While GHG emissions increased 1.4% from 2006 to2007, economic output increased 2% during the sametime, the report said. Carbon dioxide emissions increasedby 1.3% for a total of 6021.8 million metric tons in 2007.The report attributes the rise to several factors, includingweather requiring more days of heating or cooling thanin 2006.
em • washington report
Report Shows Rise in Emissions, Decrease inGHG Intensity
A tax on GHGemissions combinedwith other emissions-reducing measuresis the best way to reduce GHGconcentrations, according to NASA’sJames Hansen.

awma.org february 2009 em 45Copyright 2009 Air & Waste Management Association
em • news focus
Jackson Pledges Review of EPA PoliciesLisa Jackson, named by President-Elect Obama asthe new U.S. Environmental Protection Agency(EPA) Administrator, pledged Jan. 14 to conductexpedited reviews of a range of existing agencypolicies and suggested that she would reversemany of them, but she resisted making specificcommitments.
Testifying before the Senate Environment and Pub-lic Works Committee, Jackson said that, if con-firmed, she would commit to a review of EPA’srefusal to grant California a Clean Air Act (CAA)waiver to implement its own greenhouse gas(GHG) emissions limits for vehicles “very soon aftertaking the job,” and that science and the law wouldbe her criteria for deciding whether to reverse thedecision. Jackson said she would “not prejudge”the issue.
Obama has pledged to reverse the Bush adminis-tration decision to block the California standards.
In a wide-ranging hearing before the Senate com-mittee, Jackson touched on a number of issuesranging from climate change to air and water pol-lution, and she responded to questions regardingWhite House review of EPA regulatory actions.Jackson also addressed issues related to the Superfund program.
Committee Chairman Barbara Boxer (D-Calif.) saidshe will seek unanimous Senate consent to dis-charge Jackson’s nomination from the committeefor a floor vote by Jan. 20, when Obama takes office, or shortly thereafter. The committee alsoheard from Los Angeles Deputy Mayor Nancy Sutley, chosen by Obama to head the WhiteHouse Council on Environmental Quality.
Jackson to Explore CAA RulesAddressing Jackson, Boxer asked if the EPA Ad-ministrator-designate would commit to using all thetools available in the CAA to reduce GHG emis-sions. “Yes,” Jackson said. “I look forward to work-ing with EPA staff to explore ways” to reduceemissions.
In contrast to President Bush, Obama supports leg-islation to cap GHG emissions and establish anemissions trading system. His advisers have also indicated he will initiate CAA regulation of GHGs,
a step strongly resisted by the Bush administration,in the face of a Supreme Court order to make adetermination on whether to regulate emissions(Massachusetts vs. EPA, 127 S. Ct. 1438 (U.S. 2007)).
Sen. Thomas Carper (D-Del.) asked Jackson if shewould drop an EPA petition to the U.S. SupremeCourt seeking review of a federal appeals court deci-sion that overturned an agency rule setting up a trad-ing system for mercury emissions from power plants(EPA v. New Jersey, U.S., No. 08-512, 10/17/08).
Mercury Rule CriticizedJackson said the EPA regulatory scheme for mer-cury did not comply with the CAA. Under her lead-ership, she said, the agency will work to fashionnew regulations that would address effective mer-cury emissions reductions and “hot spots,” or areaswith particularly high pollution. Jackson would notcommit to dropping the Supreme Court petition,though, saying she “welcome[d] an opportunity tolook at the case.”
She said EPA ethics lawyers told her she may makedecisions on the mercury lawsuit, even though sheplayed a principal role in launching the lawsuit thatbrought down the EPA mercury rule. Until Octo-ber, Jackson was commissioner of the New JerseyDepartment of Environmental Protection. New Jersey was the principle plaintiff in the case.
CAIR Will Be ReviewedJackson also said she would look at the Clean AirInterstate Rule (CAIR) with an eye toward makingit stronger. The U.S. Court of Appeals for the Dis-trict of Columbia Circuit in 2008 overturned CAIR,saying the rule, which established an emissionstrading system to reduce nitrogen oxide and sulfurdioxide emissions from power plants in 28 statesand the District of Columbia, did not comply withthe CAA.
The court modified its order in December, leavingCAIR in place temporarily until EPA makes thechanges to the rule ordered by the court (NorthCarolina vs. EPA, D.C. Cir., No. 05-1244, rule remanded 12/23/08).
Jackson said New Jersey is on record saying thatmore emissions reductions are possible throughCAIR. As EPA Administrator, she said would look atthe rule and see if it could be strengthened.
Priorities wouldbe “to restoreEPA’s role in protecting healthand the environ-ment, take ahard look at themercury rule and CAIR, andaddress climatechange.”>>Lisa Jackson, EPA
Administrator-designate

46 em february 2009 awma.orgCopyright 2009 Air & Waste Management Association
Asked by Carper what her top clean air prioritieswould be, Jackson replied: to restore EPA’s role inprotecting health and the environment, to “take ahard look” at the mercury rule and CAIR, and toaddress climate change.—by Steven D. Cook andLinda Roeder, BNA
Chu Says United States Must TakeLead on Curbing GHGsThe United States must take the lead in curbingGHG emissions under the next international climate deal before China, India, and other poorerdeveloping nations accept emissions curbs of theirown, President-Elect Obama’s choice for energysecretary said Jan. 13.
“The United States should take the first step andChina [must] very quickly follow” in curbing emis-sions, Steven Chu, director of the Lawrence Berke-ley National Laboratory, told the Senate Energyand Natural Resources Committee. “If China does-n’t follow, then we will have to re-look at this,” Chusaid at the confirmation hearing.
Chu, who was warmly received by committee Democrats and Republicans alike, said it is imperativethat the next international climate agreement include the United States and China because together, the two countries release more than 50%of the world’s annual GHG emissions. China, theUnited States, and more than 180 other countriesare to negotiate international emissions reductionsthroughout 2009 and have agreed to sign on to anew climate deal at a U.N. climate change confer-ence in Copenhagen in December.
“If the U.S. and China don’t get this right, then wecan’t move forward” in combatting climate change,Chu said. He called climate change “a growing andpressing problem,” adding that “it is now clear thatif we continue on our current path, we run the riskof dramatic, disruptive changes to our climate inthe lifetimes of our children and grandchildren.”
Chu said both countries are “currently in a stand-off position,” with the United States in recent yearsinsisting that China take on emissions cuts in anyfuture climate deal, which would succeed themandatory emissions curbs of the Kyoto Protocol.China, on the other hand, argues that the UnitedStates and other wealthier nations should cut emis-sions first, given that they have emitted the bulk of
GHG emissions already in the atmosphere.
China Action a Likely Sticking PointWhile it is up to the incoming Obama administra-tion to negotiate U.S. commitments under of thenext international climate agreement, the treaty stillwill need to be ratified by two-thirds of the Senate.Sen. Evan Bayh (D-Ind.), who is to join the energycommittee in the 111th Congress, said the Senatewould not approve any agreement that initiallycommits the United States to emissions curbs butnot China.
“That approach will not be approved by us,” Bayhsaid. He added that China does not “have a greattrack record in honoring other agreements,” including those protecting intellectual property.
Chu said he recognized that China, India, andother developing countries “have to be part of thesolution” in addressing climate change, but theywill need assistance from wealthier countries to deploy low-carbon energy sources and improveenergy efficiency.
Chu also reiterated Obama’s support for a cap-and-trade system that would cap and over time re-duce U.S. GHG emissions and require industry tohold permits, or allowances, for each ton of GHGsthey emit. He also pledged to work closely withCarol Browner, a former EPA Administrator whomObama has selected to coordinate climate and en-ergy issues for the White House. Sen. Bob Corker(R-Tenn.) said Browner should be asked to appearbefore the Senate energy committee at a later dateto discuss the next administration’s plans in the climate change arena.—by Dean Scott, BNA
EPA Limits Aggregation of Emissionsto Reduce Use of NSREPA announced a final rule Jan. 12 that limits someof the circumstances under which New Source Review (NSR) pollution control requirements applyto industrial facilities. The final rule retains existingrule language, but the preamble states that “we arefinalizing an interpretation of the existing rule language with respect to our policy on aggregation.”
NSR requires sources to install modern pollutioncontrols when they make plant modifications thatincrease emissions. Equipment replacement proj-ects often increase emissions because they allow
“The UnitedStates shouldtake the first step and Chinavery quickly follow” in curbingGHG emissions.>>Steven Chu
Energy Secretary-designate

awma.org february 2009 em 47Copyright 2009 Air & Waste Management Association
plants to operate for longer periods.
The final rule contains an interpretation of existingrules saying different modifications at the samesource should be aggregated to determine if newsource review applies only when those differentprojects are substantially related, “either from atechnical or an economic standpoint.”
Scott Segal, director of the Electric Reliability Co-ordinating Council, said the rule stops the practicein EPA enforcement efforts of combining emissionsfrom small projects at a source to push the sourceover the emissions threshold triggering NSR requirements.
EPA proposed a rule in 2006 that sought to definethe circumstances under which emissions increasesfrom different modification projects at the sameplant could be aggregated into one project.
Environmental Coalition Opposed ProposalA coalition of environmental groups filed com-ments in 2006, saying that the proposed languagelimiting aggregation of emissions “invites facilitiesto escape [NSR] by ‘disaggregating’ related proj-ects—emissions will increase as more facilities takeadvantage of this new loophole.”
NSR applies for projects that increase emissions by 100 or 250 tons per year, depending on thesource category. If several emissions increases fromseveral separate modifications at the same sourceare aggregated, it could push the source over thenew source threshold, triggering permitting andemissions control requirements.
The proposed rule’s definition stated that “[p]ro-jects occurring at the same stationary source thatare dependent on each other to be economically ortechnically viable are considered a single project.”
In the final rule, EPA said, “we have concluded thatthe terms ‘economically viable’ and ‘technically viable,’ and what is meant to be economically or tech-nically dependent, are difficult to define clearly andshould not be adopted as regulatory bright lines.”
The agency said it is, therefore, not finalizing theproposed aggregation rule and is not adopting thedescriptions of technical and economic viability anddependence that it proposed in 2006. “We believe
the statements made in this notice better explainthe NSR Aggregation policy and enable permittingauthorities and sources to better implement the cur-rent rule text without revision,” the final rule said.
‘Debottlenecking’ Provisions WithdrawnEPA withdrew provisions in the proposed aggrega-tion rule that would have counted emissions in-creases only at the specific emissions unit beingmodified. Under this provision, known as “debottle-necking,” emissions increases in other units resultingfrom the modification would not have been counted.
EPA also withdrew “netting” provisions that wouldhave eliminated a requirement for sources to con-duct a sourcewide survey to see if a plant modifi-cation would increase emissions. The survey wouldnot have been required if the source determinedthat emissions increases would not be significant.
News Focus is compiled from the current edition of Environment Reporter, published by the Bureau of National Affairs Inc. (BNA). For more information, visitwww.bna.com.
Special Focus: The Economy
Is the recent downturn in the global economyhaving an effect on the U.S. environmentalindustry? With articles from several industryexperts, EM considers what effect–if any–theeconomy is having on the various sectors ofthe environmental industry.
Also look for…
Energy EfficiencyEM looks at aging facilities and the pollution equipment decisions manufacturers must face tomake their operations more energy efficient.
PM File
EPA Research Highlights
Member Minute
…And a preview of the 2009 Annual Conference.
In Next Month’s Issue…

48 em february 2009 awma.orgCopyright 2009 Air & Waste Management Association
In comments on the proposal, the Natural Resources Defense Council, American Lung Asso-ciation, and other environmental groups criticizedthe agency’s proposal, saying that sources woulddecide themselves whether emissions increaseswould be significant, and they would not be re-quired to keep records.
The final rule says that projects are “substantiallyrelated,” when they are interconnected physicallyor operationally, or when the benefit of one projectwould be significantly reduced without the otherproject. Projects could not be aggregated if theyoccurred more than three years apart.
“Industrial and power-sector sources can now per-form important maintenance activities at one timewithout worrying about possibly violating the NSRprogram,” Segal said. “The rule also provides certainty for industries in that it constrains EPA enforcement from reaching back and includingpast projects into present or future project in an effort to allege NSR violations.
However, S. William Becker, executive director ofthe National Association of Clean Air Agencies,said, “The final rule appears to contain the sameserious defect as the proposal, namely that thereare no reporting or record-keeping requirementsthat mandate the source share the basis for its aggregation conclusion with the reviewing authority.”
“State and local permitting authorities are likely to facean uphill battle checking the source’s determinationsin the absence of regulatory reporting requirements,”Becker said.—by Steven D. Cook, BNA em
Since its inception in 1993, the Institute of Profes-sional Environmental Practice (IPEP) has certifiedmore than 1500 environmental professionals.
IPEP’s main certification is the Qualified Environ-mental Professional (QEP) credential. Candidates forthe QEP certification must have a minimum of fiveyears of relevant professional experience, and mustpass a two-part written examination. Part I addressesgeneral environmental science. Part II is taken inone of four practice areas: air quality; water quality;waste management; or environmental science,management, and policy. Senior environmentalprofessionals with more than 15 years of relevantexperience may qualify for the QEP credential byoral examination.
In addition, IPEP offers the Environmental Profes-sional Intern (EPI) credential for young and aspiringenvironmental professionals, particularly collegeseniors and recent graduates. EPI candidates are re-quired to take only Part I of the QEP examinationin general environmental science. EPIs then haveup to seven years in which to take Part II andachieve full QEP certification.
The QEP and EPI certification confirms that the recipient has demonstrated, through a rigorous application and examination process, a broad understanding of the environment and environ-mental issues.
As a proud supporter of IPEP and the QEP and EPI certification, A&WMA congratulates thenewest* QEPs and EPIs on their outstandingachievement. em
QEPsCamilo Cruz, Atlanta, GAChad Daniel, Des Moines, IACraig Lugowski, Denver, COClare Lunn, Westford, MAMuneer Ahmad Nagoo, Jubail, Saudi Arabia
EPIsHolly Shoup Bruch, Pipersville, PAMatt Kraus, Pittsburgh, PAPrabhat Lamichhane, Cincinnati, OHAndrew Martin, Charlotte, NCErik Moral, Houston, TXHoward Redfearn, Mansfield, TXLenn Roberts, Baltimore, MD
*QEPs and EPIs certified after November 30, 2008, will beacknowledged in the May 2009 edition of IPEP Quarterly.
The Institute of ProfessionalEnvironmental Practice(IPEP) is a member of theCouncil of Engineering andScientific Specialty Boards(CESB), an independant organization that accreditsengineering, scientific, and technology programs.For more information aboutIPEP and the QEP and EPIcertification, contact Certification Services Coor-dinator, IPEP, 600 ForbesAve., 339 Fisher Hall, Pitts-burgh, PA 15282; phone 1-412-396-1581; fax: 1-412-396-1704; e-mail:[email protected]; web:www.ipep.org.
em • ipep quarterly
EM Advertiser (www) page
American Ecotech (americanecotech.com). . . . . . . . . . . . . 21, 27
Lakes Environmental Software Inc. (weblakes.com) . . . . . . . . . . . . . . . . . . . Back Cover
Met-One Instruments Inc.(metone.com) . . . . . . . . . . . . . . . . . . . . 19
PKL Technologies Inc.(pkltechnologies.com) . . . . . . . . . . . . . . 4
RTI International(rti.org). . . . . . . . . . . . . . . . . . . . . . . . . . 15

awma.org february 2009 em 49Copyright 2009 Air & Waste Management Association
The below course is being held in conjunction with thespecialty conference, First International Greenhouse GasMeasurement Symposium, March 22–24, 2009, SanFrancisco, CA. For more information about this confer-ence, go to www.awma.org/events.
MARCH 22 (8:00 A.M.–5:00 P.M.)AIR-130: Emission Measurement Techniques forGreenhouse Gases (GHGs) from Area and FugitiveSourcesInstructors: Drs. Ram A. Hashmonay, ARCADIS, and Eric Crosson, PicarroThis course will review in detail open-path and pointmonitoring instrumentation capable of detecting green-house gases (GHGs), such as carbon dioxide, methane,nitrous oxide, sulfur hexafluoride, hydro fluorocarbons(HFCs), and chlorofluorocarbons (CFCs). Among thetechniques described are: open-path–Fourier transforminfra-red (OP-FTIR), open-path–tunable diode laser ab-sorption spectroscopy (OP-TDLAS), and cavity ring-down (CRD) techniques. This course will also discussvarious measurement configurations for measuring emis-sion fluxes of GHGs from area and fugitive sources.
Call for AbstractsA&WMA Specialty ConferencesGuideline on Air Quality Models: Next Generationof ModelsOctober 26–30, 2009Raleigh, NCThis conference will provide a technical forum for envi-ronmental professionals to share experiences with theproposed revisions to the U.S. Environmental ProtectionAgency’s (EPA) Guideline on Air Quality Models. TheGuideline is required for use in the preparation of stateimplementation plans, federal construction permits, andmany state permits. EPA has adopted AERMOD andCALPUFF as the refined models for routine modelingapplications. The user community is gaining experiencewith these models and further advances in modelingtechniques and meteorological databases will be re-ported at this conference. In addition, advanced modelsused in international or specialized situations will be dis-cussed. Abstracts (of 300 words or less) are invited inthe following areas: AERMOD, CALPUFF, next-genera-tion modeling techniques, regulatory application of mod-els, long-range transport issues, and meteorology.Abstracts must be submitted for review via A&WMA’sonline abstract management system by April 24. Authorswill be notified of paper acceptance by May 22. Draft
Listed below are the articles appearing in theFebruary 2009 issue of the Journal. For orderinginformation, go to www.awma.org/journal or call1-412-232-3444.
In This Month’s Issue...
Real-World Vehicle Emissions: A Summary ofthe 18th Coordinating Research Council On-Road Vehicle Emissions Workshop
Chloride Behavior in Washing Experiments ofTwo Kinds of Municipal Solid Waste IncineratorFly Ash with Different Alkaline Reagents
The Effect of Oxygen on the Kinetics of theThermal Degradation for Rice Straw
A Method for Estimating Mass-Transfer Coeffi-cients in a Biofilter from Membrane Inlet MassSpectrometer Data
Carbonyl Compounds and Toxicity Assessmentsof Emissions from a Diesel Engine Running onBiodiesels
Effect of E85 on Tailpipe Emissions from Light-Duty Vehicles
Research on Transportation-Related Emissions:Current Status and Future Directions
Transport Mechanisms of Coarse, Fine, andVery Fine Particulate Matter in Urban StreetCanopies with Different Building Layouts
Effect of Air Pollution Controls on Black Smokeand Sulfur Dioxide Concentrations across Ireland
Intercomparison of Clean Air Status and TrendsNetwork Nitrate and Nitric Acid Measurementswith Data from Other Monitoring Programs
Kinetic Modeling on the Adsorption of Vapor-Phase Mercury Chloride on Activated Carbonby Thermogravimetric Analysis
An Interval Mixed-Integer Semi-Infinite Pro-gramming Method for Municipal Solid WasteManagement
FEBRUARY 2009 • VOLUME 59
JOURNAL
em • professional development programs

50 em february 2009 awma.orgCopyright 2009 Air & Waste Management Association
manuscripts are due by July 31, and final manuscriptsby September 11 to be incorporated into the proceed-ings. Receipt of the final extended abstract is a manda-tory prerequisite for presentation at the conference.More information is available online at www.awma.org.
Harmonizing Greenhouse Gas Assessment and Reporting ProcessesAugust 31 – September 2, 2009Baltimore, MDThis conference will provide a forum for discussing ad-vances in greenhouse gas (GHG) emission estimationmethods, emission inventories, and reporting. The con-ference aims to examine the convergence of mandatoryand voluntary reporting initiatives, as well emerging tech-nical and policy issues. Abstracts (200-300 words) arebeing sought for presentation on all aspects of GHG es-timation and reporting, including emerging GHG re-porting initiatives, GHG estimation methodologydevelopment, mandatory/voluntary reporting initiatives,standards for registering and verifying GHG emissioninventories, and accounting for GHG emission reduc-tions. Please submit your abstract to Carrie Hartz [email protected]. Abstracts must be received by Feb-ruary 20. Authors will be notified of paper acceptance byMarch 20. Draft extended abstracts are due May 1, andfinal extended abstracts (for online publication) are dueAugust 7. Receipt of the final extended abstract (3–5pages) is a mandatory prerequisite for presentation atthe conference and inclusion in the proceedings. Visitthe conference Web site at www.awma.org/go/gh-gassessment09 for more information.
International Conferences Cosponsored by A&WMAEnergy Efficiency and Air Pollutant Control (Wroclaw2009)September 21–25, 2009Wroclaw, PolandThe Energy Efficiency and Air Pollutant Control Confer-ence, hosted by the Wroclaw University of Technology,organized by the Wroclaw Faculty of Environmental Engineering, and cosponsored by A&WMA, is the firstscheduled international conference on energy efficiencyand the control of air pollutants from coal-fired powergeneration. Abstracts are invited with regard to funda-mental research on energy efficiency (in industry, inbuildings, combined heat and power systems, indoor climate control systems, climate change mitigation) andair pollutant control (sulfur dioxide, nitrogen oxides, PM,mercury, carbon dioxide, multipollutants). Special issuesto be published post-conference in two peer-review
journals—The Journal of Air & Waste Management Association and Environment Protection Engineering—are planned with conference contributions. More information is available online at www.energy-air-wroclaw.pwr.wroc.pl.
19th Annual Conference of the International Societyof Exposure Science (ISES): Transforming ExposureScience in the 21st CenturyNovember 1–5, 2009Minneapolis, MNResearchers are invited to submit abstracts and symposiaproposals on the full spectrum of human and ecologicalexposure science. Research on the following importantexposure science issues are of particular interest, includ-ing global exposure issues (e.g., climate change, disasterrelief, and sustainable/alternative energy), local/regionalexposure issues (e.g., urban planning, green, and sus-tainable development), and emerging and high-impactexposure issues (e.g., epigentics and exposure, genomicmarkers of exposure, and exposure biology). Preferencewill be given to abstracts that focus on linkages, popula-tion-based studies, and methods for improved exposureand dose characterization across the source-to-outcome continuum. Symposia proposals and paper ab-stracts may be submitted electronically atwww.ises09.org. Symposia proposals should provide anoverview of the symposia and explain how the presen-tations address a coherent, integrated theme. Each sym-posium will be 90 minutes and should include anappropriate number of presentations (i.e., 2–6) that allowtime for the presentations and audience participation. In-novative symposia formats are encouraged. The proposalshould contain an abstract of no more than 500 wordsand provide a list of the individual presentation topics,speakers and affiliations, and a short description of eachpresentation. Proposals are due February 20. Paper ab-stracts of no more than 300 words are due May 1. Com-plete information regarding abstract and symposiarequirements and deadlines can be found online atwww.ises09.org. em
awma.org february 2009 em 51Copyright 2009 Air & Waste Management Association
21–25 Energy Efficiency and Air Pollutant Control, Wroclaw, Poland; www.energy-air-wroclaw.pwr.wroc.pl
OCTOBER
25–29 International Air Quality VII Conference, Arlington, VA; www.undeerc.org
26–30 Guideline on Air Quality Models: Next Generation of Models, Raleigh, NC
NOVEMBER
1–5 International Society for Exposure Science (ISES) 2009 Annual Conference: Transforming Exposure Science in the 21st Century, Minneapolis, MN
2010JUNE
22–25 A&WMA’s 103rd Annual Conference & Exhibition, Calgary, Alberta, Canada
AUGUST
Aug 30 Power Plant Air Pollutant Control Mega –Sept 2 Symposium, Baltimore, MD
SEPTEMBER
11–16 15th World Congress of the InternationalUnion of Air Pollution Prevention Associations (IUAPPA): Achieving Environmental Sustainability in a Resource Hungry World, Vancouver, British Columbia, Canada
2009FEBRUARY
18 Geologic Sequestration Research Activitiesand EPA Requirements Webinar, 2:00 – 4:00 p.m. Eastern
MARCH
10–12 Building Energy 2009, Boston, MA;www.buildingenergy.nesea.org
22–24 First International Greenhouse Gas Measurement Symposia, San Francisco, CA
24–27 7th International Conference on Air Quality —Science and Application (Air Quality 2009),Istanbul, Turkey
MAY
7–8 Practical Sustainability, St. Louis, MO
18–22 Joint Conference: International Thermal Treatment Technologies and HazardousWaste Combustors, Cincinnati, OH
20-22 Canadian Indoor Air Quality Conference, Montreal, Quebec
JUNE
16–19 A&WMA’s 102nd Annual Conference & Exhibition, Detroit, MI
AUGUST
Aug 31 Harmonizing Greenhouse Gas Assessment–Sept 2 and Reporting Processes, Baltimore, MD
SEPTEMBER
1–2 Climate Conference, Baltimore, MD
15–16 Ambient Air Monitoring and Dispersion Modeling for Oil and Gas Exploration and Production, Centennial, CO
em • calendar of events
Events sponsored and cosponsored by the Air &Waste Management Association (A&WMA) arehighlighted in bold. For moreinformation, call A&WMAMember Services at 1-800-270-3444 or visit theA&WMA Events Web site:www.awma.org/events.
To add your events to this calendar, send to: Calendar Listings, Air & Waste Manage-ment Association, One GatewayCenter, 3rd Floor, 420 FortDuquesne Blvd., Pittsburgh, PA15222-1435. Calendar listingsare published on a space-available basis and should be received by A&WMA’s editorialoffices at least three months inadvance of publication.
ENERGY AND ENVIRONMENT
CALGARY 2010
february 2009 em 51

52 em february 2009 awma.orgCopyright 2009 Air & Waste Management Association
em: What inspired you to become an environmentalprofessional?Durham: As an undergraduate studying aerospace engineering, I first got interested in environmental issueswhen I performed an analysis of emissions from jet engines as my senior project. I then refocused my academic studies and received master’s and Ph.D. degrees in environmental engineering.
What environmental leader do you admire mostand why?Dr. Dale Lundgren was an internationally recognized expert in air pollution control long before the originalClean Air Act in 1970. He was not only my thesis advi-sor at the University of Florida, but my first employer inthe environmental field as a consultant. Dr. Lundgrentaught me that with solid engineering fundamentals,there were no bounds to the breadth of projects to bepursued and if there wasn’t an available answer to aproblem, then invent one. This attitude has stayed withme and led to the startup of two successful air pollutioncontrol companies and a dozen patents.
What advice would you give to students and/oryoung professionals just starting out in the field?The environmental field is constantly changing as a resultof continuously improving technologies. New entrants tothis field will likely experience several significant changes indirections throughout their careers. Therefore, I would rec-ommend that, as they hone their technical skills, they keepa keen eye on changing political, economic, and societal
trends that will define new challenges and opportunities.
What does A&WMA membership mean to you?Environmental issues are multidimensional, constantlyevolving, and require access to the latest information onnew technologies and emerging policies. A&WMA hasprovided me access to all of the different stakeholderperspectives, from scientists and government agenciesto environment groups, consultants, and industry endusers, that have helped me anticipate new policies thatwill impact my business.
Are you currently working on any interesting projects?My company has started scaling-up carbon capture technology that we are developing for existing coal-firedboilers. Technology will be needed to help these plantsmeet pending regulations to address climate change.There are a number of challenges to developing a solution that can be applied to the massive volumes ofgases that must be treated and still be practical relativeto the impact on the cost of electricity.
How do you like to let off steam?For excitement, I climb mountains (over 40 14,000 ft peaksto date), ride my road and mountain bikes through the hillsof Colorado, and heli-snowboard in Canada. For relaxation,I get away with my wife and dogs to our ranch in rural Colorado that is totally off the grid (solar powered, nophone or cell service), where I make up projects to do withmy tractor (Mike is pictured above with his three dogs).
MinuteMichael D. Durham, Ph.D.President ADA-ES Inc.Littleton, CO
A&WMA Member Since 1975
Rocky Mountain States Section
Association leadership roles held: Chair, Rocky Mountain States Section (1989–1990); Chair, National Technical Committee on Control of ParticulateMatter and Acid Gases (1994–1996); Chair, Emission Control Division (1999–2002)
Association honors and awards received: Sensenbaugh Award for Air Pollution Control Technology (2001)
em • association news
The Member
“ A&WMA has provided me access to all of thedifferent stake-holder perspectivesthat have helpedme anticipate newpolicies that willimpact my business.”
Each month, this page profiles a different A&WMA member to find out what makes them tick at work and at home.
Tell Us What Makes You Tick!The Member Minute is a greatway to share your experiences,work, and accomplishementswith A&WMA’s membershipand EM readers. Want to seeyour photo and story high-lighted in EM, or do you wantto recommend someone to be featured? Just e-mail yourcontact information to EMManaging Editor Lisa Bucher at [email protected] for consideration.

PROFESSIONAL DEVELOPMENT OPPORTUNITIES
First International Greenhouse Gas Measurement SymposiumA&WMA's “First International Greenhouse Gas Measurement Symposium” will provide a forum fordiscussion on novel concepts in greenhouse gas (GHG) emission source measurement, measurement-based modeling, surrogate-monitoring assessment in the context of future compliance, verification,and emission trading strategies.
Industrial plant operators, regulators, instrument suppliers, and researchers should not miss this opportunity toexchange ideas and review the application of measurement-based approaches for GHG emissions quantifica-tion with industry experts.
An associated professional development course will be offered.
Practical SustainabilityAs increased attention is being paid to climate change, energy dependency, and greenhouse gas emissions,expectations are rising for organizations to implement energy and carbon management strategies.
Join industry experts for “Practical Sustainability” to discuss how organizations are measuring and demonstrat-ing sustainability in ways that make business sense both financially and culturally, while also meeting thegrowing expectations of shareholders, customers, and the general public.
Joint Conference: International Thermal TreatmentTechnologies & Hazardous Waste CombustorsThe Joint Conference: International Thermal Treatment Technologies (IT3) & Hazardous Waste Combustors(HWC) will provide a forum for the exchange of state-of-the-art technical information on thermal treatmenttechnologies and issues related to combustion of hazardous waste. Practical applications of technical andscientific advances will be presented by experts from the international community involved with thermaltreatment technologies for the management of wastes that include: hazardous, radioactive, mixed, munitions,medical/pharmaceutical, and municipal. This conference will have a particular focus on hazardous wastemanagement including HWC MACT status and policy updates, emission studies, testing and monitoringapproaches, and risk assessment updates.
VISITWWW.AWMA.ORG/EVENTS FOR MORE INFORMATION.
March 22-24, 2009San Francisco, CA
May 7-8, 2009St. Louis, MO
May 18-22, 2009Cincinnati, OH
EXHIBITSPACE
AVAILABLE
UPCOMING WEBINARS
February 18, 2009 – 2-4 p.m. EasternGeologic Sequestration Research Activities and EPA RequirementsCarbon sequestration is predicted to play an important role in reducing carbon dioxide emissions and diminishing global climate change. Join industryexperts to explore all aspects of geologic carbon sequestration, including proposed techniques, concerns of underground injection, and the EPA’sUnderground Injection Control requirements.
February 25, 2009 – 1-3 p.m. EasternAiming for Change: NACAA's Air Quality Recommendations to the Obama AdministrationGet an insider’s glimpse of potential environmental developments of the Obama administration! On December 16, 2008 the National Association ofClean Air Agencies (NACAA) met with the Obama transition team to discuss and make recommendations on air quality issues.
Find out how the recommendations were developed, how they were received, and how they may influence future policy.
EXHIBITSPACE
AVAILABLE

Lakes Environmental Software [email protected] | Tel: +1 (519) 746-5995
Vertical Profile
AUSTAL ViewTM
FETS ViewTMIRAP-h ViewTMCAM ViewTM
CALPUFF ViewTMAERMOD ViewTM
The tools you need to complete your air dispersion modeling projects!
Facility EmissionsTracking System
Air Dispersion ModelAir Dispersion Model
Human Health Risk Assessment Model
Compliance AssuranceMonitoring System
Air Dispersion Model
AERMOD ViewTM is a complete and powerful graphical user-interface for the U.S. EPA steady-state plume air dispersion model AERMOD. This model is used extensively to assess pollution concentration and deposition from a wide variety of sources.
EEnvironmental Software Solutions
www.webLakes.com
New! Export to Google EarthTM KML format
New! Automated download of SRTM terrain data files. Free global coverage
New! Parallel version of AERMOD model for unlimited number of processors at no extra cost
Multiple-Chemical utility, drastically boosting productivity and reducing model run times
AERMOD Training Available
Export Google EarthTM
Graphical Results
Terrain ProcessorNew! U.S. EPA AERSURFACE tool, allowing foreasy calculation of surface parameters from land cover digital data files
Key Features
Easy digitization using graphical tools and high impact 2D and 3D visualizations
Gaussian Plume Air Dispersion ModelAERMOD View
TM
EA
otehT
MTweiVDOMRE
mocotdeenuoysloo
MTweiVFFUPLAC
epsidriaruoyetelpm
TweiVLATSUA
jorpgniledomnoisre
MT
!stcej
F
DriA
MTweiVSTEF
ledoMnoisrepsiD
MTweiVMAC
ledoMnoisrepsiDriA
TweiVh-PARI
oMnoisrepsiDriA
M
ledo
caFarraT
snoissimEytilicmetsySgnikca
ecnarussAecnailpmoCmetsySgnirotinoM
iRhtlaeHnamuHdoMtnemssessA
ksiled
ropxE!weN
ellaraP!weNundetimilnu
rutaeFyeK
mulPnaissuaGMREA
amrofLMKMThtraEelgooGottr
ofledomDOMREAfonoisrevleartxeontasrossecorpforebmu
ser
ledoMnoisrepsiDriAem
MT
weiVDOM
eiVDOMREA
ecafretni-resuomnoisrepsidlopssessaotoyteiravediw
t
rtsoca
RlacihparG
frewopdnaetelpmocasiMTwe
etats-ydaetsAPE.S.UehtrofesusiledomsihT.DOMREAledosopeddnanoitartnecnocnoitul
.secruosfo
ooGtropxE
stluseR
lacihpargluf
riaemulpeylevisnetxedes
amorfnoitis
MThtraEelgo
motuA!weNrF.selifatad
ehC-elpitluMytivitcudorp
.S.U!weNaluclacysaedrevocdnal
azitigidysaEaD2tcapmi
niarretMTRRTSfodaolnwoddetamegarevoclabolgeer
nitsoobyllacitsard,ytilitulacimesemitnurledomgnicuderdna
gniwolla,lootECAFFARUSREAAPEmorfsretemarapecafrusfonoit
selifatadlatigid
hdnaslootlacihparggnisunoitasnoitazilausivD3dn
n
gn
orPniarreTTerofgm
hgih
reV
rossec
eliforPlacitr
ytivitcudorp
DOMREA
semitnurledomgnicuderdna
elbaliavAgniniarTD
bew@selas
emnorivnEsekaL(1+:leTTe|moc.sekalb
erawtfoSlatn5995-647)915