analyze the impact of the demographics on … july 2012 (complete)/7.7... · abstract the banks...
TRANSCRIPT

Asian Research Journals
http://www.tarj.in 65
A Publication of the Asian Research Journals
AJMR Asian Journal of Multidimensional Research
Vol.1 Issue 2, July 2012, ISSN 2278-4853
ANALYZE THE IMPACT OF THE DEMOGRAPHICS ON THE
PURCHASE DECISION OF THE CUSTOMERS OF THE PRIVATE
BANKS
PROF. ALKA SHARMA*; BHANU PRATAP SINGH**
*Professor,
The Business School
University of Jammu, India.
**Assistant Professor,
The Management School,
Kathua Campus,
University of Jammu, India.
ABSTRACT
The banks after the liberalization and the banking sector reforms have changed their
perspective from being the traditional service providers to the providers of new and
emerging services like mutual funds, insurance services and dematting services. This
is due to the bigger markets and demand for these services and also the realization
that in this highly competitive world the survival is linked to how well they are able
to understand the changing dimensions of consumer behavior. The banks need to
develop customized services according to the understanding of the behavior
dimensions so that they are able to generate profits from the sale of services. The
present paper has attempted to analyze the private sector banks from customer’s
perspective for emerging services like and Insurance services, Mutual Funds and
Dematting services provided by these banks.
KEYWORDS: Demographics, Consumer Behavior, Insurance, Mutual Funds,
Insurance, Private Banks.
______________________________________________________________________________
1. INTRODUCTION
The service sector all over the world has gained a tremendous importance with it contributing
nearly 70% in the world‟s economy (World Bank Report, 2010) and the same phenomenon is
seen in the Indian economy with services contributing nearly 55% (Indian Economic Survey,
2011). Among the services the most prominent sub-sector which have grown rapidly as a result
of economic liberalization, are business services (which includes IT but as a minor percentage),
communication and banking. The demand of banking services is not limited to the basic banking
services but it has developed into the demand for newer financial services under the same roof or
cross selling of the different financial services under the umbrella of the same banks. It is so due
to the fact that the improving economy has resulted in the increased income leading to the
increased demand of theses services leading the banks to venture into providing newer services

Asian Research Journals
http://www.tarj.in 66
A Publication of the Asian Research Journals
AJMR Asian Journal of Multidimensional Research
Vol.1 Issue 2, July 2012, ISSN 2278-4853
which were totally different from the traditional services that they were providing since
beginning.
The banking sector in India has seen a paradigm shift over the period of last 25 years in their
business activities and also has seen tremendous growth in number of banks and services. This
growth can be contributed to liberalization and the implementation of the Narasimham
committee report (1991), which enabled the entry of private sector banks and foreign banks in
Indian market. Due to the liberalization policies adopted since 1991, liberalization of interest
rates, reduction in reserve requirements, entry deregulations, credit policies and prudential
supervision, these banks acquired considerable commercial freedom to pose themselves as profit
making entities.
Another important factor contributing to the working of bank‟s intermediary function is the
exchange of information. It is so due to the fact that the banks provide information to their
consumers who are looking for the best options available in the market to buy or invest. Further
that it has been long realized that the information produced has a cost and the more reliable
information generated will eventually lead to better returns for both the customer and the bank
(Grossman and Stiglitz, 1980). The banks with the presence of their huge network all over the
country or even the world are in a position to generate the best information for the purpose of
selling it to their customers. As the information flows, it aims at generating better returns and
offsetting the impact of risk on the investment.
This paper is an attempt to understand the impact the demographics on the buying behavior of
the customers of the private banks regarding the purchase of the non traditional services provided
by the banks under study.
2. REVIEW OF LITERATURE
Post liberalization the banks have came to the understanding that due to the emergence of the
new banks both in public and private sectors and the governments decision to also allow the
foreign banks to start their operations in India, the competition has increased many folds and to
survive and grow in this highly competitive environment they need to develop new and better
strategies to always remain ahead. Another thing that they have realized that the traditional
banking services that they were providing are not going to be enough and they need to develop
and other services under the same roof so that the banks can become a single solution stop for the
needs and wants of the consumers.
To develop those products and services the banks need to understand among other things the
behavior patterns of the consumers and how much influence do the demographics have on the
purchase patterns of the consumers. They need to know the reasons behind the various purchases
that the customers are making and how important these decisions are not only to the customers
but also to the banks.
One of the most favorable aspect of the Indian market for the banks is the population status
which is highly skewed in the direction of the working individuals. The population in India has
marked a growth of 1.41% over a period of last ten years and the total population of the country

Asian Research Journals
http://www.tarj.in 67
A Publication of the Asian Research Journals
AJMR Asian Journal of Multidimensional Research
Vol.1 Issue 2, July 2012, ISSN 2278-4853
as on March 31st, 2011 stood at 1,210,193,422 (Census, 2011). The current estimated population
is 1,250,000,000; thereby reflecting the kind of market that is available to the service providers
for the sale of different financial instruments. Further the census has revealed that out of the total
population, 63.6 % is between the average age of 15 to 64, thus again reflecting the huge market
potential available to the banks and other financial services providers. The literacy rate of the
country has also seen a rise in the last ten years resulting in a better understanding of the
financial systems and the products by the customers as the awareness level is at a high level. This
indicates that the demographic structure in Indian market has changed dramatically resulting in
key implications for the service providers.
The recent years have seen an increased emphasis on analyzing the impact of demographics on
demand and performance of financial services. It has been seen that the demographics have an
impact on the purchase of the financial services and the macroeconomic performances (Turner,
1998, Kohl and O‟Brien, 1998, McMorrow and Roeger, 2000 and Dang, 2001).
The demographics have been analyzed earlier also by various theorists, which suggest that there
is a link between the age of the individual and the consumption and savings pattern. The
permanent income hypothesis given by Friedman (1957) has the insight that an individual‟s
consumption is likely to depend on permanent rather than current disposable income. People
only consume if they believe their income is sustainable. Consequently, if increases in their
income are expected to be temporary, they will save rather then increase their consumption. The
underlying assumption is that people seek to avoid fluctuations in their consumption when
income fluctuates.
A number of studies were carried out to analyze variables like impact of age on the risk bearing
capacity of the consumers and the return associated with the decisions (Wallach & Kogan, 1961;
McInish, 1982; Morin & Suarez, 1983; Palsson, 1996) suggesting the relevance of
demographics. Another demographic variable that has been frequently argued in financial
decision making having significant impact on risk tolerance and technology adoption is gender.
Different authors in their respective works have argued in favor of the argument (Bajtelsmit
& Bernasek, 1996; Palsson, 1996; Jianakoplos and Bernasek, 1998; Bajtelsmit, Bernasek and
Jianakoplos,1999, Powell and Ansic, 1997 and Grable, 2000), whereas some of them (Grable and
Joo, 1999 and Hanna, Gutter, and Fan, 1998) have concluded that gender is not significant in
predicting financial risk tolerance. Income and wealth are two related factors that are considered
to exert a positive relationship on the preferred level of risk and return (Friedman, 1974; Riley &
Chow, 1992).
The banks are also looking at how the household build their financial portfolios. What are the
reasons for a particular investment that they make and the methods that they adopt to have those
investments in different financial services. The acquisition of financial services follows the
premise of utility maximization, as there are limited resources at their disposal. There are two
types of financial services that the individuals / households acquire in planning their financial
futures savings / investments services and credit services. Among which, savings or investments
are being considered as the instruments for future consumptions based on current earnings and
the credit being considered as the instruments for financing current consumption based on future
earnings. It is seen that the greater the wealth of the investor the larger will be the wealth held in
Asian Research Journals
http://www.tarj.in 68
A Publication of the Asian Research Journals
AJMR Asian Journal of Multidimensional Research
Vol.1 Issue 2, July 2012, ISSN 2278-4853
the risky assets (Cohen, 1975). It is due to the fact that the objectives of investment change
during the life cycle stages as well as knowledge and sophistication increase with time and
experience, which has also been suggested in the hierarchy of the investments objectives.
These all understanding is being developed to ultimately increase the satisfaction levels of the
reach to the customers that the banks has as more satisfied customers will bring more revenues to
the banks. Customer satisfaction generally means customer reaction to the state of fulfillment,
and customer judgment of the fulfilled state (Oliver, 1997). In his study McKinney (2002)
identified five quality dimensions viz relevance, timeliness, reliability, scope and perceived
usefulness, which enhance the value of purchase decisions for customers leading to an increased
satisfaction. They seek to enhance the value of their customers by expanding the range of
products and services they buy from the firm (Blattberg & Deighton, 1996; Rust, Zeithaml &
Lemon, 2000). However, they have now realized that satisfaction also create more value by
leading consumers to cross-buy more products or services.
Cross-buying is also affected by other factors. In particular, customer needs are unlikely to be
comparable across the range of services offered by a firm. In order to capture these disparate
needs, it is important to have a more extensive understanding of the socio-demographic
characteristics of the consumer multiple needs (Kamakura, Ramaswami & Srivastava, 1991).
3. RESEARCH METHODOLOGY
The study deals with analyzing the customer‟s perspective towards the banks to understand the
characteristics of customers and relationship between the service satisfaction levels. For the
purpose of this study the data has been collected from the customers of two private banks viz.
HDFC Bank Ltd. and ICICI Bank Ltd. The three motives that have been analyzed are:
Risk, Return and Technology
The data was collected from a total of 557 customers who were using at least one additional
service either credit cards or insurance along with the traditional services provided by the banks.
A self administered structured questionnaire was distributed to the respondents and responses
were collected on a seven point scale, which had questions about buying motives, satisfaction
and repurchase. The data collected was then analyzed for finding out the impact of various
demographics on the different motives of the purchase decisions.
3.1.HYPOTHESIS
H1. Significant difference exists for the purchase behavior of the consumers for various services
on the basis of demographic characteristics.
H2. Demographics have a positive impact on the buying motives of the consumers.
H3. There is a significant difference between the satisfaction levels of the customers belonging to
different demographics of the banks under study.

Asian Research Journals
http://www.tarj.in 69
A Publication of the Asian Research Journals
AJMR Asian Journal of Multidimensional Research
Vol.1 Issue 2, July 2012, ISSN 2278-4853
H3a. There is a significant difference in the satisfaction levels of the customers belonging to
different age groups.
H3a0. There is no significant difference in the satisfaction levels of the customers of different age
groups.
H3b. There is a significant in the satisfaction levels of the customers belonging to different
genders.
H3b0. There is no significant difference in the satisfaction levels of the customers of different
genders.
H3c. There is a significant difference in the satisfaction levels of the customers belonging to
different income groups.
H3c0. There is no significant difference in the satisfaction levels of the customers of different
income groups.
3.2.OBJECTIVES
3.2.1. To analyze the buying motives and their effect on purchase decisions of the
customers for various services.
3.2.2. To study the effect of demographics on buying behavior in financial services.
3.2.3. To study the demographic wise satisfaction level of the customers of different
banks under study.
4. DATA ANALYSIS
. The impact of various demographics on the buying motives for the customers of the various
banks and the level of the satisfaction of the customers of the private banks has been analyzed to
find out difference if any.
The regression analysis is done to find out the impact of the three demographics (age, gender and
income) on the buying motives (return, risk and technology). The analysis is divided into two
sections one section representing regression analysis for the impact of the demographics on the
purchase of various services and the subsequent section representing the impact on then various
buying motives.
4.1. TO ANALYZE THE BUYING MOTIVES AND THEIR EFFECT ON
PURCHASE DECISIONS OF THE CUSTOMERS FOR VARIOUS SERVICES.
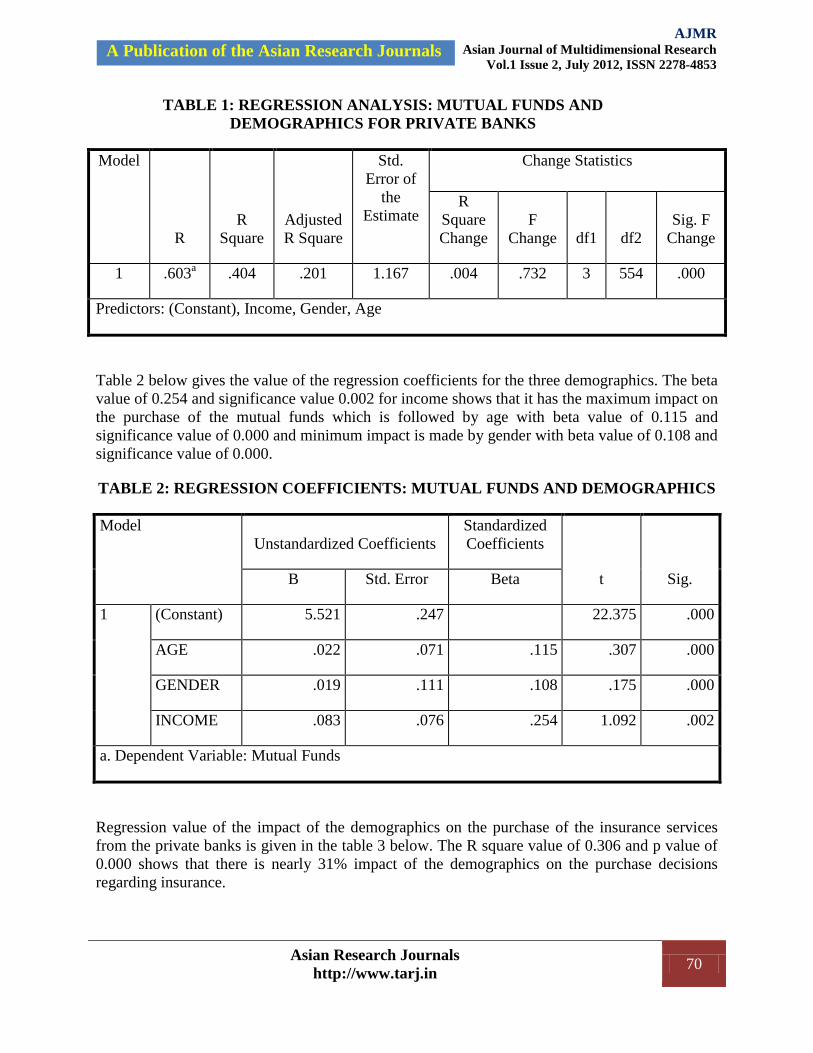
The following table 1 gives the regression analysis of the impact of the demographics on the
purchase of the mutual funds. The R square value of 0.404 and p value of 0.000 indicates that the
demographics make an impact of approximately 40% on the decision regarding the purchase of
the mutual funds from the private banks.
Asian Research Journals
http://www.tarj.in 70
A Publication of the Asian Research Journals
AJMR Asian Journal of Multidimensional Research
Vol.1 Issue 2, July 2012, ISSN 2278-4853
TABLE 1: REGRESSION ANALYSIS: MUTUAL FUNDS AND
DEMOGRAPHICS FOR PRIVATE BANKS
Model
R
R
Square
Adjusted
R Square
Std.
Error of
the
Estimate
Change Statistics
R
Square
Change
F
Change df1 df2
Sig. F
Change
1 .603a .404 .201 1.167 .004 .732 3 554 .000
Predictors: (Constant), Income, Gender, Age
Table 2 below gives the value of the regression coefficients for the three demographics. The beta
value of 0.254 and significance value 0.002 for income shows that it has the maximum impact on
the purchase of the mutual funds which is followed by age with beta value of 0.115 and
significance value of 0.000 and minimum impact is made by gender with beta value of 0.108 and
significance value of 0.000.
TABLE 2: REGRESSION COEFFICIENTS: MUTUAL FUNDS AND DEMOGRAPHICS
Model
Unstandardized Coefficients
Standardized
Coefficients
t Sig. B Std. Error Beta
1 (Constant) 5.521 .247 22.375 .000
AGE .022 .071 .115 .307 .000
GENDER .019 .111 .108 .175 .000
INCOME .083 .076 .254 1.092 .002
a. Dependent Variable: Mutual Funds
Regression value of the impact of the demographics on the purchase of the insurance services
from the private banks is given in the table 3 below. The R square value of 0.306 and p value of
0.000 shows that there is nearly 31% impact of the demographics on the purchase decisions
regarding insurance.

Asian Research Journals
http://www.tarj.in 71
A Publication of the Asian Research Journals
AJMR Asian Journal of Multidimensional Research
Vol.1 Issue 2, July 2012, ISSN 2278-4853
TABLE 3: REGRESSION ANALYSIS: INSURANCE AND DEMOGRAPHICS
FOR PRIVATE BANKS
Model
R
R
Square
Adjusted
R Square
Std.
Error of
the
Estimate
Change Statistics
R
Square
Change
F
Change df1 df2
Sig. F
Change
1 .489a .306 .230 1.217 .036 6.816 3 554 .000
Predictors: (Constant), Income, Gender, Age
The regression coefficients (table 4) of the impact of the demographics on the insurance show
that the maximum impact is made by age with beta value of 0.172 and significance value of
0.000 and is followed by income (beta value of 0.133 and significance value of 0.000) and
gender (beta value of 0.131 and significance value of 0.002).
TABLE 4: REGRESSION COEFFICIENTS: INSURANCE AND DEMOGRAPHICS
Model
Unstandardized Coefficients
Standardized
Coefficients
t Sig. B Std. Error Beta
1 (Constant) 6.247 .257 24.265 .000
AGE .265 .075 .172 3.555 .000
GENDER .358 .116 .131 3.101 .002
INCOME .215 .079 .133 2.727 .000
a. Dependent Variable: Insurance
Table 5 below gives the regression analysis of the impact of the demographics on the purchase of
the dematting services. The R square value of 0.106 reveals that the there is about 11% impact
on the purchase decision of buying dematting services from the private banks.

Asian Research Journals
http://www.tarj.in 72
A Publication of the Asian Research Journals
AJMR Asian Journal of Multidimensional Research
Vol.1 Issue 2, July 2012, ISSN 2278-4853
TABLE 5: REGRESSION ANALYSIS: DEMATTING SERVICES AND
DEMOGRAPHICS FOR AND PRIVATE BANKS
Model
R
R
Square
Adjusted
R Square
Std.
Error of
the
Estimate
Change Statistics
R
Square
Change
F
Change df1 df2
Sig. F
Change
1 .127a .106 .101 .970 .016 3.010 3 554 .000
Predictors: (Constant), Income, Gender, Age
The following table 6 gives the regression coefficient values of the three demographics on the
purchase decision regarding the dematting services. The demographic that has the maximum
impact is age with the beta value of 0.345 and significance value of 0.003, followed by the
income demographic with beta value of 0.287 and significance value of 0.000 and the
demographic that has the minimum impact is gender with beta value of 0.233 and significance
value of 0.000.
TABLE 6: REGRESSION COEFFICIENTS: DEMATTING SERVICES AND
DEMOGRAPHICS
Model
Unstandardized Coefficients
Standardized
Coefficients
T Sig. B Std. Error Beta
1 (Constant) 5.166 .205 25.195 .000
AGE .176 .059 .345 2.965 .003
GENDER .071 .092 .233 .775 .000
INCOME .112 .063 .287 1.777 .000
a. Dependent Variable: Dematting Services

Asian Research Journals
http://www.tarj.in 73
A Publication of the Asian Research Journals
AJMR Asian Journal of Multidimensional Research
Vol.1 Issue 2, July 2012, ISSN 2278-4853
4.2.TO STUDY THE EFFECT OF DEMOGRAPHICS ON BUYING BEHAVIOR IN
FINANCIAL SERVICES
The impact of the demographics on the buying motives is given in the following tables. The
impact of the demographics on the return is given in the table 7 below. The R square value of
0.505 and p value of 0.001 shows that there is approximately 51% on the expected returns from
the various services provided by the private banks.
TABLE 7: REGRESSION ANALYSIS: RETURN AND DEMOGRAPHICS
Model
R
R
Square
Adjusted
R Square
Std. Error
of the
Estimate
Change Statistics
R
Square
Change
F
Change df1 df2
Sig. F
Change
1 .711a .505 .237 .17504 .505 .680 3 2 .001
Predictors: (Constant), Income, Age, Gender
The regression coefficients are given in the table 8 below. Income with beta value 0.716 with
significance value of 0.000 has the maximum impact on the purchase decisions followed by age
with beta value of 0.236 and significance value of 0.000. The least impact is made by the gender
with beta value of 0.119 and significance value of 0.000.
TABLE 8: REGRESSION COEFFICIENTS: RETURN AND DEMOGRAPHICS
Model
Unstandardized Coefficients
Standardized
Coefficients
t Sig. B Std. Error Beta
1 (Constant) 5.072 .382 13.279 .000
AGE .030 .065 .236 .467 .000
GENDER .034 .159 .119 .215 .000
INCOME .126 .096 .716 1.312 .000
a. Dependent Variable: Return
Asian Research Journals
http://www.tarj.in 74
A Publication of the Asian Research Journals
AJMR Asian Journal of Multidimensional Research
Vol.1 Issue 2, July 2012, ISSN 2278-4853
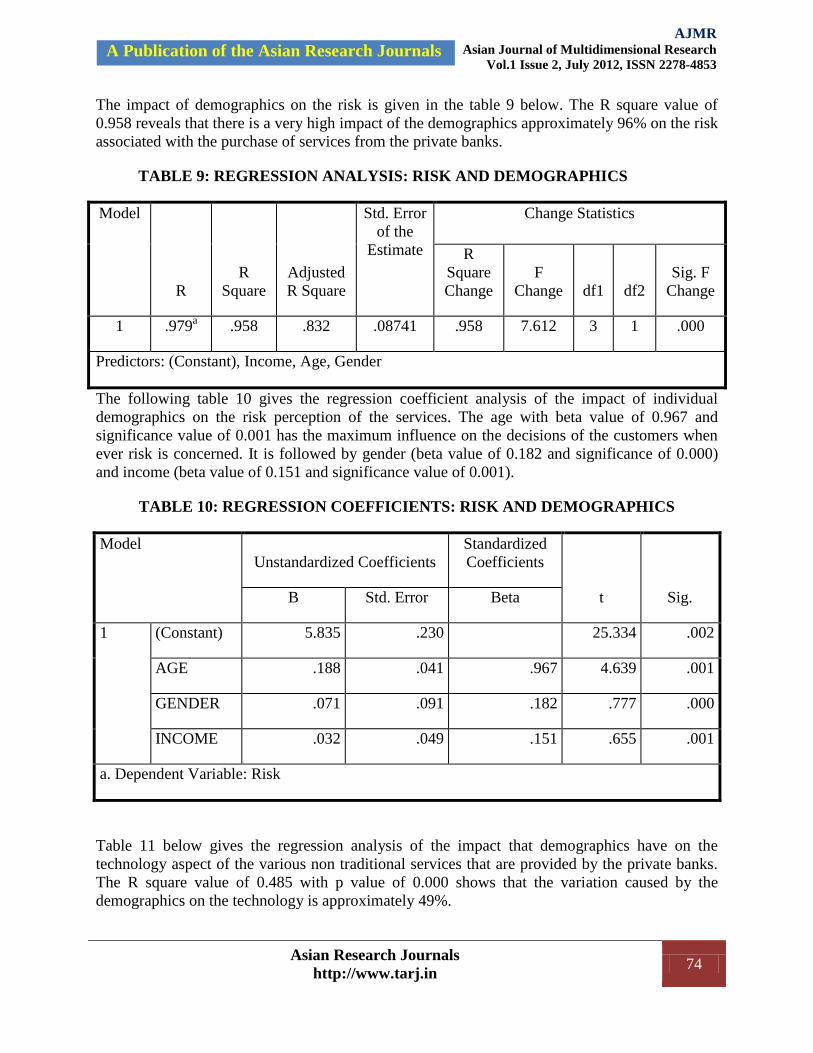
The impact of demographics on the risk is given in the table 9 below. The R square value of
0.958 reveals that there is a very high impact of the demographics approximately 96% on the risk
associated with the purchase of services from the private banks.
TABLE 9: REGRESSION ANALYSIS: RISK AND DEMOGRAPHICS
Model
R
R
Square
Adjusted
R Square
Std. Error
of the
Estimate
Change Statistics
R
Square
Change
F
Change df1 df2
Sig. F
Change
1 .979a .958 .832 .08741 .958 7.612 3 1 .000
Predictors: (Constant), Income, Age, Gender
The following table 10 gives the regression coefficient analysis of the impact of individual
demographics on the risk perception of the services. The age with beta value of 0.967 and
significance value of 0.001 has the maximum influence on the decisions of the customers when
ever risk is concerned. It is followed by gender (beta value of 0.182 and significance of 0.000)
and income (beta value of 0.151 and significance value of 0.001).
TABLE 10: REGRESSION COEFFICIENTS: RISK AND DEMOGRAPHICS
Model
Unstandardized Coefficients
Standardized
Coefficients
t Sig. B Std. Error Beta
1 (Constant) 5.835 .230 25.334 .002
AGE .188 .041 .967 4.639 .001
GENDER .071 .091 .182 .777 .000
INCOME .032 .049 .151 .655 .001
a. Dependent Variable: Risk
Table 11 below gives the regression analysis of the impact that demographics have on the
technology aspect of the various non traditional services that are provided by the private banks.
The R square value of 0.485 with p value of 0.000 shows that the variation caused by the
demographics on the technology is approximately 49%.

Asian Research Journals
http://www.tarj.in 75
A Publication of the Asian Research Journals
AJMR Asian Journal of Multidimensional Research
Vol.1 Issue 2, July 2012, ISSN 2278-4853
TABLE 11: REGRESSION ANALYSIS: TECHNOLOGYAND DEMOGRAPHICS
Model
R
R
Square
Adjusted
R Square
Std. Error
of the
Estimate
Change Statistics
R
Square
Change
F
Change df1 df2
Sig. F
Change
1 .696a .485 1.061 .28995 .485 .314 3 1 .000
Predictors: (Constant), Income, Age, Gender
The beta coefficients indicated that out of all three demographics, the income (Beta=0.414;
p=0.000) and Age (with Beta value 0.355 and p=0.002) as demographics have a very low impact
on the technology for the customers of the private banks. The third demographic of gender (with
Beta value of 0.582 and p=0.000) have the maximum positive impact on the buying motive
technology. Thus the analysis mentions that of all the three demographics viz. age, gender and
income; the gender as a demographic has the maximum influence on the purchase decision of the
customer as far as the technology is concerned.
TABLE 12: REGRESSION COEFFICIENTS: TECHNOLOGY AND DEMOGRAPHICS
Model
Unstandardized Coefficients
Standardized
Coefficients
t Sig. B Std. Error Beta
1 (Constant) 5.056 .764 6.618 .000
AGE .065 .135 .355 .486 .002
GENDER .215 .303 .582 .708 .000
INCOME .084 .164 .414 .511 .000
a. Dependent Variable: Technology
4.3. TO STUDY THE SATISFACTION LEVEL OF THE CUSTOMERS OF
DIFFERENT BANKS UNDER STUDY
The following table 13 gives the satisfaction of the customers of different age groups. The
standard F value for the following analysis is 2.60. The calculated values of the following table

Asian Research Journals
http://www.tarj.in 76
A Publication of the Asian Research Journals
AJMR Asian Journal of Multidimensional Research
Vol.1 Issue 2, July 2012, ISSN 2278-4853
are more then the standard value for all the statements. The results show that the customers of
the private banks belonging to different age groups are satisfied with different values by the
services provided by the banks. Thus, rejecting the null hypotheses.
TABLE 13: ANOVA: SATISFACTION WITH RESPECT TO AGE
ANOVA
Sum of
Squares df Mean Square F Sig.
S1 Between Groups 12.042 3 4.014 2.984 .001
Within Groups 745.263 554 1.345
Total 757.305 557
S2 Between Groups 13.489 3 4.496 2.972 .001
Within Groups 838.011 554 1.513
Total 851.500 557
S3 Between Groups 7.383 3 2.461 2.612 .001
Within Groups 522.046 554 .942
Total 529.428 557
S4 Between Groups 20.094 3 6.698 8.992 .000
Within Groups 412.680 554 .745
Total 432.774 557
The table 14 below gives the post hoc analysis of the satisfaction of the customers of different
age groups with respect to the use of the mutual funds. The analysis is divided in to two subsets
with age groups 26-35 and 36-45 representing one subset and other subset is comprised of the
age groups 18-25 and 46 and above. The customers belonging to the age group of 45 and above
has the maximum satisfaction from the services that are being provided by the private banks with
the value 5.64 and the minimum satisfaction is for the age group of 36-45 with value 5.15.

Asian Research Journals
http://www.tarj.in 77
A Publication of the Asian Research Journals
AJMR Asian Journal of Multidimensional Research
Vol.1 Issue 2, July 2012, ISSN 2278-4853
TABLE 14: SATISFACTION OF MUTUAL FUNDS AND AGE
Tukey Ba,b
AGE
N
Subset for alpha = 0.05
1 2
36-45 114 5.15
26-35 296 5.30
18-25 112 5.54
45 & Above 36 5.64
Means for groups in homogeneous subsets are displayed.
a. Uses Harmonic Mean Sample Size = 81.872.
Table 15 below gives the satisfaction levels from the use of insurance services provided by the
private banks for the customers belonging to different age groups. The customers belonging to
the age group of 36-45 are the least satisfied from the insurance services provided with the value
of 5.33 and the most satisfied customers belong to the age group of 18-25 with the value of 5.79.
TABLE 15: SATISFACTION OF INSURANCE SERVICES AND AGE
Tukey Ba,b
AGE
N
Subset for alpha = 0.05
1
36-45 114 5.33
26-35 296 5.46
45 & Above 36 5.47
18-25 112 5.79
Means for groups in homogeneous subsets are displayed.
a. Uses Harmonic Mean Sample Size = 81.872.

Asian Research Journals
http://www.tarj.in 78
A Publication of the Asian Research Journals
AJMR Asian Journal of Multidimensional Research
Vol.1 Issue 2, July 2012, ISSN 2278-4853
The age group of 36-45 with value 5.64 (table 16) is the most satisfied group among all other
groups with the dematting services that are provided by the private banks and the lowest
satisfaction levels is for the customers belonging to the age group of 18-25 with value of 5.35.
TABLE 16: SATISFACTION OF DEMATTING SERVICES AND AGE
Tukey Ba,b
AGE
N
Subset for alpha = 0.05
1
18-25 112 5.35
26-35 296 5.38
45 & Above 36 5.58
36-45 114 5.64
Means for groups in homogeneous subsets are displayed.
a. Uses Harmonic Mean Sample Size = 81.872.
The table 17 below gives the post hoc analysis of the overall satisfaction of the customers of
different age groups with respect to the banks under study. The analysis is divided into two
subsets with age groups 26-35 representing one subset and other subset is comprised of the age
groups 18-25, 36 – 45 and 46 and above. The customers belonging to the age group of 26-35 has
the maximum satisfaction from the services provided by the private banks with the value 5.75
and the minimum satisfaction is for the age group of 18-25 with value 5.33.
TABLE 17: OVERALL SATISFACTION OF BANKS AND AGE
Tukey Ba,b
AGE
N
Subset for alpha = 0.05
1 2
18-25 112 5.33
36-45 114 5.39
45 & Above 36 5.44

Asian Research Journals
http://www.tarj.in 79
A Publication of the Asian Research Journals
AJMR Asian Journal of Multidimensional Research
Vol.1 Issue 2, July 2012, ISSN 2278-4853
26-35 296 5.75
Means for groups in homogeneous subsets are displayed.
a. Uses Harmonic Mean Sample Size = 81.872.
The table 18 below gives the ANOVA analysis of the satisfaction with gender for the customers
of the public banks. The standard value of F for the following analysis is 2.60. The calculated
value of all the statements are more then the standard value meaning that the null hypotheses that
the customers belonging to different gender have same satisfaction levels is rejected, thus,
revealing that all the customers have different satisfaction levels with the services provided.
TABLE 18: ANOVA: SATISFACTION WITH RESPECT TO GRNDER
Sum of
Squares df Mean Square F Sig.
S1 Between Groups .011 1 .011 3.008 .002
Within Groups 757.293 556 1.362
Total 757.305 557
S2 Between Groups 9.871 1 9.871 6.521 .001
Within Groups 841.629 556 1.514
Total 851.500 557
S3 Between Groups .128 1 .128 4.134 .000
Within Groups 529.301 556 .952
Total 529.428 557
S4 Between Groups .003 1 .003 5.004 .000
Within Groups 432.771 556 .778
Total 432.774 557

Asian Research Journals
http://www.tarj.in 80
A Publication of the Asian Research Journals
AJMR Asian Journal of Multidimensional Research
Vol.1 Issue 2, July 2012, ISSN 2278-4853
The following table 10 gives the ANOVA analysis between the satisfaction and the income of
the customers of the private banks. The standard F value of the analysis is 2.98. Here again all
the values of the statements are higher then the standard value. Thus it can be seen that the
customers of different income groups are satisfied with the different services that are being
provided by the private banks namely ICICI Bank Ltd. and HDFC Bank Ltd.
TABLE 19: ANOVA: SATISFACTION WITH RESPECT TO INCOME
Sum of
Squares df Mean Square F Sig.
S1 Between Groups 3.179 3 1.060 4.778 .000
Within Groups 754.126 554 1.361
Total 757.305 557
S2 Between Groups 42.838 3 14.279 9.783 .000
Within Groups 808.662 554 1.460
Total 851.500 557
S3 Between Groups 14.619 3 4.873 5.244 .001
Within Groups 514.810 554 .929
Total 529.428 557
S4 Between Groups 20.039 3 6.680 8.966 .000
Within Groups 412.735 554 .745
Total 432.774 557
The table 20 below gives the post hoc analysis of the satisfaction levels of the individual income
groups f the customers from the mutual funds that are provided by the banks under study. The
customers belonging to the income group of r5, 00,000 to r10, 00,000 are the least satisfied
customers with the value of 5.21 and the customers belonging to the income level of up to
r2, 00,000 are the most satisfied among all the groups with the value 5.43.

Asian Research Journals
http://www.tarj.in 81
A Publication of the Asian Research Journals
AJMR Asian Journal of Multidimensional Research
Vol.1 Issue 2, July 2012, ISSN 2278-4853
TABLE 20: SATISFACTION OF MUTUAL FUNDS AND INCOME
Tukey Ba,b
INCOME
N
Subset for alpha = 0.05
1
5,00,000-10,00,000 118 5.21
10,00,000 & Above 16 5.25
2,00,000-5,00,000 283 5.36
Upto 2,00,000 141 5.43
Means for groups in homogeneous subsets are displayed.
a. Uses Harmonic Mean Sample Size = 49.019.
The table 21 below gives the post hoc analysis of the satisfaction of the customers of different
income groups with respect to the use of insurance services. The customers belonging to the
income group of r5, 00,000 to r10, 00,000 has the maximum satisfaction from the use of the
insurance services provided by the banks with the value 5.84 and the minimum satisfaction is for
the income group of r2, 00,000 to r5, 00,000 with value 5.23.
TABLE 21: SATISFACTION OF INSURANCE SERVICES AND INCOME
Tukey Ba,b
INCOME
N
Subset for alpha = 0.05
1
2,00,000-5,00,000 283 5.23
Upto 2,00,000 141 5.72
10,00,000 & Above 16 5.81
5,00,000-10,00,000 118 5.84
Means for groups in homogeneous subsets are displayed.
Asian Research Journals
http://www.tarj.in 82
A Publication of the Asian Research Journals
AJMR Asian Journal of Multidimensional Research
Vol.1 Issue 2, July 2012, ISSN 2278-4853
a. Uses Harmonic Mean Sample Size = 49.019.
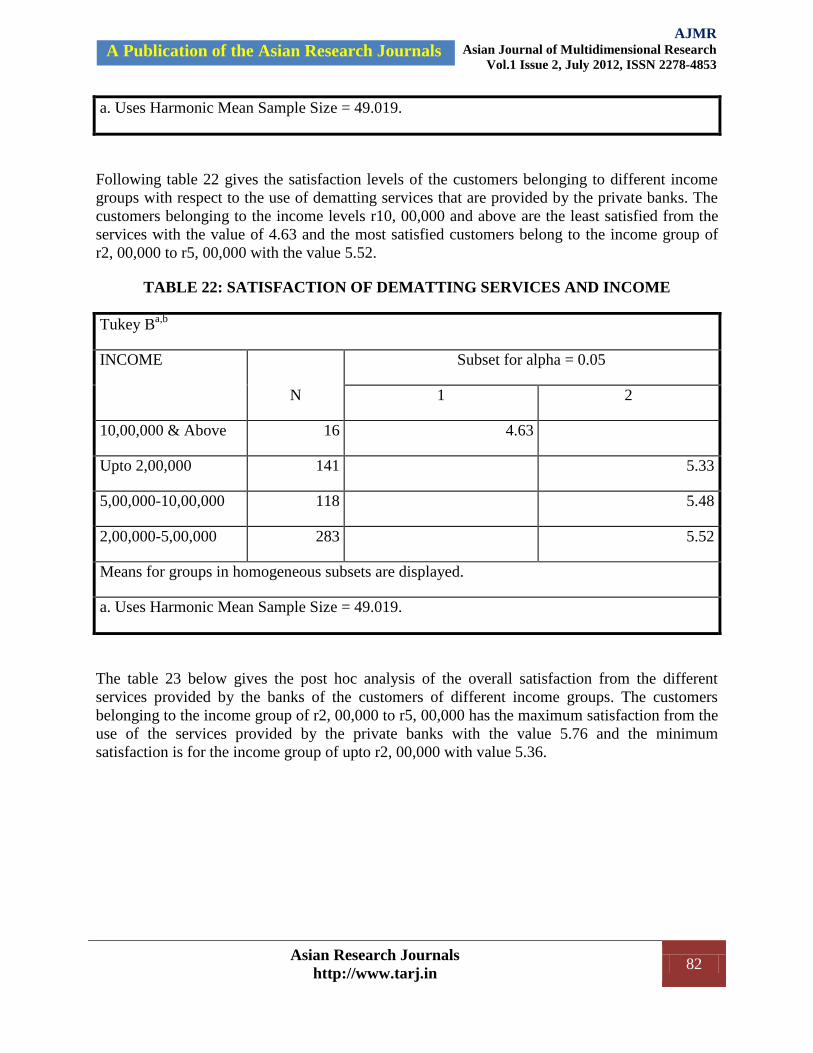
Following table 22 gives the satisfaction levels of the customers belonging to different income
groups with respect to the use of dematting services that are provided by the private banks. The
customers belonging to the income levels r10, 00,000 and above are the least satisfied from the
services with the value of 4.63 and the most satisfied customers belong to the income group of
r2, 00,000 to r5, 00,000 with the value 5.52.
TABLE 22: SATISFACTION OF DEMATTING SERVICES AND INCOME
Tukey Ba,b
INCOME
N
Subset for alpha = 0.05
1 2
10,00,000 & Above 16 4.63
Upto 2,00,000 141 5.33
5,00,000-10,00,000 118 5.48
2,00,000-5,00,000 283 5.52
Means for groups in homogeneous subsets are displayed.
a. Uses Harmonic Mean Sample Size = 49.019.
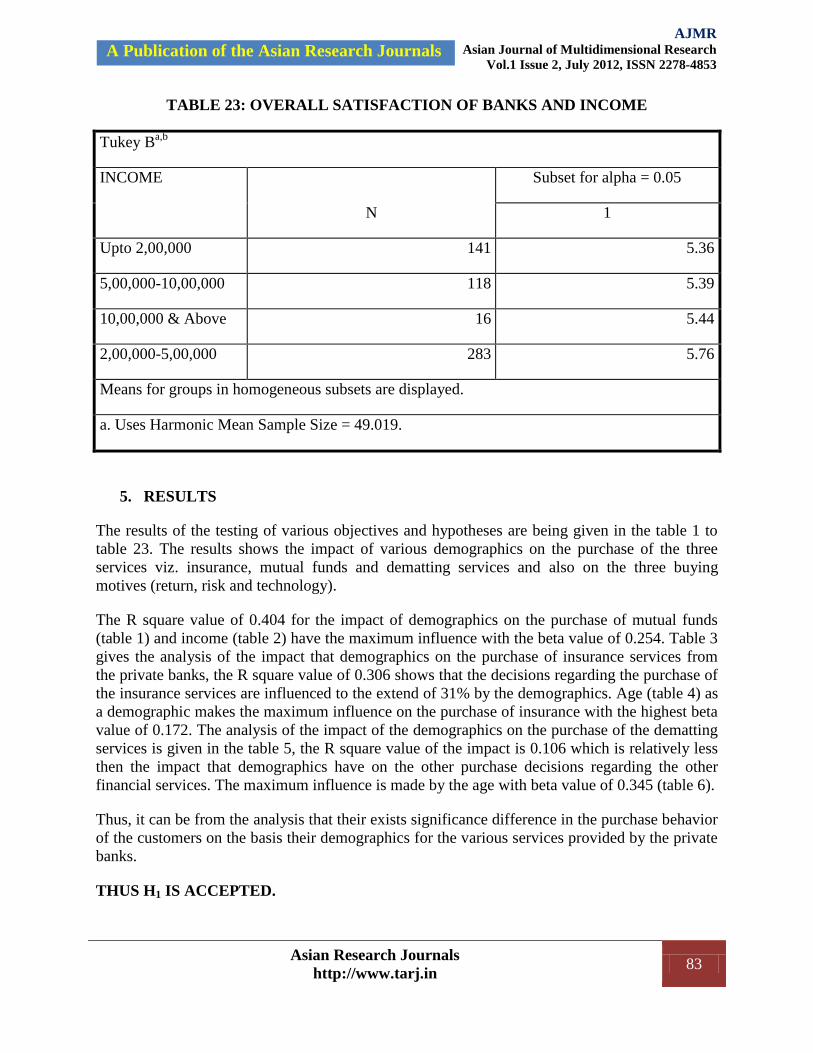
The table 23 below gives the post hoc analysis of the overall satisfaction from the different
services provided by the banks of the customers of different income groups. The customers
belonging to the income group of r2, 00,000 to r5, 00,000 has the maximum satisfaction from the
use of the services provided by the private banks with the value 5.76 and the minimum
satisfaction is for the income group of upto r2, 00,000 with value 5.36.
Asian Research Journals
http://www.tarj.in 83
A Publication of the Asian Research Journals
AJMR Asian Journal of Multidimensional Research
Vol.1 Issue 2, July 2012, ISSN 2278-4853
TABLE 23: OVERALL SATISFACTION OF BANKS AND INCOME
Tukey Ba,b
INCOME
N
Subset for alpha = 0.05
1
Upto 2,00,000 141 5.36
5,00,000-10,00,000 118 5.39
10,00,000 & Above 16 5.44
2,00,000-5,00,000 283 5.76
Means for groups in homogeneous subsets are displayed.
a. Uses Harmonic Mean Sample Size = 49.019.
5. RESULTS
The results of the testing of various objectives and hypotheses are being given in the table 1 to
table 23. The results shows the impact of various demographics on the purchase of the three
services viz. insurance, mutual funds and dematting services and also on the three buying
motives (return, risk and technology).
The R square value of 0.404 for the impact of demographics on the purchase of mutual funds
(table 1) and income (table 2) have the maximum influence with the beta value of 0.254. Table 3
gives the analysis of the impact that demographics on the purchase of insurance services from
the private banks, the R square value of 0.306 shows that the decisions regarding the purchase of
the insurance services are influenced to the extend of 31% by the demographics. Age (table 4) as
a demographic makes the maximum influence on the purchase of insurance with the highest beta
value of 0.172. The analysis of the impact of the demographics on the purchase of the dematting
services is given in the table 5, the R square value of the impact is 0.106 which is relatively less
then the impact that demographics have on the other purchase decisions regarding the other
financial services. The maximum influence is made by the age with beta value of 0.345 (table 6).
Thus, it can be from the analysis that their exists significance difference in the purchase behavior
of the customers on the basis their demographics for the various services provided by the private
banks.
THUS H1 IS ACCEPTED.

Asian Research Journals
http://www.tarj.in 84
A Publication of the Asian Research Journals
AJMR Asian Journal of Multidimensional Research
Vol.1 Issue 2, July 2012, ISSN 2278-4853
The analysis of objective 2 shows that the demographics do have a significant impact on the
various buying motives. Table 7 gives the regression analysis of the impact of the demographics
on the buying motive return. The R square value of 0.505 with p value of 0.001 reveals that the
demographics have an impact of 51% on the buying motive return. The table 8 shows that out of
three demographics age, income and gender, income has the maximum impact on the decisions
with beta value of 0.716 followed by age and gender. The impact of the demographics on the risk
associated with the services provide by the private banks is given in the table 9. The R square
value of 0.958 shows that the demographics have a very high positive impact on the decisions
that the consumers make. Age as a demographic (table 10) has the maximum influence with the
beta value of 0.967. The R square value of 0.485 (table 11) shows the impact that demographics
have on the technology aspect of the services that are provided by the banks. The impact of the
individual demographics is given in the table 12 with gender having the maximum influence with
beta value of 0.582. It is seen that the demographics do have a significant positive impact on the
different buying motives of the consumers.
THUS H2 IS ACCEPTED.
The objective 3 and the hypothesis 3 for satisfaction and influence of demographics have been
analyzed. As confirmed by basic statistics and F-tests in the table 13 regarding the satisfaction of
the customers of different age groups. The values calculated are more then the standard value of
2.6049, thus rejecting the null hypothesis that „There is no significant difference in the
satisfaction levels of the customers of different age groups‟. The post hoc analysis of various
statements reveals the satisfaction levels of the customers from the various financial services
provided by the banks. For mutual funds (table 14) the customers belonging to the age group 45
and above are the most satisfied with the value of 5.64, for insurance services (table 15) the
customers of age group 18-25 were the most satisfied with value of 5.79, again the customers of
the age group 36-45 are the one who were highly satisfied by the use of dematting services (table
16) with value of 5.64 and the customers belonging to the age group of 26-35 (table 17) are the
most satisfied with the overall services of the banks with value of 5.75.
Table 18 gives the ANOVA analysis between the satisfaction and gender. The F values in table
are higher then the standard value of 2.60 rejecting the null hypothesis that there is significant
difference in the satisfaction of customers of different genders. The analysis between the
satisfaction and income is given in table 19. The F values of the different statements of the
analysis are less then the standard F value of 2.98 again rejecting the null hypothesis about
existence of a difference of satisfaction between the customers of different income groups. The
post hoc analysis of income and satisfaction mentions that the various financial services have
different satisfaction levels for the different income groups. Table 20 gives the level of
satisfaction of mutual funds and the income group of upto r 2, 00,000, has the highest level of
satisfaction in terms of use of mutual funds among the different income groups. For the
insurance services (table 21) the income group of r5,00,000 to r 10, 00,000 has the highest
satisfaction as compared with other income groups, and for dematting services (table 22) the
income group with highest satisfaction is r2,00,000 to r 5,00,000 and above with value of 5.52.
Table 23 gives the overall satisfaction level of customers with respect to income; the income
group of r 2, 00,000 to r 5, 00,000 with value 5.52 has the highest satisfaction.

Asian Research Journals
http://www.tarj.in 85
A Publication of the Asian Research Journals
AJMR Asian Journal of Multidimensional Research
Vol.1 Issue 2, July 2012, ISSN 2278-4853
Hence H3 is accepted.
6. DISCUSSIONS
An attempt has been made to understand the impact of the demographics on the buying motives
of the customers belonging to private banks. The emergence of various banks post liberalization
has increased the competition. It is not only that the private sector banks are competing with each
other for the traditional banking services but also for the different services that have emerged as
the non traditional banking services. Theories on the individuals buying and investments
decisions have already established that the demographics have a major control over the purchase
decisions that they make. The R square values of 0.404 for mutual funds, 0.306 and 0.101 for
dematting services of the impact of the demographics do reveal that they make quite an influence
on the purchase decisions of the customers. The results of demographics impact on the return is
0.505, risk perception is 0.958 and technology is 0.485 thereby represent high influence the
demographics of a customer make on the three buying motives for the services provided by the
private banks. Therefore, it is imperative for the banks to understand the implications of the
demographics, as it would help them cater to the needs of the customers. It is evident from the
ANOVA analysis that the level of satisfaction is different for the customers belonging to private
banks of the same age and income groups. The level of satisfaction for the respondents of the age
group 45 and above with regard to the usage of the mutual funds is 5.64 for private banks and the
value is low for the customers belonging to the age group of 36-45 at 5.15. In this perspective the
private banks need to make an extra effort to fulfill the expectations of the age group belonging
to 36-45. The banks may lower the fees or charges or develop some discount schemes on the
purchases by using the credit cards. The customers belonging to the age group of 36-45 are least
satisfied from the insurance services provided by the private banks in comparison to the other
age groups. This could be again due to the reason of their future return preferences. Therefore the
banks need to understand the preferences accordingly making products that will suit those needs.
The banks also need to understand that this age group is looking at the post retirement returns
and benefits from the investments that they are doing with the banks. Hence, the banks need to
develop new products that accommodate their needs and preferences. For dematting services the
age group of 18-25 is the least satisfied lot among the all. This could be due to the reason that the
customers belonging to this age group are the ones who have began their earnings just now and
their knowledge about the various financial and capital markets are limited therefore the banks
need to develop better relationship with this age group and should also try to teach them about
the functioning of the markets as this age group will have a high life time value as compared to
the other age groups. In terms of the mutual funds the customers of the income group r5, 00,000
to r10, 00,000 and above are least happy, the private banks need to understand the reason and
plan their plan their products according to the needs of this particular income group and also they
should invest their money in the instruments that they desire. Insurance services that the private
banks provide are not liked by the customers belonging to the income group of r2, 00,000 to
r5, 00,000. Now it is imperative for the banks to understand that these are the income groups
with a limited disposable incomes so the expectations these customers have from their
investments is quite different from the other income groups therefore any negative fluctuations
are not appreciated by them. Therefore they need to again develop these products which are
specific to the customers belonging to this income group. For the dematting services the
customers belonging to the income group of r10, 00,000 and above are the least satisfied by this
Asian Research Journals
http://www.tarj.in 86
A Publication of the Asian Research Journals
AJMR Asian Journal of Multidimensional Research
Vol.1 Issue 2, July 2012, ISSN 2278-4853
particular service provided by the banks. This could be due to fact that these customers belong to
high disposable income group and the investments that they are doing is high as compared to the
other income groups, so they are looking at the better and personalized services from the banks.
Hence the banks should develop a better understanding of the customers of this particular income
group and deliver accordingly. The banks that make an effort in understanding the behavioral
dimensions of the customers are better positioned in terms of profitability as compared to the
banks that overlook this particular aspect. This understanding will help the banks to develop
more customized products and services for their customers and also develop a better relationship
between the banks and their customers. This would help banks to meet specific needs of the
customers and thus have more satisfied customers.
7. CONCLUSION
The main purpose of this paper is to understand the impact of the various demographics of the
customers of the private banks on the purchase of the three financial services (mutual funds,
insurance services and dematting services) and the impact on the buying motives. Another
purpose was to find out the satisfaction levels of the customers belonging to different age groups
and income groups with the services provided by the private banks under study.
It is seen that the demographics do make a positive significant impact on the purchase of various
financial services and also on the various buying motives. Thus better understanding of the
impact of the demographics will help the banks to develop the products and services in a much
better manner so that they will be able to sell more products and have better profitability.
The banks must maximize customer satisfaction, as the cross selling of the services for profit is
highly dependent on how satisfied the consumers are. This can be done by building a long-term
relationship with customers by further investing in customer relationship management. Banks
must continuously develop customer reward programs that concretely compensate customers.
Further, interpersonal relationships between banks and customer are factors that retain
customers, even when competitors try to win them over with lower prices or offers of other
conveniences.
The satisfaction of the various services is different and the banks providing umbrella services
need to identify that the different customers have different satisfaction levels for the different
services that hey are using as effect on customer satisfaction and customer loyalty. Hence, the
banks must increase the satisfaction in order to increase customer lifetime value and customer
retention, while developing and carrying out relationship-oriented marketing strategies to
enhance interpersonal relationships with customers.
REFERENCES
Bajtelsmit, V. L., & Bernasek, A. (1996). Why do women invest differently than men? Financial
Counseling and Planning, 7, 1–10.
Bajtelsmit, V. L., Bernasek, A., & Jianakoplos, N. A. (1999). Gender differences in defined
contribution pension schemes. Financial Services Review, 8, 1–10.

Asian Research Journals
http://www.tarj.in 87
A Publication of the Asian Research Journals
AJMR Asian Journal of Multidimensional Research
Vol.1 Issue 2, July 2012, ISSN 2278-4853
Blattberg, R. C., & Deighton, J. (1996). „Managing marketing by the customer equity test‟,
Harvard Business Review, 74 (July-August), 136–144.
Cohen R. Lewellen, W.R.Lease, R.C. and G.G.Schlarbaum. (1975). „Individual investor risk
aversion an investment portfolio comparision.‟ Journal of Finance 30, 605-620
Cohen R. Lewellen, W.R.Lease, R.C. and G.G.Schlarbaum. (1975). „Individual investor risk
aversion an investment portfolio comparision.‟ Journal of Finance 30, 605-620.
Friedman, Milton (1957). “A Theory of the Consumption Function”. Princeton University Press.
Grossman, Sanford and Joseph Stiglitz (1980), “On the Impossibility of Informational Efficient
Markets,” American Economic Review 61, 393-408
Indian Economic Survey 2010-11 published by Ministry of Finance, Government of India.
Retrieved March 14, 2011 from http://indiabudget.nic.in/index.asp.
International Monetary Fund (IMF) (2010a), Global Financial Stability Report: Sovereigns,
Funding, and Systemic Liquidity, October 2010, available at
www.imf.org/External/Pubs/FT/GFSR/2010/02/index.htm.
Kamakura, W. A., Ramaswami, S. N., & Srivastava, R. K. (1991). „Applying latent trait analysis
in the evaluation of prospects for cross–selling of financial services‟, International Journal of
Research in Marketing, 8 (4), 329–350.
McInish, T. H. (1982). Individual investors and risk-taking. Journal of Economic Psychology, 2,
125–136
McKinney, V., Yoon, K., Zahedi, F.M., (2002) „The Measurement of Web-Customer
Satisfaction: An expectation and Disconfirmation Approach.‟ Information System Research, Vol.
13, No. 3, September, pp. 296-315.
Morin, R. A., & Suarez, A. F. (1983). Risk aversion revisited. Journal of Finance, 38, 1201–
1216.
Oliver, R. L. (1997). „Satisfaction: A behavioral perspective on the consumer‟. Boston: Irwin
McGraw-Hill.
Riley, W. B., & Chow, K. V. (1992). Asset allocation and individual risk aversion. Financial
Analysts Journal, 48, 32–37.
Rust, R. T., Zeithaml, V. A., & N. Lemon, K. N. (2000). „Driving customer equity; How
customer life time value is reshaping corporate strategy‟, New York: The Free Press.
Wallach, M. M., & Kogan, N. (1961). Aspects of judgment and decision making:
interrelationships and changes with age. Behavioral Science, 6, 23–26.

Asian Research Journals
http://www.tarj.in 88
A Publication of the Asian Research Journals
AJMR Asian Journal of Multidimensional Research
Vol.1 Issue 2, July 2012, ISSN 2278-4853
Yoo, Peter S. (1994a). “Age Distribution and Returns of Financial Assets”. Federal Reserve
Bank of St. Louis. Working Paper 94-002B.
Yoo, Peter S. (1994b). “Age Dependent Portfolio Selection”. Federal Reserve Bank of St. Louis.
Working Paper 94-003A.
Yoo, Peter S. (1997). “Population growth and Asset Prices”. Federal Reserve Bank of St. Louis.
Working Paper: 97-016A.