analytics of the philippine economy continuity++ …iro.ph/article_doc/cd807f75_bsp presentation -...
TRANSCRIPT

Analytics of the Philippine Economy
Continuity++ Building & Sustaining Strength
Briefing on the Philippine Economy
9 March 2018
Davao

2
Prospects for the Philippine economy remain bright
� PHL economy is expected to sustain growth momentum over the medium term
6.7%6.9% 7.0 –8.0%
7.0 –8.0%
7.0 –8.0%
2016 2017 2018 2019 2020
6.6%(IMF)
6.7%(WB)
6.7%(ADB)
6.7%(WB)
6.8%(ADB)
6.7%(IMF)

3
PH leads the ASEAN pack
“ The Philippines will continue to be the fastest-growing eco nomy inASEAN, despite some stabilization of investment growth.”
World Bank Global Economic Prospects (Jan 2018)

4
Prevailing narrative is favorable � Supportive macroeconomic environment:
� broad-based growth low inflation comfortable external payments
� Healthy banking system
� Disciplined policy frameworks
Key Indicators 2005 – 2009 2010 – 2015 2016 2017
Strong growth Real GDP growth (%) 4.4 6.2 6.9 6.7
Low inflation Headline inflation (%) 5.5 3.4 1.8 3.2Sustained fiscal
disciplineFiscal balance (% of GDP) -1.7 -1.8 -2.4 -2.2
Ample liquidity &
credit
Domestic Liquidity (% of GDP)
(% y-o-y change)
47.215.1
55.613.2
65.612.8
67.311.9
Outstanding loans -U/KBs
(% y-o-y change)8.9 15.7 17.3 19.4
Sound & stable
banking system
Non-performing loans
(% of total loans) - U/KBs*5.0 2.2 1.4 1.2
Capital Adequacy Ratio
(consolidated basis) - U/KBs**16.7 17.2 15.1 15.7 (end-Sep)
Robust external
payments position
Current Account Balance ($ Bn)
(% of GDP)
5.13.6
8.23.2
-1.0-0.3
0.03 (Jan-Sep)0.01 (Jan-Sep)
Gross International Reserves
(months of imports of g/s/inc)6.4 10.8 8.8 8.3
External debt (% of GDP) 46.1 30.9 24.5 23.4 (end-Sep)
External DSR (% of exports of
goods, services & income)12.3 7.9 7.0 6.2 (Jan-Nov)

5
PHL economic growth has been sustained…
Real GDP Growth(year-on-year growth, in %)
Average: 5.2% (1999-2017)
Positive economic growth for 76 consecutive quarters
Average: 6.6% (2013-2017)
6
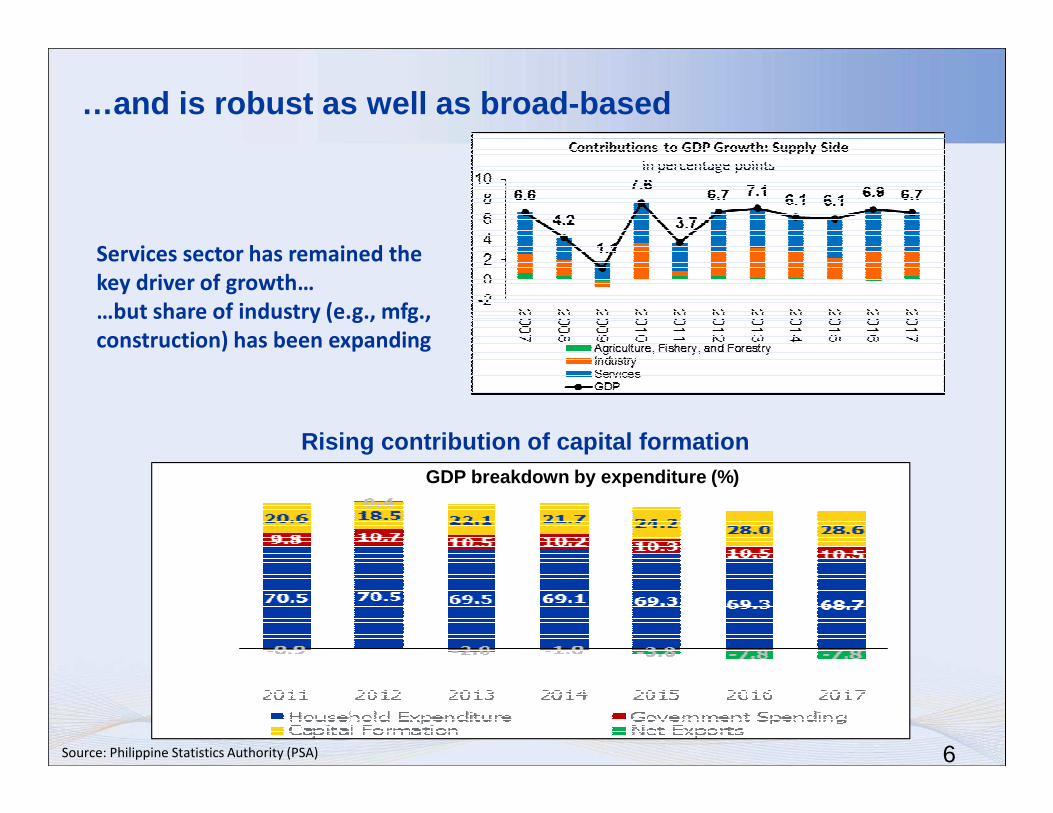
…and is robust as well as broad-based
Source: Philippine Statistics Authority (PSA)
Services sector has remained the
key driver of growth…
…but share of industry (e.g., mfg.,
construction) has been expanding
GDP breakdown by expenditure (%)
Rising contribution of capital formation

7
Strong public infrastructure program
Aggressive investment agenda is the springboard to stronger growth
*Obligation basis 2017 ProgrammedProjections consistent with the medium-term fiscal targets and growth assumptions approved during the 170th Development Budget Coordination Committee (DBCC) Meeting on June 9, 2017
1.8 1.82.0
2.7 2.7
4.14.5
5.4
0.0
100.0
200.0
300.0
400.0
500.0
600.0
700.0
800.0
900.0
1,000.0
0
0.5
1
1.5
2
2.5
3
3.5
4
4.5
5
5.5
6
2010 2011 2012 2013 2014 2015 2016 2017
Infrastructure budget (PHP bn) % of GDP*

8
Rising investments boost growth & create jobs
Source: PSA, NEDA, BSP, * Investment approved by the Philippines’ Investment Promotion Agencies – Board of Investments (BOI), Clark Development Corporation (CDC), Philippine Economic Zone Authority (PEZA),
Subic Bay Metropolitan Authority (SBMA), Authority of the Freeport Area of Bataan (AFAB), BOI-Autonomous Region of Muslim Mindanao (BOI-ARMM), and Cagayan Economic Zone Authority (CEZA)
Real growth (%)
Growing investment pledges favorablefor growth prospects
Considerable foreign interest inmanufacturing sector
Economy increasingly supported by a vibrant manufac turing sector

9
Stable inflation supports greater economic activity
Low and stable inflation Well-anchored inflation expectations
Source: PSA Source: BSP
Sources: AP Consensus (February 2018), Bloomberg Co ntributor Forecasts (as of 8 February 2018), Oxford Economics Forecasts as of 8 February 2018
Inflation Forecasts for the
Philippines2018 2019
Bloomberg Consensus Forecasts
3.6 3.4
Oxford Economics 3.6 3.9
Asia Pacific Consensus 3.9 3.6

Source: BSP, IBPAP
Manageable balance of payments position shields economy from external headwinds
Structural flows from remittances & BPOs
Overseas Filipinos' cash remittances and BPO revenues, ($ bn)
Ample reserves
FX reserves ($bn) and months of import cover
Sustained decline in external debt-to-GDP
External debt ($bn) and external debt/GDP, (%)
2017 BPO revenues based on IBPAP
Resilient foreign direct investments
Non-Residents’ direct investments, by instrument ($ bn, net)

11
Current account components (in US$ bn)
Strong imports growth has led to narrowing of curre nt account surplus
-3
-2
-1
0
1
2
3
4
5
-30
-20
-10
0
10
20
30
40
2005 2006 2007 2008 2009 2010 2011 2012 2013 2014 2015 2016 2017
Goods Exports (lhs) Goods Imports (lhs) BPO receipts (lhs)
OF remittances (lhs) Travel receipts (lhs) Current Account Balance (rhs)
-30.0
-20.0
-10.0
0.0
10.0
20.0
30.0
40.0
-
20,000
40,000
60,000
80,000
100,000
2006 2007 2008 2009 2010 2011 2012 2013 2014 2015 2016 2017
in p
erce
nt
in m
illio
n U
S$
Goods Imports, by major commodity
Capital Goods Mineral Fuels and Lubricant Mat/Acc. for Manufacture of Elec. Eqpt.
Other Raw Materials/Intermediate Goods Consumer Goods Other Imports
Total Imports Growth (in %, RHS)

12Source: BSP
Peso is flexible and competitive
Philippine Peso (PHP) per USD Rate
01 Jan 2016:47.06
8 March 2018:52.03

13
end-December 2017:NPL ratio: 1.2 %NPA ratio: 1.3 %
Sep 2017:CAR (solo): 15.0 %
CAR (consolidated): 15.7 %
Source: BSP
Quality of assets & loan portfolios sustain improvement
PHL banks are adequately capitalized, providing buffers to mitigate shocks
Banking system remains sound & stable

14
13.8 14.415.6 16.5 15.6
14.0 13.4 14.0 14.5 14.9 15.1 15.8 15.2 15.7
17.5 17.0 16.7 16.7 16.517.7 16.9 16.0 16.8 16.3 15.7 16.8 17.6 17.9
-3.7 -2.6-1.0 -0.2 -0.9
-3.7 -3.5-2.0 -2.3 -1.4 -0.6 -0.9
-2.4 -2.2 -3.0 -3.0 -3.0 -3.0 -3.0-5
0
5
10
15
20
2004 2005 2006 2007 2008 2009 2010 2011 2012 2013 2014 2015 2016 2017 2018P 2019P 2020P 2021P 2022PNG Revenues/GDP NG Expenditures/GDP NG Deficit/GDP
Tax reform => headroom for targeted social spending& infrastructure upgrading
Infrastructure Program, Obligation Basis 2018-2022
Fiscal Expenditure, Revenue and Deficit (% of GDP)

15
Source: Latest BSP staff estimates
Source: PSA
Employment Share by Class of Workers Employment Share by Educational Attainment
Improved potential capacity helps sustain growth tr ajectory
Incremental Capital-Output Ratio Total Factor Productivity
9.5
6.44.2 3.7
0.0
2.0
4.0
6.0
8.0
10.0
1989 - 1992 1993 - 2001 2002 - 2009 2010 - 2017
0.0 0.5
2.0 2.1
0.0
0.5
1.0
1.5
2.0
2.5
1989 - 1992 1993 - 2001 2002 - 2009 2010 - 2017
33.426.6
38.141.4
4.7
26.5 25.8
2006 2007 2008 2009 2010 2011 2012 2013 2014 2015 2016 2017
College Post Secondary High School
Elementary (w/ SPED) No Grade Completed
51.162.5
12.36.0
32.3 27.8
4.4 3.7
2006 2007 2008 2009 2010 2011 2012 2013 2014 2015 2016 2017
Employer in Own Family Self-Employed
Unpaid Worker Wage and Salary Workers

16
Philippine Credit Rating
BBB+Affirmed BBB+ rating
stable outlook 2 August 2016
BBBUpgraded rating to BBB
stable outlook10 December 2017
BBBRe-affirmed BBB rating
stable outlook28 April 2017
Baa2Re-affirmed Baa2 rating
stable outlook27 June 2017
Credit rating upgrades: show of faith

17
Year Selected Structural & Policy Reforms
1994 Foreign bank entry liberalized
1995 Telecommunications industry liberalized
1997 Water services privatized
1998 Oil industry deregulated; consolidated bank supervision adopted
2000 Philippine E-Commerce Act passed
2002 Inflation targeting framework adopted by BSP
2003 Government Procurement Reform Act passed
2005 Value-added tax (E-VAT) expanded
2006 VAT rate increased
2007 Risk-based bank supervision fully implemented
2009 TransCo and NPC privatized
2013
2016
Excise tax rates on alcohol and tobacco (“sin taxes”) revised
Further liberalization of FX regulations
A house built of bricks...purposeful structural ref orms

18
Dependency ratios: Philippines2005-2050 (in %)
� Large number of young, skilled & educated working population supports strong growth outlook
…and favorable demographic dynamics
*Source: United Nations, Department of Economic and Social Affairs, Population Division (2017). World Population Prospects: The 2017 Revision,
Volume II: Demographic Profiles (ST/ESA/SER.A/380).
Median Age of the Population (2015):
24.1 years old
Total dependency ratio to decline from
68.2% in 2005 to 50.8% by 2050

19
Looking ahead…
� confident about prospects for expansion in coming years
� storyline of robust home demand alongside improving
external demand remains intact
…but with challenges
What are the challenges to the positive narrative?
� Will growth be crimped by:
� External factors?
� Domestic constraints?

20
On external front: some reasons for caution
� Timing & magnitude of Fed interest rate policy hikes
� Geopolitical concerns
How is BSP preparing for tighter global financial conditions?
� Best defense is good offense: disciplined macroeconomic policies & prudent financial sector oversight help keep “house in order”
� Use full menu of instruments to respond to ebb/flow of capital, including:� exchange rate flexibility� interest rate action � careful/clear communication to manage sentiment

21
� Overheating
� Infrastructure gaps
� Leverage
� Economic inclusion: Jobs challenge
� Natural disasters
On domestic front: some potential stress points
Speed bumps

22
Overheating concerns?� Growth momentum accompanied by substantial rise in credit,
raising concerns
� Fundamentally-driven growth: broadening growth drivers, rising
incomes, growing middle class, favorable labor market dynamics
� Efforts underway to address infrastructure gaps and improve
business environment
Growth momentum accompanied by a substantial rise i n credit, raising concerns
242.2216.5
186.6 183.2158.0 154.4 154.3
138.6123.3
66.241.0
HONG KONG CHINA JAPAN SOUTH
KOREA
SINGAPORE NEW
ZEALAND
AUSTRALIA MALAYSIA THAILAND PHILIPPINES INDONESIA
Domestic Credit as % of GDP
Q4 2017
23
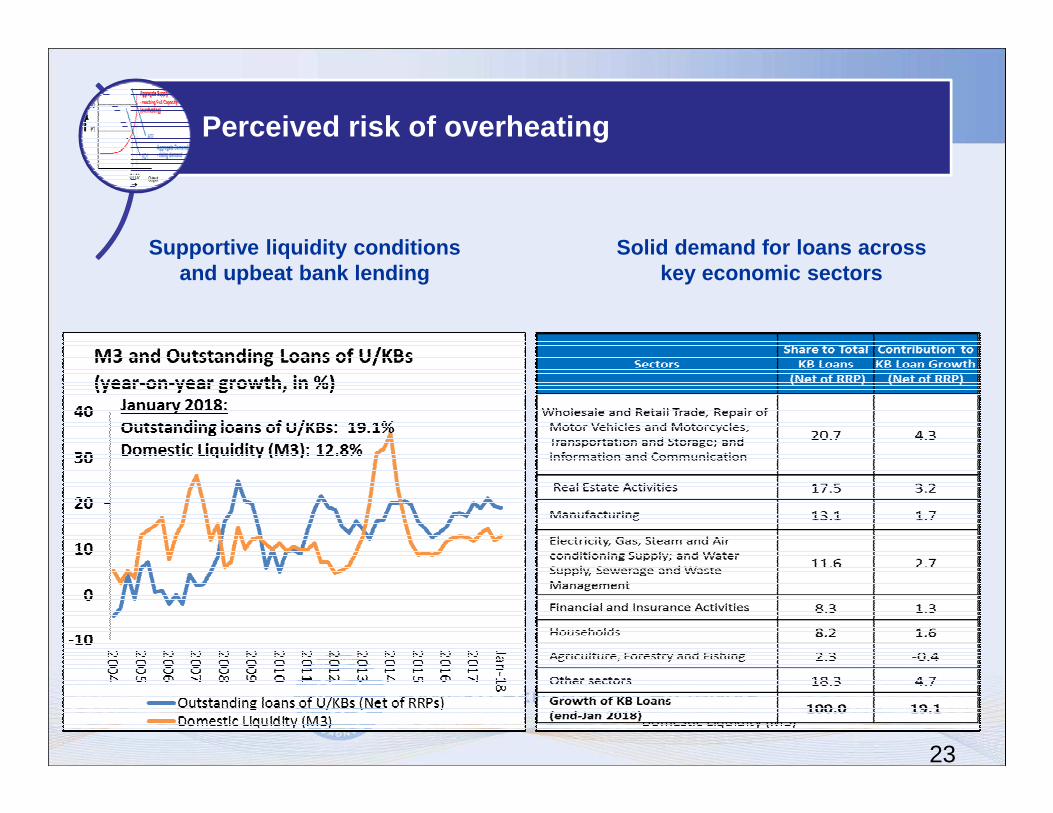
Perceived risk of overheating
Solid demand for loans across key economic sectors
Supportive liquidity conditions and upbeat bank lending

24
Perceived risk of overheating
� Current property prices broadly aligned with fundamentals
Source: BSP Source: BSP
25
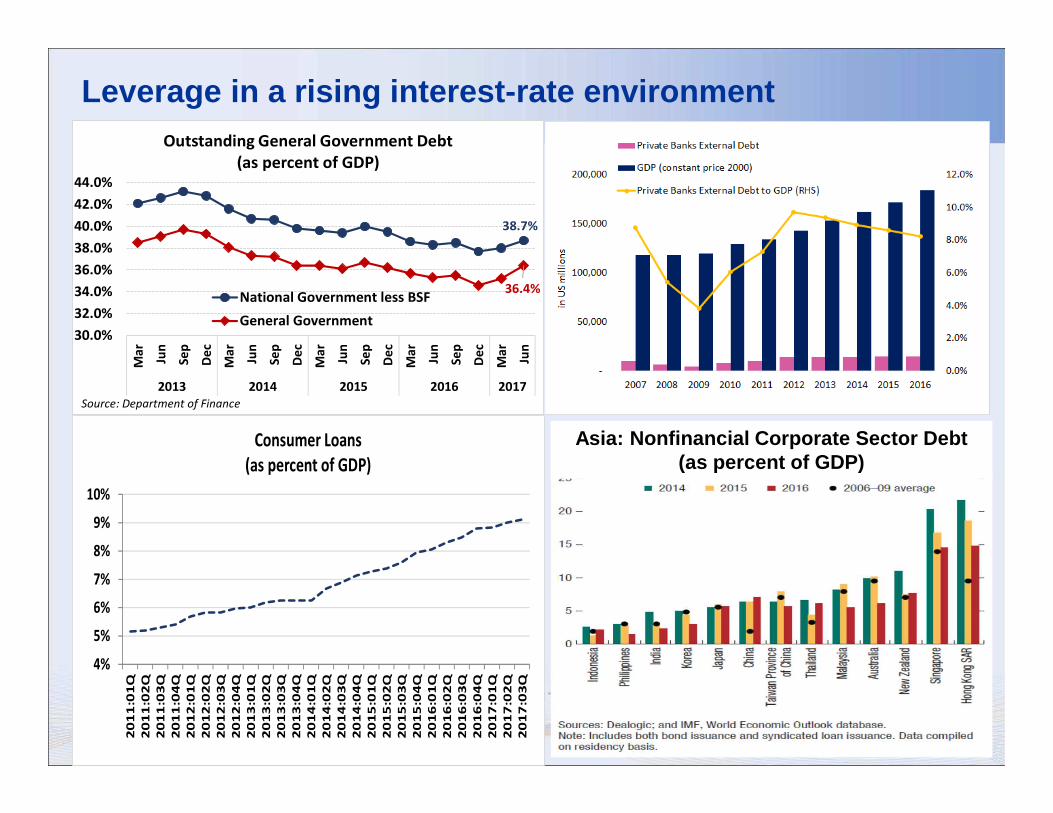
38.7%
36.4%
30.0%
32.0%
34.0%
36.0%
38.0%
40.0%
42.0%
44.0%
Ma
r
Jun
Se
p
De
c
Ma
r
Jun
Se
p
De
c
Ma
r
Jun
Se
p
De
c
Ma
r
Jun
Se
p
De
c
Ma
r
Jun
2013 2014 2015 2016 2017
Outstanding General Government Debt
(as percent of GDP)
National Government less BSF
General Government
Source: Department of Finance
Asia: Nonfinancial Corporate Sector Debt(as percent of GDP)
Leverage in a rising interest-rate environment
4%
5%
6%
7%
8%
9%
10%
20
11
:01
Q
20
11
:02
Q
20
11
:03
Q
20
11
:04
Q
20
12
:01
Q
20
12
:02
Q
20
12
:03
Q
20
12
:04
Q
20
13
:01
Q
20
13
:02
Q
20
13
:03
Q
20
13
:04
Q
20
14
:01
Q
20
14
:02
Q
20
14
:03
Q
20
14
:04
Q
20
15
:01
Q
20
15
:02
Q
20
15
:03
Q
20
15
:04
Q
20
16
:01
Q
20
16
:02
Q
20
16
:03
Q
20
16
:04
Q
20
17
:01
Q
20
17
:02
Q
20
17
:03
Q
Consumer Loans
(as percent of GDP)

26
� Structural rather than cyclical story of economic growth
� Disciplined policies and purposeful structural reforms have yielded
dividends.
� Economy is in position of strength to weather volatilities.
What can bring PHL economy to the next level?
� Continued macroeconomic discipline (the ABC’s: ammunition,
buffers, communication)
� It’s all about the I’s (infrastructure, institutions, inclusiveness)
Key Messages
Analytics of the Philippine Economy
Continuity++ Building & Sustaining Strength
Briefing on the Philippine Economy
9 March 2018
Davao