analytics deck - rgpv.ac.in
TRANSCRIPT

© 2020 SHL and its affiliates. All rights reserved.
Analytics Deck
Rajiv Gandhi ProudyogikiVishwavidyalaya
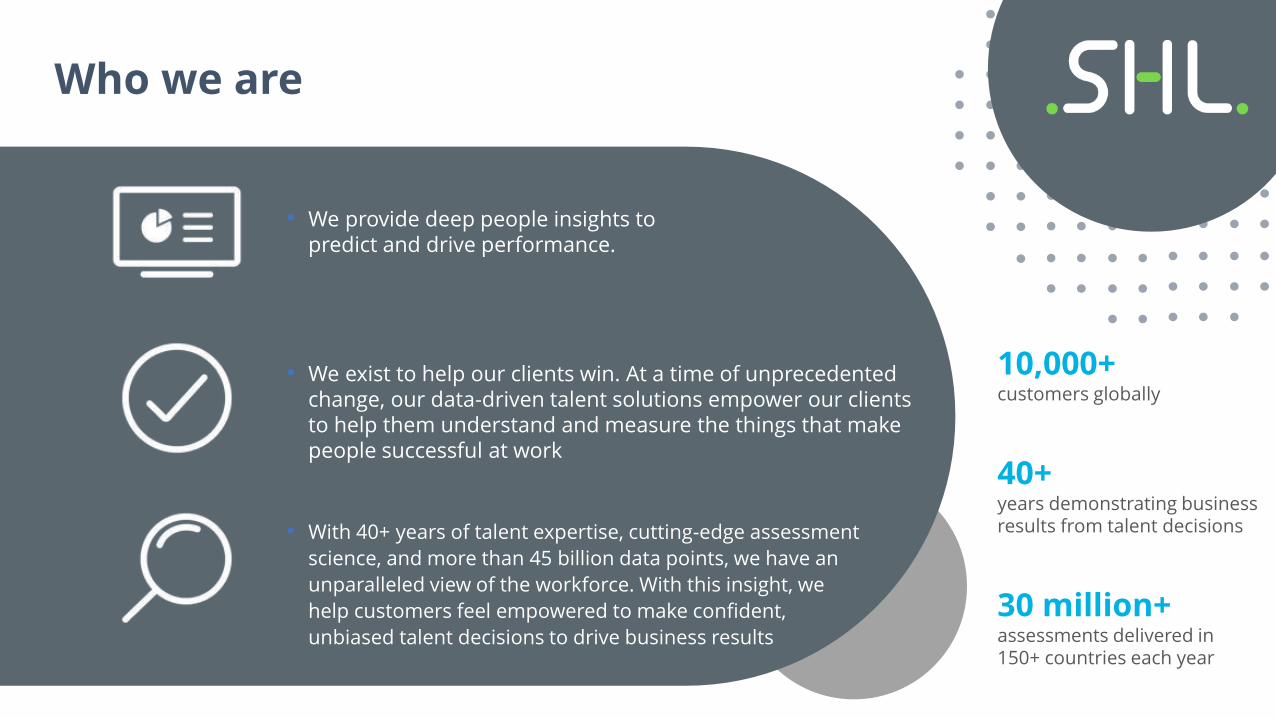
• With 40+ years of talent expertise, cutting-edge assessment
science, and more than 45 billion data points, we have an
unparalleled view of the workforce. With this insight, we
help customers feel empowered to make confident,
unbiased talent decisions to drive business results
• We exist to help our clients win. At a time of unprecedented change, our data-driven talent solutions empower our clients to help them understand and measure the things that make people successful at work
• We provide deep people insights to predict and drive performance.
Who we are
10,000+customers globally
40+years demonstrating business results from talent decisions
30 million+assessments delivered in 150+ countries each year

Assessment Snapshot
S.No Campus Name 2nd Year 3rd Year Total
1 Acropolis Inst. of Tech & Research 605 477 1,082
2 Adina Inst. of Science & Tech 116 99 215
3 Bansal Inst. of Research & Tech 93 70 163
4 Chameli Devi Group of Institutions 281 212 493
5 Global Nature Care Sangathan Group of Instt. 243 216 459
6 Gyan Ganga Inst. of Tech 226 326 552
7 Gyan Sagar College of Engg 130 95 225
8 IES Inst. of Tech & Mgmt 151 99 250
9 IES College of Tech 354 372 726
10 Indore Inst. of Science & Tech 80 52 132
11 Jawaharlal Inst. of Tech 309 139 448
12 Lakshmi Narain College of Tech 921 861 1,782
13 Mahakal Institute of Tech 211 137 348
14 Ojaswini Institute of Mgt & Tech 47 54 101
15 Oriental Inst. of Science & Tech 177 45 222
16 Prestige Inst. of Engg Mgmt & Research 133 77 210
S.No Campus Name 2nd Year 3rd Year Total
17 Pt. Dev Prabhakar Shastri CET 44 33 77
18 Rustamji Institute of Tech 314 256 570
19 Sagar Inst. of Research & Tech 292 433 725
20 Sagar Inst. of Research Tech & Science 92 167 259
21 Sagar Inst. of Science & Tech 38 63 101
22 Shri Balaji Inst. of Tech & Mgt 118 76 194
23 Shriram College of Engg & Mgt 4 4 8
24 Shri Yogendra Sagar Inst. of Tech & Science 32 22 54
25 Shri Dadaji Inst. of Tech & Science 86 53 139
26 Technocrats Inst. of Tech 193 183 376
27 Technocrats Inst. of Tech & Science 34 68 102
28 Technocrats Inst. of Tech Excellence 55 87 142
29 Thakur Shiv Kumar Singh Memorial Engg College 102 111 213
30 University Inst. of Tech 430 433 863
31 Vindhya Inst. of Tech & Science 166 83 249
Grand Total 6077 5403 11480

© 2020 SHL and its affiliates. All rights reserved.
AMCAT Mean Scores and Comparison with National Average
3rd Year
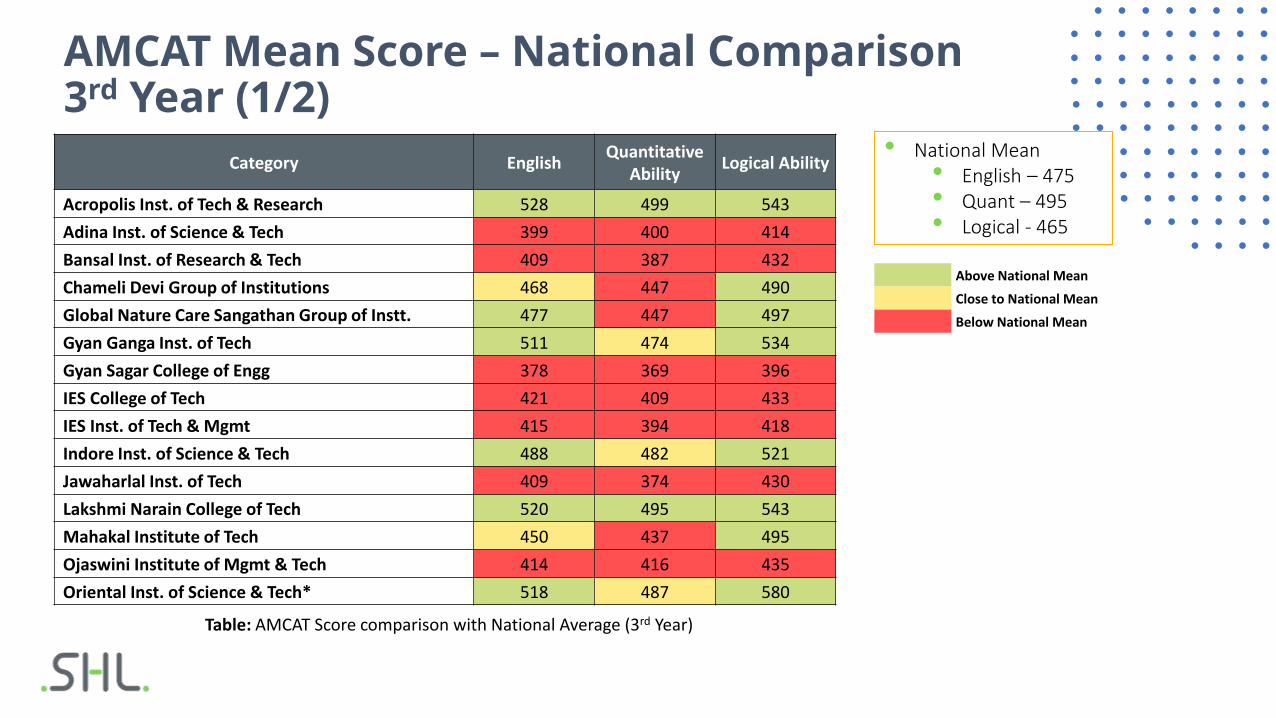
AMCAT Mean Score – National Comparison3rd Year (1/2)
• National Mean• English – 475• Quant – 495• Logical - 465
Above National Mean
Close to National Mean
Below National Mean
Category EnglishQuantitative
AbilityLogical Ability
Acropolis Inst. of Tech & Research 528 499 543
Adina Inst. of Science & Tech 399 400 414
Bansal Inst. of Research & Tech 409 387 432
Chameli Devi Group of Institutions 468 447 490
Global Nature Care Sangathan Group of Instt. 477 447 497
Gyan Ganga Inst. of Tech 511 474 534
Gyan Sagar College of Engg 378 369 396
IES College of Tech 421 409 433
IES Inst. of Tech & Mgmt 415 394 418
Indore Inst. of Science & Tech 488 482 521
Jawaharlal Inst. of Tech 409 374 430
Lakshmi Narain College of Tech 520 495 543
Mahakal Institute of Tech 450 437 495
Ojaswini Institute of Mgmt & Tech 414 416 435
Oriental Inst. of Science & Tech* 518 487 580
Table: AMCAT Score comparison with National Average (3rd Year)

AMCAT Mean Score – National Comparison3rd Year (2/2)
Category EnglishQuantitative
AbilityLogical Ability
Prestige Inst. of Engg Mgmt & Research 473 442 506
Pt. Dev Prabhakar Shastri CET* 413 411 431
Rustamji Institute of Tech 490 483 525
Sagar Inst. of Research & Tech 463 440 484
Sagar Inst. of Research Tech & Science 421 408 443
Sagar Inst. of Science & Tech 464 519 507
Shri Balaji Inst. of Tech & Mgmt 407 374 426
Shri Dadaji Inst. of Tech & Science 415 389 438
Shri Yogendra Sagar Inst. of Tech & Science* 438 409 490
Shriram College of Engg & Mgmt* 445 429 516
Technocrats Inst. of Tech 514 536 559
Technocrats Inst. of Tech & Science 465 482 532
Technocrats Inst. of Tech Excellence 471 448 508
Thakur Shiv Kumar Singh Memorial Engg College 412 400 427
University Inst. of Tech 528 543 565
Vindhya Inst. of Tech & Science 405 394 409
• Only 4 campuses i.e. Acropolis, LNCT, TIT & UIT have scored above national in English, Quant & Logical
• 12 campuses have their scores below national average in all 3 modules
• National Mean• English – 475• Quant – 495• Logical - 465
Above National Mean
Close to National Mean
Below National Mean
Table: AMCAT Score comparison with National Average (3rd Year)
© 2020 SHL and its affiliates. All rights reserved.
AMCAT Mean Score – National Comparison(Category-wise)
AMCAT Mean Scores and Comparison with National Average
2nd Year

AMCAT Mean Score – National Comparison2nd Year (1/2)
• National Mean• English – 475• Quant – 495• Logical - 465
Above National Mean
Close to National Mean
Below National Mean
Table: AMCAT Score comparison with National Average (2nd Year)
Category EnglishQuantitative
AbilityLogical Ability
Acropolis Inst. of Tech & Research 513 497 538
Adina Inst. of Science & Tech 388 373 398
Bansal Inst. of Research & Tech 410 387 430
Chameli Devi Group of Institutions 449 436 482
Global Nature Care Sangathan Group of Instt. 466 437 491
Gyan Ganga Inst. of Tech 500 471 516
Gyan Sagar College of Engg 401 369 401
IES College of Tech 401 384 399
IES Inst. of Tech & Mgmt 414 391 404
Indore Inst. of Science & Tech 449 421 475
Jawaharlal Inst. of Tech 398 390 404
Lakshmi Narain College of Tech 503 487 525
Mahakal Institute of Tech 448 424 482
Ojaswini Institute of Mgmt & Tech* 403 406 416
Oriental Inst. of Science & Tech 488 477 507

AMCAT Mean Score – National Comparison2nd Year (2/2)
• Only 2 campuses i.e. Acropolis & UIT have scored above national in English, Quant & Logical
• 13 campuses have their scores below national average in all 3 modules
• National Mean• English – 475• Quant – 495• Logical - 465
Above National Mean
Close to National Mean
Below National Mean
Table: AMCAT Score comparison with National Average (2nd Year)
Category EnglishQuantitative
AbilityLogical Ability
Prestige Inst. of Engg Mgmt & Research 455 444 492
Pt. Dev Prabhakar Shastri CET* 405 401 428
Rustamji Institute of Tech 474 471 514
Sagar Inst. of Research & Tech 467 441 496
Sagar Inst. of Research Tech & Science 451 424 452
Sagar Inst. of Science & Tech* 433 416 472
Shri Balaji Inst. of Tech & Mgmt 404 392 430
Shri Dadaji Inst. of Tech & Science 411 405 413
Shri Yogendra Sagar Inst. of Tech & Science* 405 385 439
Shriram College of Engg & Mgmt* 421 561 546
Technocrats Inst. of Tech 477 476 523
Technocrats Inst. of Tech & Science* 417 414 456
Technocrats Inst. of Tech Excellence 469 471 503
Thakur Shiv Kumar Singh Memorial Engg College 411 384 419
University Inst. of Tech 518 531 565
Vindhya Inst. of Tech & Science 403 395 418
Aptitude-Bucket Analysis(3rd Year)
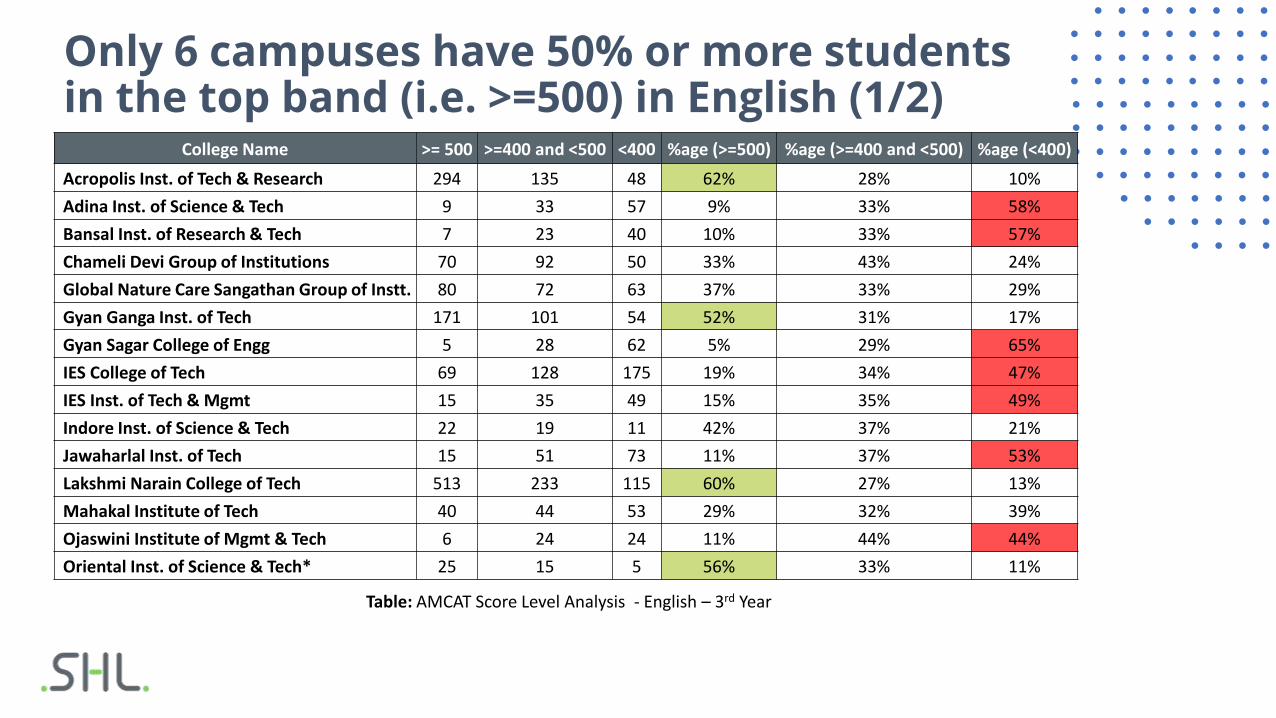
Only 6 campuses have 50% or more students in the top band (i.e. >=500) in English (1/2)
Table: AMCAT Score Level Analysis - English – 3rd Year
College Name >= 500 >=400 and <500 <400 %age (>=500) %age (>=400 and <500) %age (<400)
Acropolis Inst. of Tech & Research 294 135 48 62% 28% 10%
Adina Inst. of Science & Tech 9 33 57 9% 33% 58%
Bansal Inst. of Research & Tech 7 23 40 10% 33% 57%
Chameli Devi Group of Institutions 70 92 50 33% 43% 24%
Global Nature Care Sangathan Group of Instt. 80 72 63 37% 33% 29%
Gyan Ganga Inst. of Tech 171 101 54 52% 31% 17%
Gyan Sagar College of Engg 5 28 62 5% 29% 65%
IES College of Tech 69 128 175 19% 34% 47%
IES Inst. of Tech & Mgmt 15 35 49 15% 35% 49%
Indore Inst. of Science & Tech 22 19 11 42% 37% 21%
Jawaharlal Inst. of Tech 15 51 73 11% 37% 53%
Lakshmi Narain College of Tech 513 233 115 60% 27% 13%
Mahakal Institute of Tech 40 44 53 29% 32% 39%
Ojaswini Institute of Mgmt & Tech 6 24 24 11% 44% 44%
Oriental Inst. of Science & Tech* 25 15 5 56% 33% 11%

Only 6 campuses have 50% or more students in the top band (i.e. >=500) in English (2/2)
College Name >= 500 >=400 and <500 <400 %age (>=500) %age (>=400 and <500) %age (<400)
Prestige Inst. of Engg Mgmt & Research 28 30 19 36% 39% 25%
Pt. Dev Prabhakar Shastri CET* 4 12 17 12% 36% 52%
Rustamji Institute of Tech 116 90 50 45% 35% 20%
Sagar Inst. of Research & Tech 137 166 130 32% 38% 30%
Sagar Inst. of Research Tech & Science 21 79 67 13% 47% 40%
Sagar Inst. of Science & Tech 17 25 21 27% 40% 33%
Shri Balaji Inst. of Tech & Mgmt 6 33 37 8% 43% 49%
Shri Dadaji Inst. of Tech & Science 6 23 24 11% 43% 45%
Shri Yogendra Sagar Inst. of Tech & Science* 3 12 7 14% 55% 32%
Shriram College of Engg & Mgmt* 0 3 1 0% 75% 25%
Technocrats Inst. of Tech 102 61 20 56% 33% 11%
Technocrats Inst. of Tech & Science 20 26 22 29% 38% 32%
Technocrats Inst. of Tech Excellence 27 45 15 31% 52% 17%
Thakur Shiv Kumar Singh Memorial Engg College 19 31 61 17% 28% 55%
University Inst. of Tech 253 113 67 58% 26% 15%
Vindhya Inst. of Tech & Science 9 27 47 11% 33% 57%
Table: AMCAT Score Level Analysis - English – 3rd Year

Only 2 campuses have 50% or more students in the top band (i.e. >=500) in Quant (1/2)
Table: AMCAT Score Level Analysis - Quant – 3rd Year
College Name >= 500 >=400 and <500 <400 %age (>=500) %age (>=400 and <500) %age (<400)
Acropolis Inst. of Tech & Research 220 125 132 46% 26% 28%
Adina Inst. of Science & Tech 15 21 63 15% 21% 64%
Bansal Inst. of Research & Tech 6 16 48 9% 23% 69%
Chameli Devi Group of Institutions 63 51 98 30% 24% 46%
Global Nature Care Sangathan Group of Instt. 58 50 107 27% 23% 50%
Gyan Ganga Inst. of Tech 112 108 106 34% 33% 33%
Gyan Sagar College of Engg 7 13 75 7% 14% 79%
IES College of Tech 69 88 215 19% 24% 58%
IES Inst. of Tech & Mgmt 12 21 66 12% 21% 67%
Indore Inst. of Science & Tech 20 14 18 38% 27% 35%
Jawaharlal Inst. of Tech 11 30 98 8% 22% 71%
Lakshmi Narain College of Tech 405 198 258 47% 23% 30%
Mahakal Institute of Tech 33 37 67 24% 27% 49%
Ojaswini Institute of Mgmt & Tech 8 11 35 15% 20% 65%
Oriental Inst. of Science & Tech* 21 13 11 47% 29% 24%
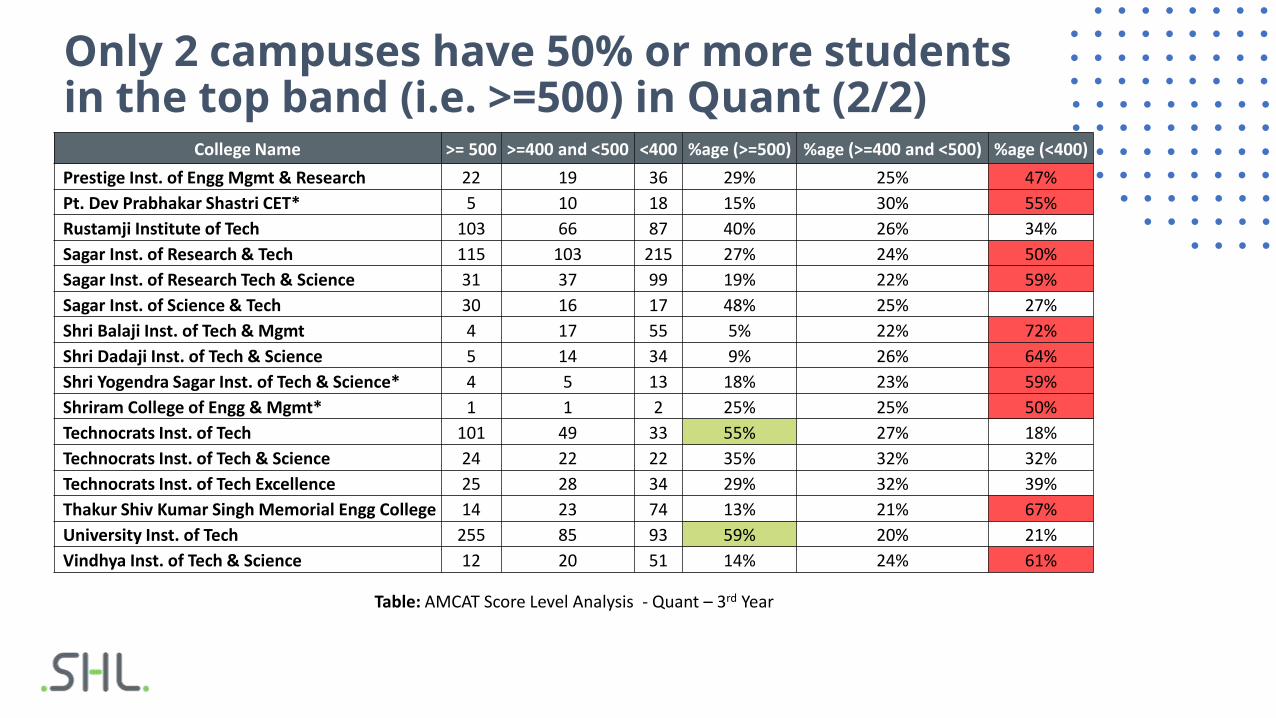
Only 2 campuses have 50% or more students in the top band (i.e. >=500) in Quant (2/2)
Table: AMCAT Score Level Analysis - Quant – 3rd Year
College Name >= 500 >=400 and <500 <400 %age (>=500) %age (>=400 and <500) %age (<400)
Prestige Inst. of Engg Mgmt & Research 22 19 36 29% 25% 47%
Pt. Dev Prabhakar Shastri CET* 5 10 18 15% 30% 55%
Rustamji Institute of Tech 103 66 87 40% 26% 34%
Sagar Inst. of Research & Tech 115 103 215 27% 24% 50%
Sagar Inst. of Research Tech & Science 31 37 99 19% 22% 59%
Sagar Inst. of Science & Tech 30 16 17 48% 25% 27%
Shri Balaji Inst. of Tech & Mgmt 4 17 55 5% 22% 72%
Shri Dadaji Inst. of Tech & Science 5 14 34 9% 26% 64%
Shri Yogendra Sagar Inst. of Tech & Science* 4 5 13 18% 23% 59%
Shriram College of Engg & Mgmt* 1 1 2 25% 25% 50%
Technocrats Inst. of Tech 101 49 33 55% 27% 18%
Technocrats Inst. of Tech & Science 24 22 22 35% 32% 32%
Technocrats Inst. of Tech Excellence 25 28 34 29% 32% 39%
Thakur Shiv Kumar Singh Memorial Engg College 14 23 74 13% 21% 67%
University Inst. of Tech 255 85 93 59% 20% 21%
Vindhya Inst. of Tech & Science 12 20 51 14% 24% 61%
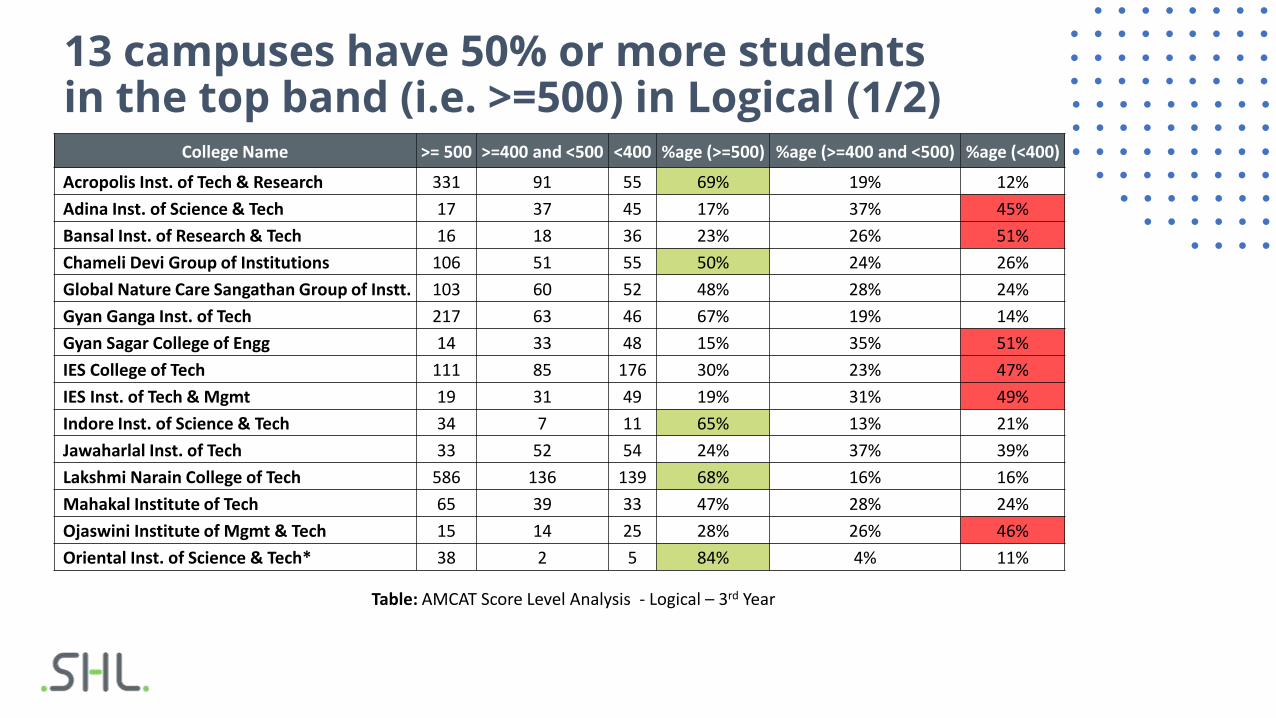
13 campuses have 50% or more students in the top band (i.e. >=500) in Logical (1/2)
Table: AMCAT Score Level Analysis - Logical – 3rd Year
College Name >= 500 >=400 and <500 <400 %age (>=500) %age (>=400 and <500) %age (<400)
Acropolis Inst. of Tech & Research 331 91 55 69% 19% 12%
Adina Inst. of Science & Tech 17 37 45 17% 37% 45%
Bansal Inst. of Research & Tech 16 18 36 23% 26% 51%
Chameli Devi Group of Institutions 106 51 55 50% 24% 26%
Global Nature Care Sangathan Group of Instt. 103 60 52 48% 28% 24%
Gyan Ganga Inst. of Tech 217 63 46 67% 19% 14%
Gyan Sagar College of Engg 14 33 48 15% 35% 51%
IES College of Tech 111 85 176 30% 23% 47%
IES Inst. of Tech & Mgmt 19 31 49 19% 31% 49%
Indore Inst. of Science & Tech 34 7 11 65% 13% 21%
Jawaharlal Inst. of Tech 33 52 54 24% 37% 39%
Lakshmi Narain College of Tech 586 136 139 68% 16% 16%
Mahakal Institute of Tech 65 39 33 47% 28% 24%
Ojaswini Institute of Mgmt & Tech 15 14 25 28% 26% 46%
Oriental Inst. of Science & Tech* 38 2 5 84% 4% 11%

13 campuses have 50% or more students in the top band (i.e. >=500) in Logical (2/2)
Table: AMCAT Score Level Analysis - Logical – 3rd Year
College Name >= 500 >=400 and <500 <400 %age (>=500) %age (>=400 and <500) %age (<400)
Prestige Inst. of Engg Mgmt & Research 43 21 13 56% 27% 17%
Pt. Dev Prabhakar Shastri CET* 10 8 15 30% 24% 45%
Rustamji Institute of Tech 153 61 42 60% 24% 16%
Sagar Inst. of Research & Tech 184 123 126 42% 28% 29%
Sagar Inst. of Research Tech & Science 53 42 72 32% 25% 43%
Sagar Inst. of Science & Tech 35 20 8 56% 32% 13%
Shri Balaji Inst. of Tech & Mgmt 20 25 31 26% 33% 41%
Shri Dadaji Inst. of Tech & Science 12 22 19 23% 42% 36%
Shri Yogendra Sagar Inst. of Tech & Science* 9 8 5 41% 36% 23%
Shriram College of Engg & Mgmt* 2 2 0 50% 50% 0%
Technocrats Inst. of Tech 134 28 21 73% 15% 11%
Technocrats Inst. of Tech & Science 46 11 11 68% 16% 16%
Technocrats Inst. of Tech Excellence 46 24 17 53% 28% 20%
Thakur Shiv Kumar Singh Memorial Engg College 24 37 50 22% 33% 45%
University Inst. of Tech 328 55 50 76% 13% 12%
Vindhya Inst. of Tech & Science 21 13 49 25% 16% 59%

Aptitude-Bucket Analysis(2nd Year)
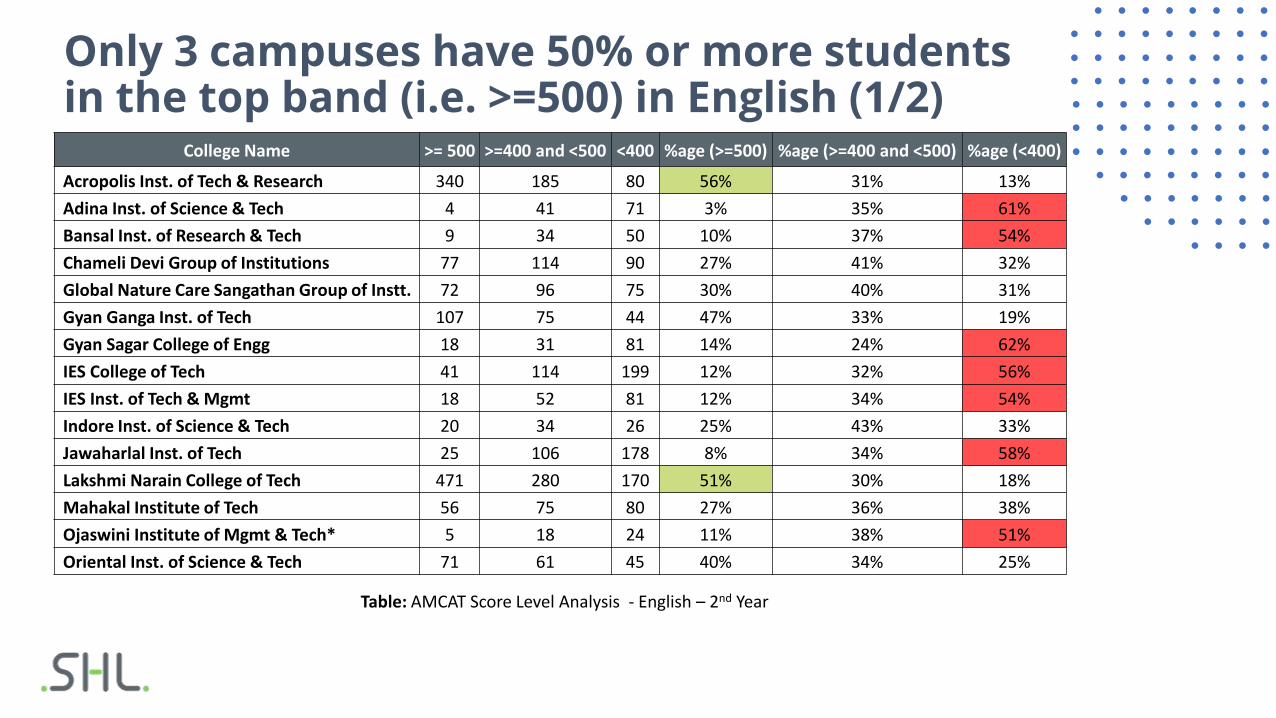
Only 3 campuses have 50% or more students in the top band (i.e. >=500) in English (1/2)
Table: AMCAT Score Level Analysis - English – 2nd Year
College Name >= 500 >=400 and <500 <400 %age (>=500) %age (>=400 and <500) %age (<400)
Acropolis Inst. of Tech & Research 340 185 80 56% 31% 13%
Adina Inst. of Science & Tech 4 41 71 3% 35% 61%
Bansal Inst. of Research & Tech 9 34 50 10% 37% 54%
Chameli Devi Group of Institutions 77 114 90 27% 41% 32%
Global Nature Care Sangathan Group of Instt. 72 96 75 30% 40% 31%
Gyan Ganga Inst. of Tech 107 75 44 47% 33% 19%
Gyan Sagar College of Engg 18 31 81 14% 24% 62%
IES College of Tech 41 114 199 12% 32% 56%
IES Inst. of Tech & Mgmt 18 52 81 12% 34% 54%
Indore Inst. of Science & Tech 20 34 26 25% 43% 33%
Jawaharlal Inst. of Tech 25 106 178 8% 34% 58%
Lakshmi Narain College of Tech 471 280 170 51% 30% 18%
Mahakal Institute of Tech 56 75 80 27% 36% 38%
Ojaswini Institute of Mgmt & Tech* 5 18 24 11% 38% 51%
Oriental Inst. of Science & Tech 71 61 45 40% 34% 25%

Only 3 campuses have 50% or more students in the top band (i.e. >=500) in English (2/2)
Table: AMCAT Score Level Analysis - English – 2nd Year
College Name >= 500 >=400 and <500 <400 %age (>=500) %age (>=400 and <500) %age (<400)
Prestige Inst. of Engg Mgmt & Research 40 50 43 30% 38% 32%
Pt. Dev Prabhakar Shastri CET* 2 21 21 5% 48% 48%
Rustamji Institute of Tech 116 123 75 37% 39% 24%
Sagar Inst. of Research & Tech 92 106 94 32% 36% 32%
Sagar Inst. of Research Tech & Science 22 35 35 24% 38% 38%
Sagar Inst. of Science & Tech* 7 16 15 18% 42% 39%
Shri Balaji Inst. of Tech & Mgmt 18 31 69 15% 26% 58%
Shri Dadaji Inst. of Tech & Science 12 32 42 14% 37% 49%
Shri Yogendra Sagar Inst. of Tech & Science* 5 8 19 16% 25% 59%
Shriram College of Engg & Mgmt* 0 3 1 0% 75% 25%
Technocrats Inst. of Tech 66 77 50 34% 40% 26%
Technocrats Inst. of Tech & Science* 3 10 21 9% 29% 62%
Technocrats Inst. of Tech Excellence 18 20 17 33% 36% 31%
Thakur Shiv Kumar Singh Memorial Engg College 13 45 44 13% 44% 43%
University Inst. of Tech 244 120 66 57% 28% 15%
Vindhya Inst. of Tech & Science 17 61 88 10% 37% 53%
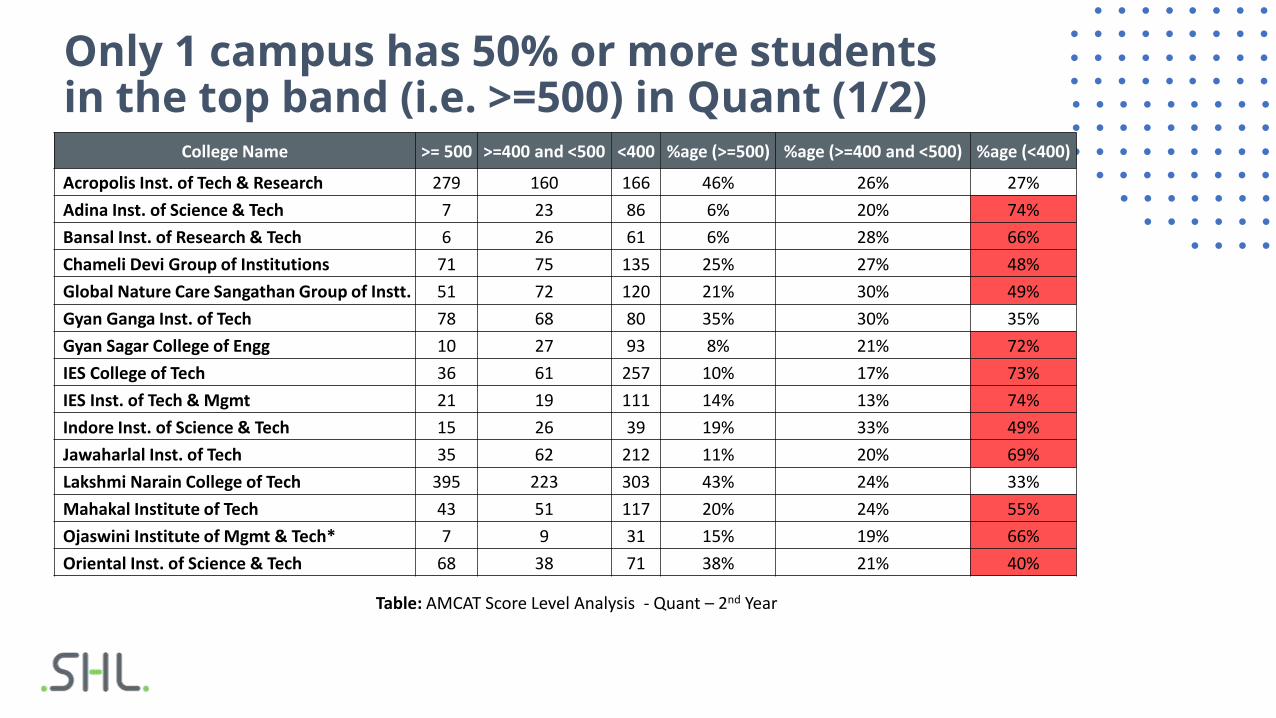
Only 1 campus has 50% or more students in the top band (i.e. >=500) in Quant (1/2)
Table: AMCAT Score Level Analysis - Quant – 2nd Year
College Name >= 500 >=400 and <500 <400 %age (>=500) %age (>=400 and <500) %age (<400)
Acropolis Inst. of Tech & Research 279 160 166 46% 26% 27%
Adina Inst. of Science & Tech 7 23 86 6% 20% 74%
Bansal Inst. of Research & Tech 6 26 61 6% 28% 66%
Chameli Devi Group of Institutions 71 75 135 25% 27% 48%
Global Nature Care Sangathan Group of Instt. 51 72 120 21% 30% 49%
Gyan Ganga Inst. of Tech 78 68 80 35% 30% 35%
Gyan Sagar College of Engg 10 27 93 8% 21% 72%
IES College of Tech 36 61 257 10% 17% 73%
IES Inst. of Tech & Mgmt 21 19 111 14% 13% 74%
Indore Inst. of Science & Tech 15 26 39 19% 33% 49%
Jawaharlal Inst. of Tech 35 62 212 11% 20% 69%
Lakshmi Narain College of Tech 395 223 303 43% 24% 33%
Mahakal Institute of Tech 43 51 117 20% 24% 55%
Ojaswini Institute of Mgmt & Tech* 7 9 31 15% 19% 66%
Oriental Inst. of Science & Tech 68 38 71 38% 21% 40%
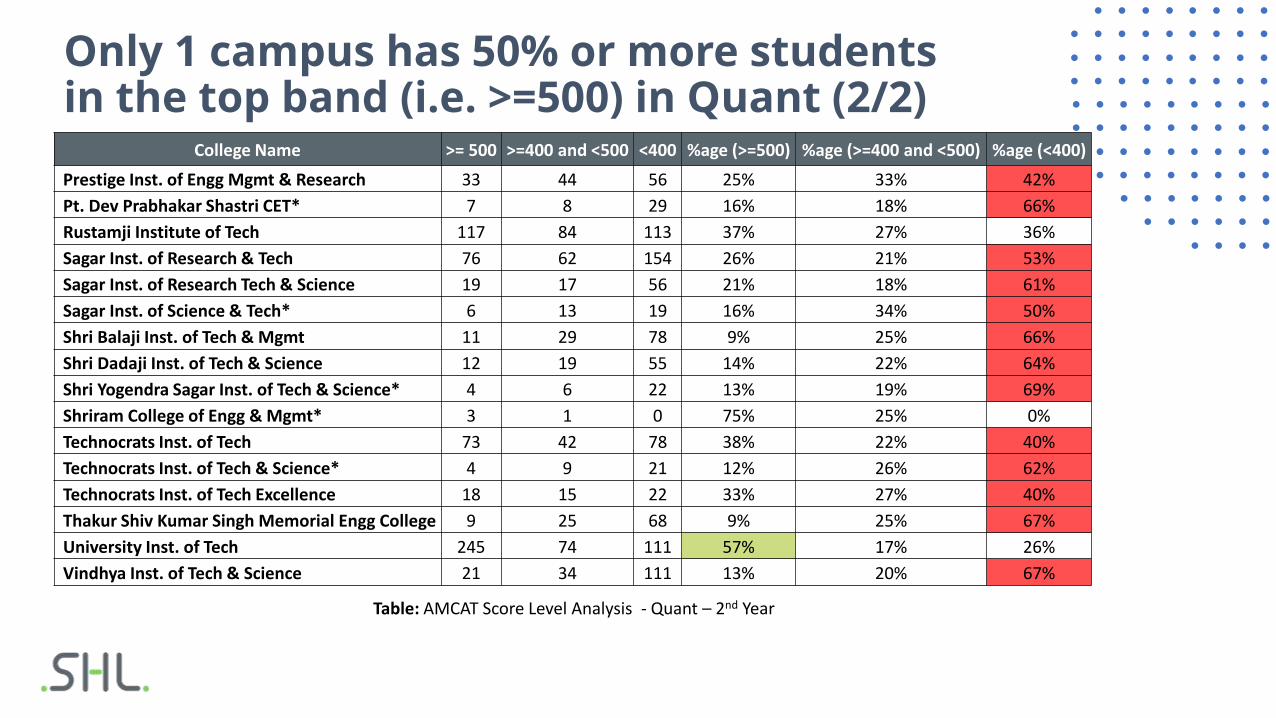
Only 1 campus has 50% or more students in the top band (i.e. >=500) in Quant (2/2)
Table: AMCAT Score Level Analysis - Quant – 2nd Year
College Name >= 500 >=400 and <500 <400 %age (>=500) %age (>=400 and <500) %age (<400)
Prestige Inst. of Engg Mgmt & Research 33 44 56 25% 33% 42%
Pt. Dev Prabhakar Shastri CET* 7 8 29 16% 18% 66%
Rustamji Institute of Tech 117 84 113 37% 27% 36%
Sagar Inst. of Research & Tech 76 62 154 26% 21% 53%
Sagar Inst. of Research Tech & Science 19 17 56 21% 18% 61%
Sagar Inst. of Science & Tech* 6 13 19 16% 34% 50%
Shri Balaji Inst. of Tech & Mgmt 11 29 78 9% 25% 66%
Shri Dadaji Inst. of Tech & Science 12 19 55 14% 22% 64%
Shri Yogendra Sagar Inst. of Tech & Science* 4 6 22 13% 19% 69%
Shriram College of Engg & Mgmt* 3 1 0 75% 25% 0%
Technocrats Inst. of Tech 73 42 78 38% 22% 40%
Technocrats Inst. of Tech & Science* 4 9 21 12% 26% 62%
Technocrats Inst. of Tech Excellence 18 15 22 33% 27% 40%
Thakur Shiv Kumar Singh Memorial Engg College 9 25 68 9% 25% 67%
University Inst. of Tech 245 74 111 57% 17% 26%
Vindhya Inst. of Tech & Science 21 34 111 13% 20% 67%

Only 10 campuses have 50% or more students in the top band (i.e. >=500) in Logical (1/2)
Table: AMCAT Score Level Analysis - Logical – 2nd Year
College Name >= 500 >=400 and <500 <400 %age (>=500) %age (>=400 and <500) %age (<400)
Acropolis Inst. of Tech & Research 406 130 69 67% 21% 11%
Adina Inst. of Science & Tech 17 35 64 15% 30% 55%
Bansal Inst. of Research & Tech 19 33 41 20% 35% 44%
Chameli Devi Group of Institutions 127 80 74 45% 28% 26%
Global Nature Care Sangathan Group of Instt. 112 61 70 46% 25% 29%
Gyan Ganga Inst. of Tech 135 43 48 60% 19% 21%
Gyan Sagar College of Engg 15 46 69 12% 35% 53%
IES College of Tech 64 84 206 18% 24% 58%
IES Inst. of Tech & Mgmt 24 42 85 16% 28% 56%
Indore Inst. of Science & Tech 34 18 28 43% 23% 35%
Jawaharlal Inst. of Tech 51 102 156 17% 33% 50%
Lakshmi Narain College of Tech 567 184 170 62% 20% 18%
Mahakal Institute of Tech 91 66 54 43% 31% 26%
Ojaswini Institute of Mgmt & Tech* 9 12 26 19% 26% 55%
Oriental Inst. of Science & Tech 92 35 50 52% 20% 28%

Only 10 campuses have 50% or more students in the top band (i.e. >=500) in Logical (2/2)
Table: AMCAT Score Level Analysis - Logical – 3rd Year
College Name >= 500 >=400 and <500 <400 %age (>=500) %age (>=400 and <500) %age (<400)
Prestige Inst. of Engg Mgmt & Research 64 39 30 48% 29% 23%
Pt. Dev Prabhakar Shastri CET* 10 15 19 23% 34% 43%
Rustamji Institute of Tech 174 81 59 55% 26% 19%
Sagar Inst. of Research & Tech 148 59 85 51% 20% 29%
Sagar Inst. of Research Tech & Science 31 29 32 34% 32% 35%
Sagar Inst. of Science & Tech* 14 15 9 37% 39% 24%
Shri Balaji Inst. of Tech & Mgmt 25 41 52 21% 35% 44%
Shri Dadaji Inst. of Tech & Science 20 22 44 23% 26% 51%
Shri Yogendra Sagar Inst. of Tech & Science* 9 10 13 28% 31% 41%
Shriram College of Engg & Mgmt* 4 0 0 100% 0% 0%
Technocrats Inst. of Tech 105 47 41 54% 24% 21%
Technocrats Inst. of Tech & Science* 12 11 11 35% 32% 32%
Technocrats Inst. of Tech Excellence 31 10 14 56% 18% 25%
Thakur Shiv Kumar Singh Memorial Engg College 16 42 44 16% 41% 43%
University Inst. of Tech 313 62 55 73% 14% 13%
Vindhya Inst. of Tech & Science 33 47 86 20% 28% 52%

Comparison with1.1 MP Campuses

Score Comparison – RGPV & 1.1 MP
Table: RGPV & 1.1 MP – Score Comparison
BatchEnglish Quantitative Ability Logical Ability
RGPV 1.1 MP RGPV 1.1 MP RGPV 1.1 MP
1st Year - 487 - 500 - 526
2nd Year 462 491 448 495 485 532
3rd Year 477 498 461 501 502 535
4th Year - 509 - 545 - 554

© 2020 SHL and its affiliates. All rights reserved.
AMCAT Mean Score – National Comparison(Category-wise)
Feedback Reports

Regular detailed feedback mechanism contributes to improved scores
Module Feedback
References & Time schedule
Personality Map
Industry and Job Fit

The campuses also get a detailed feedback
Score Analysis
Training Suggestions
Employability Prospects
Perspective on students (Star
performers, High potential)
Intra Campus comparison
Score Analysis
Training Suggestions
Employability Prospects
Perspective on students (Star
performers, High potential)
Intra Campus comparison

80% engineering candidates are not employable for any
job in the knowledge economy.
How do we make them ready?Can we look at increasing internships to give them real life exposures?
Getting Job Ready!

Over 60% engineering
candidates don’t take up any internship
Industry Exposure
61%32%
7%
Internships Taken
None One Internship Multiple Internship
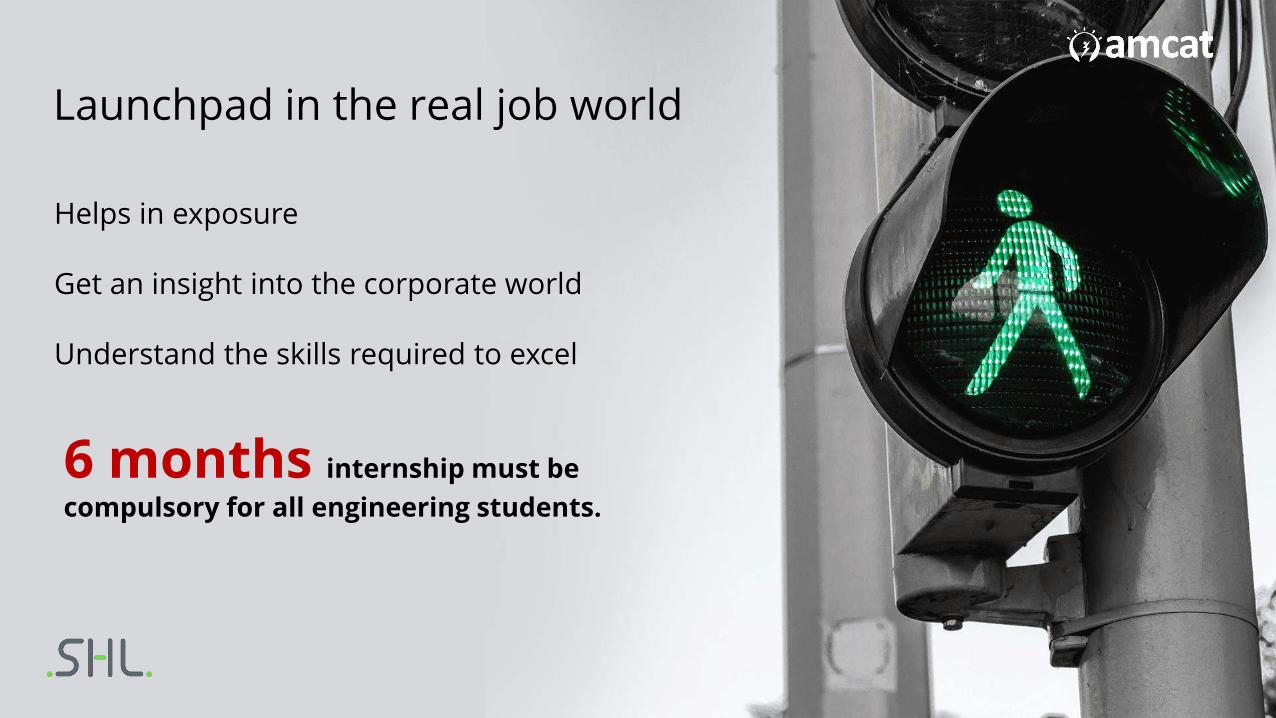
Helps in exposure
Get an insight into the corporate world
Understand the skills required to excel
Launchpad in the real job world
6 months internship must be
compulsory for all engineering students.

Are Internships the only solution?
Students also need to invest in themselves to improve their own employability quotient
How can they do that?
Self Learning
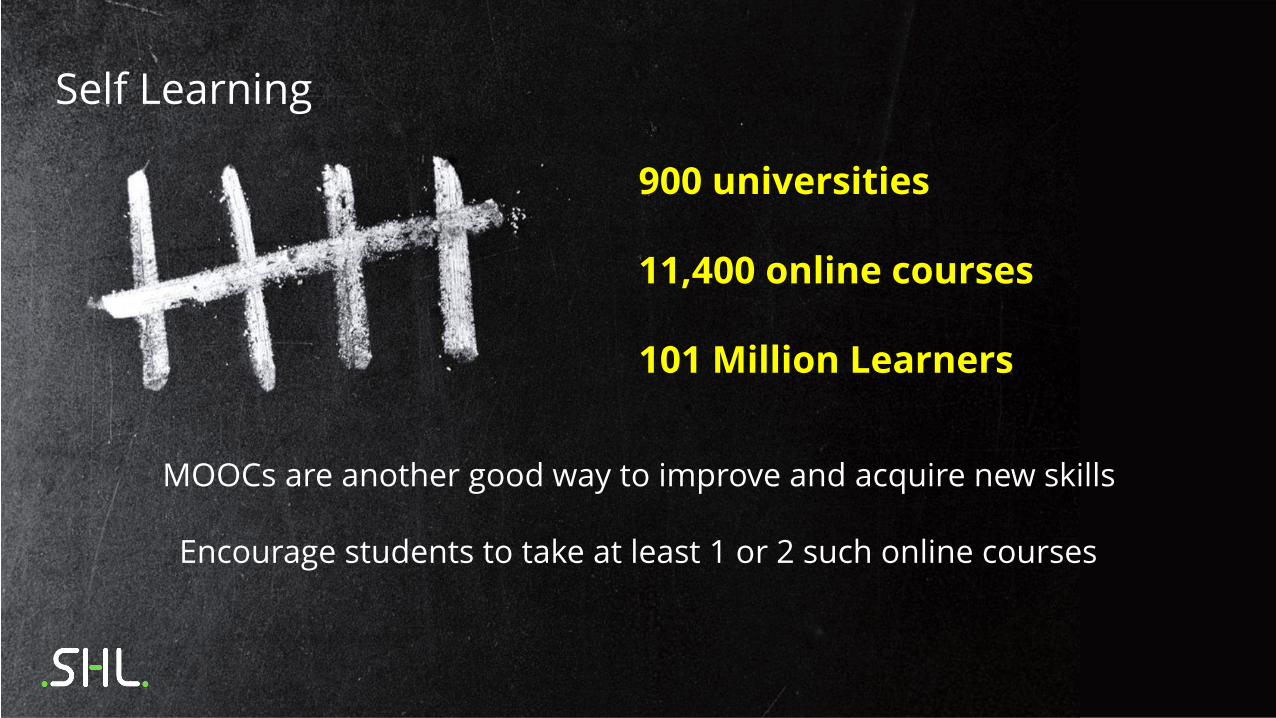
900 universities
11,400 online courses
101 Million Learners
Self Learning
MOOCs are another good way to improve and acquire new skills
Encourage students to take at least 1 or 2 such online courses

© 2020 SHL and its affiliates. All rights reserved.
Thank you
For more details, please write to us at [email protected]