analytical tools to support water security decision-making · security decision-making supporting...
TRANSCRIPT

Analytical Tools to Support Water Security Decision-Making Supporting Paper for SWP Toolkit Series
March 2018 This publication was produced for review by the United States Agency for International Development. It was prepared by Winrock International, in partnership with Tetra Tech, International Union for Conservation of Nature, Stockholm Environment Institute, and World Resources Institute
CONTENTS
Executive Summary ......................................................................................................................... 3
I. Categories of Tools Used in Water Planning ........................................................................... 4
Data Evaluation Tools. ................................................................................................................ 4
Geospatial Assessment Tools. ..................................................................................................... 5
Basin Analysis Tools. ................................................................................................................... 5
Visualization Tools. ..................................................................................................................... 5
Community of Practice Tools. ..................................................................................................... 5
II. Time Scale of Water Planning .................................................................................................. 6
III. Application of Tools within the Water Security Improvement Process .................................. 7
Inception Phase ........................................................................................................................... 7
Step 1: Define the WSI Space ...................................................................................................... 7
Step 2: Assess The Situation ....................................................................................................... 7
Step 3: Planning and Funding ................................................................................................... 10
Step 4: Implementation ............................................................................................................ 11
Step 5: Monitoring, Evaluating, and Adapting .......................................................................... 11
ANNEX A: Illustrative Examples of Potential Tools ....................................................................... 14
Automated Geospatial Watershed Assessment (AGWA) ......................................................... 15
Aqueduct – Water Risk Atlas and Global Flood Analyzer ......................................................... 16
ArcSWAT ................................................................................................................................... 17
GeoClim ..................................................................................................................................... 18
Indicators of Hydrologic Alteration (IHA) ................................................................................. 19
Tableau ...................................................................................................................................... 20
weADAPT ................................................................................................................................... 21
Water Evaluation and Planning (WEAP) ................................................................................... 22
Watershed Ecosystem Services Tool (WESTool) ....................................................................... 23
Water Action Hub ..................................................................................................................... 24

EXECUTIVE SUMMARY
This supporting paper presents local decision-makers and practitioners with various tools that
can be used within the context of a Water Security Improvement (WSI) process. The goal of the
paper is to review the various types of tools that are used for water resources assessment and
planning efforts and to summarize the appropriate usage of these tools within a decision-making
framework. It begins by defining what we mean by “tools and then presenting general categories
that are used in water planning efforts. A brief discussion of the time scale of water planning is
presented to highlight how the urgency of decision-making influences the degree to which
stakeholders may or may not be involved. The paper then walks through the steps of the WSI
process and explains how various tools may be applied within this context. It concludes with an
annex that provides illustrative examples of different tools used in water planning.
Why and how are tools useful in the context of water security?
Analytical tools have a long history of informing decision-making processes around water. In
general, analytical tools transform available data into outputs that assist in understanding how
various factors influence water security. For example, at the most basic level, spreadsheet tools
are commonly used to perform statistical analyses of historical records (e.g. precipitation, flood
frequency, population growth, etc.) and to visualize these in a way that highlight trends or
patterns within these data. Mapping software also provides very powerful means for
communicating to decision-makers the extent of and/or changes over time in various water-
related factors (e.g. drought persistence, land use changes, precipitation trends, etc.). To better
understand the dynamic nature of water and humanity’s relationship to it, many simulation tools
are used to represent natural processes (e.g. rainfall runoff, crop growth, sediment transport,
flood propagation, etc.) and human interactions with water (e.g. water deliveries to urban,
agricultural and industrial users; pollution generation and transport; water storage in reservoirs;
levee construction for flood protection, etc.) in a way that allows us to explore the impact of
proposed policies and/or interventions on water security. Depending upon the nature of the water
security issues that are being addressed any number of analytical tools may be used to help in our
understanding of the issues and in the effectiveness of strategies meant to address them.
Limitations of tools
While tools can greatly enhance the understanding of a water security situation, the exploration
of possible water security actions and performance of these actions across potential scenarios,
they are not the ultimate solution and cannot replace stakeholder-led negotiations and decision-
making processes. For tools to be most useful and effective, they must 1) be fully embedded
within a stakeholder-engaged process of assessment, planning and implementation; 2) build on
and enhance tools that already exist in a particular geography; and 3) be complemented by
capacity building support to ensure local ownership and sustainability. In order to deliver sound
and reliable results, tools also need to rely on:
• Reasonably accurate raw field data (while avoiding the trap of too much data)
• Scientifically-proven processes to convert raw field data into findings, forecasts, displays,
etc.
• Ground-truthing to ensure that the findings are coherent with field observations
• Human specialists who know the expected magnitude of the results before the tool
produces these

I. CATEGORIES OF TOOLS USED IN WATER PLANNING
Within a WSI process, a range of tools are employed to assist water resources scientists, planners
and managers throughout the world to assess and better understand water security challenges and
evaluate strategies aimed at enhancing resilience. In a very general sense, a “tool” may be
defined as any set of procedures that transform inputs into useable outputs. Within the context
of this supporting paper, we consider a narrower definition that focuses on computer-based
databases and models. These tools may produce qualitative outputs (such as seasonal household
water management practices or contact information for potential collaborators), or they may
produce quantitative outputs (such as water quality measures in rivers and lakes or total water
supply and demand within a basin).
It is important to emphasize that while tools can greatly enhance the understanding of a water
security situation, the exploration of possible water security actions and performance of these
actions across potential scenarios, they are not the ultimate solution and cannot replace
stakeholder-led negotiations and decision-making processes. Therefore, for tools to be most
useful and effective, they must be fully embedded within a stakeholder-engaged process of
assessment, planning and implementation. In addition, capacity building and local ownership in
the development and application of tools is equally if not more important than the tool itself, and
critical for sustainability. Careful attention should first be placed on understanding, building on,
refining and enhancing tools that already exist, rather than introducing new ones.
For the purposes of this supporting paper, we prefer to distinguish tools from “methods,” which
are sometimes referred to as “toolkits,” but are generally configured as loosely connected
procedures designed to carry out a particular function. For example, in conducting a vulnerability
assessment one may follow prescribed approaches for conducting institutional analyses, climate
change analyses and other topic-specific analyses. Together these may be viewed as a toolkit
(and often use this terminology in their presentation), but they extend beyond the definition of a
“tool” considered for this review. Herein, a “method” refers to a general procedure or technique
for implementing a series of steps to achieve a goal whereas a “tool” is a particular application
that one may use to perform topic-specific analyses.
In reviewing the tools that are used to analyze water resources, these can be organized into five
general categories: data evaluation tools, geospatial assessment tools, basin analysis tools,
visualization tools and community of practice tools. The first four of these categories, which are
quantitative in nature, require input data and return outputs based on the interaction of these
inputs. The last category is more qualitative and may in some cases act as a portal to disseminate
both the inputs and outputs of the other four categories of tools. Each category of tool is
summarized below.
DATA EVALUATION TOOLS. These tools are designed to explore quantitative datasets,
revealing trends or highlighting impacts of past interventions or basin alterations. They focus on
historical records and are generally used as a means of enhancing the understanding of the
natural and altered states of the basin such that baseline conditions can be established for further
analysis. For example, the Indicators of Hydrologic Alteration (IHA) tool may be used to assess
the degree to which streamflows have been affected following previous interventions within the
basin. This helps to highlight current challenges within a basin that seeks to improve flows to
meet environmental objectives. (For more information, see summaries for GeoClim and IHA in
Annex A.)

GEOSPATIAL ASSESSMENT TOOLS. These tools are often web-based platforms intended
to highlight water stress factors. They use remotely sensed data and other published datasets to
create interactive tools that map indicators of water-related risks. They use a combination of
geospatial and statistical models to translate global hydrological data into indicators. These
indicators are intended for comparative analysis across large geographies to identify regions or
assets deserving of closer attention. For example, the Aqueduct Water Risk Atlas uses maps to
help to assess and visualize the severity of water-related risks such that priority areas can be
identified. (For more information, see summaries for Aqueduct and WESTool in Annex A.)
BASIN ANALYSIS TOOLS. These tools focus on detailed representations of the factors
affecting the quantity and quality of available water resources within a river basin or water
management system. These tools are intended to represent physical processes and management
operations at a level of detail that allow analysts to consider the implication of various changes to
the basin. These include physically based hydrological tools that simulate rainfall runoff,
streamflow routing, groundwater fluxes and/or water quality as well as systems tools that
evaluate water management operations, including water allocation and the regulatory
considerations. These tools are commonly used to conduct scenario analysis. For example, a
model such as WEAP could be used to translate historical climate into streamflow and
agricultural water usage and apply these within the context of evaluating different strategies in
search of equitable water allocation to competing domestic, irrigation, industrial and
environmental water users. (For more information, see model summaries for AGWA, ArcSWAT
and WEAP in Annex A.)
VISUALIZATION TOOLS. These tools provide an interface for exploring large multi-
dimensional databases. Visualization tools are intended to communicate complex data in a
manner that is easily understood by non-technical audiences. They accomplish this by applying
design principles based on the understanding of human perception. For example, Tableau is a
business intelligence software that is widely used for analyzing data and presenting actionable
information. It is a powerful tool for summarizing large amounts of data generated by models
during scenarios analysis in such a way to help water managers make more informed decisions.
(For more information, see summary for Tableau in Annex A)
COMMUNITY OF PRACTICE TOOLS. These are typically online tools intended to connect
practitioners, researchers, and policymakers to relevant information and share experiences within
a particular topic area. They are generally designed to facilitate learning, exchange,
collaboration, and knowledge integration to build a community of research and practice on issues
and to provide guidance for planning and decision-making. Within the water research domain,
they may be used to access relevant information within certain topics (e.g. climate change
adaptation, water harvesting, etc.) or to connect to organizations and stakeholders that are
already engaged in similar activities within a specific geography. For example, the Water Action
Hub is an online knowledge portal that organizes information to help businesses and other
stakeholders understand their options for collective action on water issues, particularly
whom they can work with in a particular region of interest. (For more information, see
summaries of Water Action Hub and weADAPT in Annex A.)
Each of these categories of tools has its place within the WSI process. This is generally
summarized in Error! Reference source not found..
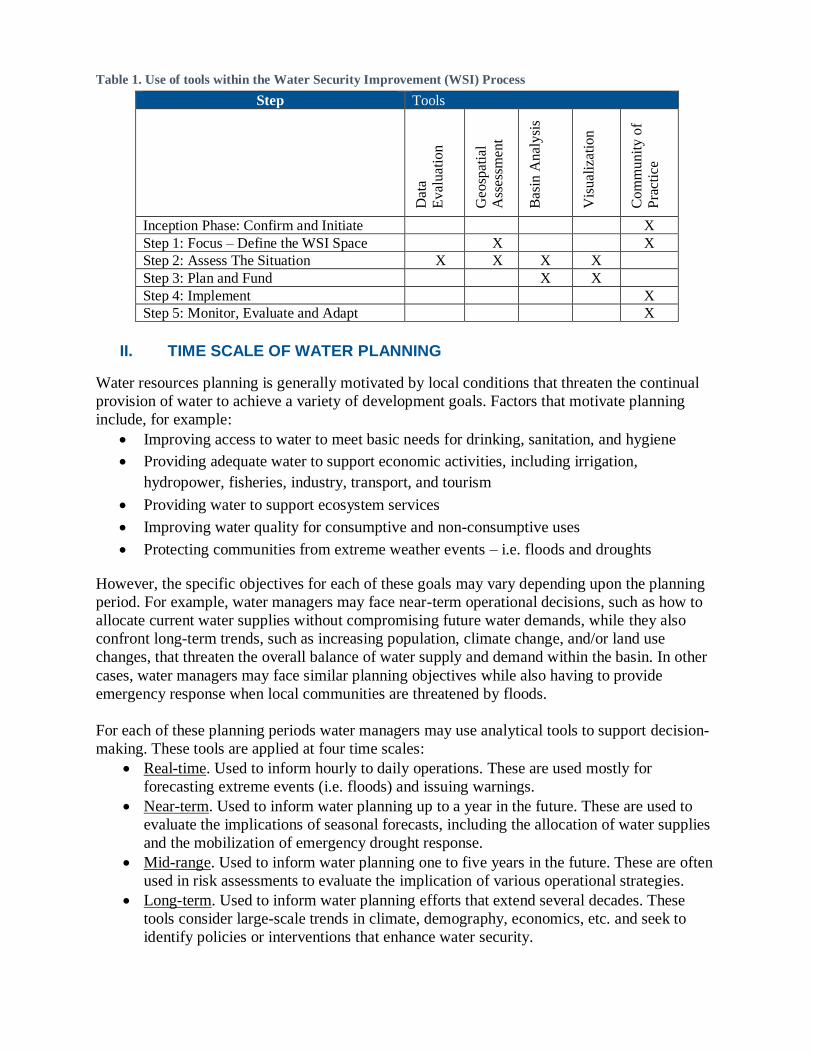
Table 1. Use of tools within the Water Security Improvement (WSI) Process
Step Tools
Dat
a
Evalu
atio
n
Geo
spat
ial
Ass
essm
ent
Bas
in A
nal
ysi
s
Vis
ual
izat
ion
Com
munit
y o
f
Pra
ctic
e
Inception Phase: Confirm and Initiate X
Step 1: Focus – Define the WSI Space X X
Step 2: Assess The Situation X X X X
Step 3: Plan and Fund X X
Step 4: Implement X
Step 5: Monitor, Evaluate and Adapt X
II. TIME SCALE OF WATER PLANNING
Water resources planning is generally motivated by local conditions that threaten the continual
provision of water to achieve a variety of development goals. Factors that motivate planning
include, for example:
• Improving access to water to meet basic needs for drinking, sanitation, and hygiene
• Providing adequate water to support economic activities, including irrigation,
hydropower, fisheries, industry, transport, and tourism
• Providing water to support ecosystem services
• Improving water quality for consumptive and non-consumptive uses
• Protecting communities from extreme weather events – i.e. floods and droughts
However, the specific objectives for each of these goals may vary depending upon the planning
period. For example, water managers may face near-term operational decisions, such as how to
allocate current water supplies without compromising future water demands, while they also
confront long-term trends, such as increasing population, climate change, and/or land use
changes, that threaten the overall balance of water supply and demand within the basin. In other
cases, water managers may face similar planning objectives while also having to provide
emergency response when local communities are threatened by floods.
For each of these planning periods water managers may use analytical tools to support decision-
making. These tools are applied at four time scales:
• Real-time. Used to inform hourly to daily operations. These are used mostly for
forecasting extreme events (i.e. floods) and issuing warnings.
• Near-term. Used to inform water planning up to a year in the future. These are used to
evaluate the implications of seasonal forecasts, including the allocation of water supplies
and the mobilization of emergency drought response.
• Mid-range. Used to inform water planning one to five years in the future. These are often
used in risk assessments to evaluate the implication of various operational strategies.
• Long-term. Used to inform water planning efforts that extend several decades. These
tools consider large-scale trends in climate, demography, economics, etc. and seek to
identify policies or interventions that enhance water security.
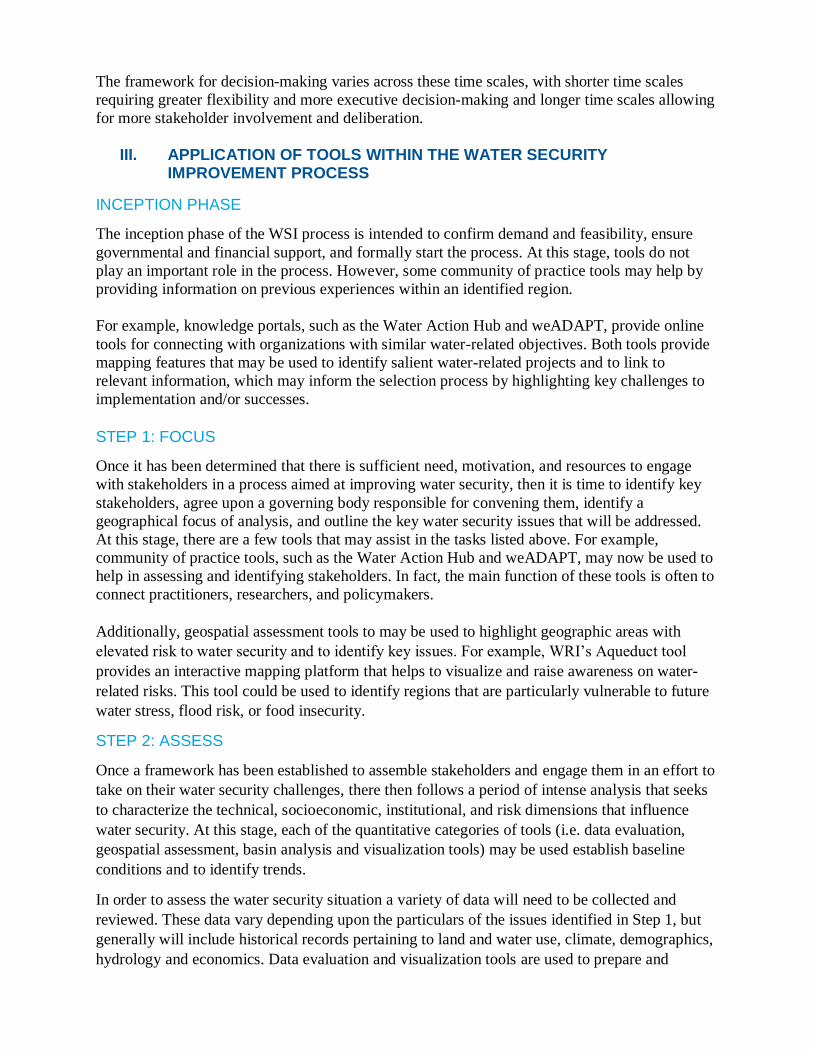
The framework for decision-making varies across these time scales, with shorter time scales
requiring greater flexibility and more executive decision-making and longer time scales allowing
for more stakeholder involvement and deliberation.
III. APPLICATION OF TOOLS WITHIN THE WATER SECURITY IMPROVEMENT PROCESS
INCEPTION PHASE
The inception phase of the WSI process is intended to confirm demand and feasibility, ensure
governmental and financial support, and formally start the process. At this stage, tools do not
play an important role in the process. However, some community of practice tools may help by
providing information on previous experiences within an identified region.
For example, knowledge portals, such as the Water Action Hub and weADAPT, provide online
tools for connecting with organizations with similar water-related objectives. Both tools provide
mapping features that may be used to identify salient water-related projects and to link to
relevant information, which may inform the selection process by highlighting key challenges to
implementation and/or successes.
STEP 1: FOCUS
Once it has been determined that there is sufficient need, motivation, and resources to engage
with stakeholders in a process aimed at improving water security, then it is time to identify key
stakeholders, agree upon a governing body responsible for convening them, identify a
geographical focus of analysis, and outline the key water security issues that will be addressed.
At this stage, there are a few tools that may assist in the tasks listed above. For example,
community of practice tools, such as the Water Action Hub and weADAPT, may now be used to
help in assessing and identifying stakeholders. In fact, the main function of these tools is often to
connect practitioners, researchers, and policymakers.
Additionally, geospatial assessment tools to may be used to highlight geographic areas with
elevated risk to water security and to identify key issues. For example, WRI’s Aqueduct tool
provides an interactive mapping platform that helps to visualize and raise awareness on water-
related risks. This tool could be used to identify regions that are particularly vulnerable to future
water stress, flood risk, or food insecurity.
STEP 2: ASSESS
Once a framework has been established to assemble stakeholders and engage them in an effort to
take on their water security challenges, there then follows a period of intense analysis that seeks
to characterize the technical, socioeconomic, institutional, and risk dimensions that influence
water security. At this stage, each of the quantitative categories of tools (i.e. data evaluation,
geospatial assessment, basin analysis and visualization tools) may be used establish baseline
conditions and to identify trends.
In order to assess the water security situation a variety of data will need to be collected and
reviewed. These data vary depending upon the particulars of the issues identified in Step 1, but
generally will include historical records pertaining to land and water use, climate, demographics,
hydrology and economics. Data evaluation and visualization tools are used to prepare and

organize these data in such a way that they can be used by geospatial assessment and basin
analysis tools.
There are some geospatial assessment tools, including WRI’s Aqueduct tool and IFPRI’s
IMPACT tool, that have already compiled available global, regional and national data that may
be used to assess different aspects of water security. For example, where droughts and water
scarcity issues have been raised as concerns in Step 1, the Aqueduct Water Risk Atlas can be
used to identify regions within a country that are at highest risk and will help to guide further
analysis (see Box 1). By the same token, where flooding is an identified concern Aqueduct’s
Global Flood Analyzer can be a valuable tool to help visualize areas most at risk of flooding and
prioritize flood zones based on the number of people at risk and the amount of GDP within
affected zones (see Box 2). Additionally, Aqueduct Food may be used to better understand food
production systems in situations
where agricultural production is an
identified concern (see Box 3).
In addition to the specific
applications mentioned above, there
are many general Geographic
Information Systems (GIS) tools that
may be used to help visualize
various aspects of the water security
situation (e.g. basin topography,
river networks, location of urban and
agricultural areas, distribution of
precipitation and temperature over
the basin, flooded areas under
different river flow conditions, etc.).
Such visualizations are often
powerful means of communicating
with water managers and
policymakers (see Box 2).
Geospatial assessment tools are
helpful in setting the water security
context. However, they are often limited in their ability to fully characterize the complexities of
natural and managed water systems on the ground. For this reason, basin analysis tools are often
used to represent the dynamics of different natural and managed features of a water basin or
system. There are several types of basin analysis tools. These are summarized in Table 2.
Basin analysis tools are used primarily to enhance our understanding of basin processes and to
predict outcomes under a range of various assumptions of future conditions. For example, where
water scarcity and drought are a concern, we may use hydrologic tools to model various aspects
of the hydrologic cycle (i.e. runoff, infiltration, evaporation, groundwater recharge, etc.) to
understand how the basin responded under historical climate, such that we can predict how water
supplies may change under future climate projections (See Box 1).
Box 1. Using Analytical Tools to Assess Water Scarcity The Aqueduct Water Risk Atlas can help to ascertain which areas within a country are currently vulnerable to water shortage (and hence water insecurity), and estimate how these patterns of vulnerability may look under different climate projections for 2020, 2030, and 2040. These insights will help to guide the collection of relevant data to conduct detailed analyses of the future water supply and demand situation. Subsequent data analysis may include the use of a model such as GeoClim to assess climate trends over a historical period and to prepare and visualize various climate projection data for the region. These climate data may then be used as input for a hydrologic model, such as HEC-HMS, to estimate rainfall runoff and associated streamflows within a river network. Outputs from the hydrologic model (e.g. streamflow, evaporation, percolation, etc.) may then be used as input to an operational model, such as WEAP, that use these data to estimate the water supply situation and to balance these supplies with projections of municipal, agricultural, industrial and environmental water demands. These operational models may generate large databases of outputs when multiple response strategies are considered under a range of climate, demographic, and land use scenarios. In these situations, it is often helpful to use a data visualization tool, such as Tableau, which facilitates the interpretation of model results.

Outputs from hydrologic models can be
linked to a variety of other basin
analysis tools to provide information
about the timing and distribution of
water flows. For example, operational
models require streamflow data at
various locations (i.e. into dams, at
diversions, etc.) in order to make
decisions about storing water in dams,
delivering water to users, or releasing
water for public safety or to meet
environmental objectives. Hydro-
economic models use this information in
much the same way, while making water
allocation decisions based on the
economic value of water. Water quality
models use streamflow data from
hydrologic models to simulate the
movement of pollutants and sediments
through a basin. Each of these tools may
be linked to other analytical tools in the assessment process, as illustrated in Boxes 1, 2, and 3.
Many hydrologic models include simple representations of groundwater to characterize stream-
aquifer interactions and/or to account for water stored within aquifers. In situations that require
detailed analysis of groundwater basins, we may use groundwater models to evaluate changes in
groundwater storage and/or quality. For example, many arid areas rely heavily on groundwater to
supply water for drinking and irrigation. In these cases, groundwater models such as
MODFLOW can be used to evaluate the vulnerability of the resource in the face of various
uncertainties (e.g. climate and population) and to assess how different management strategies
(e.g. active recharge, demand management, etc.) may be used to secure groundwater for the
future.
Other basin analysis tools do not rely directly on hydrologic models, but capture different aspects
of water security. For example, flow routing and flood propagation models also simulate
streamflow in watersheds. However, these models simulate changes in river height as water
moves through a river channel and so are used primarily to predict the extent of flooding events.
These models may be used in conjunction with other analytical tools to assist in decision-making
around flood protection (see Box 2).
Agricultural production models to better understand water-food linkages are another kind of tool
that is useful in assessing the situation, particularly in cases where crop yields are threatened by
issues of water scarcity. These tools may also be linked to other analytical tools to assess the
situation and evaluate alternatives (see Box 3).
Box 2. Using Analytical Tools to Address Flood Risk The Aqueduct Flood Analyser can help to assess current and future (2030) river flood risks by population, GDP, or urban damage. This information helps to quantify potential impacts and to set the context for a detailed analysis that explores the various mitigation measures aimed at reducing flood risk. This analysis may use hydrologic models, such as HEC-HMS, to estimate rainfall runoff and streamflow for a historical period and for various projections of future climate. These streamflow data will provide estimates for the frequency of peak flows for the different climate projections and can be linked with a hydraulic model, such as HEC-RAS, to estimate river levels/elevations for these peak events. The extent of areas flooded during these peak events can be assessed and visualized using mapping (or GIS) tools, such as ArcGIS, which helps to estimate associated damages and to identify priority areas. The hydraulic and GIS tools can be used further to test effectiveness of various flood protection measures to safeguard against expected future peak flow events.
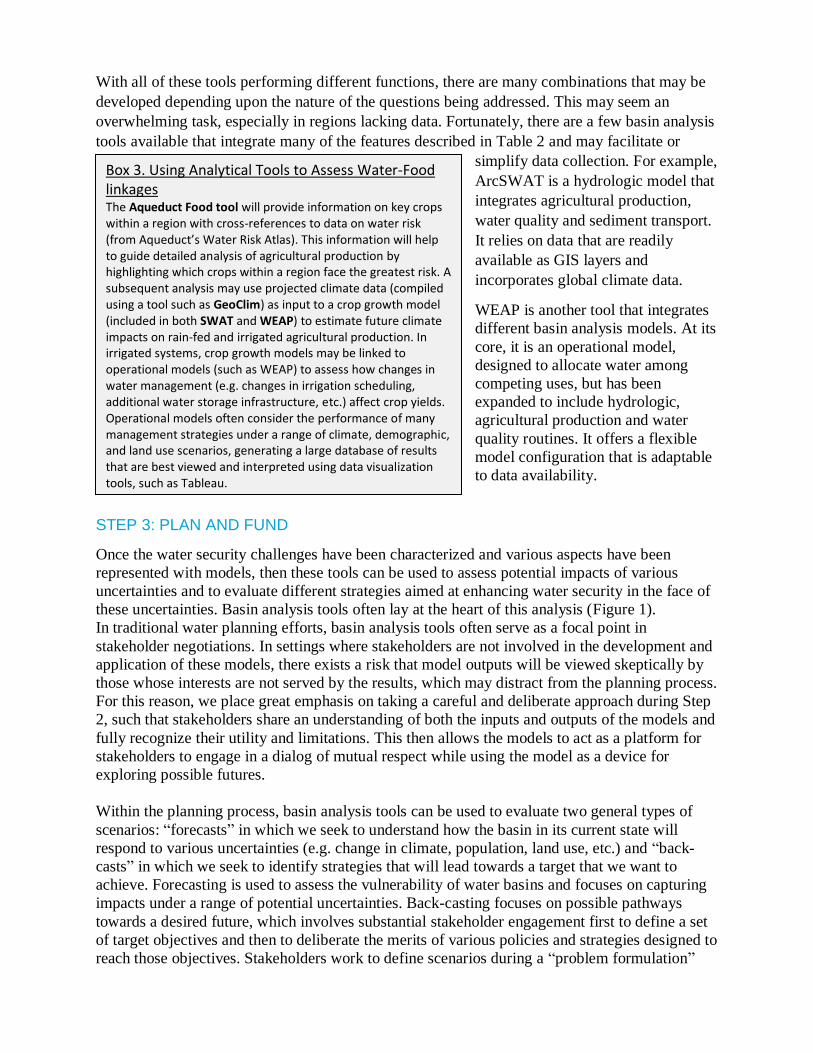
With all of these tools performing different functions, there are many combinations that may be
developed depending upon the nature of the questions being addressed. This may seem an
overwhelming task, especially in regions lacking data. Fortunately, there are a few basin analysis
tools available that integrate many of the features described in Table 2 and may facilitate or
simplify data collection. For example,
ArcSWAT is a hydrologic model that
integrates agricultural production,
water quality and sediment transport.
It relies on data that are readily
available as GIS layers and
incorporates global climate data.
WEAP is another tool that integrates
different basin analysis models. At its
core, it is an operational model,
designed to allocate water among
competing uses, but has been
expanded to include hydrologic,
agricultural production and water
quality routines. It offers a flexible
model configuration that is adaptable
to data availability.
STEP 3: PLAN AND FUND
Once the water security challenges have been characterized and various aspects have been
represented with models, then these tools can be used to assess potential impacts of various
uncertainties and to evaluate different strategies aimed at enhancing water security in the face of
these uncertainties. Basin analysis tools often lay at the heart of this analysis (Figure 1).
In traditional water planning efforts, basin analysis tools often serve as a focal point in
stakeholder negotiations. In settings where stakeholders are not involved in the development and
application of these models, there exists a risk that model outputs will be viewed skeptically by
those whose interests are not served by the results, which may distract from the planning process.
For this reason, we place great emphasis on taking a careful and deliberate approach during Step
2, such that stakeholders share an understanding of both the inputs and outputs of the models and
fully recognize their utility and limitations. This then allows the models to act as a platform for
stakeholders to engage in a dialog of mutual respect while using the model as a device for
exploring possible futures.
Within the planning process, basin analysis tools can be used to evaluate two general types of
scenarios: “forecasts” in which we seek to understand how the basin in its current state will
respond to various uncertainties (e.g. change in climate, population, land use, etc.) and “back-
casts” in which we seek to identify strategies that will lead towards a target that we want to
achieve. Forecasting is used to assess the vulnerability of water basins and focuses on capturing
impacts under a range of potential uncertainties. Back-casting focuses on possible pathways
towards a desired future, which involves substantial stakeholder engagement first to define a set
of target objectives and then to deliberate the merits of various policies and strategies designed to
reach those objectives. Stakeholders work to define scenarios during a “problem formulation”
Box 3. Using Analytical Tools to Assess Water-Food linkages The Aqueduct Food tool will provide information on key crops within a region with cross-references to data on water risk (from Aqueduct’s Water Risk Atlas). This information will help to guide detailed analysis of agricultural production by highlighting which crops within a region face the greatest risk. A subsequent analysis may use projected climate data (compiled using a tool such as GeoClim) as input to a crop growth model (included in both SWAT and WEAP) to estimate future climate impacts on rain-fed and irrigated agricultural production. In irrigated systems, crop growth models may be linked to operational models (such as WEAP) to assess how changes in water management (e.g. changes in irrigation scheduling, additional water storage infrastructure, etc.) affect crop yields. Operational models often consider the performance of many management strategies under a range of climate, demographic, and land use scenarios, generating a large database of results that are best viewed and interpreted using data visualization tools, such as Tableau.
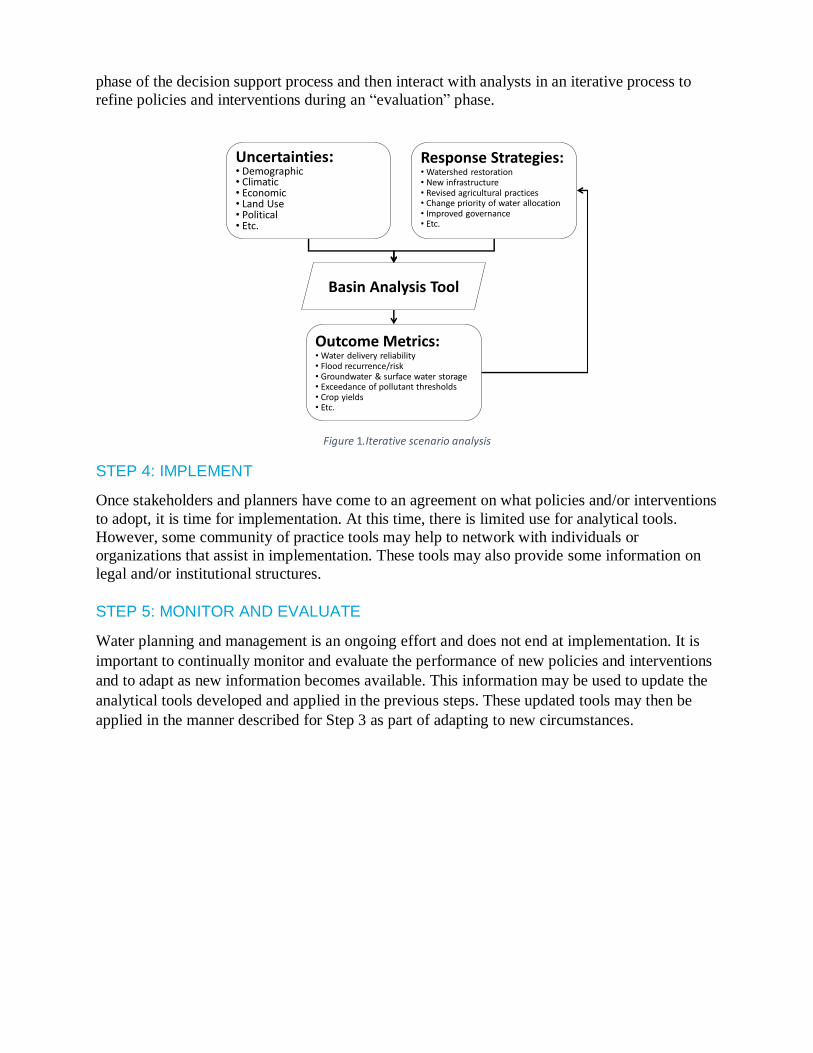
phase of the decision support process and then interact with analysts in an iterative process to
refine policies and interventions during an “evaluation” phase.
Figure 1.Iterative scenario analysis
STEP 4: IMPLEMENT
Once stakeholders and planners have come to an agreement on what policies and/or interventions
to adopt, it is time for implementation. At this time, there is limited use for analytical tools.
However, some community of practice tools may help to network with individuals or
organizations that assist in implementation. These tools may also provide some information on
legal and/or institutional structures.
STEP 5: MONITOR AND EVALUATE
Water planning and management is an ongoing effort and does not end at implementation. It is
important to continually monitor and evaluate the performance of new policies and interventions
and to adapt as new information becomes available. This information may be used to update the
analytical tools developed and applied in the previous steps. These updated tools may then be
applied in the manner described for Step 3 as part of adapting to new circumstances.
Outcome Metrics:• Water delivery reliability• Flood recurrence/risk• Groundwater & surface water storage• Exceedance of pollutant thresholds• Crop yields• Etc.
Uncertainties: • Demographic• Climatic• Economic• Land Use• Political• Etc.
Response Strategies:• Watershed restoration• New infrastructure• Revised agricultural practices• Change priority of water allocation• Improved governance• Etc.
Basin Analysis Tool
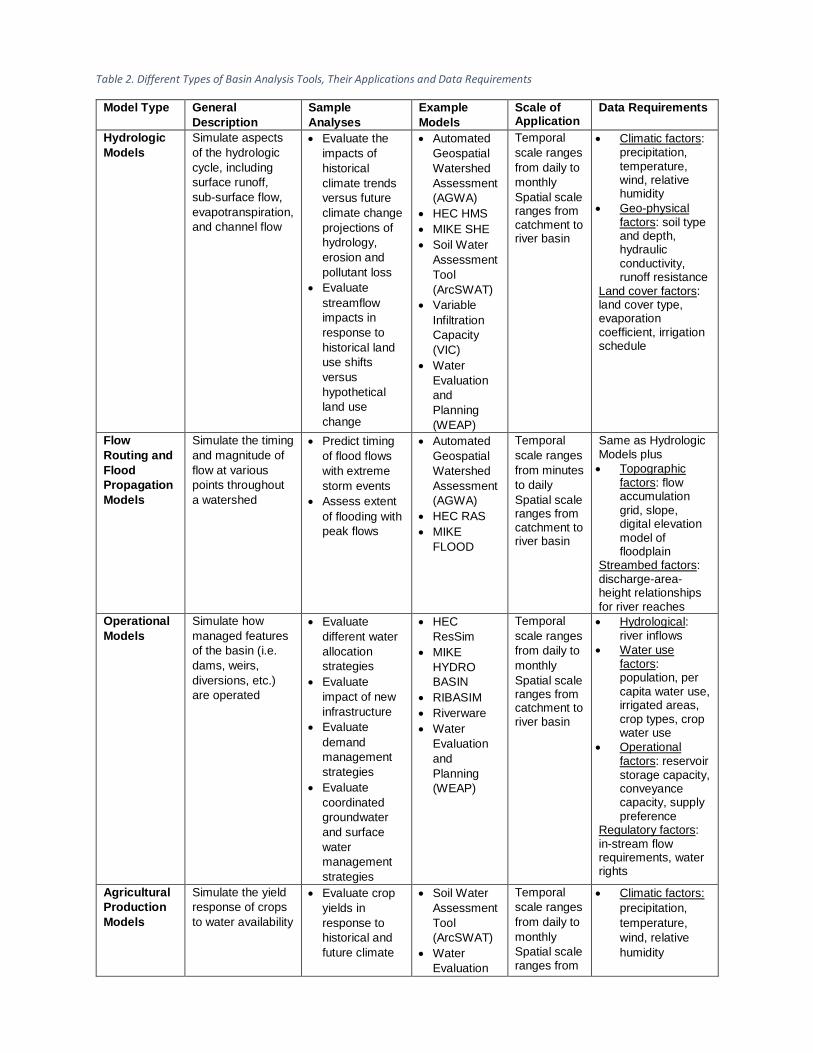
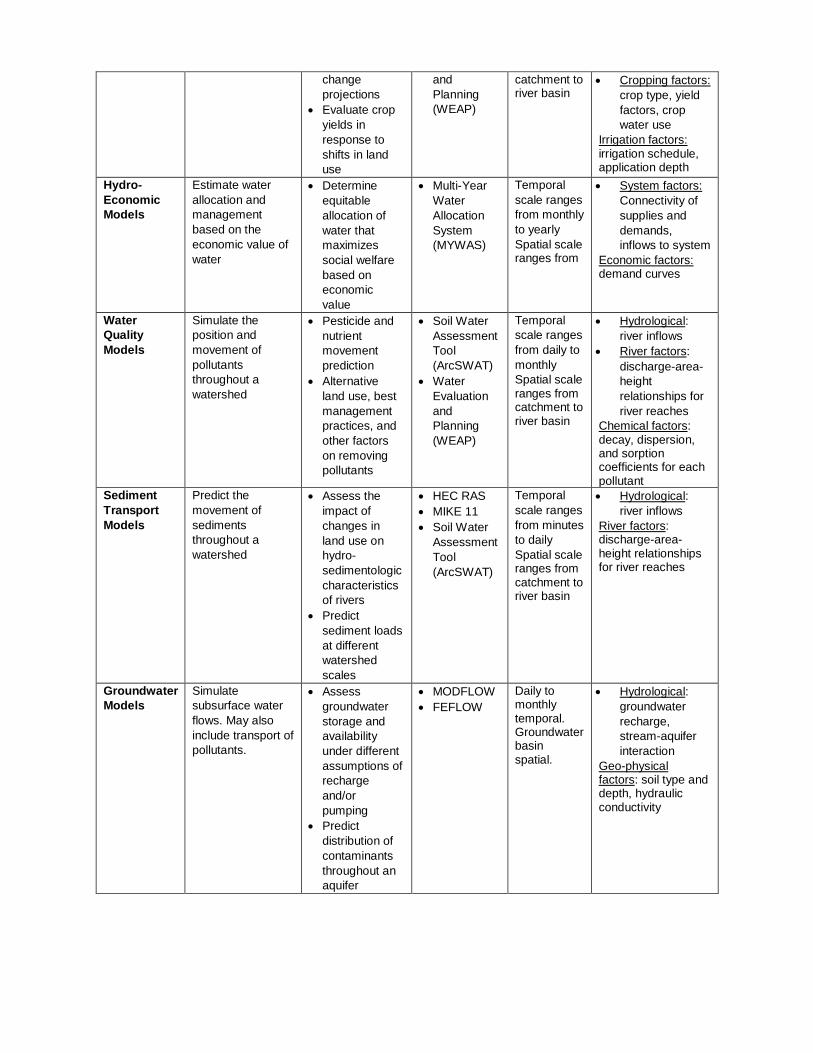
Table 2. Different Types of Basin Analysis Tools, Their Applications and Data Requirements
Model Type General
Description
Sample
Analyses
Example
Models
Scale of Application
Data Requirements
Hydrologic
Models
Simulate aspects
of the hydrologic
cycle, including
surface runoff,
sub-surface flow,
evapotranspiration,
and channel flow
• Evaluate the
impacts of
historical
climate trends
versus future
climate change
projections of
hydrology,
erosion and
pollutant loss
• Evaluate
streamflow
impacts in
response to
historical land
use shifts
versus
hypothetical
land use
change
• Automated
Geospatial
Watershed
Assessment
(AGWA)
• HEC HMS
• MIKE SHE
• Soil Water
Assessment
Tool
(ArcSWAT)
• Variable
Infiltration
Capacity
(VIC)
• Water
Evaluation
and
Planning
(WEAP)
Temporal
scale ranges
from daily to
monthly
Spatial scale ranges from catchment to river basin
• Climatic factors: precipitation, temperature, wind, relative humidity
• Geo-physical factors: soil type and depth, hydraulic conductivity, runoff resistance
Land cover factors: land cover type, evaporation coefficient, irrigation schedule
Flow
Routing and
Flood
Propagation
Models
Simulate the timing
and magnitude of
flow at various
points throughout
a watershed
• Predict timing
of flood flows
with extreme
storm events
• Assess extent
of flooding with
peak flows
• Automated
Geospatial
Watershed
Assessment
(AGWA)
• HEC RAS
• MIKE
FLOOD
Temporal
scale ranges
from minutes
to daily
Spatial scale ranges from catchment to river basin
Same as Hydrologic Models plus
• Topographic factors: flow accumulation grid, slope, digital elevation model of floodplain
Streambed factors: discharge-area-height relationships for river reaches
Operational
Models
Simulate how
managed features
of the basin (i.e.
dams, weirs,
diversions, etc.)
are operated
• Evaluate
different water
allocation
strategies
• Evaluate
impact of new
infrastructure
• Evaluate
demand
management
strategies
• Evaluate
coordinated
groundwater
and surface
water
management
strategies
• HEC
ResSim
• MIKE
HYDRO
BASIN
• RIBASIM
• Riverware
• Water
Evaluation
and
Planning
(WEAP)
Temporal
scale ranges
from daily to
monthly
Spatial scale ranges from catchment to river basin
• Hydrological: river inflows
• Water use factors: population, per capita water use, irrigated areas, crop types, crop water use
• Operational factors: reservoir storage capacity, conveyance capacity, supply preference
Regulatory factors: in-stream flow requirements, water rights
Agricultural
Production
Models
Simulate the yield
response of crops
to water availability
• Evaluate crop
yields in
response to
historical and
future climate
• Soil Water
Assessment
Tool
(ArcSWAT)
• Water
Evaluation
Temporal
scale ranges
from daily to
monthly
Spatial scale ranges from
• Climatic factors:
precipitation,
temperature,
wind, relative
humidity
change
projections
• Evaluate crop
yields in
response to
shifts in land
use
and
Planning
(WEAP)
catchment to river basin
• Cropping factors:
crop type, yield
factors, crop
water use
Irrigation factors: irrigation schedule, application depth
Hydro-
Economic
Models
Estimate water
allocation and
management
based on the
economic value of
water
• Determine
equitable
allocation of
water that
maximizes
social welfare
based on
economic
value
• Multi-Year
Water
Allocation
System
(MYWAS)
Temporal
scale ranges
from monthly
to yearly
Spatial scale ranges from
• System factors:
Connectivity of
supplies and
demands,
inflows to system
Economic factors: demand curves
Water
Quality
Models
Simulate the
position and
movement of
pollutants
throughout a
watershed
• Pesticide and
nutrient
movement
prediction
• Alternative
land use, best
management
practices, and
other factors
on removing
pollutants
• Soil Water
Assessment
Tool
(ArcSWAT)
• Water
Evaluation
and
Planning
(WEAP)
Temporal
scale ranges
from daily to
monthly
Spatial scale ranges from catchment to river basin
• Hydrological:
river inflows
• River factors:
discharge-area-
height
relationships for
river reaches
Chemical factors: decay, dispersion, and sorption coefficients for each pollutant
Sediment
Transport
Models
Predict the
movement of
sediments
throughout a
watershed
• Assess the
impact of
changes in
land use on
hydro-
sedimentologic
characteristics
of rivers
• Predict
sediment loads
at different
watershed
scales
• HEC RAS
• MIKE 11
• Soil Water
Assessment
Tool
(ArcSWAT)
Temporal
scale ranges
from minutes
to daily
Spatial scale ranges from catchment to river basin
• Hydrological:
river inflows
River factors: discharge-area-height relationships for river reaches
Groundwater
Models
Simulate
subsurface water
flows. May also
include transport of
pollutants.
• Assess
groundwater
storage and
availability
under different
assumptions of
recharge
and/or
pumping
• Predict
distribution of
contaminants
throughout an
aquifer
• MODFLOW
• FEFLOW
Daily to monthly temporal. Groundwater basin spatial.
• Hydrological:
groundwater
recharge,
stream-aquifer
interaction
Geo-physical factors: soil type and depth, hydraulic conductivity

ANNEX A: ILLUSTRATIVE EXAMPLES OF POTENTIAL TOOLS
There are many computer-based tools available for evaluating and analyzing water security. The
following examples highlight some tools commonly used by the SWP Consortium. These cover a
range of functionalities that touch upon most of the types of analytical tools described in this
document.

AUTOMATED GEOSPATIAL WATERSHED ASSESSMENT (AGWA)
http://www.tucson.ars.ag.gov/agwa/
Overview
The Automated Geospatial Watershed Assessment (AGWA) tool is a GIS-based hydrologic modeling tool that uses commonly available GIS data layers to fully parameterize, execute, and spatially visualize results for the RHEM, KINEROS2, KINEROS-OPUS, SWAT2000, and SWAT2005 watershed runoff and erosion models.
Accommodating novice to expert GIS users, it is designed to be used by watershed, wat resource, land use, and resource managers and scientists investigating the hydrologic impacts of land-cover/land-use change in small watershed to basin-scale studies.
Scale of Application
AGWA can be used to model small catchments or large watersheds, depending upon the models used. The RHEM, KINEROS, and KINEROS-OPUS models are event-based and generally used to evaluate hydrologic response of small watersheds (on the order of a hundred square kilometers) to storms that are hours to days long. The SWAT model can be applied to large basins (on the order of thousands of square kilometers) to long-term hydrological processes using daily average input values.
Data Requirements
Data requirement vary depending upon the model being used with AGWA. The basic data inputs include:
▪ Delineation inputs: digital elevation model, flow direction grid, flow accumulation grid
▪ Land cover inputs: land cover grid ▪ Soil inputs: soils shapefile ▪ Climate: precipitation, temperature
User Community, Support, and Licensing
AGWA is being used in over 70 countries around the world and has been downloaded over 10,000 times. It is used for watershed analysis
AGWA requires a “Basic” license for ArcGIS for Desktop and the Spatial Analyst license and extension for ArcMap. An “Advanced” license is required to Thiessen weighting of SWAT rain gages.
Application within the Participatory Process
AGWA can be used to evaluate the hydrological implications of various land use changes. Thus, within the participatory process it may be used in:
▪ Assessing the situation ▪ Scenario analysis
AGWA Highlights
▪ Reduced model setup time: Using only basic, attainable data, AGWA reduces model setup time from watershed delineation through model execution and results analysis. AGWA provides a simple, direct, and repeatable methodology for hydrologic model setup.
▪ Easy workflow: Through a robust and intuitive GUI, the user delineates a watershed, discretizes it into model elements, parameterizes the discretization with soils and land cover data, writes precipitation files to drive the model, writes the model input files, execute the model, and imports the results to visualize in the GIS.
▪ Scenario analysis: AGWA is well-suited for scenario development and alternative futures simulation work at multiple scales, spatially and temporally, due to its support of multiple models.
Example Analyses
AGWA is used for watershed analysis and modeling in a variety of project types, including but not limited to:
▪ Wildfire impacts, including on Burned Area Emergency Rehabilitation (BAER) teams with the Department of Interior (DOI)
▪ Green infrastructure ▪ Land impacts of coal bed methane extraction ▪ Supporting management of impacts from military
training activities ▪ Model setup for real-time flash flood forecasting
using NEXRAD in National Weather Service (NWS) Weather Forecast Offices (WFO)
▪ Future development scenarios ▪ Evaluation of flow in intermittent and ephemeral
streams on military bases in the southwestern US ▪ Connectivity of ephemeral streams for Clean
Water Act applications ▪ Mexico, USGS, USDA-ARS, and the International
Boundary and Water Commission in a US-Mexico cross-border effort to determine impacts of detention basins in Nogales, Sonora, Mexico
▪ Aid in development of watershed protection plans ▪ Evaluation of relative non-point source pollution

AQUEDUCT – WATER RISK ATLAS AND GLOBAL FLOOD ANALYZER
The World Resources Institute (WRI) is working on a complete redesign of the Aqueduct web platform that will bring together and integrate all Aqueduct products, including the Water Risk Atlas, the Global Flood Analyzer and Aqueduct Food. This website re-development work began in September 2016 and will continue throughout most of 2017. The Water Risk Atlas is a tool designed primarily for multinational companies and global investors. It helps these global actors assesses, visualize (on maps), and prioritize water-related risks to their manufacturing plants, assets, and supply chains. Key water risk indicators include:
▪ Baseline and future water stress (the ratio of water demand to water supply in any given geographic location)
▪ Inter-annual and seasonal variability of water supply
▪ Drought incidence and severity ▪ Groundwater stress ▪ Flood risk, and many others
Multinational companies and investors using the tool enter the location of their manufacturing plants (or assets, or suppliers) and obtain risk scores associated with each manufacturing plant. Those plants with the highest risk scores are then prioritized for validation and further risk assessment on the ground, and if needed, risk mitigation measures. The Water Risk Atlas indicators and maps can also inform governments, researchers, and NGOs. WRI is in the process of developing a tool called Resource Watch, which will be geared more towards these non-private sector audiences. Resource Watch will house many of the Aqueduct indicators, and add many other, non-WRI water-related datasets. Resource Watch will also contain data on global deforestation, climate change, and other resource-related issues.
The Global Flood Analyzer is a tool designed primarily for policy-makers, researchers, and NGOs. It provides an overview of current and future river flood and coastal storm surge risks at national, state/provincial, and major river basin levels. The risks can be quantified in terms of number of people at risk, amount of GDP at risk, and/or annual expected urban damage. The Global Flood Analyzer can help decision-makers visualize risk, and assess the relative costs and benefits of implementing flood protection measures. Users select a country, state/province, or major river basin that they want to analyze. The tool then shows a map of inundation probability for that entire country, state/province, or major river basin. Other outputs include annual expected impacts from floods of various sizes (e.g. a one-in-ten-year flood, a one-in-one hundred-year flood, or a one-in-one thousand-year flood). The Global Flood Analyzer is a partnership among five organizations, including WRI, Deltares, VU University Amsterdam, Utrecht University, and the PBL Netherlands Environmental Assessment Agency.
Aqueduct Food is a tool that is being designed for numerous audiences, including companies, investors, policy-makers, researchers, and NGOs. Aqueduct Food – which will debut in summer 2017 – will provide estimates of global agricultural production, agricultural trade, and food consumption for about 20 key crops, and cross-references these data with data on water risk. Users can select a crop and see where that crop is grown, and whether it is rain-fed and/or irrigated in a given geographic location. The user can then select a water risk indicator and overlay it on top of the crop map. This allows the user to see where a given crop faces the highest water risk. The user can visualize these risks at the global level, or select a country that s/he is interested in. The tool will not only produce risk maps, but also provide compelling charts and tables to show various aspects of water and food risk. Aqueduct Food is a partnership between WRI and the International Food Policy Research Institute (IFPRI).
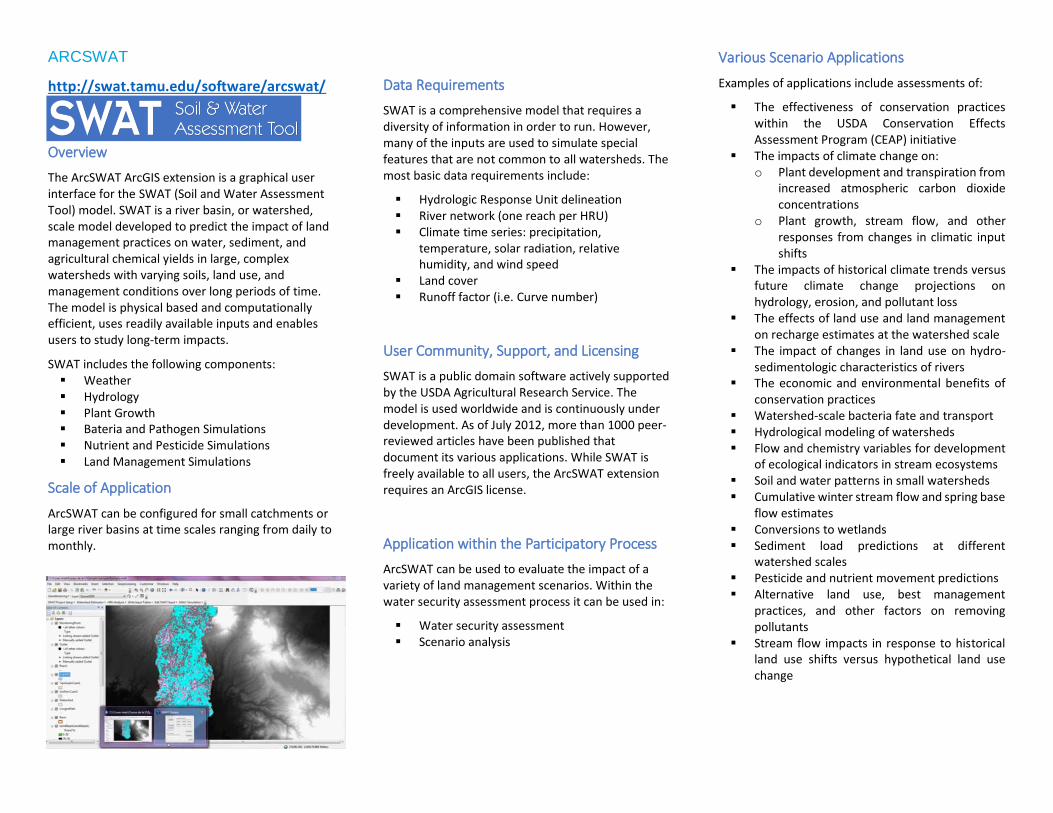
ARCSWAT
http://swat.tamu.edu/software/arcswat/
Overview
The ArcSWAT ArcGIS extension is a graphical user interface for the SWAT (Soil and Water Assessment Tool) model. SWAT is a river basin, or watershed, scale model developed to predict the impact of land management practices on water, sediment, and agricultural chemical yields in large, complex watersheds with varying soils, land use, and management conditions over long periods of time. The model is physical based and computationally efficient, uses readily available inputs and enables users to study long-term impacts.
SWAT includes the following components: ▪ Weather ▪ Hydrology ▪ Plant Growth ▪ Bateria and Pathogen Simulations ▪ Nutrient and Pesticide Simulations ▪ Land Management Simulations
Scale of Application
ArcSWAT can be configured for small catchments or large river basins at time scales ranging from daily to monthly.
Data Requirements
SWAT is a comprehensive model that requires a diversity of information in order to run. However, many of the inputs are used to simulate special features that are not common to all watersheds. The most basic data requirements include:
▪ Hydrologic Response Unit delineation ▪ River network (one reach per HRU) ▪ Climate time series: precipitation,
temperature, solar radiation, relative humidity, and wind speed
▪ Land cover ▪ Runoff factor (i.e. Curve number)
User Community, Support, and Licensing
SWAT is a public domain software actively supported by the USDA Agricultural Research Service. The model is used worldwide and is continuously under development. As of July 2012, more than 1000 peer-reviewed articles have been published that document its various applications. While SWAT is freely available to all users, the ArcSWAT extension requires an ArcGIS license.
Application within the Participatory Process
ArcSWAT can be used to evaluate the impact of a variety of land management scenarios. Within the water security assessment process it can be used in:
▪ Water security assessment ▪ Scenario analysis
Various Scenario Applications
Examples of applications include assessments of:
▪ The effectiveness of conservation practices within the USDA Conservation Effects Assessment Program (CEAP) initiative
▪ The impacts of climate change on: o Plant development and transpiration from
increased atmospheric carbon dioxide concentrations
o Plant growth, stream flow, and other responses from changes in climatic input shifts
▪ The impacts of historical climate trends versus future climate change projections on hydrology, erosion, and pollutant loss
▪ The effects of land use and land management on recharge estimates at the watershed scale
▪ The impact of changes in land use on hydro-sedimentologic characteristics of rivers
▪ The economic and environmental benefits of conservation practices
▪ Watershed-scale bacteria fate and transport ▪ Hydrological modeling of watersheds ▪ Flow and chemistry variables for development
of ecological indicators in stream ecosystems ▪ Soil and water patterns in small watersheds ▪ Cumulative winter stream flow and spring base
flow estimates ▪ Conversions to wetlands ▪ Sediment load predictions at different
watershed scales ▪ Pesticide and nutrient movement predictions ▪ Alternative land use, best management
practices, and other factors on removing pollutants
▪ Stream flow impacts in response to historical land use shifts versus hypothetical land use change

GEOCLIM
https://www.earlywarning.usgs.gov/few/software-tools/20
Overview
The GeoClim is a program designed for climatological analysis of historical rainfall and temperature data. The GeoClim provides non-scientists with an array of accessible analysis tools for climate-smart agricultural development. These user-friendly tools can be used to obtain and analyze climate data, blend station data with satellite data to create more accurate datasets, analyze seasonal trends and/or historical climate data, create visual representations of climate data, create scripts (batch files) to quickly and efficiently analyze similar “batches” of climate data, view and/or edit shapefiles and raster files, and extract statistics from raster datasets to create time series.
Scale of Application
GeoClim can be used to evaluate any climate time series from a single observation location to multiple stations distributed across large regions.
Data Requirements
GeoClim accepts a variety of data types, including shapefiles, raster files, and formatted text files. Each of these files types must be formatted as time series of climate variables – precipitation and temperature.
User Community, Support, and Licensing
GeoClim is freely available from FEWS NET and includes a user manual as well as several online tutorials.
Application within the Participatory Process
GeoClim can be used to evaluate and visualize trends in climate over recent historical periods and to assess the magnitude of projected changes in climate. It may be used also to prepare data inputs for basin analysis tools. Thus, within the participatory process it may be used in:
▪ Assessing the situation
GeoClim Highlights
▪ Blend station information with satellite data to create improved datasets ▪ Analyze seasonal trends and/or historical climate data ▪ Analyze drought for a selected region by calculating the standardized
precipitation index ▪ Create visual representations of climate data, create scripts (batch files) to
quickly and efficiently analyze large quantities of climate data ▪ View and/or edit shapefiles and raster files, and extract statistics from
raster datasets to create time series.

INDICATORS OF HYDROLOGIC
ALTERATION (IHA)
https://www.conservationgateway.org/ConservationPractices/Freshwater/EnvironmentalFlows/MethodsandTools/IndicatorsofHydrologicAlteration/Pages/indicators-hydrologic-alt.aspx
Overview
Indicators of Hydrologic
Alteration (IHA) is a software program that provides useful information for those trying to understand the hydrologic impacts of human activities or trying to develop environmental flow recommendations for water managers.
This program was developed by scientists at The Nature Conservancy to facilitate hydrologic analysis in an ecologically meaningful manner. The software program assesses 67 ecologically relevant statistics derived from daily hydrologic data. For instance, the IHA software can calculate the timing and maximum flow of each year's largest flood or lowest flows, then calculates the mean and variance of these values over some period of time. Comparative analysis can then help statistically describe how these patterns have changed for a particular river or lake, due to abrupt impacts such as dam construction or more gradual trends associated with land and water use changes.
Scale of Application
IHA can be used to evaluate any time series of streamflow. The spatial extent associated with the flows is not considered. Ideally, daily streamflows are provided for a period including pre- and post-alteration. The model can evaluate time series of
monthly flows; however, in this case, fewer indicators are calculated.
Data
Requirements
IHA requires only a single time series of streamflow. the time series of streamflows should be sufficiently long such that it can compare pre- and post-alteration streamflows over multiple years. In places with significant interannual climatic and hydrologic variability, the period should include both wet and dry periods.
User Community, Support, and Licensing
Nearly 2,000 water resource managers, hydrologists, ecologists, researchers and policymakers from around the world have used this program to assess how rivers, lakes and groundwater basins have been affected by human activities over time – or to evaluate future water management scenarios.
IHA is freely licensed for non-commercial purposes, but commercial use is prohibited unless written permission is obtained from The Nature Conservancy.
Application within the Participatory Process
IHA can be used to evaluate the impact of past interventions (aka “alterations”) within the basin or to provide indicators of performance for response strategies proposed in the water security planning process. Thus, within the participatory process it may be used in:
▪ Assessing the situation ▪ Robust decision-making
IHA Highlights
▪ Enhanced spreadsheet and graphing tools for viewing results
▪ Context-sensitive Help menu ▪ Range of Variability Approach (RVA) analysis ▪ Environmental Flow Components

TABLEAU
https://public.tableau.com/s/ Overview
Tableau is a general purpose data analytics software tool that connects easily to nearly any data source, be it corporate Data Warehouse, Microsoft Excel or web-based data. Tableau allows for instantaneous insight by transforming data into visually appealing, interactive visualizations called dashboards. This process takes only seconds or minutes rather than months or years, and is achieved through the use of an easy to use drag-and-drop interface.
Scale of Application
Tableau, like all general visualization tools, is not spatially or temporally limited. It may be applied at any scale.
Data Requirements
Tableau itself has no data requirement. It reads and interprets quantitative datasets.
User Community, Support, and Licensing
Tableau has a very active user community that offers a wealth of online support.
Tableau features a public version that carries with it no licensing fee. It also features two desktop versions: Professional edition that costs $2,000 and covers more than 40 connections and Personal edition for $1,000 that can handle six connections. Licensing fees are one-time costs.
Application within the Participatory Process
Tableau can be used to visualize a variety of data. These may include historical observations and/or outputs from other analytical tools. As such, Tableau may be used in an “exploratory” mode, in which we seek to identify trends and stories within historical records, or in an “explanatory” mode, in which we interpret model results. It may be used throughout the water security process as an aid to
understanding the historical context, the current situation, and future scenarios.
Sample Tableau Graphics
Below are two examples of how Tableau has been used in water resources analysis.
Evaluating a single performance metric (e.g. monthly storage) across a range of climate scenarios.
Evaluating multiple (13) performance metrics across many scenario combinations (5 climate x 2 environmental regulation x 2 population x 2 land use x 6 strategies).
Month
Uncertainties Strategies Examining Indicators Metrics
WEADAPT
https://www.weadapt.org/
Overview
weADAPT is a collaborative platform for climate adaptation which draws together a wide range of partners to share experience, tools and case studies to create a dynamic community and knowledge base for adaptation. weADAPT.org is an online “open space” focusing on climate adaptation issues (including the synergies between adaptation and mitigation), which enables practitioners, researchers and policymakers to access credible, high quality information and to share experiences and lessons learnt with the weADAPT community. weADAPT is designed to: facilitate shared learning, collaboration and knowledge integration on a range of issues; foster an online professional community of practice around climate adaptation; and develop and offer access to policy-relevant tools and guidance for adaptation planning and decision-making.
Scale of Application
weADAPT is a forum for sharing information on a range of topics pertaining to adapting to climate variability and change. As such, some topics are global in scope and others offer case studies that range in scale from local to national.
Data Requirements
The user does not need to provide any data to use this platform. Although, participants in the forum are encouraged to share their experiences.
User Community, Support, and Licensing
weADAPT is developed and maintained by the Stockholm Environment Institute (SEI). Content is curated both by SEI and the weADAPT team, a dynamic network of Knowledge Partners, using an innovative suite of technologies. weADAPT started life as “wikiADAPT” and has grown into a collection of over 1000 articles and case studies. It is freely available to everyone.
Application within the Participatory Process
weADAPT can be used to access local knowledge and to connect with practitioners, researchers, and policymakers. Thus, within the participatory process it may be used in:
▪ Defining the Decision Space ▪ Implementation
Thematic Areas
Users can explore several themes. These include:
▪ Drylands Resources Guide ▪ Economics of Adaptation ▪ Gender and Social Equity ▪ Global Initiative on Community-Based Adaptation ▪ Adaptation Decision-Making ▪ Using Climate Science in Adaptation ▪ Transforming Development and Disaster Risk
Highlights
Adaptation Layer is a weADAPT-Google Earth interface to locate who is doing what and where in the field of adaptation to climate variability and change. This tool allows you to browse case studies, projects, videos, downscaled climate projections and experiences of adaptation by a spatial reference, and search by key terms, providing an instant view of what is already going on where.
The climate adaptation Knowledge Base is an extensive set of articles covering a variety of topics pertaining to climate adaptation. It is now an even more flexible, accessible and inclusive medium for enhancing a user’s knowledge and learning on climate adaptation by enabling users both to review existing articles and to create their own articles in order to share their work and experiences. Climate Adaptation Options Explorer (ADX) is a decision support tool to screen adaptation options and provide guidance on selecting locally suitable and appropriate strategies, recognizing and accepting various sources of uncertainty and differing degrees of confidence. This tool is currently in the prototype phase, being tested with various users and developed further. Climate Information Portal (CIP) provides and visualizes historical climate data and a range of projected future climates from multiple climate models, while guiding users through the robust interpretation of this content.
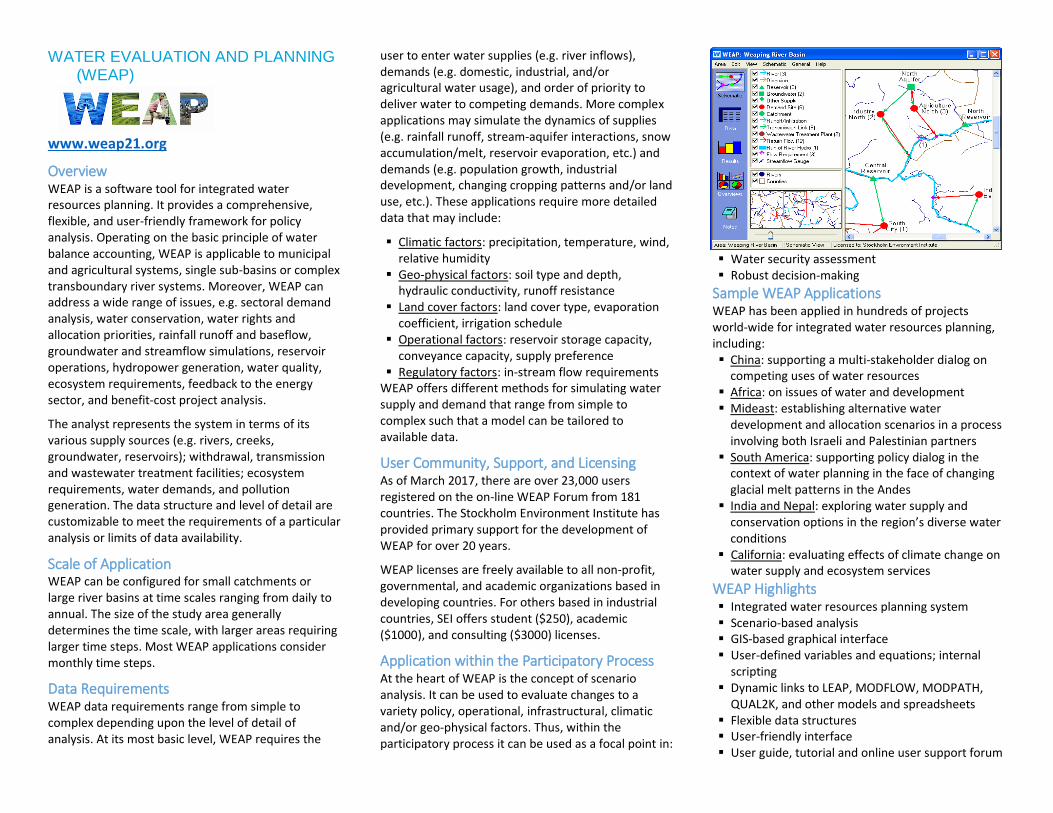
WATER EVALUATION AND PLANNING (WEAP)
www.weap21.org
Overview WEAP is a software tool for integrated water resources planning. It provides a comprehensive, flexible, and user-friendly framework for policy analysis. Operating on the basic principle of water balance accounting, WEAP is applicable to municipal and agricultural systems, single sub-basins or complex transboundary river systems. Moreover, WEAP can address a wide range of issues, e.g. sectoral demand analysis, water conservation, water rights and allocation priorities, rainfall runoff and baseflow, groundwater and streamflow simulations, reservoir operations, hydropower generation, water quality, ecosystem requirements, feedback to the energy sector, and benefit-cost project analysis.
The analyst represents the system in terms of its various supply sources (e.g. rivers, creeks, groundwater, reservoirs); withdrawal, transmission and wastewater treatment facilities; ecosystem requirements, water demands, and pollution generation. The data structure and level of detail are customizable to meet the requirements of a particular analysis or limits of data availability.
Scale of Application WEAP can be configured for small catchments or large river basins at time scales ranging from daily to annual. The size of the study area generally determines the time scale, with larger areas requiring larger time steps. Most WEAP applications consider monthly time steps.
Data Requirements WEAP data requirements range from simple to complex depending upon the level of detail of analysis. At its most basic level, WEAP requires the
user to enter water supplies (e.g. river inflows), demands (e.g. domestic, industrial, and/or agricultural water usage), and order of priority to deliver water to competing demands. More complex applications may simulate the dynamics of supplies (e.g. rainfall runoff, stream-aquifer interactions, snow accumulation/melt, reservoir evaporation, etc.) and demands (e.g. population growth, industrial development, changing cropping patterns and/or land use, etc.). These applications require more detailed data that may include:
▪ Climatic factors: precipitation, temperature, wind, relative humidity
▪ Geo-physical factors: soil type and depth, hydraulic conductivity, runoff resistance
▪ Land cover factors: land cover type, evaporation coefficient, irrigation schedule
▪ Operational factors: reservoir storage capacity, conveyance capacity, supply preference
▪ Regulatory factors: in-stream flow requirements WEAP offers different methods for simulating water supply and demand that range from simple to complex such that a model can be tailored to available data.
User Community, Support, and Licensing As of March 2017, there are over 23,000 users registered on the on-line WEAP Forum from 181 countries. The Stockholm Environment Institute has provided primary support for the development of WEAP for over 20 years.
WEAP licenses are freely available to all non-profit, governmental, and academic organizations based in developing countries. For others based in industrial countries, SEI offers student ($250), academic ($1000), and consulting ($3000) licenses.
Application within the Participatory Process At the heart of WEAP is the concept of scenario analysis. It can be used to evaluate changes to a variety policy, operational, infrastructural, climatic and/or geo-physical factors. Thus, within the participatory process it can be used as a focal point in:
▪ Water security assessment ▪ Robust decision-making
Sample WEAP Applications WEAP has been applied in hundreds of projects world-wide for integrated water resources planning, including: ▪ China: supporting a multi-stakeholder dialog on
competing uses of water resources ▪ Africa: on issues of water and development ▪ Mideast: establishing alternative water
development and allocation scenarios in a process involving both Israeli and Palestinian partners
▪ South America: supporting policy dialog in the context of water planning in the face of changing glacial melt patterns in the Andes
▪ India and Nepal: exploring water supply and conservation options in the region’s diverse water conditions
▪ California: evaluating effects of climate change on water supply and ecosystem services
WEAP Highlights ▪ Integrated water resources planning system ▪ Scenario-based analysis ▪ GIS-based graphical interface ▪ User-defined variables and equations; internal
scripting ▪ Dynamic links to LEAP, MODFLOW, MODPATH,
QUAL2K, and other models and spreadsheets ▪ Flexible data structures ▪ User-friendly interface ▪ User guide, tutorial and online user support forum

WATERSHED ECOSYSTEM SERVICES TOOL (WESTOOL)
Current Version:
http://www.arcgis.com/apps/MapSeries/index.html?appid=4bcbc2199d024320b142fa5c40a9f5d2
Overview
The Watershed Ecosystem Service Tools (WESTool) is an innovative online tool that assess the ecosystem service impacts of land use decisions. The WESTool integrates complex spatial datasets and hydrological modeling into a highly intuitive web interface with interactive maps and customizable analyses, giving users from all backgrounds a powerful tool to support informed land use planning. The WESTool is currently developed for Cambodia but can be developed for any area. The WESTool can be used to explore and understand the impacts of deforestation on hydrological flows, sediment transport, nutrient transport, and carbon/GHG flux. It provides objective, science-based information to inform assessments of both past and future land management at a range of customizable scales. The WESTool uses land cover maps, remote sensing data (e.g., rainfall and net primary productivity) and hydrological modeling (SWAT model) to develop spatially explicit data layers for variables like flow, runoff, sediment and nutrient erosion, water infiltration, evaporation, etc. This data is then used to assess the impacts of land use change on erosion, water flow, and water quality. It can also be used to assess what the impact would be if an area was converted to another land use.
While the currently available WESTool was built specifically for Cambodia, it can be developed for other geographies, given the necessary data are available.
Scale of Application
The WESTool can produce customized analyses at a wide range of scales across Cambodia, from very small watersheds to national and regional assessments. It is not applicable at continental or global scales. Results in the WESTool are provided at an annual temporal scale, though the underlying hydrological modeling can produce results at any temporal scale (hourly to yearly), and model past and present scenarios.
Data Requirements
The modeling and analyses developed for the WESTool draw data from weather stations, spatial layers of soil, slope, land cover freely available global, regional and national datasets.
User Community, Support, and Licensing
The WESTool for Cambodia was developed by Winrock International under funding from the United States Agency for International Development (USAID) under the Cambodia Supporting Forests and Biodiversity Project and is open access.
The WESTool can be developed for other specific geographies upon request. The cost of development varies based on the area of the analysis and the complexity.
Application within the Participatory Process
The WESTool’s open-access, user-friendly, objective, science-based nature make it an ideal tool for the participatory process. It can be used for environmental impact assessments, as well as in determining where to prioritize conservation measures and where development may have the least impact in a landscape.
Highlights
The WESTool’s gives users the ability to access powerful analyses of the environmental impacts of land use change without any technical GIS or modeling experience.
Built with strong stakeholder engagement, it is ideal for policymakers and land use managers in developing countries looking to balance
conservation and development goals.
WESTool Forests and Biodiversity Analysis

WATER ACTION HUB
http://www.wateractionhub.org
Overview
The Water Action Hub was created to be a key decision support tool to help those interested in working on partnerships and collective action understand who else may be interested in the same topics and in which regions of the world. Launched in August 2012, it was developed in response to the idea that current approaches to water-related collective action were too opportunistic, and as a result, suboptimal. Larger alliances with a range of stakeholders and the ability to pool resources and focus efforts in shared “hotspot” watersheds would be more effective. Also identified was the need for organized and readily accessible information to help businesses and other stakeholders understand their options for collective action on water issues, particularly whom they can work with in a particular region of interest.
Scale of Application
A new version of the Hub, to be launched in early Q2 2017 will enable users to search for potential projects or partners at the province or state, river basin, or country wide scales.
Data Requirements
Water Action Hub users are asked to enter a variety of information when they register to use the Hub. This includes:
1) Basic information about their organization (whether they are a company – if so from what sector, government entity, non-governmental organization, utility, or other)
2) Where they are interested in working and on what specific water issues such as on improving water efficiencies, improving agricultural water use, managing water quality, protecting local water systems, etc.
3) In the regions where they may have an interest in working, what their perceptions of the water-related challenges may be (such as competition over resources, upstream water issues, to poor governance).
4) If they have any current projects on water, where these may be located, what topics do they cover, and what outcomes are meant to be achieved.
User Community, Support and Licensing
As of March 2017, there are 429 organizations who have registered their interest on the Hub and over 250 projects in over 450 locations around the world. The Hub is free for all users and only requires simple registration and organizational affiliation.
Application within the Participatory Process
The Water Action Hub can help identify relevant stakeholders regions around the world that have an interest in addressing water challenges and their perceptions of local water issues so that they can be involved in the water-security process. It also helps identify ongoing projects underway.
Sample Water Action Applications
The Water Action Hub is used in a variety of different basins. Most prominently, it was used to map the stakeholders in the Colorado River Basin who were interested in addressing waters in the West. That mapping led to an organized meeting held in Los Angeles, California which led to the organization of the initiative, California Water Action Collaborative: http://cawateraction.org/what-is-cwac/ which today is working with a variety of businesses and other stakeholders to address California’s water issues.
Highlights
• Helps identify key stakeholders, their interests, and perceptions of local water challenges
• Helps identify ongoing water projects already underway
• Free to use by all organizations