analytical strategies for assessing ionophores in the environment
TRANSCRIPT

Trends in Analytical Chemistry, Vol. 28, No. 5, 2009 Trends
Analytical strategies for assessingionophores in the environmentMartin Hansen, Erland Bjorklund, Kristine A. Krogh, Bent Halling-Sørensen
Ionophores are antiparasitic compounds used worldwide as prophylactic
chemotherapeutics and growth promoters in livestock production. Several
reports have revealed that ionophores are emerging environmental contam-
inants occurring in the environment in manure, soil, surface water, groun-
dwater and sediment, due to their continually increasing application as feed
additives in modern livestock production.
This article gives the first overview of the occurrence and the fate of
ionophores in manure, soil, surface water, groundwater and sediment, rev-
iews applied analytical methods and discusses possible new sample-prepa-
ration and measurement strategies.
ª 2009 Elsevier Ltd. All rights reserved.
Keywords: Anticoccidial; Coccidiostat; Environmental analysis; Lasalocid; Liquid
chromatography-mass spectrometry; Monensin; Narasin; Pressurized liquid extraction;
Salinomycin; Solid-phase extraction
Martin Hansen,
Erland Bjorklund*,
Kristine A. Krogh,
Bent Halling-Sørensen
Section of Toxicology and
Environmental Chemistry,
Department of Pharmaceutics
and Analytical Chemistry,
Faculty of Pharmaceutical
Sciences, University of
Copenhagen,
Universitetsparken 2, DK-2100
Copenhagen, Denmark
*Corresponding author.
Tel.: +45 35 33 62 80;
Fax: +45 35 30 60 13;
E-mail: [email protected]
0165-9936/$ - see front matter ª 20090165-9936/$ - see front matter ª 2009
1. Introduction
The occurrence of pharmaceuticals in ourenvironment has been of growing concernworldwide for more than a decade [1,2],and is today considered a well-establishedresearch area within the field of environ-mental chemistry [3]. One group of phar-maceuticals that has been determined inthe environment to some extent comprisesveterinary medicines (i.e. antibacterialagents) due to their systematic use inagriculture [4]. These antibacterial agentsinvolve, e.g., b-lactams [5,6], macrolides[7,8], sulfonamides [9], tetracyclines [10]and quinolones [11].
Until now, rather little attention hasbeen directed towards anticoccidials, orcoccidiostats, though anticoccidial com-pounds are intensively used as prophy-lactic chemotherapeutics given asveterinary-feed additives. They are alsoused as growth promoters and therapeu-tics in producing poultry, cattle, swine,sheep and rabbits [12,13]. These com-pounds possess antiparasitic potency [14],of which the primary aim is to inhibit or tokill parasites that induce coccidiosis and toenhance growth rates of livestock [15,16].
Elsevier Ltd. All rights reserved. doi:10.1016/j.trac.2009.01.008Elsevier Ltd. All rights reserved. doi:10.1016/j.trac.2009.01.008
In the European Union (EU), anticocci-dial compounds are classified as feedadditives in animal nutrition, while theUSA classifies them as drugs for use inanimal feeds [12,17]. Currently in the EU,11 compounds are approved as coccidio-stats for producing chickens, turkeys,geese, ducks, and, to some extent, rabbits(Table 1) [17,18]. In the USA, 23 differentcompounds are approved as anticoccidialsand are given as prophylactics to preventoutbreaks of coccidiosis (Table 1) [12].Moreover, the usage of these compoundsin the USA is more liberal than in the EU,so several compounds are also applied asgrowth promoters in producing cattle andsheep [12] and the feed may contain acombination of up to three compounds: aprophylactic coccidiostat (e.g., lasalocid);an antibiotic growth promoter (e.g., lin-comycin or chlortetracycline); and, anarsenical compound with both properties(e.g., roxarsone) [19]. At present, thereare seven anticoccidials still allowed in theUSA that were banned in EU in the period1997–2001 (Table 1) [12,17]. In organiclivestock production, anticoccidial feedadditives are banned according to existingregulations in the EU [20,21] and the USA[22].
Boxall and co-workers [23] stated thatanticoccidials belong to the group of vet-erinary medicines sold most, second onlyto antimicrobial substances. The Union ofConcerned Scientists estimated livestockusage of non-therapeutic antimicrobials inthe USA to be more than 11 · 106 kg(2001) [24]. The consumptions of anti-coccidials were assessed to be 13,236 kgin Denmark (2004) [25], 6500 kg inNorway (2006) [26] and 12,527 kg inSweden (2007) [27]. Salinomycin consti-tuted of 76% of the usage in Denmark[25], while narasin was the most widely
521521

Table 1. Approved anticoccidial agents in the European Uniona)
and the USA (all listed)
Ionophores Synthetics
Lasalocida) Decoquinatea) Amproliumc)
Maduramicina) Diclazurila) AklomideMonensina) Halofuginonea) Clopidolc)
Narasina) Nicarbazina,b) Ethopabatec)
Salinomycina) Robenidinea) Nequinatec)
Semduramicina) Roxarsonec)
SulfaquinoxalineZoalenec)
Nitromide and sulfanitrand)
Sulfadimethoxineand ormetoprimd)
a)Approved in EU.b)Nicarbazin only allowed in combination with narasin in EU.c)Banned in EU as of the period 1997–2001.d)One product containing two active substances.
Trends Trends in Analytical Chemistry, Vol. 28, No. 5, 2009
used anticoccidial in Sweden [27] and Norway, where itamounted up to 86% [26]. In Korea, the total usage ofcoccidiostats was more than 1300 tons in 2005, ofwhich 47% was salinomycin [28]. From these data, it isevident that ionophores are the anticoccidial agents usedin greatest quantities.
Synthetic anticoccidials (non-ionophores) are muchmore efficient towards the parasites and are thereforegiven at lower concentrations (up to a factor of 120lower for, e.g., Diclazuril and Halofuginone). Forexample, the total consumption of Robenidine inDenmark was 126 kg annually, while, for salinomycin,it was around 10,070 kg per year (2004) [25]. This ratio
Figure 1. Major routes of introduction of ionophores into the environment,of these veterinary compounds.
522 http://www.elsevier.com/locate/trac
might be even higher in the USA, since farmers there arealso allowed to use ionophores as growth promoters incattle and sheep production. Ionophores are the anti-coccidials applied in the greatest amounts, and are alsofound to the greatest extent in the environment [29–35].
Currently, there are no analytical methods to deter-mine synthetic anticoccidials in the environment, prob-ably due to expectation that their environmentalconcentrations will be below that of ionophores. Thisreview therefore focuses on the chemical analysis ofmonocarboxylic ionophores in environmental matrices,since peer-reviewed analytical methods mainly involvethis sub-group of anticoccidials.
It is reasonable to believe that the major routes ofintroduction into the environment, outlined in Fig. 1,are similar for most types of veterinary compounds. Closeto 80% of the ionophore lasalocid administered is ex-creted as the parent compound from chickens [36].Ionophores are primarily excreted with urine and feces,so residues are in manure (slurry), soil, water and sedi-ment. Measured concentrations are at the lg/kg level inmanure and sediments [32,33], and at the ng/L level forsurface water and groundwater [29–32,34,35]. Iono-phores evidently possess antimicrobial potency andmight pose a risk to terrestrial or aquatic living organ-isms. There is meager information available on theenvironmental fate of these compounds in the literature[23]. More research is therefore needed to evaluateproperly the fate and the effects and to assess the risk ofanticoccidials. However, a prerequisite for this researchis the availability of suitable analytical strategies, so, inview of the heavy usage of ionophores, it is timely tomake an overview of literature relating to their analysis
together with important compartments for analyzing the occurrence
Trends in Analytical Chemistry, Vol. 28, No. 5, 2009 Trends
in the environment. This review summarizes the occur-rence and the fate of ionophores in the environment andreviews the analytical methods applied. It does not in-clude analysis of these substances in food and feed items,which has been covered partly elsewhere [15,37]. Fur-ther, the review does not assess the environmental risk ofanticoccidials, which we will address in a subsequentarticle.
2. Physiochemical properties of ionophores
Basic physiochemical properties of interest in the devel-opment of analytical strategies are pKa values, watersolubility, octanol-water distribution (Kow), solid matrix-water distribution (Kd) and possible complexation tometals or organic components. Ionophores are wellknown to form lipophilic quasi-cyclic neutral complexeswith (earth) alkali metals at pH > pKa [38–41]. There isno consensus on the specific environmental physio-chemical behavior of ionophores. As proposed byPressman [42], open-chain depiction might be mislead-ing, since ionophores form rings by head-to-tail hydro-gen bonding. Involvement of the carboxyl group in ringformation is compound specific, and may or may not beused (e.g., it is not used for monensin). In addition,ionophores should only form cationic complexes when
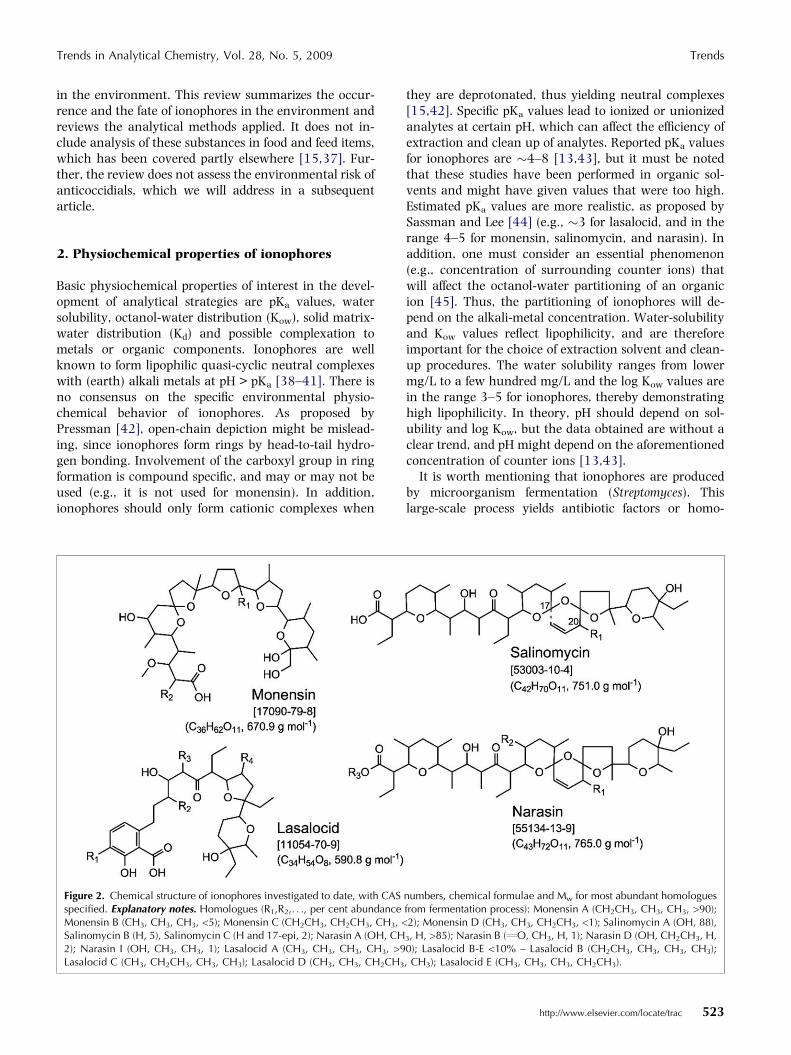
Figure 2. Chemical structure of ionophores investigated to date, with CASspecified. Explanatory notes. Homologues (R1,R2,. . ., per cent abundanceMonensin B (CH3, CH3, CH3, <5); Monensin C (CH2CH3, CH2CH3, CH3, <Salinomycin B (H, 5), Salinomycin C (H and 17-epi, 2); Narasin A (OH, CH2); Narasin I (OH, CH3, CH3, 1); Lasalocid A (CH3, CH3, CH3, CH3, >9Lasalocid C (CH3, CH2CH3, CH3, CH3); Lasalocid D (CH3, CH3, CH2CH3
they are deprotonated, thus yielding neutral complexes[15,42]. Specific pKa values lead to ionized or unionizedanalytes at certain pH, which can affect the efficiency ofextraction and clean up of analytes. Reported pKa valuesfor ionophores are �4–8 [13,43], but it must be notedthat these studies have been performed in organic sol-vents and might have given values that were too high.Estimated pKa values are more realistic, as proposed bySassman and Lee [44] (e.g., �3 for lasalocid, and in therange 4–5 for monensin, salinomycin, and narasin). Inaddition, one must consider an essential phenomenon(e.g., concentration of surrounding counter ions) thatwill affect the octanol-water partitioning of an organicion [45]. Thus, the partitioning of ionophores will de-pend on the alkali-metal concentration. Water-solubilityand Kow values reflect lipophilicity, and are thereforeimportant for the choice of extraction solvent and clean-up procedures. The water solubility ranges from lowermg/L to a few hundred mg/L and the log Kow values arein the range 3–5 for ionophores, thereby demonstratinghigh lipophilicity. In theory, pH should depend on sol-ubility and log Kow, but the data obtained are without aclear trend, and pH might depend on the aforementionedconcentration of counter ions [13,43].
It is worth mentioning that ionophores are producedby microorganism fermentation (Streptomyces). Thislarge-scale process yields antibiotic factors or homo-
numbers, chemical formulae and Mw for most abundant homologuesfrom fermentation process): Monensin A (CH2CH3, CH3, CH3, >90);2); Monensin D (CH3, CH3, CH2CH3, <1); Salinomycin A (OH, 88),
3, H, >85); Narasin B (‚O, CH3, H, 1); Narasin D (OH, CH2CH3, H,0); Lasalocid B-E <10% – Lasalocid B (CH2CH3, CH3, CH3, CH3);, CH3); Lasalocid E (CH3, CH3, CH3, CH2CH3).
http://www.elsevier.com/locate/trac 523

Table 2. Measured concentrations of ionophores in environmental matrices using liquid chromatography with tandem mass spectrometry (LC-MS2)
Matrix Type Analyte Concentration (lg/L or lg/kg) nq/na Ref.
Manure Conventional swinemanagement
Salinomycin A 11 1/4 [33]
Water River, five sampling sitesdownstream agricultural land useand animal-feeding operationswith seasonal variation
Monensin A 0.001–0.036 10/16 [32]Salinomycin A 0.002–0.007 5/16Narasin A 0.007–0.038 7/16
River, five sampling sitesdownstream agricultural land useand animal-feeding operations
Monensin A 0.03–0.05 3/45 [29]Monensin B ND 0/45Salinomycin A 0.04 1/45Narasin A 0.04–0.06 3/45
Surface run-off from livestockfarm, drainage and stagnantwater
Monensin A 0.002–0.037 6/11 [34]
Surface waters from agriculturalrun-off
Monensin A 0.020–0.220 7/8 [51]
Surface waters and wastewater-treatment plant (WWTP) effluent
Monensin A 0.002–0.022 5/16 [31]Lasalocid A 0.011–0.028 4/16
Groundwater Monensin A 0.04–0.39 5/30 [35]
Sediment River, five sampling sitesdownstream agricultural land useand animal-feeding operationswith seasonal variation
Monensin A 1.5–31.5 8/16 [32]Salinomycin A 0.9–30.1 7/16Narasin A 2.0–16.3 8/16
nq/na, Fraction quantified of total analyzed; ND, Not detected.
Trends Trends in Analytical Chemistry, Vol. 28, No. 5, 2009
logues and other impurities (e.g., the production ofmonensin yields four homologues A, B, C and D [46]).The majority of homologues comprises the A form(usually above 80%). Fig. 2 lists the most commonhomologues of the relevant ionophores. Some analyticalmethods have been developed for several homologues ofthe same ionophore [29].
3. Occurrence and fate of ionophores
The analytical methods discussed below have been ap-plied to a range of environmental samples. Table 2summarizes the environmental occurrence of iono-phores. Salinomycin A was determined in manure fromstorage tanks from treated pigs [33]. The researchersfound a concentration of 11 lg/kg manure in one of foursamples from pigs treated two months earlier. Later on,the same research group performed anaerobic degrada-tion studies (at 20�C and darkness) of salinomycin A inspiked manure (2 mg/kg) from pigs, which had not beenmedicated for 8 months applying the same method [47].They found rapid first-order degradation with a half-life of5 days after an initial 4-day lag. Additionally, theyidentified three transformation products of salinomycin A
524 http://www.elsevier.com/locate/trac
in manure extracts after 192 days of degradation. Con-tinuous prophylactic treatment with salinomycin A willnot degrade the ionophore completely; consequently, themanure amended soil may be contaminated.
Schlusener et al. analyzed agricultural soil samplestaken 9 months after addition of the aforementionedpig manure (with a salinomycin A concentration of11 lg/kg manure) and found no traces of salinomycin A[48]. Afterwards, the same research group per-formed degradation studies of salinomycin A in a spiked(2 mg/kg) soil and found first-order kinetics with a half-life of 5 days [49].
A plot study was used to investigate dissipation andmobility of monensin A [50]. The agricultural soils withand without manure added were spiked (ca. 1 mg/kg or1.8 kg/ha) and cultivated afterwards. They found dissi-pation half-lives for monensin A of 3.3–3.8 days with nosignificant difference between soils with and withoutmanure added [50].
Another research study found similar degradationkinetics in manure-added soils with half-lives of 1.3–2.0days and 1.5–3.6 days for monensin A and lasalocid A,respectively [44].
In the soil-plot study aforementioned, the mobility wasinvestigated with natural precipitation events with

Trends in Analytical Chemistry, Vol. 28, No. 5, 2009 Trends
sampling from three levels (depths: 0–15 cm; 15–25 cm;and, 25–35 cm) [50]. Monensin A was found in the toplevel only, so it was concluded that it was immobileunder the conditions studied.
Another agricultural soil-plot study with a simulated1-hour rainfall showed weak leaching of freshly surfacespiked monensin A (271 mg/plot or 0.45 kg/ha) fromthe pre-cultivated soil [30]. The researchers collectedrun-off (water with colloidal solids) from the soil andfound the cumulative absolute leaching of monensin Aas 0.219 mg/plot or less than 0.1%, of which 9% wasassociated with the solid colloids.
Freundlich-sorption isotherms of monensin A andlasalocid A were evaluated in eight different soils [44].Sorption-distribution coefficients (Kd) for the eight soilswere in the ranges 11–210 L/kg and 0.9–79 L/kg forlasalocid A and monensin A, respectively. These resultsindicated lasalocid A to have greater sorption strengththan monensin A. The authors observed the trend thatsorption coefficients normalized to organic-carbon con-tent (Koc) decreased with increasing soil pH (pH 4–7)[44].
In total, 126 different water samples have been ana-lyzed in the USA for at least one ionophore, monensin Abeing most frequently analyzed and detected in 36samples (Table 2). Monensin A, salinomycin A, narasinA and lasalocid A were found in surface waters close toagricultural activity in concentrations up to 0.220 lg/L[29,31,32,34,51]. Monensin A was reported in fourgroundwater wells close to dairy farms at concentrationlevels up to 0.39 ± 0.02 lg/L [35].
One paper described the occurrence of monensin A,salinomycin A and narasin A in 8 of 16 river sediments[32]. The measured concentrations were up to 31.5 lg/kg (dry weight), 30.1 lg/kg (dry weight) and 16.3 lg/kg(dry weight) for monensin A, salinomycin A and narasinA, respectively (Table 2). Concentrations of ionophoresfrom the water column above were measured and usedto estimate pseudo-partitioning coefficients (Kd) in therange of 102–104 L/kg. As expected, these findingsindicated that ionophores accumulate in sediments.
There is a need to evaluate the sorption of ionophoresto soil colloids and the subsequent transport via macropores to lower soil layers. Bioavailability, composition ofthe microbial community and abiotic factors might affectthe degradation of ionophores, so they need to beinvestigated, in particular desorption of bound residues.Fate studies of transformation processes in water andsediment compartments are also required, especially insediments that appear to accumulate ionophores.
4. Sample preparation
Trace-level determination of xenobiotics in the environ-ment requires accurate, precise and robust methods with
detection limits at low or sub-lg/kg levels for manure,soils and sediments and at sub-ng/L level for surfacewater and groundwater. This often necessitates ad-vanced extraction and clean-up procedures followed byfinal detection with liquid or gas chromatographic sep-aration coupled to tandem mass spectrometry (LC-MS2
or GC-MS2). The analysis text below deals with LC-MS2
applications, as ionophores are inappropriate for GC. Afew recent papers [52–55] reported on biochemicaltechniques [i.e. enzyme-linked immunosorbent assay(ELISA)] to determine monensin. This technique haddetection limits several orders of magnitude greater thanthose discussed below that used chemical analysis.ELISA therefore seems unsuitable for measuring realisticenvironmental concentrations so we do not discuss itfurther.
Tables 3 and 4 summarize analytical methods fordetermination of ionophores in water and manure, soiland sediment, respectively. We discuss these methods inthe following sections.
4.1. Water4.1.1. Sampling and pre-handling. Sampling strategiesare often mentioned only briefly in cited studies. Thegeneral trend in surface water is to use random grabsampling midstream in order to avoid collection of sed-iment [29,51]. In order to remove particles, the samplesare often filtered through small-size glass-fiber filters(0.2–0.4 lm) [29,30,32,34] and normally stored at 4�C[29,34,51].
Storage is preferably made in amber-glass bottles toavoid adsorption to plastics and to prevent photo-deg-radation [31,34,51]. In most studies, analysis is per-formed within a week, but it has been stated thatmonensin A can be stable for days to a few weeks whenadjusted to pH 8.2 [51]. With addition of formaldehydeto wastewater samples, the stability can be increasedeven further to several weeks [31]. However, no datahave been presented to verify this.
In one study, sodium chloride was added to the sam-ples (0.005–1%) to generate higher concentrations ofsodium-ionophore complexes [29]. In a later study fromthe same laboratory, sodium chloride was not added, sothe effect of this treatment is uncertain [32].
Prior to extraction, Cha and co-workers also heated allglassware to 450�C (1 h) and thereafter rinsed with 5%Na2EDTA solution and water in order to remove allcomplex-forming cations [29]. In a later study by thesame group [32], no pre-cleaning of glassware wasmentioned, so we cannot conclude if this treatment wasimportant.
4.1.2. pH of the sample. Several researchers have ad-dressed the influence of pH on sample stability in theirinvestigations. Measured pH in samples was in the range7.0–8.5 and no adjustment was made [30,32,34,35]. At
http://www.elsevier.com/locate/trac 525

Table 3. Published analytical methods for determination of ionophores in water
Matrix Analyte Extraction Separation Detection Recovery (%) Recovery/linear
range (lg/L)
LOD/LOQ
(lg/L)
Ref.
River Monensin A 120 mL sample (filtered,
NaCl addition, pH 7.5)
XTerra MS C18, 50 · 2.1 mm,
2.5 lm, 0.30 mL/min
ESI(+) 94 ± 12b) 0.07–50/0.05–5 0.03/–c) [29]
Monensin B Ion trap (3D) 92 ± 7b) 0.05/–c)
Salinomycin A Oasis HLB 60 mg 0.1 M Formic acid:MeOH:MeCN SRM modea) 94 ± 10b) 0.04/–c)
Narasin A Elution: 5 mL MeOH 95 ± 7b) 0.04/–c)
Monensin A 120 mL sample (filtered,
pH 7.5–8.3)
XTerra MS C18, 50 · 2.1 mm,
2.5 lm, 0.25 mL/min
ESI(+) 115 ± 12b) 0.01–2.0/0.001–5 –/0.001d) [32]
Salinomycin A Ion trap (3D) 100 ± 7b) –/0.002d)
Narasin A Oasis HLB 60 mg 0.1% Formic acid in water:MeOH SRM modea) 105 ± 13b) –/0.003d)
Elution: 5 mL MeOH
Monensin Ae) 400 mL sample (2 g Na2EDTA,
pH 8.2)
Genesis C18, 150 · 2.1 mm,
0.25 mL/min
ESI(+) 83f) 1.25/0.025–25g) 0.38/0.015h) [51]
Q-trap (2D)
Oasis HLB 60 mg 0.015% HFBA, 0.5 mM SRM mode
Elution: 5 mL MeOH NH4Ac:MeOH:MeCN
Surface run-off Monensin Ai) 120 mL sample (filtered) XTerra MS C18, 50 · 2.1 mm,
2.5 lm, 0.25 mL/min
ESI(+) Same data as
reported in [32]
0.1–5.0/– Same data as reported in [32] [30]
Oasis HLB 60 mg Ion trap (3D)
Elution: 5 mL MeOH 0.1% Formic acid in water:MeOH SRM mode
Surface water Monensin Aj) 30 mL sample (filtered,
pH 7.0–8.5, 3 mL MeOH)
Hypersil Gold C18, 50 · 2.1 mm,
5 lm, 0.30 mL/min
ESI(+) 92 ± 17k) 1–3/0.015–300 –/0.001 [34]
Triple quad (QqQ)
Oasis HLB 200 mg Water:MeCN, both with 20 mM
HFBA
SRM mode
Elution: 5 mL MeOH (with 2%
Formic acid)
Monensin A 150–800 mL (4 g Na2EDTA, pH 7.0) Hypersil Gold C18, 100 · 2.1 mm,
3 lm, Monensin; 0.03%
HFBA:MeCN and Lasalocid; 10 mM
NH4Ac:MeCN
ESI(+/�) 190g) NA –/0.040c,i) [31]
Lasalocid Al) Q-trap (2D) 122g) –/0.055c,i)
Oasis HLB 200 mg SRM mode
Elution: 5 mL MeOH
Groundwater Monensin A 125 mL sample (filtered,
pH 7.0–7.9)
Gemini C18, 50 · 2.0 mm, 5 lm,
0.30 mL/min
ESI(+) 105 ± 7 0.1/0.005–5 0.02/–c) [35]
Lagoon water Ion trap (3D) 100 ± 7
Oasis HLB 60 mg MeOH:0.1% Formic acid (80:20) SRM modea)
Elution: 5 mL MeOH
a)SIM was used for the internal standard simatone.b)Average recovery for analytes spiked in a surface water collected downstream of wastewater-treatment plant (WWTP) (n = 3). For details see text.c)Method detection level (MDL).d)Statistically determined LOQs.e)Multi-method for 27 pharmaceuticals.f)Spiked surface water, but it is not stated how the recovery was calculated.g)Not stated, but estimated by us based on the information available.h)The reader is referred to the original paper for a first-hand explanation due to difficulties understanding how these experiments were performed.i)Combined with 2 tetracyclines, 2 sulphonamides and 2 macrolides.j)Combined with amprolium, carbadox and tylosin.k)Absolute recoveries in spiked river water using external calibration curves without internal standard or matrix-matched calibration.l)Multi-method for 38 pharmaceuticals, 10 endocrine disruptors and 3 perfluoroalkylated compounds; MeOH, Methanol; NA, Not available; NH4Ac, Ammonium acetate; ESI, Electrosprayionization (positive or negative mode); HFBA, Heptafluorobutyric acid; SRM, Selected reaction monitoring; SIM, Selected ion monitoring.
Tren
ds
Tren
ds
inA
nalytical
Chem
istry,V
ol.
28,
No.
5,
2009
526
http
://ww
w.elsevier.co
m/lo
cate/trac

Table 4. Published analytical methods for determination of anticoccidials in manure, soil and sediment
Matrix Analyte Extraction Clean up Separation Detection Recovery (%) Recovery/linearrange (lg/kg)
LOD/LOQ (lg/kg) Ref.
Manure Salinomycin Aa) 15 g sample (5 gurea, pH 8) LLE withEtOAc
UCT Diol SPE 2 g Phenosphere NextRP18
APCI(+) 119 ± 22b) 2–2000/11–2500 3.2/10.7 [33]
Elution with 0.1 MNH4Ac:MeCN(2:3)
150 · 2 mm, 3 lm,0.2 mL/min
Triple quad (QqQ)SRM mode
0.1 MNH4Ac:MeCN
Soil Salinomycin A PLE, 30 g samplewith MeOH (1%NH4OH)
UCT Diol SPE 2 g Phenosphere NextRP18
APCI(+) 76 ± 32c) 1–2000/5–2000 –/5.3 [48]
Elution with 0.1 MNH4Ac:MeCN(2:3)
150 · 2 mm, 3 lm,0.2 mL/min
Triple quad (QqQ)SRM mode
0.1 MNH4Ac:MeCN
Monensin A 1 g sample LLE withEtOAc (NH4-citrate,NH4OH, pH 5.8)
None Allure C18,50 · 2.1 mm, 5 lm,0.2–0.5 mL/min
ESI(+) 75d) 100–5000/– 2/–e) [50]Triple quad (QqQ)
NH4Ac and Formicacid (pH 3):MeCN
SRM mode
Sediment Monensin A 1 g sample LLE with2 · 20 mL 1 MNH4OH (pH 10)
Oasis HLB 60 mg XTerra MS C18,50 · 2.1 mm,2.5 lm, 0.25 mL/min
ESI(+) 83 ± 6g) 1–90/1–90 –/0.4h) [32]Salinomycin A 40 mL extract Ion trap (3D) 81 ± 4g) –/3.6h)
Narasin A Elution with MeOH 0.1% Formic acid inwater:MeOH
SRM modef) 53 ± 10g) –/0.7h)
a) Combined with 5 macrolides and tiamulin. Monensin did not give constant recovery.b) Recovery for entire sample-preparation method as an average of 5 spiking levels (2–2000 lg/kg) in blank manure. No concentration dependence on recoveries was reported.c) Recovery as an average of 5 spiking levels (1–2000 lg/kg) in blank soil. No concentration dependence on recoveries was reported. It is not known if this recovery mainly referred to the PLE
step since IS was added prior to SPE and no evaluation of SPE recovery was done explicitly. The efficiency of this method for real sample is therefore not known, see text.d) Recovery as an average of 3 spiking levels of soil in the range 100–5000 lg/kg, but it is not stated how the recovery was calculated. No concentration dependence on recoveries was reported.e) The reader is referred to the original paper for a first-hand explanation, due to difficulties understanding how these experiments were performed.f) SIM was used for the internal standard (IS) simatone.g) Analytes spiked to matrix just prior to extraction, no evaluation of aging effects. Recoveries also included recoveries from the SPE step, which was, however, quantitative, as seen above for
water (Table 2).h) Statistically determined LOQs. See text for details; NH4Ac, Ammonium acetate; EtOAc, Ethyl acetate; IS, Internal standard; LLE, Liquid-liquid extraction; Range, Spiking concentration range
for recovery experiments; PLE, Pressurized liquid extraction.
Tren
ds
inA
nalytical
Chem
istry,V
ol.
28,
No.
5,
2009
Tren
ds
http
://ww
w.elsevier.co
m/lo
cate/trac527

Figure 3. Experimental set-up for evaluation of absolute recoveryof ionophores in solid-phase extraction (SPE) of water samples, to-gether with investigation of concentration dependence and matrixeffects on recoveries [29]. Spiked levels of ionophores given inparentheses.
Trends Trends in Analytical Chemistry, Vol. 28, No. 5, 2009
this pH, ionophores are unprotonated and most likelycomplexed with a cation, thus forming a neutral com-plex with high lipophilicity.
Only one study adjusted pH (to 7.5 by adding NaOH[29]), while, in a later study from the same researchgroup, the method was improved by omitting the addi-tion of NaOH [32].
Hao et al. investigated the effect of pH on SPE (HLB)recovery of monensin A and found recoveries of 4%,75% and 51% at pH 2.5, 7.2 and 9.0, respectively, forspiked surface waters [51]. In a more recent paper by thesame group, SPE recoveries in pure drinking water formonensin A were �49%, 87% and 98%, and, for lasa-locid A, �30%, 92% and 90%, at pH 2.5, 7.0 and 9.5,respectively [31]. It therefore seems as if pH over 7.0 isrecommendable, even though there is no absolute con-sensus regarding pH and its effects on extraction ofionophores. However, it is reasonable to believe thatadjusting the pH in the range 7–9 will be appropriate formost ionophores based on their pKa values, therebykeeping them unprotonated and lipophilic due to com-plexation with cations.
4.1.3. Solid-phase extraction (SPE). To date, all studieson ionophores in water samples apply a mixed modesolid phase (e.g. HLB) as seen in Table 3 [29–32,34,44,51]. Cartridge sizes of 60 mg have been used,combined with 120 mL water [29,30,32] or 400 mLwater (multi-residue method) [51], but 200 mg car-tridges have also been used with 30 mL water [34] or150–800 mL water (multi-residue method) [31]. Puremethanol was used as elution solvent, except in onecase, where 2% formic acid was added to the methanol[34]. Sample extracts were evaporated under nitrogenand diluted in mobile phase and analyzed with LC-MS2
[29,30,32]; alternatively, an aliquot was removed andanalyzed immediately [34]. In some cases, dried sampleextracts were reconstituted in as little as 0.1 mL deion-ized water [51]. This could be a problem, as precipitationof matrix components might arise, so sorption of iono-phores to matrix debris could take place.
In the study by Cha and colleagues [29], the transferof ionophores through the SPE cartridge was assured byperforming a recovery study, as illustrated in Fig. 3. Inthat study, three water types were spiked [i.e. deionizedwater; clean, natural surface water from snow run-off;and, surface water located downstream from a waste-water-treatment plant (WWTP)]. They obtained infor-mation of the absolute recoveries for the SPE column bycomparing the ratio of the concentrations betweensamples spiked before and after SPE. The averagerecoveries of all four anticoccidials (monensin A,monensin B, salinomycin A and narasin A) in concen-tration range 0.07–50 lg/L were 100 ± 7%, 96 ± 8%and 94 ± 9% for the three different water types, respec-tively. Concentration dependence was not observed in
528 http://www.elsevier.com/locate/trac
any of the waters. On comparing the recoveries obtainedfrom surface water located downstream from theWWTP, matrix effects seemed to be minimal with thetwo cleaner water types. In a later work [32], Cha et al.performed similar recovery investigations, but, surpris-ingly, they did not refer to their previous paper despitedifferences in terms of not using NaCl and NaOH. Theyspiked 120 mL of pristine water, known to contain noresiduals of antibiotics, at three levels (i.e. 0.01 lg/L,0.5 lg/L and 2.0 lg/L). Absolute recoveries for this stepwere evaluated in the same way as depicted in Fig. 3 andthe average recoveries were 115 ± 12%, 100 ± 7% and105 ± 3%, for monensin A, salinomycin A and narasinA, respectively. From this, it seems as if both methodol-ogies quantitatively extracted all analytes and the con-clusion to be drawn is that probably the intense washingand heating procedure of glassware as well as addition ofNaCl and NaOH, as mentioned in the first paper [29],

Trends in Analytical Chemistry, Vol. 28, No. 5, 2009 Trends
were not too critical. It is noteworthy that basically thesame methodology was used in a later study from thesame research group [30]. In this work, recoveries pre-sented for monensin A in water were identical to thosepublished previously, but in a slightly different concen-tration range [32].
Oasis HLB cartridges have also been utilized by Songet al. [34] for extracting monensin A, applying 30-mLsample mixed with 3-mL MeOH. The reason for addingMeOH was unclear, but it might reduce the amount ofmatrix components trapped on the solid-phase material.Recovery of this methodology using external calibrationcurves was reported to be 92 ± 17%. The Oasis HLBcartridge was compared to both a strong cation-ex-change cartridge (MCX) and a weak cation-exchangecartridge (WCX), but the latter two were not foundacceptable [34].
Watanabe et al. also used Oasis HLB (60 mg) fordetermination of monensin A in groundwater and cen-trifuged lagoon water [35]. They found recoveries of105 ± 7% and 100 ± 7%, respectively, at a spiked con-centration of 0.1 lg/L. However, it was not clear howthese recovery studies were performed.
Monensin A and lasalocid A were included in twomulti-residue methods using HLB by Hao et al. [31,51].Evidently, this methodology was not designed explicitlyfor ionophores. Recoveries for monensin A and lasalocidA in quality-control (QC) samples with their optimizedmethod were 190% and 122%, respectively, but, just asin their previous study, they did not state how theyestimated these recoveries.
4.1.4. Analytical strategies and recommendations. Theapplied sample sizes and pH are generally acceptable, aslong as pH is in the range 7–9. To date, no one hasinvestigated potential losses during filtration and there isa need to evaluate this step. An organic modifier hasbeen used in only one case (ca. 9% methanol), but theeffects were not investigated well [34]. There is a need tostudy different polar organic modifiers to remove morematrix components while retaining the ionophores onthe solid-phase material leading to improve selectivity.Samples are commonly enriched onto mixed-mode SPEcartridges (HLB) and eluted with methanol. Only onestudy tested ion-exchange cartridges and retrieved verylow recoveries. Even so, it could be a possible advantageto combine different SPE sorbents (in tandem) to removeimpurities, as previously suggested for other antibacte-rial agents by Jacobsen and co-workers [56]. Additionalclean up by silica-gel sorbent in very dirty samples couldbe advantageous, as used in some feed-item analyses[57,58].
At present, the spike-recovery approach presented byCha et al. [29] and depicted in Fig. 3 seems to be the bestprocedure to evaluate analyte losses. This type of spike-recovery procedure is highly recommended.
4.2. Manure, soil and sediment4.2.1. Sampling and pre-handling. Storage of both soiland manure samples has been done at 4�C [33,48].Manure samples were homogenized for 5 min and25,000 rpm in an ultra Turrax. The homogenizedsamples (15 g) were placed in centrifuge glass with 5 gurea followed by buffering to pH 8 by phosphate bufferprior to extraction [33]. Carlson and Mabury added1.2 mL of 1 M ammonium citrate buffer with ammo-nium hydroxide (pH 5.8) to 1 g of soil prior to extraction[50]. There is no discussion in any of these papers whythese procedures are performed, but it is well known thaturea has a denaturing effect on proteins [59]. Collectedsediment samples were air dried in darkness to preventphoto-degradation [32]. Thereafter, they were sievedthrough 2-mm and 75-lm sieves. The pH of the sedi-ments was 6.5–7.4. Only the fraction below 75 lm wasused, since the authors assumed that most of the ana-lytes were sorbed to the silt/clay fraction [60]. However,there are no specific investigations for ionophores sup-porting this idea. One study showed a tendency ofmonensin A and lasalocid A to have stronger sorption tosoils with higher clay content [44]. However, it could bevaluable to evaluate the distribution of these compoundsto different fractions of solids to find out possible mech-anisms for sorption.
4.2.2. Extraction. Schlusener et al. [33,47] extractedsalinomycin A together with a number of other antibi-otics from 15 g buffered liquid manure (pH 8.0) byliquid-liquid extraction (LLE, 2 · 40 mL ethyl acetate(EtOAc)) and (E)-9-[O-(2-methyloxime)]-erythromycinwas added as surrogate internal standard (IS) prior tothe extraction. No data was presented regarding meth-odological optimization and no previous work was citedto show how the method had been developed. Fig. 4shows their recovery procedure. With this set-up, anabsolute recovery can be found for the entire LLE-SPEprocedure, even though the loss from each individualstep is unknown. The recovery of the entire procedurewas 119 ± 26% for salinomycin A.
Pressurized liquid extraction (PLE) has been appliedto extract salinomycin A from a typical German sandy-loam soil together with a number of other antibioticsin both a method-development study [48] and in anaerobic 120-day degradation experiment [49]. In bothstudies, about 30 g of soil was loaded in 33-mL cells,with Ottawa sand to decrease void volume and withcellulose filters at each end. This type of packing of soilwithout mixing with the support material mighthamper the extraction since support material acts byallowing a greater exposure surface and hence a betterdiffusion of solvent into the matrix pores. The impor-tance of the type of support material and the ratio ofsupport material to sample size was previously dem-
http://www.elsevier.com/locate/trac 529

Trends Trends in Analytical Chemistry, Vol. 28, No. 5, 2009
onstrated for compounds in soil, sewage sludge andeggs [61,62]. Operational PLE parameters were inves-tigated in the first study by spiking 10 g of soil [48]. AsIS, (E)-9-[O-(2-methyloxime)]-erythromycin was addedto the extract. Three independent extractions wereperformed using acetone, MeCN and MeOH, the latterwith and without 1% aqueous ammonia at tempera-tures of 40–120�C at 10�C increments. Significantlevels of analytes were found in the second extract butnot the third.
Optimal PLE conditions found by Schlusener wereMeOH with 1% aqueous ammonia, 80�C at 140 bar for10 min in 2 cycles with 70% flush volume and 180 s ofpurge, and these conditions were later used in aerobic120-day degradation experiments [49]. During methoddevelopment, no absolute recoveries were determinedbut, instead, a relative area ratio of analyte divided by ISadded to PLE extract (Fig. 4). Absolute recoveries couldhave been determined by spiking the same analytes tothe 10-g soil extracts from exactly the same soil prior toSPE. With this set-up, the efficiency of the PLE stepduring method development could not be estimated.
Carlson and Mabury used ammonium-citrate bufferwith ammonium hydroxide (pH 5.8) and ethyl acetate intwo LLE steps to extract monensin A from soil samples,but without any further clean up. At optimal conditions,the recovery was found to be 75% for spiked samples[50].
Kim and Carlson extracted monensin A, salinomycinA and narasin A from 1.000-g sediment by shakingsamples twice at 400 rpm for 20 min and centrifugingthe extract at 4000 rpm [32]. Extraction was performedin Teflon tubes with 40 mL ammonium-hydroxide buffer(pH 10) and samples were filtered (0.2 lm) prior to SPEclean up. No optimization of the methodology was pre-sented and they did not cite any previous work demon-strating the suitability of the method applied. Theyspiked sediments (which were known not to containresiduals of antibiotics) at three levels (i.e. 1 lg/kg,30 lg/kg and 90 lg/kg). The detector response mea-sured for these spiked samples was compared with thatof the samples spiked with suitable concentrations afterextraction. This meant that absolute recoveries could beestimated. However, these recoveries also included theSPE step, but, since this step was probably quantitative,as seen from the SPE discussion above, the sedimentrecoveries mainly reflected analytes recovered in theshaking step [32]. For monensin A, the recoveries were71%, 71% and 105%, while, for salinomycin A, theywere 98%, 74% and 72%. Narasin A showed the lowestrecoveries and was recovered to 57%, 52% and 51% atthe concentration levels mentioned above, respectively.It is also uncertain why Kim and Carlson chose a pure-water buffer as solvent, since it is known that theseanalytes tend to become lipophilic at basic pH whencomplexing with cations.
530 http://www.elsevier.com/locate/trac
Furthermore, in 2003 [48], Schlusener had alreadysuggested MeOH with 1% aqueous ammonia at 80�C, soit is very likely that the methodology presented by Kimand Carlson [32] is not exhaustive enough to be used fornative samples. It should be noted that basically thesame method was utilized in a later study from the sameresearch group [30], presenting recoveries for monensinA in sediments identical to those published previously[32]. The reader should be aware that all the presentedmethodologies are capable of extracting freshly spikedanalytes, but there is no information available as towhether these extraction procedures can release agedanalytes from sediments that have hardened.
4.2.3. Clean up. In two salinomycin A studies, Schlus-ener et al. [48,49] cleaned up PLE extracts from soilusing Diol SPE cartridges. In detail, PLE extracts (10 mLMeOH with 1% aqueous ammonia) were passed throughthe SPE cartridge and eluted with 4 mL of MeCN:0.1Mammonium acetate (3:2). They did not present recov-eries or evaluate the SPE step, so it is not known if anylosses occurred in this step. Surrogate IS (E)-9-[O-(2-methyloxime)]-erythromycin added prior to SPE mighthave compensated for some losses, but only if it behavedin a similar manner to salinomycin A, which was notdemonstrated.
A similar clean-up procedure was applied to manureusing Diol cartridges [33,47]. Kim and Carlson cleanedsample extracts from shaking of sediment, by using HLBSPE cartridges, applying the same methodology as de-scribed above for water [32].
4.2.4. Analytical strategies and recommendations. PLEshould be the choice of analytical strategy when ana-lyzing hard incorporated ionophores in matrices withsolid material (i.e. soil, manure and sediment). Cur-rently, only one method has used PLE to determine sal-inomycin A in soil [48], but it was not completelyevaluated (Fig. 4).
We expect that analytical methods for solids applyingPLE will increase and optional in-line clean up could beadvantageous [63].
The PLE step needs to be evaluated as a sole recoverytechnique to obtain proper optimization of PLE param-eters.
Furthermore, use of urea in liquid-manure samplesmight be suitable to denature proteins [33].
Instead of LLE, there is a need to study lyophilization ofthe liquid manure and sediment samples to extract theionophores with PLE. The lyophilization should bestopped at a low water content (ca. 1–5%), because, ifthe matrix is completely dried, the ionophores might bebound even more tightly. Tightly-bound residues presenta perpetual problem, which could probably be clarifiedby incorporating certified reference materials, which arenot yet available for most pharmaceuticals.

Trends in Analytical Chemistry, Vol. 28, No. 5, 2009 Trends
5. LC-MS2 methods
Generally, HPLC separation of ionophores is done on aC18 column with acidified (formic acid or heptafluo-robutyric acid) or buffered (ammonium acetate) water,methanol and/or acetonitrile as mobile phase (Tables 3and 4).
Cha et al. [29] nicely described separation of fourdifferent ionophores (monensin A, monensin B, salino-mycin A and narasin A) and simatone in less than6 min.
In two different studies a year later [30,32], the sametype of column was used but with a very different elutionscheme. This method went from 50% organic phase to90% in the first minute and thereafter ran isocraticallyfor 19 min. The reason for using such a steep gradientfor only 1 min and then running isocratically remainsunclear and seems much less sophisticated and tedious.
Some studies used simatone as IS [29,30,32,35],others used salinomycin A as IS for monensin A [50], or(E)-9-[O-(2-methyloxime)]-erythromycin for salinomy-cin A [33,47–49], and some did not use IS techniques
Figure 4. Experimental set-up for method validation for analysis ofsalinomycin A in soil and manure using pressurized liquid extrac-tion (PLE) and liquid-liquid extraction (LLE), respectively, followedby clean up by solid-phase extraction (SPE) [33,48]. Spiked levelsof salinomycin A given in parenthesises.
[31,34,51]. (E)-9-[O-(2-methyloxime)]-erythromycineluted much earlier than salinomycin A from the HPLCcolumn [33,47–49], so this IS does not possess similarlipophilicity to salinomycin A and might not be subjectedto the same amount of ion suppression, and that couldexplain why it is not the best choice.
Simatone was used as IS in four studies [29,30,32,35]and was added after SPE prior to evaporation. Usage ofsimatone is rather odd, considering that its chemicalstructure is very different from the ionophores with amuch smaller molecular weight. It cannot therefore beassumed to behave in a manner similar to that of theanalytes. In addition, simatone was acquired in selected-ion monitoring (SIM) mode with a single ion ([M+H]+),so it has an unacceptably low selectivity for complexmatrices. Furthermore, simatone is eluted from the HPLCcolumn within the first minute, so it is heavily subject toion suppression.
Generally, electrospray ionization (ESI) is the ioniza-tion technique of choice when analyzing ionophores[29,30,32,34,51]. Schlusener et al. applied atmosphericpressure chemical ionization (APCI) with a modifiedinterface and an unreported, or not used, CI gas [33,47–49].
Cha et al. nicely revealed fragmentation mass spectraof pseudo-molecular ions (e.g., sodium adducts formonensin A, monensin B, salinomycin A and narasin A)obtained on a ion trap with ESI+ [29]. They selected 4–8fragments to monitor in selected reaction monitoring(SRM) mode to achieve high selectivity and sensitivity.
The same type of equipment and experimental set-upwas used by Kim and Carlson [32]. Likewise, Song andco-workers optimized MS2 parameters for monensin A byinfusing standard solutions of each analyte [34].Characteristic full-scan mass spectra and product-ionspectra were collected for each compound to identify themost abundant precursor and product ions for quantifi-cation. Monensin A, salinomycin A and narasin A nicelyform pseudo-molecular (precursor) ions as sodium ad-ducts [M+Na]+ and fragments where one or two watermolecules are lost and with increased collision energyloss of ether rings (e.g., m/z 479 for monensin A loss oftwo rings).
So far, no MS methods have been optimized to scan forionophores in negative mode, despite their carboxylicacid, probably due to the molecule�s ability to encirclealkali cations. The tendency is therefore to have acidicpH in the mobile phase to keep the ionophores proton-ated and to avoid the MS-incompatible neutral complex.
The only ionophore analyzed in negative mode islasalocid A, due to its lower pKa value [31].
Schlusener et al. used APCI+ for salinomycin A with aprecursor of m/z 768 (i.e. an ammonia adduct as thepseudo-molecular ion) [33].
In another study, Schlusener et al. found threetransformation products of salinomycin A in 192-day-
http://www.elsevier.com/locate/trac 531

Trends Trends in Analytical Chemistry, Vol. 28, No. 5, 2009
old manure extracts by means of high-resolution (time-of-flight) MS equipped with ESI+ [47].
One study by Carlson and Mabury [50] used ESI+ forsalinomycin A with a precursor ion (m/z 796) otherthan the usual sodium adduct (m/z 773). No composi-tion of this precursor ion (m/z 796) was given. However,the composition might be an adduct formed by formicacid and a proton, yielding m/z 796. This adduct isprobably in much lower abundance than the sodiumadduct, and that might explain the observed high vari-ability for salinomycin A.
Determination (qualification and quantification) andquality assurance (QA) are very crucial parts of theanalysis. To avoid false positives in MS, we recommend awell-recognized evaluation system used by the EuropeanCommission [64]. As a result, we suggest that, whenapplying LC-MS2 (low resolution) in SRM mode, a min-imum of two SRM ion transitions per compound shouldbe acquired [64,65].
All MS methods in this review use LC coupled to triple-stage quadrupoles (QqQ) or linear or three-dimensionalion traps (2D IT or 3D IT) in SRM mode for detection(Tables 3 and 4). For quantification of ionophores (orknown compounds in general), QqQ is preferable over ITwith respect to sensitivity, limits of quantification andlinear dynamic range. Several of these papers acquireonly a single SRM ion transition for each compound, sothey do not meet the criteria. Likewise, transition frag-ments should be verified by a reasonable structuralargumentation.
Concentrations of sodium, potassium, ammonia, andother ions generating adducts may vary within and be-tween sample matrices [65], so the formation of iono-phore adducts might be matrix dependent andquantification can suffer. As a result, a proper quantifi-cation technique must be applied and suitable surrogateISs should be selected. A good, well-accepted IS in feed-stuff analysis is ionophore nigericin [57,58], which wehighly recommend in environmental analysis. In addi-tion, this IS can compensate for variations in precisionand accuracy caused by matrix effects. Evaluating theionization techniques (APCI and ESI) might eliminate(some) ion suppression, as proposed by others [65].
6. Conclusions
To measure the environmental occurrence of emerginganticoccidial agents, we need to develop reliable ana-lytical methodologies. So far, a few analytical methods –unfortunately not always fully validated – have beendeveloped to determine ionophores in manure, soil,water and sediments with HPLC coupled to ESI or APCIMS detection. The data generated must be supported byan appropriate QA/QC system, which has not alwaysbeen described.
532 http://www.elsevier.com/locate/trac
There exists good agreement in sample preparation todetermine ionophores in water matrices [viz by mixed-mode SPE (HLB)]. By contrast, we have seen no commonsample-preparation strategy for solid matrices, but wemay expect that sample-preparation methods, includingPLE, will increase.
No environmental analysis has been done on thesynthetic anticoccidials. As a consequence, there is anurgent need to develop robust, sensitive analyticalmethods to monitor all anticoccidials in all possibleenvironmental compartments. Environmental concen-trations of ionophores measured to date have followed alogical, realistic pattern: lg/kg in manure; ng/L in water;and, lg/kg in sediments. Consequently, this patterncould reflect possible build up in various lipophiliccompartments. There is therefore a need to study bio-availability and desorption processes of ionophoresbound in soil and sediment compartments. Moreover,knowledge of environmental transformation of anticoc-cidials and eco-toxicological effects of transformationproducts is also limited and might be of concern, sofurther research is needed.
AcknowledgementsThis research was supported by the Drug ResearchAcademy (Faculty of Pharmaceutical Sciences, Univer-sity of Copenhagen, Denmark).
References[1] K. Fent, A.A. Weston, D. Caminada, Aquat. Toxicol. 76 (2006)
122.
[2] B. Halling-Sorensen, S.N. Nielsen, P.F. Lanzky, F. Ingerslev, H.C.H.
Lutzhoft, S.E. Jorgensen, Chemosphere 36 (1998) 357.
[3] M.D. Hernando, M. Mezcua, A.R. Fernandez-Alba, D. Barcelo,
Talanta 69 (2006) 334.
[4] S.E. Jorgensen, B. Halling-Sorensen, Chemosphere 40 (2000) 691.
[5] M.L. Bailon-Perez, A.M. Garcia-Campana, C. Cruces-Blanco, M.D.
Iruela, J. Chromatogr., A 1185 (2008) 273.
[6] J.M. Cha, S. Yang, K.H. Carlson, J. Chromatogr., A 1115 (2006)
46.
[7] S. Abuin, R. Codony, R. Compano, M. Granados, M.D. Prat, J.
Chromatogr., A 1114 (2006) 73.
[8] S. Yang, K.H. Carlson, J. Chromatogr., A 1038 (2004) 141.
[9] M.S. Diaz-Cruz, M.J.L. de Alda, D. Barcelo, J. Chromatogr., A 1130
(2006) 72.
[10] B. Suarez, B. Santos, B.M. Simonet, S. Cardenas, M. Valcarcel, J.
Chromatogr., A 1175 (2007) 127.
[11] V. Andreu, C. Blasco, Y. Pico, Trends Anal. Chem. 26 (2007) 534.
[12] US Food and Drug Administration, Electronic Code of Federal
Regulations, Title 21 - Food and Drugs, part 558: New animal
drugs for use in animal feeds, US FDA, Rockville, MD, USA, 2008.
[13] European Food Safety Authority, Panel on additives and products
or substances used in animal feed, 2008 (http://www.efsa.
europa.eu/EFSA/ScientificPanels/efsa_locale-1178620753812_
FEEDAP.htm).
[14] M. Hansen, K.A. Krogh, A. Brandt, J.H. Christensen, B. Halling-
Sorensen, Environ. Pollut. 157 (2009) 474.
[15] C.T. Elliott, D.G. Kennedy, W.J. McCaughey, Analyst (Cambridge,
U.K.) 123 (1998) 45R.

Trends in Analytical Chemistry, Vol. 28, No. 5, 2009 Trends
[16] V.F. Samanidou, E.N. Evaggelopoulou, J. Sep. Sci. 31 (2008)
2091.
[17] European Commission, Community Register of Feed Additives
pursuant to Regulation (EC) No 1831/2003, List of Addi-
tives (http://ec.europa.eu/food/food/animalnutrition/feedadditives/
registeradditives_en.htm, 2008).
[18] European Union, Off. J. Eur. Comm. L 268 (2003) 29.
[19] Institute of Food Technologists, Compr. Rev. Food Sci. Food Safety
5 (2006) 71.
[20] European Commission, Off. J. Eur. Comm. L 198 (1991) 1.
[21] European Commission, Off. J. Eur. Comm. L 31 (2003) 3.
[22] US Food and Drug Administration, Electronic Code of Federal
Regulations, Title 7 - Agriculture, part 205: National organic
program, US FDA, Rockville, MD, USA, 2008.
[23] A.B.A. Boxall, D.W. Kolpin, B. Halling-Sorensen, J. Tolls, Environ.
Sci. Technol. 37 (2003) 286A.
[24] M. Mellon, C. Benbrook, K.L. Benbrook, Hogging It–Estimates of
Antimicrobial Abuse in Livestock, Union of Concerned Scientists,
Cambridge, MA, USA, 2001.
[25] Danish Veterinary and Food Administration, Danish Medicines
Agency, Danish Institute for Food and Veterinary Research,
DANMAP 2004 - Use of antimicrobial agents and occurrence of
antimicrobial resistance in bacteria from food animals, foods and
humans in Denmark, Statens Serum Institut, Copenhagen,
Denmark, 2004.
[26] NORM/NORM-VET 2006, Usage of Antimicrobial Agents and
Occurrence of Antimicrobial Resistance in Norway, Tromsø /
Oslo, Norway, 2007.
[27] B. Bengtsson, C. Greko, U.G. Andersson, SVARM 2007: Swedish
Veterinary Antimicrobial Resistance Monitoring, The National
Veterinary Institute (SVA), Uppsala, Sweden, 2008.
[28] Y. Kim, J. Jung, M. Kim, J. Park, A.B.A. Boxall, K. Choi, Environ.
Toxicol. Pharmacol. 26 (2008) 167.
[29] J.M. Cha, S. Yang, K.H. Carlson, J. Chromatogr., A 1065 (2005)
187.
[30] J.G. Davis, C.C. Truman, S.C. Kim, J.C. Ascough, K. Carlson, J.
Environ. Qual. 35 (2006) 2250.
[31] C.Y. Hao, X.M. Zhao, S. Tabe, P. Yang, Environ. Sci. Technol. 42
(2008) 4068.
[32] S.C. Kim, K. Carlson, Water Res. 40 (2006) 2549.
[33] M.P. Schlusener, K. Bester, M. Spiteller, Anal. Bioanal. Chem. 375
(2003) 942.
[34] W. Song, M. Huang, W. Rumbeiha, H. Li, Rapid Commun. Mass
Spectrom. 21 (2007) 1944.
[35] N. Watanabe, T.H. Harter, B.A. Bergamaschi, J. Environ. Qual. 37
(2008) S-78.
[36] European Food Safety Authority, EFSA J. 77 (2004) 1.
[37] A.A.M. Stolker, U.A.T. Brinkman, J. Chromatogr., A 1067 (2005)
15.
[38] D.E. Kiehl, R.K. Julian, A.S. Kennington, Rapid Commun. Mass
Spectrom. 12 (1998) 903.
[39] D.K. Matabudul, B. Conway, I. Lumley, S. Sumar, Food Chem. 75
(2001) 345.
[40] E. Mercurio, M. Pellegrini, D.F. Mierke, Biopolymers 42 (1997) 759.
[41] H.H. Mollenhauer, D.J. Morre, L.D. Rowe, Biochim. Biophys. Acta
1031 (1990) 225.
[42] B.C. Pressman, Annu. Rev. Biochem. 45 (1976) 501.
[43] U.S. Food and Drug Administration, Environmental Assessments,
2008 (http://www.fda.gov/cvm/FOI/ea_nada.htm).
[44] S.A. Sassman, L.S. Lee, Environ. Toxicol. Chem. 26 (2007) 1614.
[45] R.P. Schwarzenbach, P.M. Gschwend, D.M. Imboden, Environ-
mental Organic Chemistry, 2nd edition., Hoboken, NJ, USA, 2003
p. 1313.
[46] European Food Safety Authority, EFSA J. 42 (2004) 1.
[47] M.P. Schlusener, M.A. von Arb, K. Bester, Arch. Environ. Contam.
Toxicol. 51 (2006) 21.
[48] M.P. Schlusener, M. Spiteller, K. Bester, J. Chromatogr., A 1003
(2003) 21.
[49] M.P. Schlusener, K. Bester, Environ. Pollut. 143 (2006) 565.
[50] J.C. Carlson, S.A. Mabury, Environ. Toxicol. Chem. 25 (2006) 1.
[51] C. Hao, L. Lissemore, B. Nguyen, S. Kleywegt, P. Yang, K.
Solomon, Anal. Bioanal. Chem. 384 (2006) 505.
[52] H. Dolliver, S. Gupta, S. Noll, J. Environ. Qual. 37 (2008) 1245.
[53] H. Dolliver, S. Gupta, J. Environ. Qual. 37 (2008) 1227.
[54] H. Dolliver, K. Kumar, S. Gupta, A. Singh, J. Environ. Qual. 37
(2008) 1220.
[55] H.A. Dolliver, S.C. Gupta, J. Environ. Qual. 37 (2008) 1238.
[56] A.M. Jacobsen, B. Halling-Sorensen, F. Ingerslev, S.H. Hansen, J.
Chromatogr., A 1038 (2004) 157.
[57] M. Dubois, G. Pierret, P. Delahaut, J. Chromatogr., B 813 (2004)
181.
[58] U. Vincent, M. Chedin, S. Yasar, C. von Holst, J. Pharm. Biomed.
Anal. 47 (2008) 750.
[59] L.R. Singh, T.A. Dar, I. Haque, F. Anjum, A.A. Moosavi-
Movahedi, F. Ahmad, Biochim. Biophys. Acta 1774 (2007) 1555.
[60] J. Tolls, Environ. Sci. Technol. 35 (2001) 3397.
[61] E.M. Golet, A. Strehler, A.C. Alder, W. Giger, Anal. Chem. 74
(2002) 5455.
[62] S. Herranz, M.C. Moreno-Bondi, M.D. Marazuela, J. Chromatogr.,
A 1140 (2007) 63.
[63] E. Bjorklund, S. Sporring, K. Wiberg, P. Haglund, C. von Holst,
Trends Anal. Chem. 25 (2006) 318.
[64] European Commission, Off. J. Euro. Comm. L 221 (2002) 8.
[65] K. Bester, Anal. Bioanal. Chem. 391 (2008) 15.
http://www.elsevier.com/locate/trac 533