analytical procedures, new edition as of june 1, 2001
TRANSCRIPT

University of MississippieGrove
Industry Developments and Alerts American Institute of Certified Public Accountants(AICPA) Historical Collection
2001
Analytical procedures, new edition as of June 1,2001; Audit and accounting guide:American Institute of Certified Public Accountants. Analytical Procedures Audit Guide Revision TaskForce
Follow this and additional works at: https://egrove.olemiss.edu/aicpa_indev
Part of the Accounting Commons, and the Taxation Commons
This Article is brought to you for free and open access by the American Institute of Certified Public Accountants (AICPA) Historical Collection ateGrove. It has been accepted for inclusion in Industry Developments and Alerts by an authorized administrator of eGrove. For more information,please contact [email protected].
Recommended CitationAmerican Institute of Certified Public Accountants. Analytical Procedures Audit Guide Revision Task Force, "Analytical procedures,new edition as of June 1, 2001; Audit and accounting guide:" (2001). Industry Developments and Alerts. 583.https://egrove.olemiss.edu/aicpa_indev/583

AICPA Audit Guide
A nalytical
Procedures
New Editionas of June 1, 2001

AICPA Audit Guide
A nalytical
Procedures
New Edition as of June 1, 2001

Copyright © 2001 byAmerican Institute of Certified Public Accountants, Inc.,New York, NY 10036-8775All rights reserved. For information about permission to copy any part of this work for redistribution or for inclusion in another document or manuscript, please call the AICPA Copyright Permissions Hotline a t (201) 938-3245. A Permissions Request Form for e-mailing requests is available at www.aicpa.org by clicking on the copyright notice on any page. Otherwise, requests should be written and mailed to Permissions Department, AICPA, Harborside Financial Center, 201 Plaza Three, Jersey City, NJ 07311-3881.1 2 3 4 5 6 7 8 9 0 AAP 0 9 8 7 6 5 4 3 2 1ISBN 0-87051-363-X
iii
NOTICE TO READERSThis Audit Guide has been prepared by the AICPA Analytical Procedures Audit Guide Revision Task Force to assist auditors in designing and performing analytical procedures in a financial statement audit conducted in accordance with generally accepted auditing standards. The AICPA Auditing Standards Board has found the descriptions of auditing standards, procedures, and practices in this Audit Guide to be consistent with existing standards covered by Rule 202 of the AICPA Code of Professional Conduct.Descriptions of auditing standards, procedures, and practices in Audit Guides are not as authoritative as pronouncements of the Auditing Standards Board, but AICPA members should be aware that they may have to justify a departure from such descriptions if the quality of their work is questioned.
Analytical Procedures Audit Guide Revision Task Force (2000-2001)
James S. Gerson, Chair Auditing Standards Board
Charles E. Landes O. Ray Whittington
Analytical Procedures Working Group (1996-1998)George Patterson, Chair Edward Blocher John A. Fogarty
Stephen D. Holton Linda S. McDaniel
The task forces also appreciate the staff support previously provided by Kim Gibson.
Preface
V
In 1988, the Auditing Standards Board (ASB) issued Statement on Auditing Standards (SAS) No. 56, Analytical Procedures (AICPA, Professional Standards, vol. 1, AU sec. 329). This Audit Guide has been prepared to provide practical guidance to auditors on the effective use of analytical procedures. Specifically, this Audit Guide includes a discussion of SAS No. 56; concepts and definitions; a series of questions and answers; and a case study illustrating trend analysis, ratio analysis, reasonableness testing, and regression analysis.
This Audit Guide also includes illustrations that demonstrate the importance of forming expectations and considering the precision of the expectation, two of the most misunderstood concepts from SAS No. 56. The concepts discussed are applicable for all three stages of the audit (planning, substantive testing, and review). However, this Audit Guide focuses principally on how the concepts are applied to substantive testing because in designing substantive procedures, auditors ordinarily desire a specified level of audit assurance.
Appreciation is expressed to members of the Audit Issue Task Force, and in particular Ray Whittington, for their efforts in reviewing and revising this Audit Guide.
AAG-ANP

Table of Contents v ii
TABLE OF CONTENTSChapter Paragraph
1 The Use of Analytical Procedures .01-.46Concepts and Definitions.................................................................. .03-.11
Analytical Procedures.............................................................. .03-.07Expectations..................................................................... .08Precision........................................................................... ....... .09-.10Level of Assurance............................................................. .11
Analytical Procedure Process: Four Phases........................................ .12-.46Expectation Formation (Phase I)................................................ .14-.38Identification and Investigation (Phases II and III)....................... .39-.44Evaluation (Phase IV)...................................................................45-.46
2 Questions and Answers .01-.39Precision of the Expectation.............................................................. .02-.15Relationship of Analytical Procedures to the Audit
Risk Model........................................................................... ....... ..16-.21Evaluation and Investigation.............................................................. .22-.26Purpose of Analytical Procedures...................................................... .27-.37Fraud......................................................................................... ....... .38-.39
3 Case Study: On the Go Stores .01 -.75Background Information.................................................................... .03-.10
Nature of the Account or Assertion.......................................... .08-.10Example 1: Trend Analysis................................................................ .11 -.25
Expectation Formation (Phase I)................................................ .12-.19Planning Phase: Identification, Investigation, and
Evaluation (Phases II through IV).............................................20-.22Substantive Testing: Identification, Investigation, and
Evaluation (Phases II through IV)................................... .23-.25Example 2: Ratio Analysis................................................................ .26-.35
Expectation Formation (Phase I)......................................... .27-.31Identification, Investigation, and Evaluation
(Phases II to IV).......................................................................32-.35Example 3: Reasonableness Test........................................................ .36-.48
Expectation Formation (Phase I)........................................ ....... .37-.40Nature of the Account or Assertion............................ .38Characteristics of the Data.................................................39-.40
Inherent Precision of the Type of Expectation.................... .41 -.44Identification, Investigation, and Evaluation
(Phases II to IV).................................................................... .45-.48
Contents

viii Table of Contents
Chapter Paragraph
3 Case Study: On the Go Stores—continued
Example 4: Regression Analysis......................................................... 49-.69Cross-Sectional Regression......................................................... 52-.58Independent Variables............................................................... 53-.58Expectation Formation (Phase I)................................................. 59-.66Identification, Investigation, and Evaluation
(Phases II to IV)..................................................................... 67-.69Use of Regression in Review Engagements................................... .70
Regression and Fraud Detection......................................................... 71-.73Reasonableness Testing by Store......................................................... 74-.75
Appendix: Measures of Precision for a Regression Analysis
Contents

The Use of Analytical Procedures 1
Chapter 1
The Use of Analytical Procedures1.01 This chapter discusses the concepts and definitions found in State
ment on Auditing Standards (SAS) No. 56, Analytical Procedures (AICPA, Professional Standards, vol. 1, AU sec. 329). Also discussed are the four phases of the analytical procedure process: expectation formation, identification, investigation, and evaluation.
1.02 Analytical procedures are a natural extension of the auditor’s understanding of the client’s business, and add to his or her understanding because the key factors that influence the client’s business may be expected to affect the client’s financial information. Analytical procedures are used in all three stages of the audit. In the planning stage, the purpose of analytical procedures is to assist in planning the nature, timing, and extent of auditing procedures that will be used to obtain evidential m atter for specific account balances or classes of transactions.1 In the substantive testing stage of the audit, the purpose of analytical procedures is to obtain evidence, sometimes in combination with other substantive procedures, to identify misstatements in account balances and thus to reduce the risk that misstatements will remain undetected.2 In the overall review stage, the objective of analytical procedures is to assist the auditor in assessing the conclusions reached and in evaluating the overall financial statement presentation.
Concepts and Definitions
Analytical Procedures
1.03 Analytical procedures are defined by SAS No. 56 (AU sec. 329.02) as “evaluations of financial information made by a study of plausible relationships among both financial and nonfinancial d a ta .. . . A basic premise underlying the application of analytical procedures is that plausible relationships among data may reasonably be expected to exist and continue in the absence of conditions to the contrary.” The definition implies several key concepts.
• The “evaluations of financial information” suggests that analytical procedures will be used to understand or test financial statement relationships or balances.
• The “study of plausible relationships” implies an understanding of what can reasonably be expected and involves a comparison of the recorded book values with an auditor’s expectations.
1 Analytical procedures in the planning stage of the audit may also be useful in understanding the client’s business. In understanding the business, auditors can use the results from analytical procedures to assess auditors’ business risk (refer to Statement on Auditing Standards (SAS) No. 47, Audit Risk and Materiality in Conducting an Audit [AICPA, Professional Standards, vol. 1, AU sec. 312]).
2 The auditors’ use of substantive tests to achieve an audit objective related to a particular assertion may be supported by test of details, analytical procedures, or a combination. The decision about which tests to use to reduce the risk that a material misstatement will not be detected is based on the auditor’s judgment about the expected effectiveness and efficiency of the available procedures (cost/benefit).
AAG-ANP 1.03

2 Analytical Procedures
• “Relationships among both financial and nonfinancial data” suggests th a t both types of data can be useful in understanding the relationships of the financial information and, therefore, in forming an expectation.
1.04 SAS No. 56 requires that analytical procedures be used in audit planning and in the overall review stage of the audit. Analytical procedures also are used as substantive tests to identify, at a specified level of assurance, potential material misstatements. In all cases, the effectiveness of analytical procedures lies in developing expectations that can reasonably be expected to identify unexpected relationships.
1.05 Analytical procedures performed in the planning stage are used to identify unusual changes in the financial statements, or the absence of expected changes, and specific risks. During the planning stage, analytical procedures are usually focused on account balances aggregated a t the financial statement level and relationships between account balances.
1.06 Analytical procedures performed during the overall review stage are designed to assist the auditor in assessing that (a) all significant fluctuations and other unusual items have been adequately explained and (b) the overall financial statement presentation makes sense based on the audit results and the auditor’s knowledge of the business.
1.07 During the substantive testing stage, analytical procedures are performed to obtain assurance that material misstatements are not likely to exist in financial statement account balances. To do this, the auditor focuses his or her analytical procedures on particular assertions about account balances and gives detailed attention to the underlying factors that affect those account balances through the development of an expectation independent of the recorded balance. Therefore, substantive analytical procedures generally are performed with more rigor and precision than those used for planning or overall review.
Expectations1.08 Expectations are the auditor’s predictions of recorded accounts or
ratios. In performing analytical procedures, the auditor develops the expectation in such a way that a significant difference between it and the recorded amount is indicative of a misstatement, unless he or she can obtain and corroborate explanations for the difference (for example, an unusual event occurred). Expectations are developed by identifying plausible relationships (for example, store square footage and retail sales) that are reasonably expected to exist based on the auditor’s understanding of the client and of the industry in which the client operates. The auditor selects from a variety of data sources to form expectations. For example, the auditor may use prior-period information (adjusted for expected changes), management’s budgets or forecasts, industry data, or nonfinancial data. The source of information determines, in part, the precision with which the auditor predicts an account balance and, therefore, is important to consider in developing an expectation to achieve the desired level of assurance from the analytical procedure. The desired precision of the expectation varies according to the stage of the audit or the purpose of the analytical procedure. For example, precision is more important for analytical procedures used as substantive tests than for those used in planning. The effectiveness of analytical procedures depends on their precision and purpose.
AAG-ANP 1.04

The Use of Analytical Procedures 3
Precision
1.09 Precision is a measure of the closeness of the auditor’s expectation to the correct amount. Factors that affect the precision of analytical procedures include—
• The type of expectation developed.• The reliability and other characteristics of the data used in forming
the expectation (both internally and externally prepared data).• The nature of the account or the assertion.1.10 For example, an auditor wishes to test interest income. Because the
nature of the account is relatively objective (interest income can easily be predicted), analytical procedures could be designed to serve as an effective substantive test. If the auditor needs a high level of assurance from a procedure, he or she develops a relatively precise expectation by selecting the appropriate type of expectation (for example, a reasonableness test instead of a simple trend analysis), the level of detail of the data (for example, quarterly versus annual data), and the reliability of the source of the data (for example, data that have been subject to auditing procedures versus data that have not been subject to auditing procedures). In the case of substantive tests, the precision of the expectation is the primary determinant of the level of assurance obtained from the analytical procedure. It affects the ability of the auditor to identify correctly whether a given unexpected difference in an account balance is the result of a misstatement. Because precision is directly related to the level of assurance obtained, it is an important consideration in determining whether the planned level of assurance required from the analytical procedure is achieved. In addition, the higher the desired levels of assurance, the more precise the expectation.
Level of Assurance1.11 Level of assurance is the complement of the level of detection risk
and is the degree to which substantive auditing procedures (including analytical procedures) provide evidence in testing an assertion. The level of assurance is dependent on the restriction of detection risk because inherent and control risk exist independently of an audit of financial statements. Detection risk relates to the auditor’s procedures and can be changed a t his or her discretion. The desired or planned level of assurance is that level needed to achieve an acceptable level of detection risk. It is determined by the acceptable level of audit risk, the assessed levels of inherent and control risk, and the planning materiality threshold. The achieved level of assurance is the degree to which the auditing procedure actually reduces audit risk and is a function of the effectiveness of the substantive procedures.
Analytical Procedure Process: Four Phases1.12 The use of analytical procedures can be considered a process that
consists of four phases. The first phase is the expectation-formation process. In this phase, the auditor forms an expectation of an account balance or financial relationship. In doing so, the auditor determines the precision of the expectation and thus, in part, the effectiveness of the analytical procedure.
1.13 The remaining three phases consist of the identification, investigation, and evaluation of the difference between the auditor’s expected value and
AAG-ANP 1.13

4 Analytical Procedures
the recorded book value in light of the auditor’s materiality assessment. In the second phase, identification, the auditor identifies whether an unusual fluctuation exists between the expected and recorded amounts. In the third, investigation, the auditor investigates the cause of unexpected differences by considering possible causes and searching for information to identify the most probable causes. Finally, in the evaluation phase, the auditor evaluates the likelihood of material misstatement and determines the nature and extent of any additional auditing procedures that may be required.
Expectation Formation (Phase I)1.14 Forming an expectation is the most important phase of the analyti
cal procedure process. The more precise the expectation (that is, the closer the auditor’s expectation is to the correct balance or relationship), the more effective the procedure will be a t identifying potential misstatements. Also, SAS No. 56 requires the auditor to form an expectation whenever he or she applies analytical procedures.
1.15 The effectiveness of an analytical procedure is a function of three factors related to the precision with which the expectation is developed: (a) the nature of the account or assertion, (b) the reliability and other characteristics of the data, and (c) the inherent precision of the expectation method used. Following is a discussion about each of these factors.
Nature of the Account or Assertion
1.16 Analytical procedures are based on relationships between data (see the appendix), for example, how this year compares with last and how amounts on a balance sheet relate to income and expense items. The more predictable the relationships are, the more precise the expectation will be. The following are factors an auditor considers in predicting the amount of an account:
• The subjective or objective nature of the items in an account balance (for example, whether the account comprises estimates or the accumulation of transactions)
• Product mix• Company profile (for example, the number of stores or the various
locations)• Management’s discretion (for example, estimates)• Stability of the environment• Income statement or balance sheet account1.17 Numerous factors affect the amount of an account balance. In
creasing the number of such factors considered in forming an expectation of the account balance increases the precision of the expectation. Such factors include—
• Significant events.• Accounting changes.• Business and industry factors.• Market and economic factors.• Management incentives.• Initial versus repeat engagement.1.18 Moreover, expectations developed for income statement accounts
tend to be more precise than expectations for balance sheet accounts, because
AAG-ANP 1.14

The Use of Analytical Procedures 5
income statement relationships generally are more predictable. In addition, expectations formed under stable economic conditions (for example, stable interest rates) or stable environmental factors (for example, no regulatory changes) tend to be more precise relative to an unstable economy or environment.
Reliability and Other Characteristics of the Data
1.19 In forming an expectation, an auditor generally considers two broad factors related to the characteristics of the data included in the account: the level of detail on which the auditor is able to base his or her expectation and the reliability of the data.
1.20 In general, the more disaggregated the data, the more precise the expectation. For example, the use of monthly instead of annual data tends to improve the precision of the expectation. Preparing an expectation by store or division is also more precise than an expectation based on consolidated data.
1.21 The more reliable the source of the data, the more precise the expectation. The following are factors related to the reliability of data that the auditor may consider in forming the expectation:
• Strength o f the company's internal control. The stronger the internal control over financial reporting (which includes controls over the accounting system), the more reliable the data generated from the company’s accounting system. An auditor must assess control risk below the maximum if he or she plans to rely on internal controls. This can be achieved by performing tests of controls.
• Outside versus internal data, and degree o f independence. Data from more objective or independent sources are more reliable (for example, third-party generated versus management generated).
• Nonfinancial versus financial data, or data that has been subject to auditing procedures versus data that has not been subject to auditing procedures. The use of reliable nonfinancial data (for example, store square footage or occupancy rates) and the use of data that has been subjected to auditing procedures improve the precision of the expectation.
1.22 The auditor needs to carefully consider the reliability of data used to develop his or her expectations, taking into account, if necessary, the results of other related procedures. When substantive analytical procedures are used to test for both overstatement and understatement, the auditor needs to ensure th a t the data used to build the expectation is reliable in both directions.
Inherent Precision of the Expectation Method Used
1.23 Expectations can be developed with methods as simple as using the prior-year sales balance (adjusted for expected changes) as the expectation for current year sales or as complex as multiple regression analysis that incorporates both financial (for example, cost of goods sold) and nonfinancial data (for example, store square footage) to predict retail sales. The auditor selects the most appropriate type of expectation method to use for an account by considering the level of assurance required by the procedure. Determining which type of expectation method is appropriate is a m atter of professional judgment. However, the inherent precision of the expectation method used should be considered in developing the expectation. The four types of expectation methods and their appropriateness are discussed in the following paragraphs.
1.24 Trend analysis. This is the analysis of changes in an account balance over time. Simple trends typically compare last year’s account balance to
AAG-ANP 1.24

6 Analytical Procedures
the current unaudited balance. More sophisticated trends encompass multiple time periods.
1.25 Trend analysis is most appropriate when the account or relationship is fairly predictable (for example, sales in a stable environment). I t is less effective when the entity under audit has experienced significant operating or accounting changes. The number of years used in the trend analysis is a function of the stability of operations. The more stable the operations over time, the more predictable the relations and the more appropriate the use of multiple time periods.
1.26 Trend analysis at an aggregate level (for example, trend analysis of an entity’s operating units on a consolidated basis) is relatively imprecise because a material misstatement is often small relative to the natural variation in an aggregate account balance. This suggests the need to perform trend analysis on a disaggregated level (for example, by segment, product, or location, and monthly or quarterly rather than on an annual basis).
1.27 In using trend analysis, it is important for the auditor to understand the volatility of the environment related to the accounts being tested. For example, research has shown that, except in situations in which the environment has remained stable relative to the prior year, using only the prior-year balance as the expectation reduces the effectiveness of analytical procedures to identify potential high-risk areas. In fact, using only the prior-year balance without considering whether it is the most appropriate expectation can lead to a bias toward accepting the current data that have not been subject to auditing procedures as fairly stated, even when they are misstated.
1.28 Ratio analysis. This is the comparison of relationships between financial statement accounts (between two periods or over time), the comparison of an account with nonfinancial data (for example, revenue per order or sales per square foot), or the comparison of relationships between firms in an industry (for example, gross profit comparisons). Ratio analysis entails a comparison of interrelations between accounts, nonfinancial information, or both. Another example of ratio analysis (which is sometimes referred to as common size analysis) is the comparison of the ratio of shipping costs or other selling expenses to sales from the prior year with the current year ratio, or the comparison of shipping costs to sales with the ratio for a comparable firm in the same industry.
1.29 Ratio analysis is most appropriate when the relationship between accounts is fairly predictable and stable (for example, the relationship between sales and accounts receivable). Ratio analysis can be more effective than trend analysis because comparisons between the balance sheet and income statement can often reveal unusual fluctuations that an analysis of the individual accounts would not. Comparison of ratios with industry averages (or with comparable firms in the same industry) is most useful when operating factors are comparable.
1.30 Ratio analysis at an aggregate level (that is, consolidated operating units or across product lines) is relatively imprecise because a m aterial misstatement is often small relative to the natural variations in the ratios. This suggests the need to perform ratio analysis on a disaggregated level (for example, by segment, product, or location).
1.31 Reasonableness testing. This is the analysis of account balances or changes in account balances within an accounting period th a t involves the
AAG-ANP 1.25

The Use of Analytical Procedures 7
development of an expectation based on financial data, nonfinancial data, or both. For example, an expectation for hotel revenues may be developed using the average occupancy rate, the average room rate for all rooms, or room rate by category or class of room. Also, using the number of employees hired and terminated, the timing of pay changes, and the effect of vacation and sick days, the model could predict the change in payroll expense from the previous year to the current balance within a fairly narrow dollar range.
1.32 In contrast to both trend and ratio analyses (which implicitly assume stable relationships), reasonableness tests use information to develop an explicit prediction of the account balance or relationship of in terest. Reasonableness te s ts re ly on th e a u d ito r ’s know ledge of th e relationships, including knowledge of the factors that affect the account balances. The auditor uses th a t knowledge to develop assumptions for each of the key factors (for example, industry and economic factors) to estimate the account balance. A reasonableness test for sales could be explicitly formed by considering the number of units sold, the unit price by product line, different pricing structures, and an understanding of industry trends during the period. This is in contrast to an implicit trend expectation for sales based on last year’s sales. The latter expectation is appropriate only if there were no other factors affecting sales during the current year, which is not the usual situation.
1.33 Regression analysis. This is the use of statistical models to quantify the auditor’s expectation in dollar terms, with measurable risk and precision levels.3 For example, an expectation for sales may be developed based on management’s sales forecast, commission expense, and changes in advertising expenditures.
1.34 Regression analysis is similar to reasonableness testing in that there is an explicit prediction using the auditor’s knowledge of the factors that affect the account balances to develop a model of the account balance. The model is most effective when the data are disaggregated and are from an accounting system with effective internal controls.
Relationship Between Expectation Methods Used and the Precision of the Expectation
1.35 Of the four types of expectation methods, trend analysis generally provides the least precision because this expectation method does not take into consideration changes in specific factors that affect the account (for example, product mix). The imprecision is magnified in the context of a changing environment in which the assumptions underlying the prior year numbers are no longer valid. For example, the auditor is predicting sales and new products have been introduced, or economic conditions affecting sales have changed significantly. Using prior year’s sales (or an average of the time series) as the implicit expectation for current sales does not provide a precise expectation because it omits relevant information about additional products and changes in the economic environment.4
3 In many cases, the client has developed analytical procedures, internal models, or both for monitoring and evaluating its business and performance. The auditor may find these internal analytics useful for developing his or her own analytical procedures in the planning phase of an audit and substantive testing purposes.
4 This discussion is not intended to suggest that trend analysis is imprecise or that it cannot be improved to be more precise. For example, changing interest rates, inflation, or price changes can be incorporated or factored into trend analysis to increase the analytical procedure’s precision.
AAG-ANP 1.35

8 Analytical Procedures
1.36 Regression analysis, in contrast, provides potentially the highest level of precision because an explicit expectation is formed in which the relevant data can be incorporated in a model to predict current year sales. Regression analysis potentially can take into account all of the relevant operating data (sales volume by product), changes in operations (changes in advertising levels, changes in product lines or product mix), and changes in economic conditions. In addition, regression analysis allows the auditor to measure the precision of the expectation.
1.37 The precision of ratio analysis and reasonableness testing typically falls somewhere in between that of trend analysis and regression analysis. However, reasonableness tests generally provide better precision because they involve the formation of explicit expectations similar to regression analysis. That is, reasonableness tests can employ multiple sources of data, both financial and nonfinancial, across time. Ratio analysis is similar to trend analysis in that it employs an implicit expectation. That is, when using a reasonableness test, the auditor begins with the idea of predicting the balance, whereas for ratio analysis, the expectation formation process is implicit—as the ratio is compared with budget, industry, or other relevant benchmarks.
1.38 Some aspects of the foregoing analysis can be summarized and grouped according to a number of factors, as follows:
• Explicit or implicit expectation. When using reasonableness tests or regression, the auditor is explicitly forming an expectation. This approach helps to increase the precision of the expectation. In contrast, in using trend and ratio analysis the auditor tends to rely more upon comparison and evaluation, for example, to budget, prior year, or industry figures that may or may not be relevant due to changes in the entity’s operations or in the economic environment affecting the entity or its specific industry.
• Number o f predictors. Trend analysis is limited to a single predictor, that is, the prior period’s or periods’ data for that account. Because ratio analysis employs two or more related financial or nonfinancial sources of information, thus using known relationships among the accounts, the result is a more precise expectation. Reasonableness tests and regression analysis further improve the precision of the expectation by allowing potentially as many variables (financial and nonfinancial) as are relevant for forming the expectation.
• Operating data. Trend analysis, by relying on a single predictor, does not allow the use of potentially relevant operating data, as do the other three types of procedures.
• External data. Reasonableness tests and regression analysis are able to use external data (for example, general economic and industry data) directly in forming the expectation. Although external data can potentially be used in ratio analysis, its use in this manner is quite rare.
• Statistical power. Of the four expectation methods described herein, only regression analysis provides the benefits of statistical precision. The statistical model provides not only a “best” expectation given the data at hand, but also provides quantitative measures of the “fit” of the model.
Table 1.1 illustrates how the four expectation methods differ in terms of five criteria that should be considered in determining the most appropriate method.
AAG-ANP 1.36

Table 1.1
The Use of Analytical Procedures 9
The Relationship Between Types of Analytical Procedures and Selected Precision Factors
Type of Analytical Procedure
Explicit or Implicit
ExpectationNumber of Predictors
Can Include Can Include Operating Data External Data
Trend Implicit One No NoAnalysis
Ratio Implicit Two Yes LimitedAnalysis
ReasonablenessTest Explicit
Two or more Yes Yes
RegressionAnalysis Explicit
Two or more Yes Yes
Measure of Statistical
No
No
No
Yes
Identification and Investigation (Phases II and III)1.39 The next two phases of the analytical procedure process consist of
identification and investigation. Identification begins by comparing the auditor’s expected value with the recorded amount. Given that the auditor developed an expectation with a particular materiality threshold in mind, he or she then compares the unexpected differences with the threshold. In substantive testing, an auditor testing for the possible misstatement of the book value of an account determines whether the audit difference was less than the auditor’s materiality threshold. If the difference is less than the acceptable threshold, taking into consideration the desired level of assurance from the procedure, the auditor accepts the book value without further investigation. If the difference is greater, the next step is to investigate the difference.
1.40 In investigation, the auditor considers possible explanations for the difference. The greater the precision of the expectation (that is, the closer the expectation is to the correct amount) the greater the likelihood that the difference between the expected and recorded amounts is due to misstatement rather than nonmisstatement causes. The difference between an auditor’s expectation and the recorded book value of an account (value of an account not subject to auditing procedures) can be due to any or all of the following three causes: (a) the difference is due to misstatements, (b) the difference is due to inherent factors that affect the account being audited (for example, the predictability of the account or account subjectivity), and (c) the difference is due to factors related to the reliability of data used to develop the expectation (for example, data that have been subject to auditing procedures versus data that have not been subject to auditing procedures). The greater the precision of the expectation, the more likely the difference between the auditor’s expectation and the recorded value will be due to misstatements (cause a). Conversely, the less precise the expectation, the more likely the difference is due to factors related to the precision of the expectation (causes b and c).
1.41 If the auditor believes that the difference is more likely due to factors related to the precision of the expectation, the auditor should determine whether a more precise expectation can be cost-effectively developed. If so, a new expectation should be formed and the new difference calculated. On the
AAG-ANP 1.41

10 Analytical Procedures
other hand, the auditor may rule out causes b and c (see paragraph 1.40) as explanations for the unexpected difference and may then evaluate the unexpected difference as a potential misstatement. The auditor should then perform further analysis and inquiry using his or her knowledge of the industry and client to evaluate the most likely causes and identify a plausible explanation.
1.42 Plausible explanations usually relate to unusual transactions or events, or accounting or business changes. In evaluating whether an explanation is plausible, the auditor should consider such factors as—
• The understanding of matters noted while performing audit work in other areas, particularly while performing audit work on the data used to develop the expectation.
• Management and board reports containing explanations of significant variances between budgeted and actual results.
• Review of board minutes.• Information on unusual events occurring in prior years (this may
indicate the types of unusual events that could have affected the current year data).
1.43 When analytical procedures serve as substantive tests, the auditor should corroborate explanations for significant differences by obtaining sufficient audit evidence. This evidence needs to be of the same quality as the evidence the auditor would expect to obtain to support tests of details. The procedures used to corroborate the explanation depend on the nature of the explanation, the nature of the account balance, and the results of other substantive procedures. To corroborate an explanation, one or more of the following techniques may be used:
• Inquiries o f persons outside the client’s organization. For example, the auditor may want to confirm discounts received with major suppliers or agree changes in commodity prices with a commodities exchange or the financial press.
• Inquiries o f independent persons inside the client’s organization. For example, an explanation received from the financial controller for an increase in advertising expenditures might be corroborated with the m arketing director. It is normally inappropriate to corroborate explanations only by discussion with other accounting departm ent personnel.
• Evidence obtained from other auditing procedures. Sometimes the results of other auditing procedures (particularly those performed on the data used to develop an expectation) are sufficient to corroborate an explanation.
• Examination o f supporting evidence. The auditor may examine supporting documentary evidence of transactions to corroborate explanations. For example, if an increase in cost of sales in one month was attributed to an unusually large sales contract, the auditor might examine supporting documentation, such as the sales contract and delivery dockets.
1.44 When the population is disaggregated, a pattern in the differences may indicate that there is a common explanation for those differences. However, the auditor cannot assume that this is the case. He or she should perform sufficient work to corroborate each significant difference. When the auditor is unable to corroborate an explanation for a difference, he or she should not regard th a t difference as having been explained.
AAG-ANP 1.42

The Use of Analytical Procedures 11
Evaluation (Phase IV)1.45 The final phase of the analytical procedure process consists of evalu
ating the difference between the auditor’s expected value and the recorded amount. It is usually not practicable to identify factors that explain the exact amount of a difference identified for investigation. However, the auditor should attempt to quantify that portion of the difference for which plausible explanations can be obtained and, where appropriate, corroborated and determine that the amount that cannot be explained is sufficiently small to enable him or her to conclude on the absence of material misstatement.
1.46 If a reasonable explanation can not be obtained, SAS No. 47, Audit Risk and Materiality in Conducting an Audit (AICPA, Professional Standards, vol. 1, AU sec. 312.34), requires the auditor to “aggregate misstatements that the entity has not corrected in a way that enables him [or her] to consider whether, in relation to individual amounts, subtotals, or totals in the financial statements, they materially misstate the financial statements taken as a whole.” In this case, the auditor would aggregate the misstatement, depending on materiality considerations, with other misstatements the entity has not corrected in the manner discussed in SAS No. 47.
AAG-ANP 1.46
Questions and Answers 13
Chapter 2
Questions and Answers2.01 This chapter provides questions and answers relating to analytical
procedures. The questions and answers are grouped in the following five categories: precision of the expectation, relationship of analytical procedures to the audit risk model, evaluation and investigation, purpose of analytical procedures, and fraud.
Precision of the Expectation2.02 Question 1: What factors are important in determining the level of
assurance provided by an analytical procedure?2.03 Answer: The level of assurance provided by an analytical proce
dure is determined by the precision of the expectation. The higher the precision, the greater the level of assurance provided by the procedure. The factors affecting the precision of an expectation are—
а. The nature of the account (for example, its predictability or subjectivity).b. The characteristics of the data including the level of disaggregation
of the data and the availability, sources, and reliability of the data.
c. The inherent precision of the type of expectation formed (trend or ratio analysis, reasonableness test, or regression analysis).
2.04 Question 2: How does the aggregation of data affect the level of assurance provided by an analytical procedure?
2.05 Answer: Data aggregation refers to the level a t which account balances are combined for testing (for example, account balances on an annual instead of a quarterly basis or the consolidation of operating units). Generally, the more disaggregated the data used to form the expectation, the more precise that expectation will be. This will result in a higher level of assurance that material misstatement will be detected. Disaggregation is typically more important when the entity’s operations are more complex or diversified. However, the auditor also must consider the reliability of disaggregated data. For example, certain quarterly data may be less reliable than annual data because it is unaudited or is not subject to the same controls as the annual data. The auditor uses judgment in determining which precision factor is more important in the circumstances. (See the case study in chapter 3 and Statement on Auditing Standards [SAS] No. 56, Analytical Procedures [AICPA, Professional Standards, vol. 1, AU sec. 329.17-.19].)
2.06 Question 3: How does the reliability of the data used in forming an expectation affect the level of assurance provided by the analytical procedure?
2.07 Answer: One of the factors affecting the precision of the expectation, and thus the level of assurance, is the reliability of the data sources used to develop the expectation. For example, data that have been subject to auditing procedures are more likely to be reliable than data that have not. If the data are produced by the entity’s financial reporting system, the auditor considers the level of control risk in assessing data reliability (see question 9).
AAG-ANP 2.07
14 Analytical Procedures
If the data are produced by another reporting system within the entity outside the financial reporting function, the auditor considers the manner in which the data are developed and reviewed by management. If the data are produced outside the entity, the auditor considers the objectivity of the source (for example, the independence of the publisher of the data from the intended users of the data) and the manner in which they were developed. Examples of matters to consider when evaluating data produced outside the entity include (a) the existence of a defined set of measurement criteria, (b) observed flaws in previous publications of similar reports, and (c) the general acceptance of the data source. For example, statistics published by the U.S. Department of Labor are more likely to be reliable than similar statistics provided by an industry trade group.
2.08 Question 4: What is the role of planning materiality in determining the desired precision of an expectation in testing an account balance?
2.09 Answer: Planning materiality is an indication of the amount of misstatement in the financial statements that an auditor is willing to accept. Planning materiality, in part, determines the level of assurance required of the audit procedure. Because the precision of the expectation directly affects the level of assurance, the auditor must consider materiality when determining how precise an expectation needs to be to detect misstatements that, in the aggregate, exceed materiality. An inverse relationship exists between the precision of the expectation and planning materiality. Holding all other factors constant, as planning materiality decreases, the expectation should become more precise.
2.10 Question 5: When is it beneficial to form expectations for substantive tests using regression analysis?
2.11 Answer: Regression analysis provides a means of quantifying the assurance obtained that is not available when using other types of analytical procedures. Because of the ability to quantify the precision achieved, regression analysis is beneficial when a high level of assurance is needed from the analytical procedure. It also provides a more rigorous means of quantifying likely errors.
2.12 Question 6: When is it beneficial to form expectations for substantive tests using ratio or trend analysis and reasonableness tests?
2.13 Answer: Ratio and trend analysis are often used in audit planning. However, when plausible and predictable relationships exist between the data used to form the expectation and the balance to be tested, and the data are reliable and disaggregated, ratio and trend analyses can be effective substantive tests. Generally, ratio and trend analyses are relatively imprecise and should be performed at a disaggregated level when higher levels of assurance are desired. Reasonableness tests often are used in testing account balances, particularly estimates, by forming expectations based on financial or nonfinancial data. If a high level of assurance is desired from a reasonableness test (for example, to test a detailed transaction), the auditor often reconstructs or recomputes the balance.
2.14 Question 7: What are the differences, if any, between expectation formation for analytical procedures used during planning, substantive testing, and the overall review stages of the audit?
2.15 Answer: Precision of the expectation is the most important factor in determining the level of assurance the analytical procedure provides. When
AAG-ANP 2.08

Questions and Answers 15
performing analytical procedures during planning, the primary focus is to identify unexpected changes or the absence of expected changes that may indicate a risk of material misstatement. The purpose of those procedures is to assist in determining the nature, timing, and extent of substantive procedures. As a result, the expectations can be less precise, and the analysis and investigation of unexpected changes can be less extensive. In contrast, when performing analytical procedures as substantive tests, the desired level of assurance is higher than that of the planning stage; therefore, expectations of the recorded amounts should be more precise, because the procedures performed are to directly identify misstatements in the account balances being tested. When performing analytical procedures in the overall review stage of the audit, the focus is on assisting the auditor in assessing the conclusions reached as a result of substantive testing and in evaluating overall financial statement. As a result, in the overall review stage the expectations developed are not as precise as those developed in performing substantive tests.
Relationship of Analytical Procedures to the Audit Risk Model
2.16 Q uestion 8: How does the auditor’s assessment of inherent risk affect the auditor’s decision to use analytical procedures and the level of assurance provided by those procedures?
2.17 Answer: The influence of inherent risk on the auditor’s decision to use analytical procedures, and the assurance provided from them, is dependent on the extent to which inherent risk affects the precision of the expectation. As noted in question 1, the nature of the account and the environment (factors affecting inherent risk) affect the precision of the expectation. The more susceptible an assertion is to misstatement (absent related internal control) and the less predictable the account, the higher the inherent risk and the less precise an expectation will necessarily be.
2.18 Q uestion 9: How does the assessment of control risk affect an auditor’s decision to use analytical procedures and the level of assurance provided by those procedures?
2.19 Answer: The influence of control risk on the auditor’s decision to use analytical procedures, and the assurance provided from them, are dependent on the extent to which control risk affects the precision of the expectation. Control risk is directly related to data reliability. In addition, data reliability directly affects expectation precision. Therefore, if financial data produced by the entity are used in developing the expectation and the auditor wishes to form a precise expectation, he or she should take steps to determine that the data used in developing the expectation are reliable. However, this does not preclude the auditor from performing analytical procedures when control risk has not been tested.
2.20 Q uestion 10: When assessing inherent and control risk in planning a sample for a substantive test of details (statistical or nonstatistical), can the results of analytical procedures be used as a factor in determining the sample size?
2.21 Answer: Yes. As discussed in SAS No. 39, Audit Sampling (AICPA, Professional Standards, vol. 1, AU sec. 350), an auditor assesses inherent and control risk and relies on analytical procedures and substantive tests of details
AAG-ANP 2.21
16 Analytical Procedures
in whatever combination he or she believes adequately controls audit risk. If the auditor assesses the combination of inherent and control risk at a lower level, he or she can accept a greater risk of incorrect acceptance for the planned substantive test. As the acceptable level of risk of incorrect acceptance increases, the appropriate sample size for the substantive test decreases. Conversely, if the auditor assesses the combination of inherent and control risk at a higher level, the acceptable level of risk of incorrect acceptance decreases and the appropriate sample size increases. A similar relationship is true for the auditor’s reliance on other substantive tests, including analytical procedures related to the same audit objective. As the auditor’s reliance on the other related substantive test increases, the acceptable level of risk of incorrect acceptance increases and the appropriate sample size decreases. Conversely, as the auditor’s reliance on the other related substantive tests decreases, the acceptable level of risk of incorrect acceptance decreases and the appropriate sample size increases.
Evaluation and Investigation2.22 Question 11: When does the auditor perform further investigation
based upon the findings of an analytical procedure?2.23 Answer: When a difference between the auditor’s expectation and
the recorded amount exceeds the auditor’s materiality threshold for such differences, the auditor should identify and consider plausible explanations for the difference. The determining factor to such a consideration is the precision of the expectation. If the auditor concludes that the expectation is so precise that the range of expected differences is sufficiently narrow, the auditor might conclude that the difference between the expectation and the recorded amount represents a misstatement of the account balance. Further analysis involves determining whether all the relevant factors were considered in developing the expectation (that is, was the expectation sufficiently precise to achieve the desired level of assurance). Plausible explanations arising from failing to consider all relevant factors usually relate to unusual transactions or events or to accounting or business changes. If the auditor rules out other plausible, nonmisstatement explanations for the difference, the auditor should then further investigate for misstatement causes.
2.24 In establishing a materiality threshold for the investigation of differences between expected and actual amounts, the auditor considers not just the magnitude of an individual difference, but also the effect such a difference would have when aggregated with other audit differences.
2.25 Question 12: How does the auditor evaluate differences in excess of the auditor’s threshold between the expected and recorded amounts?
2.26 Answer: If the difference between expected and recorded amounts is likely due to potential misstatement, the auditor should perform further analysis and inquiry. (See the “Identification and Investigation” and “Evaluation” sections of chapter 1 for situations in which the unexpected difference is not due to a misstatement.) The auditor should obtain sufficient evidence by performing other audit procedures and inquiring of management about the difference between the expectation formed and the recorded amount. Considering possible explanations for the difference before inquiring of management will likely improve the accuracy of the evaluation of the difference. If a reasonable explanation cannot be obtained, SAS No. 47, Audit Risk and Materiality in Conducting an Audit (AICPA, Professional Standards, vol. 1, AU
AAG-ANP 2.22

Questions and Answers 17
sec. 312.34) requires the auditor to “aggregate misstatements that the entity has not corrected in a way that enables him [or her] to consider whether, in relation to individual amounts, subtotals, or totals in the financial statements, they materially misstate the financial statements taken as a whole.” In this case, the auditor would aggregate the misstatement, depending on materiality considerations, with other misstatements the entity has not corrected in the manner discussed in SAS No. 47.
Purpose of Analytical Procedures2.27 Question 13: Can analytical procedures provide evidence about
the effectiveness of internal control over financial reporting?
2.28 Answer: As discussed in chapter 1, analytical procedures are performed for three purposes: (a) to assist the auditor in planning the nature, timing, and extent of audit procedures; (b) to reduce risk in testing account balances; and (c) to provide overall reasonableness a t the end of the audit. However, the result from the analytical procedure and the subsequent evaluation of the unexpected difference can lead the auditor to reevaluate control risk. This is similar to the situation in which the identification of more misstatements than expected from a test of details leads to a reconsideration of the strength of controls.
2.29 Question 14: What are the differences, if any, between substantive analytical procedures performed in an audit, a review, and an attest engagement?
2.30 Answer: The primary difference in analytical procedures performed in an audit versus a review is the desired level of assurance. In an audit, the substantive analytical procedures performed are designed to provide assurance that the financial statements are fairly presented. In a review, the analytical procedures are performed in connection with inquiries of management to provide moderate assurance that the accountant is not aware of any material misstatements. An auditor generally requires a more precise expectation in an audit than in a review, because the audit requires a higher level of assurance.
2.31 This concept also applies when performing analytical procedures in an attest engagement related to financial matters (for example, examination of pro forma financial information). If the accountant performs an examination of management’s assertion and performs analytical procedures to provide assurance, the expectation must be more precise than if the accountant is to provide moderate assurance under a review.
2.32 Question 15: What is the role of analytical procedures in planning when the auditor knows from past experience that numerous adjustments are posted to the working trial balance during fieldwork?
2.33 Answer: In planning the audit, the auditor must perform analytical procedures that assist in understanding the client’s business and material classes of transactions and in determining the nature, timing, and extent of substantive tests. Known or expected adjustments in account balances do not preclude the auditor from performing analytical procedures during planning, and such procedures should still be used to assist the auditor in directing attention to potential material misstatements. The auditor should incorporate his or her knowledge of known adjustments in forming more precise expectations.
AAG-ANP 2.33

18 Analytical Procedures
2.34 Q uestion 16: How does the interrelation among accounts affect the level of assurance provided by the substantive analytical procedures on the individual accounts? For example, does finding that commission expense is 6 percent of sales as expected provide completeness assurance on both sales and commissions?
2.35 Answer: Amounts that are the consequence of other amounts, such as the example cited above, should be considered carefully when applying analytical procedures to avoid circular reasoning. The auditor should consider whether the amounts and accounts are independent of one another. In the example noted above, testing commission expense by comparing the recorded amount with the 6 percent of sales may provide assurance concerning commission expense. However, this same relationship should not be used to predict sales, because commission expense is not independent of sales. Therefore, the auditor should not gain assurance from analytical procedures applied to amounts that are not independent of one another.
2.36 Q uestion 17: Is it ever appropriate for an auditor to propose an adjustment based on the results of analytical procedures?
2.37 Answer: In a given situation, an auditor may be able to propose an adjustment for a certain type of account balance. The auditor should consider the level of desired assurance and whether any other substantive tests may assist the auditor in determining a material misstatement. For example, the auditor may consider proposing an adjustment for an unexpected difference found when performing analytical procedures on an estimate, such as a loan loss reserve.
Fraud2.38 Q uestion 18: How effective are analytical procedures for detecting
management fraud?2.39 Answer: Although analytical procedures would not determine the
presence or absence of fraud, they can be an effective means for directing the auditor’s attention to the possible existence of management fraud. In most cases, the effectiveness of the analytical procedures are enhanced if the auditor uses industry knowledge* knowledge of relations among financial and nonfinancial data, and data from reliable sources.
AAG-ANP 2.34

Case Study: On the Go Stores 19
Chapter 3
Case Study: On the Go Stores3.01 This chapter provides a case study for On the Go Stores. The case
study illustrates the four types of expectation methods discussed in chapter 1: trend analysis, ratio analysis, reasonableness testing, and regression analysis.
3.02 This case illustrates the use of analytical procedures in both planning and substantive testing for current year sales for a chain of convenience stores named On the Go Stores. The case illustrates the use and effectiveness of the different types of analytical procedures and the factors affecting the precision of each. For example, there are illustrations for trend analysis, ratio analysis, reasonableness testing, and regression analysis in which the analytical procedures are based on financial and nonfinancial data.
Background Information3.03 On the Go Stores has twenty-three convenience stores located in the
Southeast. Included in the twenty-three stores are five new stores (no. 1, no. 4, no. 10, no. 13, and no. 22) that opened during the year. Operations vary by demographic location and the mix of products sold.
3.04 The location of a store is based on several factors, such as competition and the economic environment of the location. Store nos. 2, 4, 6, 8, 9, 11, 1 3 , 15 , 17, 18, 20, 21, and 23 are considered to be in favorable locations.
3.05 Typically, a store’s operations do not change much unless a new product line is introduced, such as selling gas, offering check-cashing services, or selling lottery tickets. The mix of products and services can vary, and the most important factor is whether the store sells gasoline (store nos. 5, 6, 7, 8, 14, 15, 16, 17 , 18, 19, 20, and 21 sell gasoline). These additional product lines typically affect the volume of customers as well as the number of full-time employees.
3.06 On the Go Stores provides the information shown in exhibit 3.1.
AAG-ANP 3.06

20 Analytical Procedures
Exhibit 3.1
Relevant Information for On the Go Stores
Store
Prior-YearSales
(Audited)($)
Current-YearSales($)
DollarChange
($)
Current- Percent Change
(%)
CurrentYear
Inventory($)
SquareFeet
AverageNumber
Full-TimeEmployees
1 * N/A 781,793 781,793 N/A 48,725 2,500 1 1 . 0 0
2 1,165,221 1,146,438 (18,783) (1.16) 44,171 2,500 11.313 1,147,430 1,195,004 47,574 4.15 45,714 2,500 12.464 * N/A 951,784 951,784 N/A 37,218 4,000 1 1 . 8 6
5 2,037,463 1,981,409 (56,054) (2.75) 45,826 4,000 10.066 2,257,920 2,300,671 42,751 1.89 53,862 4,000 1 1 . 1 0
7 1,850,354 1,956,481 106,127 5.73 49,883 4,000 10.718 1,916,884 1,799,713 (117,171) (6 .1 1 ) 47,016 4,000 7.509 1,833,209 1,820,641 (12,568) (.69) 59,726 4,000 14.00
1 0 * N/A 774,954 774,954 N/A 35,882 2,500 1 1 . 2 0
1 1 980,484 1,159,004 178,520 18.21 37,664 2,500 11.601 2 1,069,652 1,139,475 69,823 6.53 34,662 2,500 12.7013* N/A 948,522 948,522 N/A 44,782 4,000 1 1 . 8 6
14 1,795,123 1,984,777 189,654 10.56 38,774 4,000 1 2 . 2 0
15 2,119,015 2,293,847 174,832 8.25 55,423 4,000 1 1 . 1 0
16 1,947,303 1,984,722 37,419 1.92 52,884 4,000 10.4017 1,705,789 1,798,336 92,547 5.42 46,834 4,000 8.8418 2,396,971 2,484,503 87,532 3.65 53,772 4,000 1 2 . 1 0
19 1,901,631 1,837,400 (64,231) (3.38) 43,982 4,000 9.702 0 1,514,798 1,609,385 94,587 6.24 44,893 4,000 7.202 1 1,886,587 1,874,229 (12,358) (.65) 37,665 4,000 10.502 2 * N/A 698,333 698,333 N/A 33,826 2,500 10.5023 1,092,908 1,198,229 105,321 9.66 44,857 2,500 10.90
Total 30,618,742 35,719,650 5,100,908 16.66 1,038,041 80,000 250.80
* Store opened during current year.
3.07 As discussed in chapter 1, the use of analytical procedures is a process that has four phases, the first being the formation of an expectation. Some of the factors that affect the precision of the expectation are the nature of the account, the assertion, and the environment. The auditor can assume that these factors are constant throughout the examples presented in the case study when forming an expectation.
Nature of the Account or Assertion3.08 Account: Sales
Assertion: Occurrence or existence of revenue Audit objective: Overstatement of revenuePredictability o f the relationship: The factors that the auditor should use to predict sales (predictors) include the following:• Stable environmental factors (that is, no major changes in em
ployment opportunities or construction activities in the area)
AAG-ANP 3.07

Case Study: On the Go Stores 21• Prior-year sales• Product mix (that is, lottery and check cashing)• Store square feet• Location (favorable or not favorable)• Average monthly utility cost per store• Total labor hours per store• Inventory turnover rate• Stores open twenty-four hours• Number of employees per store• The account not affected by management’s discretion• Income statement account
3.09 Factors to be identified and considered that could affect the amount being audited include the following:
• No significant events or accounting changes, except for the opening of the new stores
• Industry and economic factors along with management incentives remaining the same
• Repeat audit engagement• Materiality $150,000 or 8 percent change from prior year
3.10 All predictors are not considered in any one example; however, as the precision of the expectation increases, more predictors are used. Example 1 (trend analysis) uses only one predictor, prior-year sales, and more predictors are introduced in examples 2 through 4 (ratio analysis, reasonableness testing, and regression analysis).
Example 1: Trend Analysis3.11 Trend analysis can be used in the planning phase of an audit or as a
substantive test. Trend analysis typically is more appropriate for the planning phase of an audit, because it does not take into consideration changes in specific factors that affect the account. However, considering factors that increase the precision of trend analysis may provide the auditor with an appropriate level of assurance for substantive testing.
Expectation Formation (Phase I)
3.12 Following are the relevant factors that affect the precision of the expectation.
Nature of the Account or Assertion
3.13 This information is provided in the “Background Information” section.
Characteristics of the Data
3.14 Level of detail is as follows:• Sales data are available for the current and prior year, aggregated by
stores opened all year and those open part year, and disaggregated by store.
AAG-ANP 3.14

22 Analytical Procedures
• For the planning phase of an audit, aggregated data may be appropriate.• For substantive testing, disaggregated data by category of store (open
all year versus part of the year) may be appropriate when there is a stable environment and reasonable controls are in place.
3.15 Reliability of data is as follows:• The management of On the Go Stores has provided the current-year
sales information.• Current year sales is unaudited; prior-year sales is audited.
Inherent Precision of the Type of Expectation
3.16 With simple trend analysis, the auditor has the expectation that there will be no change from prior-year sales in the current year (predictor is prior-year sales; when prior-year numbers are used as the predictor, the auditor should be aware that he or she is ignoring other changes that may have an effect).
Trend Analysis: Planning Phase of the Audit and Substantive Testing
3.17 When using trend analysis for the planning phase, the use of data aggregated a t a high level may be appropriate because a high level of assurance is not expected from the procedure.
3.18 Since a higher level of assurance is desired when using analytical procedures as substantive tests, an expectation with greater precision should be formed. This can be done by using disaggregated data, such as sales by store, product mix, and location.
Current Year Prior Year Change % ChangeTotal sales $35,719,650 $30,618,742 $5,100,908 16.66%
3.19 Sales for the new stores opened during the year equal $4,155,386 (no new stores were opened in the prior year). If that amount were eliminated from the total of current-year sales, the adjusted amount of current-year sales would be $31,564,264, which could be compared to the prior-year amount resulting in a change of $945,522, or 3.09 percent.
Planning Phase: Identification, Investigation, and Evaluation (Phases II through IV)
Identification
3.20 Identification begins with the auditor comparing the expected amount with the recorded amount. Unexpected differences, if any, are compared to the materiality threshold. Because the difference for On the Go Stores in the planning phase is in excess of the materiality threshold of $150,000, or an 8 percent change from prior year, the auditor should design procedures to evaluate the causes of such differences. The auditor could better investigate the difference by disaggregating the data by stores open all year versus stores open part of the year. The auditor should consider whether the 3.09 percent difference is acceptable for the stores open all year.
3.21 Statement on Auditing Standards (SAS) No. 22, Planning and Su pervision (AICPA, Professional Standards, vol. 1, AU sec. 311.05), states, “As the audit progresses, changed conditions may make it necessary to modify planned audit procedures.” Because the purpose of using analytical procedures
AAG-ANP 3.15

Case Study: On the Go Stores 23
in the planning phase of the audit is to direct attention to potential material misstatements, at this point the auditor should evaluate whether the audit plan should be changed because of the results of the planning analytical procedures performed. In evaluating the stores open all year, the auditor evaluates whether the results suggest an increased risk in the sales account. If so, the auditor should consider the nature, timing, and extent for the substantive tests planned for the audit.
3.22 Trend analysis as a substantive test will be performed on stores that have been open all of the year. The expectation of current year sales by store is the prior-year sales by store.
Substantive Testing: Identification, Investigation, and Evaluation (Phases II through IV)
Identification
3.23 Identification begins by comparing the expected amount with the recorded amount. In this case the analytical procedure is the percentage change from the prior-year to current-year sales as shown in column 5 of exhibit 3.1. The differences are compared with the materiality threshold to determine if they are unexpected. In this case, the auditor uses a materiality threshold of an 8 percent change when determining if differences identified should be investigated. Therefore, the procedure identifies store nos. 11 , 14, 15, and 23 for farther investigation.
Investigation
3.24 As stated in chapter 1, unexpected differences can be due to misstatements or to factors not considered in the development of the expectation. If the auditor believes the unexpected difference could be caused by factors not considered in the development of the expectation (for example, differences in stores that sell gas or lottery tickets), the auditor should consider whether developing a more precise expectation can be cost-effective, such as disaggregated information by product line within a store or adjusting the analysis for general inflation. Otherwise the auditor should consider what additional substantive procedures should be performed. SAS No. 56, Analytical Procedures (AICPA, Professional Standards, vol. 1, AU sec. 329.21), states that inquiry of management may assist the auditor in determining the causes of the unexpected differences. However, management responses should be corroborated with other evidential matter. For example, if management explains the increase in current-year sales as a result of a new product line that was introduced only in the current year, the auditor could perform a sales analysis to determine that the items were sold only in the current year and did not appear in the prior-year sales analysis.
Evaluation
3.25 SAS No. 47, Audit Risk and Materiality in Conducting an Audit (AICPA, Professional Standards, vol. 1, AU sec. 312), indicates that the auditor may propose an adjustment if he or she believes the unexcepted difference approximates the amount of the misstatement. However, in this case the auditor might consider employing analytical procedures using additional disaggregated information (for example, product mix) or other substantive procedures to enable him or her to estimate the likely misstatement. The trend analysis example illustrates the importance of using disaggregated data.
AAG-ANP 3.25

24 Analytical Procedures
Example 2: Ratio Analysis3.26 A ratio analysis involves the comparison of relationships between
financial statement accounts, a comparison of an account with nonfinancial data, or a comparison of relationships across an industry, such as gross profit comparisons.
Expectation Formation (Phase I)3.27 These are the relevant factors that affect the precision of the expectation.
Nature of the Account or Assertion
3.28 The “Background Information” section contains this information.
Characteristics of the Data3.29 Level of detail is as follows:• The auditor has available sales data and cost of goods sold data for
stores open all year that sell gas and that do not sell gas.3.30 Reliability of data is as follows:• The management of On the Go Stores has provided the auditor with
total sales and cost of goods sold data for stores open all year by those that sell gas and those that do not sell gas.
• Sales and cost of goods sold information are unaudited; however, the gross margin percentage can be calculated by the auditor to ensure mathematical accuracy.
Inherent Precision of the Type of Expectation
3.31 Ratio analysis. The predictor is the gross profit percentage for stores that sell gas compared with stores that do not sell gas. A higher gross profit percentage is expected for stores that sell gas due to higher volume.
Current Year Prior YearAll stores:Total salesCost of goods soldGross marginGross margin percentage
$31,564,264 $30,618,742 21,463,700 21,987,932
$10,100,564 $ 8,630,81031.99% 28.19%
Stores that sell gas:Total salesCost of goods soldGross marginGross margin percentage
$23,905,477 $23,329,838 16,112,291 16,307,557
$ 7,793,186 $ 7,022,28132.6% 30.1%
Stores that do not sell gas:Total salesCost of goods soldGross marginGross margin percentage
$ 7,658,787 $ 7,288,904 5,351,409 5,680,375
$ 2,307,378 $ 1,608,52930.1% 22.1%
AAG-ANP 3.26

Case Study: On the Go Stores 25
Identification, Investigation, and Evaluation (Phases II to IV)
Identification
3.32 Identification begins by comparing the expected amount with the recorded amount. In this case the analytical procedure is the comparison of the gross profit percentage for the current to prior year for stores that sell gas and stores that do not sell gas. The differences are compared with the materiality threshold to determine if they are unexpected. For example, an acceptable difference for this On the Go Store is 10 percent. The percentage threshold will not necessarily be the same for trend and ratio analysis. The auditor should use professional judgment to determine the threshold based on materiality, risk, and the objective of the procedure. Using the aggregate analysis for all stores open all year, the procedure identifies an unexpected difference of 13.5 percent (31.99 percent - 28.19 percent / 28.19 percent). However, a more precise expectation can better identify the source of the unexpected difference. Specifically, for the stores that sell gas, the difference in gross margin percentage is only 8.3 percent (32.6 percent - 30.1 percent / 30.1 percent) which is below the materiality threshold. In contrast, the difference in gross margin percentage for those stores that do not sell gas is 36.4 percent (30.1 percent - 22.1 percent / 22.1 percent). This suggests that the six stores that do not sell gas should be investigated further.
Investigation
3.33 If the auditor believes the unexpected difference could be caused by other factors not considered in the development of the expectation (for example, location or degree of competition), the auditor should consider whether developing a more precise expectation can be cost-effective. Otherwise the auditor should consider what additional substantive procedures should be performed. SAS No. 56 (AU sec. 329.21, states that inquiry of management may assist the auditor in determining the causes of the unexpected differences. However, management responses should be corroborated with other evidential matter.
Evaluation
3.34 The results from a second, more precise reasonableness test or additional substantive testing on the stores that do not sell gas would provide the auditor with a basis of concluding whether a material misstatement exists. SAS No. 47 (AU sec. 312.28), indicates that the auditor would propose an adjustment when the auditor determines that the difference is due to a misstatement.
3.35 This example shows how the use of financial ratios, along with disaggregated information, can increase the precision of the expectation.
Example 3: Reasonableness Test3.36 A reasonableness test is an analysis of an account balance that
involves developing an expectation based on financial data, nonfinancial data, or both.
Expectation Formation (Phase I)3.37 Following are the relevant factors that affect the precision of the
expectation.
AAG-ANP 3.37

26 Analytical Procedures
Nature of the Account or Assertion
3.38 This information is provided in the “Background Information” section.
Characteristics of the Data
3.39 Level of detail is as follows:• The auditor has available sales data and square footage data by store.3.40 Reliability of data is as follows:• The management of On the Go Stores has provided the auditor with
the amount of square footage per store and sales per stores (see exhibit 3.1). The region’s average sales per square footage can be obtained from information provided by the National Association of Convenience Stores (NACS), which publishes information on the convenience store industry.
• Sales information is unaudited; however, square footage data can be independently verified by the auditor to increase its reliability.
Inherent Precision of the Type of Expectation3.41 Reasonableness test. The predictor is sales per square foot by store.
3.42 In performing a reasonableness test of On the Go Stores’ current- year sales using the information provided, the auditor calculates the average sales amount per square foot and compares it with the region’s average sales per square foot. If only a low level of assurance is desired from the procedure, conducting the test using aggregated data is appropriate. However, if a higher level of assurance is desired, a more precise expectation should be formed, for example, by disaggregation by store as shown in exhibit 3.2.
Exhibit 3.2
Reasonableness Test Based on Sales per Square Foot
Average
Store
Current-YearSales($)
SquareFeet
Salesper
SquareFoot($)
per Square Foot per NACS
($)Difference
($)Difference
($)1 * 781,793 2,500 313 490 177 36.102 1,146,438 2,500 459 490 31 6.303 1,195,004 2,500 478 490 1 2 2.504 * 951,784 4,000 238 490 252 51.405 1,981,409 4,000 495 490 (5) (1 .0 0 )6 2,300,671 4,000 575 490 (85) (17.30)7 1,956,481 4,000 489 490 1 . 0 2
8 1,799,713 4,000 450 490 40 8 . 2 0
9 1,820,641 4,000 455 490 35 7.101 0 * 774,954 2,500 310 490 180 36.701 1 1,159,004 2,500 464 490 26 5.30
(continued)
AAG-ANP 3.38

Case Study: On the Go Stores 27
Store
Current-YearSales($)
SquareFeet
Salesper
SquareFoot($)
Average per
Square Foot per NACS
($)Difference
($)Difference
($)1 2 1,139,475 2,500 456 490 34 6.9013* 948,522 4,000 237 490 253 51.6014 1,984,777 4,000 496 490 (6 ) (1 .2 0 )15 2,293,847 4,000 573 490 (83) (16.90)16 1,984,722 4,000 496 490 (6 ) (1 .2 0 )17 1,798,336 4,000 450 490 40 8 . 2 0
18 2,484,503 4,000 621 490 (131) (26.70)19 1,837,400 4,000 459 490 31 6.302 0 1,609,385 4,000 402 490 8 8 18.002 1 1,874,229 4,000 469 490 2 1 4.302 2 * 698,333 2,500 279 490 2 1 1 43.1023 1,198,229 2,500 479 490 1 1 2 . 2 0
Total 35,719,650 80,000 10,143 11,270 1,127 1 0 . 0 0
* Store opened during current year.
3.43 After reviewing the information provided by NACS, the auditor determines that the information reflects only stores that have been in operation for a full year; therefore, it would be appropriate to isolate the stores that have been open for less than a full year, as in the following table:
Reasonableness Testing—Total for Stores Open All Year
Total Square Sales Footage
Total sales and square footage for the year $35,719,650 80,000Less: sales and square footage for stores
opened part of the year (store nos. 1, 4,10 , 13, 22) 4,155,386 15,500
Sales and square footage for stores opened for full year $31,564,264 64,500
Average sales per square foot (provided by NACS) x $490
Expected total sales for stores open for a full year $31,605,000
Actual On the Go sales for the current year (stores open for a full year) 31,564,264
Difference $ 40,736or 0.13%
3.44 To perform reasonableness testing by store, the auditor calculates the sales per square foot for each store and ranks the results (see exhibit 3.2). The results for the five new stores are relatively small and can be disregarded for this analysis. The remaining stores can be compared to the $490 national average square foot, provided by NACS.
AAG-ANP 3.44

28 Analytical Procedures
Identification, Investigation, and Evaluation (Phases II to IV)
Identification
3.45 The auditor begins identification by comparing the expected amount with the recorded amount. In this case the analytical procedure is the percentage change from the NACS average sales per square foot to recorded current year per square foot, as calculated in exhibit 3.2. The differences are compared with the materiality threshold to determine if they are unexpected. For example, the materiality threshold is 15 percent, and any changes greater than the threshold are considered an unexpected difference and investigated. According to the aggregate analysis for the stores open all year, the results do not identify an unusual fluctuation based on the materiality threshold. However, the analysis by store for the stores open all year identifies store nos. 6 , 15,18, and 20 for further investigation.
Investigation
3.46 If the auditor accepts the difference of 0.13 percent calculated in the first reasonableness test, the sales account balance is accepted without further investigation. However, the second reasonableness test, which is more precise because it is based on disaggregated data, does indicate the need for further investigation. If the auditor believes the unexpected difference could be caused by factors not considered in the development of the expectation (for example, differences in stores that sell gas or operate in more favorable locations), the auditor should consider whether developing a more precise expectation can be cost-effective. Otherwise the auditor should consider what additional substantive procedures should be performed. SAS No. 56 (AU sec. 329.21) states that inquiry of management may assist the auditor in determining the causes of the unexpected differences. However, management responses should be corroborated with other evidential matter.
Evaluation
3.47 If the auditor accepts the results of the first reasonableness test as sufficient evidence for the existence of sales, no evaluation is performed. However, this test is relatively imprecise and is applicable only if the auditor desires a low level of assurance. The results of the second, more precise reasonableness test followed by additional investigation provide the auditor with a basis of concluding whether a material misstatement exists. SAS No. 47 (AU sec. 312.28) indicates that the auditor would propose an adjustment when the auditor determines that the difference is due to a misstatement.
3.48 This example illustrates how the use of financial and independent nonfinancial information can give the auditor a greater precision in forming the expectation and in return provide a greater level of assurance.
Example 4: Regression Analysis3.49 Regression analysis has the same objective as trend, ratio analysis,
and reasonableness testing, that is, to identify the potential for misstatement. The advantage of regression over the other methods is that the regression: (a) provides an explicit, mathematically objective, and precise method for forming an expectation; (b) allows the inclusion of a larger number of relevant independent variables; and (c) provides direct and quantitative measures of the precision of the expectation.
AAG-ANP 3.45

Case Study: On the Go Stores 29
3.50 The auditor’s specific objective in using regression for On the Go Stores is to determine which store should be targeted for initial investigation for potential misstatement in sales. The regression determines which stores have total sales that are most out of line in comparison with the others. This type of analysis is called cross-sectional regression. The cross-section idea is used because a cross-section of relevant information about each store is used in determining which stores are most unusual. In predicting sales, the cross- section usually includes relevant predictors, such as the size of the store (as used in the reasonableness testing above), and other features that cause higher sales a t the store, such as whether it sells gas, sells lottery tickets, and so on.
3.51 The alternative type of regression is called time-series regression, because it uses the data from several (usually twenty to forty) prior audited (usually monthly) time periods to develop a regression model to predict future periods. The model is used to predict the monthly sales figures for the current audit year, as a basis for assessing the reasonableness of the reported monthly sales figures. Both types of regression analyses can be used to provide substantive evidence. The type of regression used in the following example is the cross-sectional type.
Cross-Sectional Regression3.52 The auditor begins a regression application for On the Go Stores by
selecting the dependent variable, in this case, the amount of sales (includes merchandise sales and gas sales) a t each of the twenty-three stores. The audit objective is to examine sales analytically to determine the potential for overstatement, to address the auditor’s objectives for testing completeness and existence. A preliminary assessment of materiality is set a t $150,000. Second, the auditor selects the relevant independent variables, that is, those factors that the auditor knows from experience with the client and industry will be useful predictors of sales at each store.
Independent Variables
3.53 The independent variables are as follow (see exhibit 3.3 for data):• The level of inventory (merchandise plus gas) a t the store• The number of staff at the store (full-time equivalent employees, or FTEs)• Whether the store opened or closed during the year, or for any reason
was not open the entire year. This variable is entered as a “0 to 1” variable: a 0 if the store was open all year, and a 1 if the store was open only part of the year.
• Distinctive characteristics of each store, such as whether it sells gas. This variable is also entered as a “0 to 1” variable: a value of 1 if it sells gas, and a value of 0 if it does not sell gas.
• Square feet of floor space at each store. In this case, there are only two size stores (one a t 2,500 square feet and one at 4,000 square feet). Thus, for simplicity and clarity this variable is entered into the regression as a “0 to 1” variable, which has a value of 0 for stores with 2,500 square feet, and a value of 1 for stores of 4,000 square feet.
3.54 Depending on the auditor’s local knowledge, additional variables might be included, for example, whether the store has a check-cashing facility, whether it is an attractive location (for example, near to an intersection of highways, a ballpark, or other “draw” of customers), the number of parking places, and other factors about the general competitive environment for the store.
AAG-ANP 3.54

30 Analytical Procedures
Exhibit 3.3
Regression Variables for On the Go Stores
Merchandise
StoreInventory
($)Full-TimeEmployees
NewStore
SellsGas Size
Sales($)
1 48,725 1 1 . 0 0 1 0 0 781,7932 44,171 11.31 0 0 0 1,146,4383 45,714 12.46 0 0 0 1,195,0044 37,218 1 1 . 8 6 1 0 1 951,7845 45,826 10.06 0 1 1 1,981,4096 53,862 1 1 . 1 0 0 1 1 2,300,6717 49,883 10.71 0 1 1 1,956,4818 47,016 7.50 0 1 1 1,799,7139 59,726 14.00 0 0 1 1,820,641
1 0 35,882 1 1 . 2 0 1 0 0 774,9541 1 37,664 11.60 0 0 0 1,159,0041 2 34,662 12.70 0 0 0 1,139,47513 44,782 1 1 . 8 6 1 0 1 948,52214 38,774 1 2 . 2 0 0 1 1 1,984,77715 55,423 1 1 . 1 0 0 1 1 2,293,84716 52,884 10.40 0 1 1 1,984,72217 46,834 8.84 0 1 1 1,798,33618 53,772 1 2 . 1 0 0 1 1 2,484,50319 43,982 9.70 0 1 1 1,837,4002 0 44,893 7.20 0 1 1 1,609,3852 1 37,665 10.50 0 1 1 1,874,2292 2 33,826 10.50 1 0 0 698,33323 44,857 10.90 0 0 0 1,198,229
3.55 The auditor enters the data into an Excel spreadsheet (other spreadsheet programs and statistical systems can also be used) and performs a regression on the data. In Excel, this requires five steps:
1. Choose the Tools menus and select Add-Ins (see exhibit 3.4).
AAG-ANP 3.55
Case Study: On the Go Stores 31
Exhibit 3.4
AAG-ANP 3.55
Selec
ting
Add-
Ins

32 Analytical Procedures
2. From the Add-Ins menu, select Analysis Tool Pak (see exhibit 3.5).
Exhibit 3.5
AAG-ANP 3.55
Sele
ctin
g An
alys
is To
ol P
ak
to In
stal
l Re
gres
sion

Case Study: On the Go Stores 33
3.56 The effect of these first two steps is to install regression (and other statistical procedures) so they are available in Excel. (Please note that the version of Excel used in the case study is 5.0. Upgraded versions may be available.)
3, Select again the TOOLS menu, and select Data Analysis (see exhibit 3.6).
Exhibit 3.6
AAG-ANP 3.56
Sele
ctin
g Da
ta
Anal
ysis
in Ex
cel

34 Analytical Procedures
4. Select Regression (see exhibit 3.7).
Exhibit 3.7
AAG-ANP 3.56
Sele
ctin
g Re
gres
sion
Ana
lysi
s
Ente
ring
the
Nec
essa
ry
Info
rmat
ion
Into
the
Exce
l Re
gres
sion
Pr
oced
ure
Case Study: On the Go Stores 35
5. Complete three items in the Regression Box (see exhibit 3.8).
Exhibit 3.8
AAG-ANP 3.56

36 Analytical Procedures
a. Enter the spreadsheet ranges of the dependent and independent variables (the variables are entered in columns, a row for each store. In this case, G7:G30 and B7:F30 are the ranges for the dependent and independent variables respectively; also, include in these ranges a row at the top which gives the name of the variable in each column so the regression output will label the variables properly).
b. Select Labels.
c. Select the location for the output among the report options (in this case, the cell A40).
3.57 The regression results for On the Go Stores are shown in exhibits 3.9 and 3.10.
Exhibit 3.9
Regression Results for All Variables
SUMMARY OUTPUT Regression Statistics
SUMMARY OUTPUT Regression Statistics
Multiple R R Squared Adjusted R Squared Standard Error Observations
(Note: The important information in the Summary Output Table is the R Squared value, .975, and the standard error, $97,961.)
0.9870.9750.967
97,96123
ANOVA
RegressionResidualTotal
df
51722
SS
(Note: While the A N O V A Table is part of every Excel Regression Report, it is not needed in the analysis shown here and can be ignored.)
M SSignificance
F
6.314E+121.631E+116.478E+12
1.263E+12 1.316E+02 5.680E-13
CoefficientsStandard
Error t Stat P-Value Lower 95% Upper 95%
Intercept (746,293) 244,813 (3.048) 0.007 (1,262,804) (229,783)Inventory 16 4 4.504 0.000 9 24FTE 106,114 17,725 5.987 0.000 68,717 143,511New Store (303,431) 67,863 (4.471) 0.000 (446,609) (160,253)Sells Gas 804,866 94,751 8.495 0.000 604,959 1,004,773Size-Loc 93,247 77,838 1.198 0.247 (70,977) 257,470
AAG-ANP 3.57
F
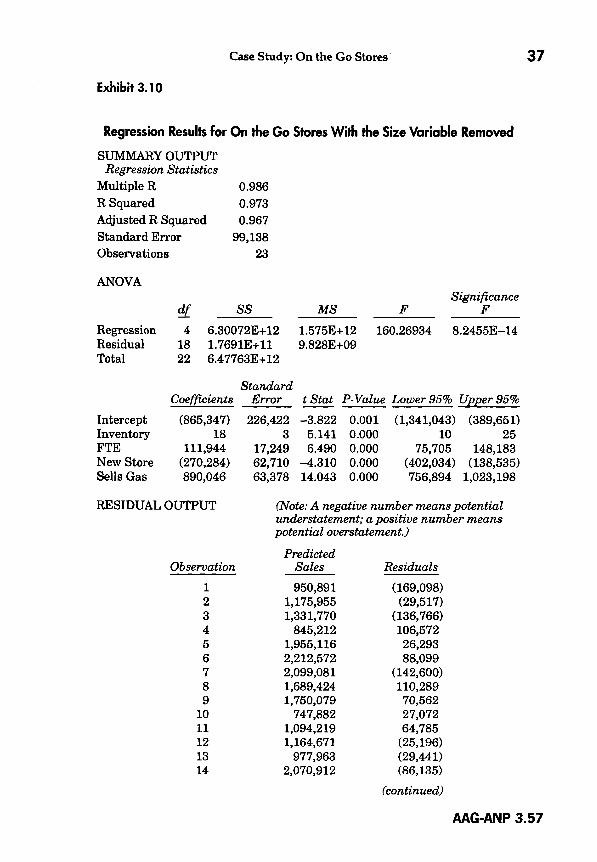
Exhibit 3 .1 0
Case Study: On the Go Stores 37
Regression Results for On the Go Stores With the Size Variable Removed
SUMMARY OUTPUT Regression Statistics
Multiple R 0.986R Squared 0.973Adjusted R Squared 0.967Standard Error 99,138Observations 23
ANOVA
RegressionResidualTotal
df
41822
SS
6.30072E+12 1.7691E+116.47763E+12
MSSignificance
F
1.575E+129.828E+09
160.26934 8.2455E-14
CoefficientsStandard
Error t Stat P-Value Lower 95% Upper 95%Intercept (865,347) 226,422 -3.822 0.001 (1,341,043) (389,651)Inventory 18 3 5.141 0.000 10 25FTE 111,944 17,249 6.490 0.000 75,705 148,183New Store (270,284) 62,710 -4.310 0.000 (402,034) (138,535)Sells Gas 890,046 63,378 14.043 0.000 756,894 1,023,198
RESIDUAL OUTPUT (Note: A negative number means potential understatement; a positive number means potential overstatement.)
ObservationPredicted
Sales Residuals1 950,891 (169,098)2 1,175,955 (29,517)3 1,331,770 (136,766)4 845,212 106,5725 1,955,116 26,2936 2,212,572 88,0997 2,099,081 (142,600)8 1,689,424 110,2899 1,750,079 70,562
10 747,882 27,07211 1,094,219 64,78512 1,164,671 (25,196)13 977,963 (29,441)14 2,070,912 (86,135)
(continued)
AAG-ANP 3.57
F

38 Analytical Procedures
ObservationPredicted
Sales Residuals
15 2,239,968 53,87916 2,117,047 (132,325)17 1,836,235 (37,899)18 2,322,937 161,56619 1,882,454 (45,054)20 1,618,582 (9,197)21 1,861,144 13,08522 633,438 64,89523 1,142,097 56,132
3.58 The assessment of the precision of the regression involves a consideration of the R squared, t statistic, and standard error of the estimate, which are contained in the “Summary Output” section of the spreadsheet report. The proper interpretation of these three values is explained in the appendix, “Measures of Precision for a Regression Analysis.”
Expectation Formation (Phase I)3.59 When using regression, expectation formation is accomplished by
the regression analysis, using the independent variables entered by the auditor, as shown in the “Coefficients” column of exhibit 3.9. For On the Go Stores, the expectation model is the following regression model:
Sales = - $746,293 + 16 x inventory+ $106,114 x full-time employees- $303,431 x new store + $804,866 x sells gas + $93,247 x size
3.60 For example, the expectation for sales in store no. 2 is derived by using the equation in the following way (data from exhibit 3.3):
Sales = - $746,293 + 16 x $44,171 + $106,114 x 11.31- $303,431 x 0 + $804,866 x 0 + $93,247 x 0 = $1,160,592
3.61 The regression prediction for sales can be compared to the actual value of sales for store no. 2, $1,146,438. The difference, $14,154 ($1,160,592 - $1,146,438), is a measure of the degree to which store no. 2 differs from the other stores, based on a regression model derived from all twenty-three stores.
Evaluating the Precision of the Regression Using R Squared the t Statistic, and the Standard Error
3.62 The assessment of the precision of the regression is done by considering three statistical measures that are provided in the regression output.
3.63 In exhibit 3.9, R squared is good (at 97.5 percent), the standard error is good ($97,961 is less than 5 percent of the average value of the dependent variable), and the t statistics are all greater than 2.0, except for Size, for which the t statistic is 1.198.
AAG-ANP 3.58

Case Study: On the Go Stores 39
3.64 The standard error of $97,961 is less than the planned materiality of $150,000, which provides further confidence in the use of the regression. In contrast, if the standard error is greater than materiality, the auditor should consider limiting reliance on the regression.
3.65 Also the signs of the t statistics are in the expected direction. That is, each of the variables except variable 3 (a new store) is expected to have a positive relationship with the dependent variable: As the independent variable increases, the dependent variable is expected to increase. In contrast, for new stores, lower sales are expected, as indicated by the negative sign on variable three. Thus, both the amount and direction of the t statistics satisfy expectations. Overall, the precision of the regression is assessed to be quite good. The regression output contains additional information, but to obtain a concise and effective evaluation of the precision of the regression, the auditor can confine himself or herself a t this point to a consideration of the three statistics noted above.1
3.66 The auditor’s overall evaluation then, is that the regression in exhibit 3.9 is useful, because the statistical measures are good. Also, since one of the variables, Size, has an insignificant t statistic, it should be removed from the regression to potentially improve the standard error and the t statistics of the remaining variables. This is done in exhibit 3.10. The standard error becomes slightly worse ($99,138 rather than $97,961), but the t statistics improve overall. Although judgment is involved, the auditor is likely to prefer the second regression in exhibit 3.10 because the relatively poor variable, Size, is removed, and the remaining t statistics are improved.
Identification, Investigation, and Evaluation (Phases II to IV)3.67 To examine the stores for the completeness and existence of sales,
the auditor first identifies stores with large prediction errors (labeled the “residuals” in the regression output), that is, the difference between the actual sales and predicted sales for each store. A common approach is to identify and focus on the largest few residuals. In particular, the auditor should choose all stores that have residuals greater than the standard error. The total number of stores to pick depends on the number of large residuals. The more stores with large residuals, the more stores should be selected.
3.68 Because the auditor in this case is looking for overstatements, the positive residuals are important; stores with positive residuals are those for which the regression predicts a lower level of sales than the actual number, a potential overstatement. Exhibit 3.10 shows that the largest positive residuals are at store nos. 4, 8, and 18. The analysis points to beginning further investigation (if any) at stores 4, 8 and 18, because the regression shows them to be the most out of line with the other stores, based on the relationships in the data for these four independent variables.
3.69 Once the stores have been identified, the auditor begins a further analytical investigation. The goal of the additional analysis is to explain why
1 T o further study the validity of the model, the regression can be run on a portion of the data and compared with the model for the entire data set. This was done using only the first eleven stores, and the results are comparable to that shown in exhibit 3.9. The statistical measures are similar to those in exhibit 3.9, except that across the board, all the measures are not as good (for example, the t statistics are 1,78, 2.32, -3.84, 4.30, and 2.09 for each of the independent variables respectively, in contrast to t statistics of 4.5, 5.98, -4.47, 8.49, and 1.198 in exhibit 3.9). The decline in the statistical measures is due largely to the relatively small number of data points. Generally, the larger the number of data points, the better the statistical measures will be.
AAG-ANP 3.69

40 Analytical Procedures
these four stores are out of line in comparison with the others. The further analytics can be based on product line analysis or more detailed analysis of the predictor factors (that is, for new stores, how many months they were open). For example, On the Go Stores sales can be divided into the product lines: grocery and other merchandise, beer and wine, lottery, and gasoline. A more detailed analytical study can help explain why a store is out of line. For example, the analytics might show that store no. 8’s sales are unusual because of an unusually large amount of sales of beer and wine. The explanations derived in this manner are then taken to management as a basis for inquiry, to corroborate the explanations found in the analytics or to discover new explanations. For example, management might respond that the unusual sales for store no. 8 are not likely due to beer and wine sales, but rather to a construction project near the store, which increased traffic a t the store and increased sales significantly. Management’s explanations are corroborated by further analytics, inquiry, or testing.
Use of Regression in Review Engagements3.70 Regression analysis can be used in the same manner for review
engagements, to direct attention to accounts or to areas (that is, stores) where there is the greatest potential for misstatement.
Regression and Fraud Detection3.71 Because of the potential for collusion in cases of fraud, the auditor
cannot rely on regression to detect fraud. However, because of its precision, regression is a useful resource for directing auditors’ attention to potential fraud. To illustrate, for example there are no material errors a t On the Go Stores, but there is a material fraud of $1,000,000 in which the management of On the Go has overstated net income by overstating sales by $1,000,000. The debit side of the misstatement is spread over selected balance sheet accounts. The credit side of the fraud is $250,000 spread over sales at each of the four stores: store nos. 4 , 10, 12, and 22. On the Go’s management chose these four stores because they have the lowest merchandise levels of the twenty-three stores, and their expectation was that the auditor was unlikely to select the stores with the smallest inventories for detail tests. The auditor has identified certain risk factors that indicate the potential for fraud and is planning to use regression as one part of the audit plan to satisfy the auditor’s responsibility under SAS No. 82, Consideration o f Fraud in a Financial Statement Audit (AICPA, Professional Standards, vol. 1, AU sec. 316).
3.72 The results of the regression, now including the fraud in the four stores, is shown in exhibit 3.11. Note that the R squared, standard error, and t statistics are still quite good, though the effect of the fraud is to reduce the overall precision of the regression slightly.2 The analysis of the residuals shows the following. Suppose the auditor were to pick the four stores with the largest positive residuals to investigate for fraud. This strategy would pick store nos.4, 8 , 18, and 22. Two of the four (store nos. 4 and 22) have fraudulent sales,
2 The important point here is that a cross-sectional regression with poor statistical measures can be a signal of potential fraud. Although poor statistical measures are most likely due to modeling difficulties (missing independent variables, inaccurate data, and unstable data), it can also be due to fraud. The effect of the fraud is to reduce the explanatory power of the independent variables and therefore to make the statistical measures less favorable.
AAG-ANP 3.70

Case Study: On the Go Stores 41
so the regression has correctly identified them as needing investigation. The regression also led to the choice of store nos. 8 and 18, for which there is no error or fraud. The unusually large residuals for store nos. 8 and 18 are likely due to factors not included in the regression—variables th a t would have caused these stores to have higher sales predictions if included—or other factors that are difficult to include in the regression such as turnover of management a t the store or short-term personnel problems.3
3.73 The regression failed to identify store nos. 10 and 12 as needing investigation. Overall then, the score of the regression is two “hits,” two “misses,” and two “false alarms”—probably a good overall performance given that the fraud is spread over four stores. If the fraud is spread over more than four stores, regression would perform even less poorly. However, it is important to note that trend and ratio analysis or reasonableness testing are less precise and therefore less likely to spot the fraud. For example, the next section examines how reasonableness testing would have performed in detecting this fraud.
Exhibit 3.11
Regression Results for the Fraud Data
SUMMARY OUTPUT Regression Statistics
Multiple R R Squared Adjusted R Squared Standard Error Observations
ANOVASignificance
d f SS M S F FRegression 4 5.01066E+12 1.233E+12 64.476419 2.01524E-10Residual 18 3.49709E+11 1.934E+09Total 22 5.36037E+12
StandardCoefficients Error t Stat P-Value Lower 95% Upper 95%
Intercept (652,163) 318,344 -2.049 0.055 (1,320,979) 16,653Inventory 11 5 2.207 0.041 1 21FTE 123,287 24,252 5.084 0.000 72,336 174,238New Store (182,473) 88,169 -2.070 0.053 (367,709) 2,764Sells Gas 893,157 89,108 10.023 0.000 705,949 1,080,365
3 There are two types of management fraud: (1) misstatement of the financial report (usually by top management), and (2) misappropriation of assets (theft, usually by lower level managers and employees). The application of regression illustrated here is the first type; the focus is on the discovery of overstatement. In contrast, if the objective is discovery of theft, the auditor would focus also on understatements and would therefore investigate those stores with large negative residuals. In exhibit 3.11, this would be store nos. 1, 3 , 13, and 14.
0.9668300330.9347603130.920262604139385.2781
23
AAG-ANP 3.73

42 Analytical Procedures
RESIDUAL OUTPUT
ObservationPredicted
Sales Residuals
1 1,037,549 (255,756)2 1,210,012 (63,574)3 1,368,133 (173,129)4 1,021,710 180,0745 1,966,587 14,8226 2,179,911 120,7607 2,089,689 (133,208)8 1,663,574 136,1399 1,706,391 114,250
10 926,192 98,76211 1,176,852 (17,848)12 1,280,675 108,80013 1,101,818 (153,296)14 2,155,736 (170,959)15 2,196,443 97,40416 2,083,253 (98,531)17 1,826,852 (28,516)18 2,302,245 182,25819 1,902,674 (65,274)20 1,604,104 5,28121 1,934,403 (60,174)22 818,117 130,21623 1,166,729 31,500
Reasonableness Testing by Store3.74 The reasonableness test based on square feet shown in exhibit 3.12
can be compared with the reasonableness test in exhibit 3.2. Store nos. 10 and 22 would not be indicated for fraud using this analysis because their sales-per- square foot values ($481 for store no. 10; $478 for store no. 22) are so near the national average of $490.
AAG-ANP 3.74

Exhibit 3.12
Case Study: On the Go Stores 43
Reasonableness lest Based on Sales per Square Foot With Fraud in Store Nos. 4 , 1 0 , 12, and 22
Store Square Foot Sales Sales/Square Foot13 4,000 781,793 195 New Store6 4,000 948,333 2374 4,000 1,146,438 287 New Store
18 4,000 1,198,229 30019 4,000 1,389,475 34711 2,500 948,522 37914 4,000 1,609,385 40212 2,500 1,024,954 4107 4,000 1,798,336 4508 4,000 1,799,713 4509 4,000 1,820,641 455
16 4,000 1,837,400 4592 2,500 1,159,004 464
15 4,000 1,874,229 46922 2,500 1,195,004 478 New Store10 2,500 1,201,784 481 New Store17 4,000 1,956,481 48921 4,000 1,984,777 49620 4,000 2,300,671 5755 4,000 2,484,503 6211 2,500 1,981,409 793 New Store
23 2,500 1,984,722 7943 2,500 2,293,847 918
Total 80,000 36,719,650
3.75 Also, using this analysis in exhibit 3.2, store no. 4’s low sales per square foot would probably be explained on the basis that it is a new store, and it therefore would not be investigated. Store no. 12 has a sales per square foot ($410) somewhat below the national average, but it is unlikely that it would be indicated for fraud using this approach because there are other stores with greater differences (store nos. 18, 19, 11, and 14). Thus, it appears that the reasonableness testing approach based on individual stores, as illustrated in exhibit 3.12, probably would not be as effective as regression analysis at detecting the stores with fraud. This might be explained in part by the lack of significance of the size (square feet) variable in exhibit 3.9. Because size did not appear as a significant variable in the regression, the sales-per-square foot ratio is not as reliable in this case.
AAG-ANP 3.75

Measures of Precision for a Regression Analysis 45
Appendix
Measures of Precision for a Regression Analysis
A.1 Unlike trend and ratio analysis or reasonableness testing, which provide no direct measures of the precision of their expectations, regression analysis provides direct, quantitative measures of the precision of its expectation. Many computer-based statistical software systems, such as Excel (used in this example), provide these measures as part of the regression results. There are three key measures of precision provided in the regression:
a. R squared
b. The t statistic
c. The standard error of the estimate
A.2 R squared is a number between 0 and 1 and measures the degree to which changes in the dependent variable can be estimated by changes in the independent variable(s). A more precise regression is one that has a relatively high R squared (close to 1). When viewed graphically, models with high R squared show the data points lying near to the regression line, whereas in low R squared models, the data points are somewhat dispersed, as demonstrated in exhibit A.1 and exhibit A.2. Determining an acceptable R squared is a m atter of judgment; most regression analyses involving financial data have R squared values above .5, and many have values in the .8 to .9 range.
Exhibit A -1
Regression With High R Squared
AAG-ANP APP

Exhibit A-2
46 Analytical Procedures
Regression With Low R Squared
A.3 The t statistic is interpreted very much like R squared. It is a measure of the degree to which each independent variable has a valid relationship with the dependent variable. A relatively small t statistic (while a m atter of judgment, most auditors look for the t statistic to be greater than 2) is an indication of little or no relationship between the independent and dependent variable. When the t statistic is relatively low, the auditor should consider removing that variable from the regression.
A.4 Also, the presence of a low t statistic on one or more of the independent variables is a common signal of what is called multicollinearity, which is present when two or more independent variables are highly correlated with each other. Correlation among variables, like R squared, means that a given variable tends to change predictably in the same (or opposite) direction for a given change in the other variable. Because there tend to be trends affecting many types of financial time-series data, it is common for accounting and operating data to be highly correlated. The effect of this condition is that the predictions of the regression might be less accurate. Thus, when the auditor has reason to believe that two or more of the independent variables are correlated, and the auditor observes relatively low t statistics, then the auditor should consider removing one or more of the correlated variables. One common approach in this situation is to perform a number of regression analyses with alternative combinations of the independent variables, and examine the different effects on R squared and the t statistics. To facilitate this, many software programs, such as Excel, can report the “correlation matrix,” which shows directly the degree of correlation between each pair of independent variables.
A.5 The standard error (SE) of the estimate is a measure of the accuracy of the regression’s estimates. It is a measure of the range around the regression line in which auditors can be reasonably sure that the unknown actual value will fall. For example, if the auditor predicts that an amount will be $4,500 for
AAG-ANP APP
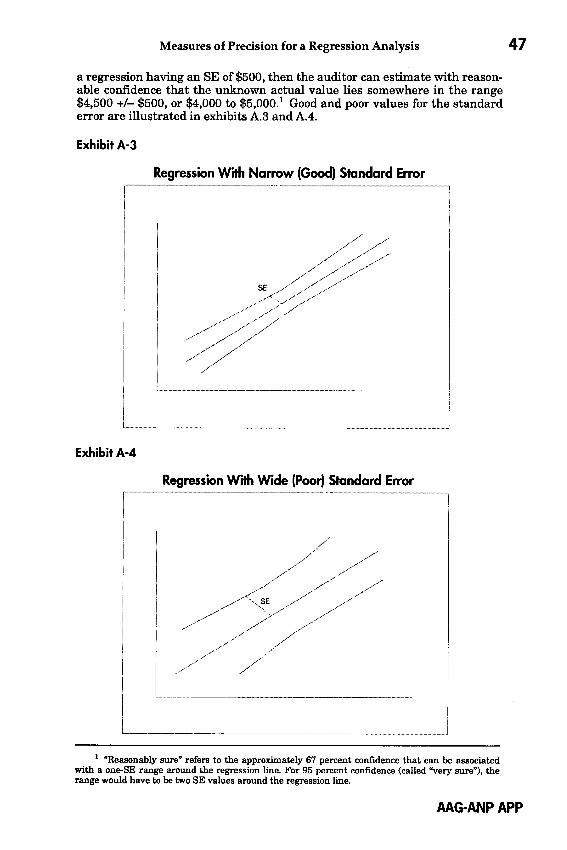
Measures of Precision for a Regression Analysis 47
a regression having an SE of $500, then the auditor can estimate with reasonable confidence that the unknown actual value lies somewhere in the range $4,500 +/- $500, or $4,000 to $5,000.1 Good and poor values for the standard error are illustrated in exhibits A.3 and A.4.
Exhibit A-3
Regression With Narrow (Good) Standard Error
Exhibit A-4
Regression With Wide (Poor) Standard Error
1 “Reasonably sure” refers to the approximately 67 percent confidence that can be associated with a one-SE range around the regression line. For 95 percent confidence (called “very sure”), the range would have to be two SE values around the regression line.
AAG-ANP APP

A.6 Because it is used to measure a range, the SE must be interpreted in terms of its relationship to the average amount of the dependent variable. If the SE is small relative to the dependent variable, the precision of the model can be assessed as relatively good. How small the SE value has to be relative to the mean of the dependent variable for a favorable precision evaluation is a m atter of judgement, but often the threshold of 10 percent is suggested.
48 Analytical Procedures
AAG-ANP APP

For additional copies of the Analytical Procedures Audit Guide or to automatically receive an annual update — immediately upon its release — call 1-888-777-7077 or log on to www.cpa2biz.com.
Additional Analytical Procedures Publications
General Audit Risk Alert (ARA)Find out about current economic, regulatory and professional developments before you perform your audit engagement. This ARA will make your audit planning process more efficient by giving you concise, relevant information that shows you how current developments may impact your clients and your audits.
2000/01 ARA $18.40 Dual AICPA+State Society member/$19.55 AICPA member/$20.70 State Society member/$23.00 nonmember (022260CV)
Audit and Accounting Guides — 2001 Industry GuidesWith conforming changes as of May 1, 2001.Each 2001 Guide is $42.40 Dual AICPA+State Society member/$45.05 AICPA member/ $47.70 State Society member/$53.00 nonmember.
• Audits of Agricultural Producers and Agricultural Cooperatives (012356CV)• Audits of Airlines (013185CV)• Brokers and Dealers in Securities (012183CV)• Audits of Casinos (013155CV)• Common Interest Realty Associations (012491CV)• Construction Contractors (012098CV)• Audits of Employee Benefit Plans (012341CV)• Audits of Entities With Oil and Gas Producing Activities (012108CV)• Federal Government Contractors (012443CV)• Health Care Organizations (012442CV)• Audits of Investment Companies (012365CV)• Life & Health Insurance Entities (012501CV)• Not-for-Profit Organizations (013394CV)• Audits of Property and Liability Insurance Cos. (011924CV)• Audits of State and Local Governmental Units (012062CV)
Audit and Accounting Guides — General GuidesEach Guide is $42.40 Dual AICPA+State Society member/$45.05 AICPA member/ $47.70 State Society member/$53.00 nonmember.
• Analytical Procedures (2001) (012541CV)• Audit Sampling (2001) (012530CV)• Auditing Derivative Instruments, Hedging Activities, and Investments
in Securities (2001) (012520CV)• Auditing Revenue in Certain Industries (2001) (012510CV)• Consideration of Internal Control in a Financial Statement Audit (1996) (012451CV)• Personal Financial Statements (2001) (011138CV)• Prospective Financial Information (1999) (011179CV)• Use of Real Estate Appraisal Information (1997) (013159CV)
To order call 1-888-777-7077, FAX to 1-800-362-5066 or log on to www.cpa2biz.com
CPA2Biz is a strategic partner of the AICPA and State CPA Societies
