analytical paper -
TRANSCRIPT

Catalogue no. 89-628-XIE — No. 002 ISSN 1915-0466ISBN 978-0-662-47181-3
Ana ly t ica l Paper
20062006Participation and Activity LimitationSurvey 2006: Analytical Report
2006
Social and Aboriginal Statistics Division Jean Talon Building, 7th Floor, 170 Tunney's Pasture Driveway
Telephone: 613-951-5979
Ottawa, Ontario K1A 0T6

How to obtain more information
For information about this product or the wide range of services and data available from Statistics Canada, visit our website at www.statcan.ca or contact us by e-mail at [email protected] or by telephone from 8:30 a.m. to 4:30 p.m. Monday to Friday:
Statistics Canada National Contact Centre Toll-free telephone (Canada and the United States): Inquiries line 1-800-263-1136 National telecommunications device for the hearing impaired 1-800-363-7629 Fax line 1-877-287-4369 Depository Services Program inquiries line 1-800-635-7943 Depository Services Program fax line 1-800-565-7757
Local or international calls: Inquiries line 1-613-951-8116 Fax line 1-613-951-0581
Information to access the product
This product, Catalogue no. 89-628-XIE, is available for free in electronic format. To obtain a single issue, visit our website at www.statcan.ca and select “Publications.”
Standards of service to the public
Statistics Canada is committed to serving its clients in a prompt, reliable and courteous manner. To this end, the Agency has developed standards of service which its employees observe in serving its clients. To obtain a copy of these service standards, please contact Statistics Canada toll free at 1-800-263-1136. The service standards are also published on www.statcan.ca under “About us” > “Providing services to Canadians.”

Statistics CanadaSocial and Aboriginal Statistics Division
Participation and Activity Limitation Survey 2006: Analytical Report
t 2006
Published by authority of the Minister responsible for Statistics Canada
© Minister of Industry, 2007
All rights reserved. The content of this electronic publication may be reproduced, in whole or in part, and by any means, without further permission from Statistics Canada, subject to the following conditions: that it be done solely for the purposes of private study, research, criticism, review or newspaper summary, and/or for non-commercial purposes; and that Statistics Canada be fully acknowledged as follows: Source (or “Adapted from”, if appropriate): Statistics Canada, year of publication, name of product, catalogue number, volume and issue numbers, reference period and page(s). Otherwise, no part of this publication may be reproduced, stored in a retrieval system or transmitted in any form, by any means—electronic, mechanical or photocopy—or for any purposes without prior written permission of Licensing Services, Client Services Division, Statistics Canada, Ottawa, Ontario, Canada K1A 0T6.
December 2007
Catalogue no. 89-628-XIE
ISBN 978-0-662-47181-3
Frequency: Occasional
Ottawa
Cette publication est aussi disponible en français (no 89-628-XIF au catalogue).
Note of appreciation
Canada owes the success of its statistical system to a long-standing partnership between Statistics Canada, the citizens of Canada, its businesses, governments and other institutions. Accurate and timely statistical information could not be produced without their continued cooperation and goodwill.
ISSN 1915-0466
The 2006 Participation and Activity Limitation Survey: Disability in Canada

Symbols The following standard symbols are used in Statistics Canada publications: . not available for any reference period .. not available for a specific reference period ... not applicable 0 true zero or a value rounded to zero 0s value rounded to 0 (zero) where there is a meaningful distinction between true zero and the value that
was rounded p preliminary r revised x suppressed to meet the confidentiality requirements of the Statistics Act E use with caution F too unreliable to be published Contributors Valérie Bizier, Phyllis Chong, Monique Foisy, Félix Fortin,,Julie Foucreault, Patric Fournier-Savard, Glenn Glover Richard Hodgins, Matthew Hoffarth, Krista Kowalchuk, Michèle Lanoue, Jessica Legault, Andrew MacKenzie, Denis Malo, Joey Mousseau, Shirin Roshanafshar, Paul Sereda, Melissa Sleightholm, Susan Stobert, Lucie Veilleux, Ziggy

Participation and Activity Limitation Survey 2006: Analytical Report
5 Statistics Canada – Catalogue no. 89-628-XIE
Table of contents Page
Introduction .........................................................................................................................................................................7
Text Box 1 Identifying persons with disabilities .............................................................................................................8
Prevalence of disability in Canada 2006 ...........................................................................................................................9
Activity limitations are more prevalent among older Canadians ........................................................................................9 Table 1 Prevalence of disability by age group, Canada, 2006 ......................................................................................9
Adult women report higher disability rates than men.......................................................................................................10 Chart 1 Disability rates, by age group and sex, Canada, 2006 ...................................................................................10
Growth in disability rates from 2001 to 2006 ..................................................................................................................11
Text Box 2 Changes in the Participation and Activity Limitation Survey target population, 2001 to 2006 ...................11
The Canadian population continues to age .....................................................................................................................11 Chart 2 Distribution of the Canadian population, by age group, 2001 and 2006 .........................................................12
An aging population accounts for some of the growth in the disability rate .....................................................................12 Chart 3 Disability rates for Canada, 2001, 2006, and 2006 age standardized ............................................................13
But population aging does not explain the whole increase in disability rate ....................................................................13 Chart 4 Disability rate by age group, Canada, 2001 and 2006....................................................................................14
Canadians’ perceptions of what constitutes a disability can change ...............................................................................14 Text box 3 Severity of disability...................................................................................................................................14
The number of persons reporting a mild disability increased by the greatest amount.....................................................15 Chart 5 Growth between 2001 and 2006 in the number of adults aged 15 and older reporting mild, moderate, severe and very severe disabilities, Canada ...............................................................................................................15
Provinces and territories: rates of disability ..................................................................................................................16
Quebec reports the lowest provincial disability rates.......................................................................................................16 Table 2 Population with and without disabilities, and disability rate by province, Canada, provinces, and territories, 2006 ............................................................................................................................................................................16
Provincial and territorial age distributions have a big impact on disability rates ..............................................................17 Chart 6 Age standardized and non-standardized disability rates, Canada, provinces and territories, 2006................17 Chart 7 Disability rate, by age group, Canada and provinces, 2006 ...........................................................................18
Fewer mild disabilities are reported in Quebec ...............................................................................................................18 Chart 8 Disability rate for adults aged 15 and older, Canada, provinces and severity, 2006.......................................19
Population aging explains some growth in provincial disability rates ..............................................................................19 Table 3 The 2006 Canada and provincial disability rates standardized to the 2001 population ..................................20 Chart 9 Disability rates for Canada, 2001, 2006 and 2006 age standardized .............................................................21
Profile of disability for children .......................................................................................................................................22
Some types of disabilities are not identified before age 5 ...............................................................................................22
The most widespread disabilities for children aged 0 to 4 are those related to a chronic health condition or a development delay ..........................................................................................................................................................22
The transition from home to school is a key time in identifying learning disabilities in children .......................................22 Table 4 Type of disabilities among children with disabilities, by age group, Canada, 2006 ........................................23
Among school-aged children, learning disabilities and chronic health conditions were the two most frequently reported disabilities .........................................................................................................................................................23
Speech, psychological and developmental disabilities are common in school-age children ...........................................23 Text box 4 Types of disabilities among children..........................................................................................................24 Chart 10 Types of disabilities among children with disabilities aged 5 to 14 years by sex, Canada, 2006..................25
Learning disabilities increase most for school age children between 2001 and 2006 .....................................................25
Participation and Activity Limitation Survey 2006: Analytical Report
Statistics Canada – Catalogue no. 89-628-X 6
Chart 11 Disability rates by type of disability for children aged 5 to 14 years, Canada, 2001 and 2006 .....................26
Most school-aged children with disabilities have multiple disabilities ..............................................................................27 Table 5 Number of disabilities reported for children aged 0 to 4 years with disabilities, Canada, 2006 ......................27 Table 6 Number of disabilities reported for children aged 5 to 14 years with disabilities, Canada, 2006 ....................27
There is a link between agility and mobility disabilities for children aged 5 to 14 ............................................................28
Multiple disabilities affect the severity of disability...........................................................................................................28
1.5% of all children in Canada have a severe or very severe disability...........................................................................28 Table 7 Severity of disability among children aged 0 to 4 years with disabilities, Canada, 2001 and 2006 ................28 Table 8 Severity of disability among children aged 5 to 14 years with disabilities, Canada, 2001 and 2006...............29
Profile of disability among adults....................................................................................................................................29
Disabilities related to pain, mobility and agility are the most common.............................................................................29 Table 9 Prevalence of disabilities in adults 15 years of age or older by type of disability, Canada, 2006 ...................29 Text box 5 Types of disabilities among adults.............................................................................................................30
Women are more likely to experience pain and mobility limitations ................................................................................31
Over a million adult Canadians have a hearing disability ................................................................................................31 Chart 12 Prevalence of disabilities in adults 15 years of age or older, by type of disability and sex, Canada, 2006 ...31
Nearly a half of a million Canadians report less visible disabilities..................................................................................32
The prevalence of most types of disabilities increases with age .....................................................................................32 Chart 13 Prevalence of disability in adults 15 years of age or older, by type of disability and age group, Canada, 2006..............................................................................................................................................................32 Chart 14 Prevalence of disabilities in adults 15 years of age or older by type of disability and age group, Canada, 2006 ............................................................................................................................................................................33
Learning disabilities in adults increased between 2001 and 2006...................................................................................34 Chart 15 Disability rate for adults 15 years of age or older, by type of disability, Canada 2001 and 2006 ..................34
Most adults with disabilities have multiple disabilities .....................................................................................................35 Table 10 Number of disabilities reported in adults 15 years of age or older with disabilities, Canada, 2006...............35
Severity of disability in 2006: mild, moderate, severe or very severe?............................................................................35
Nearly 2 million Canadians aged 15 and over have a severe or very severe disability ...................................................36 Table 11 Severity of disability among adults aged 15 years and over with disabilities, by sex, Canada, 2006 ...........36 Table 12 Disability rate for adults aged 15 years and over, by severity of disability, Canada, 2001 and 2006............36
The most common form of disability among working-age adults are activity limitations related to pain ..........................37
Women are more likely to report activity limitations related to pain and discomfort ........................................................37
Pain and discomfort-related activity limitations can be constant or cyclical.....................................................................37
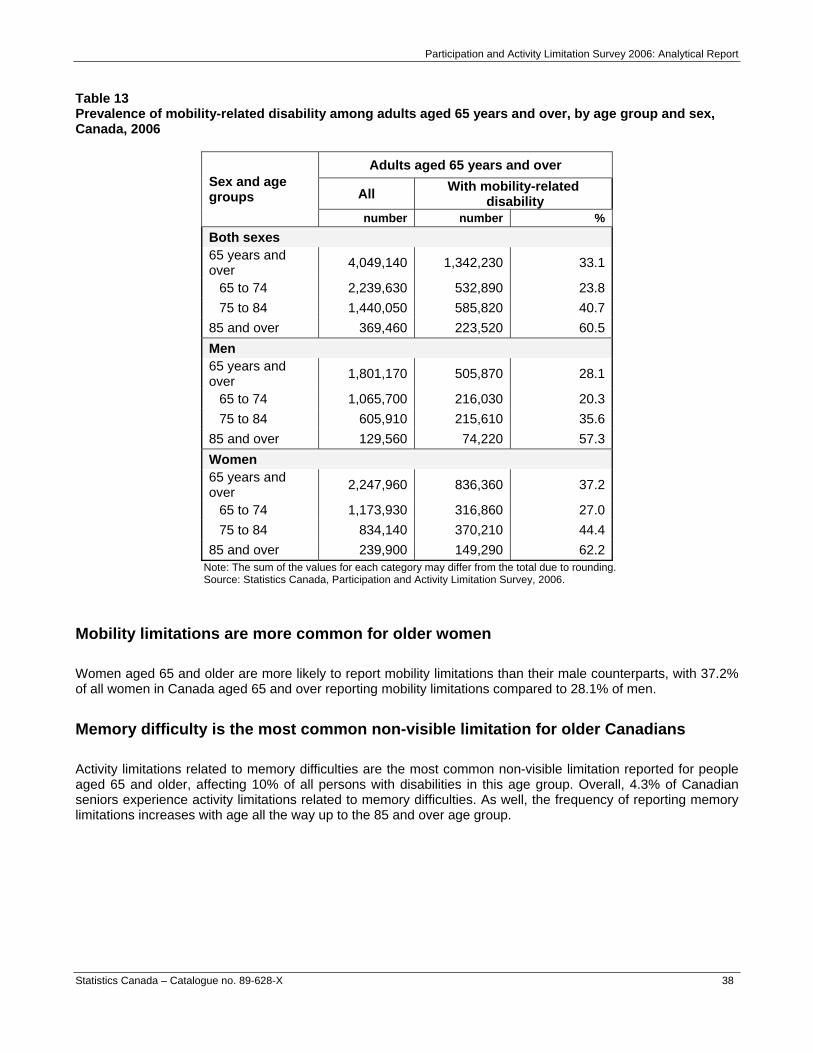
One in three Canadians aged 65 and over experience mobility limitations .....................................................................37 Table 13 Prevalence of mobility-related disability among adults aged 65 years and over, by age group and sex, Canada, 2006..............................................................................................................................................................38
Mobility limitations are more common for older women ..................................................................................................38
Memory difficulty is the most common non-visible limitation for older Canadians ...........................................................38

Participation and Activity Limitation Survey 2006: Analytical Report
7 Statistics Canada – Catalogue no. 89-628-XIE
Introduction
The Participation and Activity Limitation Survey (PALS) is a national survey designed to collect information on adults and children who have a disability, that is, whose everyday activities are limited because of a condition or health problem. Funded by Human Resources and Social Development Canada and conducted by Statistics Canada, PALS provides essential information on the prevalence of various disabilities, the supports for persons with disabilities, their employment profile, their income and their participation in society. This information will be used by all levels of government, by associations, by researchers and by nongovernmental organizations to support the planning of services needed by persons with activity limitations to participate fully in society. Data on persons with disabilities were last collected in 2001, when the previous PALS survey was conducted. The 2006 PALS will provide a measure of the change in the numbers and situations of persons with disabilities in the previous five years. As well, some new content has been introduced into the survey to reflect changing technology and emerging policy and program needs. This article is the first in a series of the PALS data releases. It contains survey results on the prevalence, type and severity of disability by age and sex. Further releases on topics such as care received by persons with disabilities, the impact on a family of having a child with a disability and employment barriers are planned for 2008. The text box Identifying persons with disabilities provides an overview of the survey methodology.
Participation and Activity Limitation Survey 2006: Analytical Report
Text Box 1 Identifying persons with disabilities
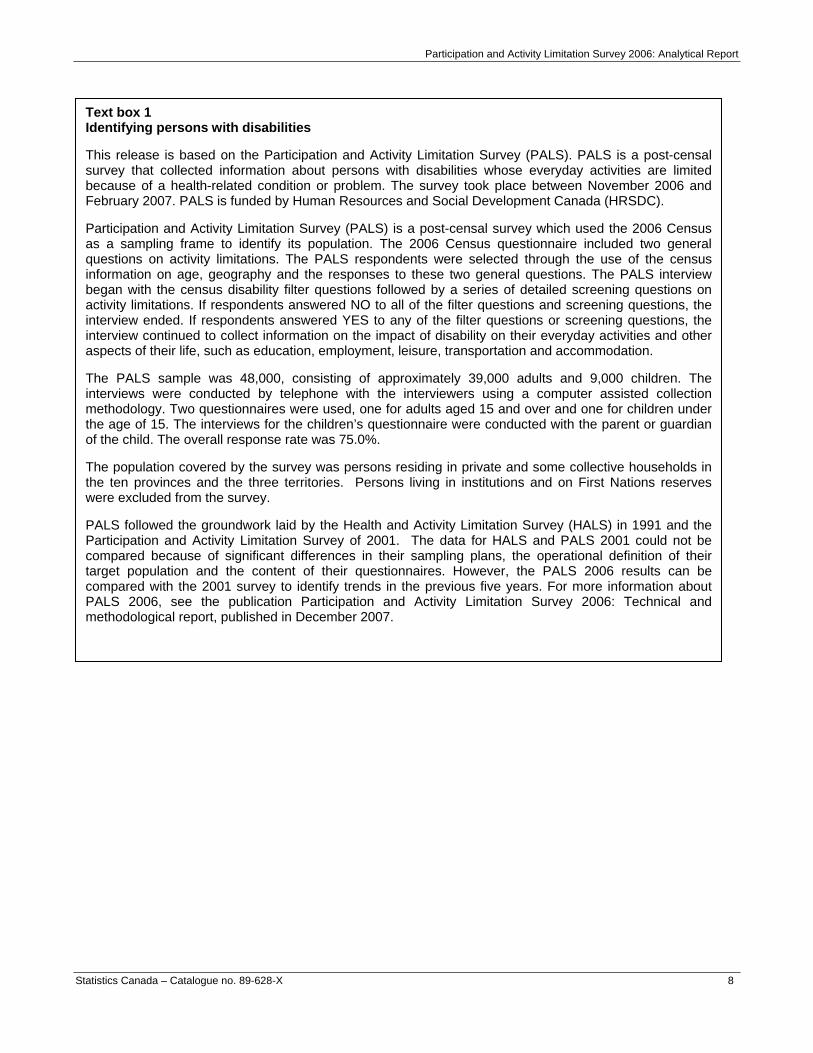
Text box 1 Identifying persons with disabilities This release is based on the Participation and Activity Limitation Survey (PALS). PALS is a post-censal survey that collected information about persons with disabilities whose everyday activities are limited because of a health-related condition or problem. The survey took place between November 2006 and February 2007. PALS is funded by Human Resources and Social Development Canada (HRSDC). Participation and Activity Limitation Survey (PALS) is a post-censal survey which used the 2006 Census as a sampling frame to identify its population. The 2006 Census questionnaire included two general questions on activity limitations. The PALS respondents were selected through the use of the census information on age, geography and the responses to these two general questions. The PALS interview began with the census disability filter questions followed by a series of detailed screening questions on activity limitations. If respondents answered NO to all of the filter questions and screening questions, the interview ended. If respondents answered YES to any of the filter questions or screening questions, the interview continued to collect information on the impact of disability on their everyday activities and other aspects of their life, such as education, employment, leisure, transportation and accommodation. The PALS sample was 48,000, consisting of approximately 39,000 adults and 9,000 children. The interviews were conducted by telephone with the interviewers using a computer assisted collection methodology. Two questionnaires were used, one for adults aged 15 and over and one for children under the age of 15. The interviews for the children’s questionnaire were conducted with the parent or guardian of the child. The overall response rate was 75.0%. The population covered by the survey was persons residing in private and some collective households in the ten provinces and the three territories. Persons living in institutions and on First Nations reserves were excluded from the survey. PALS followed the groundwork laid by the Health and Activity Limitation Survey (HALS) in 1991 and the Participation and Activity Limitation Survey of 2001. The data for HALS and PALS 2001 could not be compared because of significant differences in their sampling plans, the operational definition of their target population and the content of their questionnaires. However, the PALS 2006 results can be compared with the 2001 survey to identify trends in the previous five years. For more information about PALS 2006, see the publication Participation and Activity Limitation Survey 2006: Technical and methodological report, published in December 2007.
Statistics Canada – Catalogue no. 89-628-X 8

Participation and Activity Limitation Survey 2006: Analytical Report
9 Statistics Canada – Catalogue no. 89-628-XIE
Prevalence of disability in Canada 2006
In 2006, 4.4 million Canadians living in households reported having an activity limitation yielding a disability rate of 14.3% (see Table 1). This is an increase from the 2001 disability rate of 12.4%, when 3.6 million Canadians reported limitations in their everyday activities due to a physical or psychological condition or to a health condition. The increase is due to a number of factors, including aging of the population and changing reporting behaviours.
Activity limitations are more prevalent among older Canadians The survey results confirm that the disability rate in Canada increases steadily with age. Among children aged 0 to 14, 3.7% reported a disability, with this rate rising to nearly 11.5% among adults aged 15 to 64 and to 43.4% among persons aged 65 and over. In fact, more than half (56.3%) of persons aged 75 and over reported having an activity limitation. The rates of disabilities rose gradually as well within the working age population. For example, the youngest group aged 15 to 24 reported a disability rate of 4.7%, increasing to 6.1% for those aged 25 to 34. The rate continues to rise to 9.6% for those aged 35 to 44 and 15.1% for those aged 45 to 54. The largest proportion is found in the age group of 55 to 64 with a disability rate of 22.8%. Table 1 Prevalence of disability by age group, Canada, 2006 Prevalence of disability by age group, Canada, 2006
Total population
Population with
disabilities
Population without
disabilities Total disability
rateAge groups
number % Total - All ages 30,893,640 4,417,870 26,475,770 14.3Total - age under 15 5,471,360 202,350 5,269,010 3.7
0 to 4 1,656,040 27,540 1,628,500 1.75 to14 3,815,310 174,810 3,640,500 4.6
Total - aged 15 and over 25,422,280 4,215,530 21,206,760 16.6
15 to 64 21,373,150 2,457,940 18,915,210 11.515 to 24 4,147,080 195,500 3,951,580 4.725 to 34 3,942,260 239,600 3,702,660 6.135 to 44 4,747,620 456,930 4,290,690 9.645 to 54 4,912,800 740,990 4,171,810 15.155 to 64 3,623,390 824,920 2,798,470 22.8
65 and over 4,049,140 1,757,590 2,291,550 43.465 to 74 2,239,630 739,500 1,500,130 33.0
75 and over 1,809,500 1,018,090 791,420 56.3 Note: The sum of the values for each category may differ from the total due to rounding. Source: Statistics Canada, Participation and Activity Limitation Survey, 2006.

Participation and Activity Limitation Survey 2006: Analytical Report
Adult women report higher disability rates than men Overall, the disability rate increases with age for both men and women. Nevertheless, women were, in general, more likely (15.2%) to report an activity limitation than men (13.4%). However, this relationship is reversed among children aged 0 to 14. Boys in this age group were more likely to have activity limitations, with a rate of 4.6% compared to 2.7% for girls. Young men and women aged 15 to 24 have a similar disability rate. Differences in the rates begin again at age 25, when the prevalence of disability is slightly higher for women than for men. This trend continues into the senior years with a disability rate of approximately 54.0% for men and 57.8% for women over the age of 75 (see Chart 1). Chart 1 Disability rates, by age group and sex, Canada, 2006 Disability rates, by age group and sex, Canada, 2006
0
10
20
30
40
50
60
70
0 to 4 5 to 14 15 to 24 25 to 44 45 to 64 65 to 74 75 and over Totalage group
MalesFemales
percentage
Source: Statistics Canada, Participation and Activity Limitation Survey, 2006.
Statistics Canada – Catalogue no. 89-628-X 10

Participation and Activity Limitation Survey 2006: Analytical Report
Growth in disability rates from 2001 to 2006
Text Box 2 Changes in the Participation and Activity Limitation Survey target population, 2001 to 2006
Text box 2 Changes in the Participation and Activity Limitation Survey target population, 2001 to 2006 The Participation and Activity Limitation Survey (PALS) target population in 2006 differed slightly from that in 2001. The territories were included for the first time and were joined by persons living in Aboriginal communities who were covered in 2001 by the Aboriginal Peoples Survey (APS). Lastly, the method of collecting information on non-institutional collective dwellings, such as residences for senior citizens, was modified slightly for the 2006 Census. Unlike 2001, persons living in these types of residences were sent the long form of the 2006 Census-one out of every 5 households, comparable to regular, private dwellings-containing the activity limitation section. This newly available census information allowed these individuals to be included as part of the PALS 2006 target population. In order to compare the results from 2001 with those of the current PALS, a subset of the 2006 population was produced that excluded territories, persons from Aboriginal communities, and individuals living in residences for senior citizens. This allows direct comparisons between 2001 and 2006, in addition to analysis of the new 2006 target population. All comparisons made between 2001 and 2006 use these adjusted data.
Between 2001 and 2006 the number of persons who reported having a disability increased by three-quarters of a million people (+21.2%), reaching 4.4 million in 2006. At the same time, the non-disabled population experienced lesser growth, increasing by 3.3% to reach 26.2 million people. As a result, the national disability rate increased 1.9 percentage points from its level of 12.4% in 2001 to reach 14.3% in 2006.
The Canadian population continues to age Demographic shifts in the structure of the Canadian population have an effect on the disability rate. Because of the higher disability rates for older Canadians, an aging population will produce a higher overall disability rate without any change in reporting patterns. As reported in the 2006 Census report A Portrait of Canada by Age and Sex, released on July 17, 2007, Canada’s population continues to age as the baby boom generation approaches retirement age. Between 2001 and 2006, the median age of Canadians increased from 37.0 years to 38.3 years. Chart 2 shows the change in the percentage distribution of the population in Canada by age.
11 Statistics Canada – Catalogue no. 89-628-XIE

Participation and Activity Limitation Survey 2006: Analytical Report
Chart 2 Distribution of the Canadian population, by age group, 2001 and 2006 Distribution of the Canadian population, by age group, 2001 and 2006
0
5
10
15
20
25
30
35
0 to 14 15 to 24 25 to 44 45 to 64 65 to 74 75 and over
age group
2001 2006
percentage
Source: Statistics Canada, Census, 2001 and 2006.
An aging population accounts for some of the growth in the disability rate Aging of the population is one of the factors contributing to the increase in the disability rate since 2001. The extent of the contribution of aging to this increase can be determined by standardizing the population distribution of 2006 to that of 2001. The growth in the Canadian population can be used to estimate the increase in the 2001 disability rate due to an aging population. At the same time, the effect of changing disability profiles and reporting tendencies can be removed by holding constant the proportion of persons with disabilities in each age group.
Statistics Canada – Catalogue no. 89-628-X 12

Participation and Activity Limitation Survey 2006: Analytical Report
Chart 3 Disability rates for Canada, 2001, 2006, and 2006 age standardized Disability rates for Canada, 2001, 2006, and 2006 age standardized
12.4
13.5
14.3
10
12
14
16
2001 2006age standardized
2006
percentage
Source: Statistics Canada, Participation and Activity Limitation Survey, 2001 and 2006.
Chart 3 shows the 2006 disability rates standardized to the 2001 population; this provides an indication of the amount of the growth in disability that can be explained by population aging. To control for the impact of population aging on disability rates, comparisons over time are made using the "age-standardized disability rate”. The latter removes the effects of differences in the age structure of populations among areas and over time. Looking at the data for Canada, the disability rate in 2006 would have been 13.5% instead of 14.3% if population aging had not occurred. Thus, between 2001 and 2006, about 40% of the disability rate increase is explained by the aging of the Canadian population.
But population aging does not explain the whole increase in disability rate Although aging accounted for 0.8 percentage points of the 1.9 percentage point increase in disability rates over the period, disability rates increased for nearly all age groups (see Chart 4), suggesting that a change in disability profiles, reporting practices, or some combination of the two may also be at play.
13 Statistics Canada – Catalogue no. 89-628-XIE

Participation and Activity Limitation Survey 2006: Analytical Report
Chart 4 Disability rate by age group, Canada, 2001 and 2006 Disability rate by age group, Canada, 2001 and 2006
0
10
20
30
40
50
60
0 to 4 5 to 14 15 to 24 25 to 44 45 to 64 65 to 74 75 andover
Total
age group
2001
2006
percentage
Source: Statistics Canada, Participation and Activity Limitation Survey, 2001 and 2006.
Canadians’ perceptions of what constitutes a disability can change The Participation and Activity Limitation Survey (PALS) is a self-reported measure of activity limitation. How respondents perceive their limitations, and willingness to report them, greatly influences the type of answers they provide. Perceptions of disability are fluid and ever changing as society continues to evolve. Societal definitions of disability have changed dramatically throughout history, beginning with beliefs rooted in supernatural or religious sources. These were followed by medical models that focused solely on health conditions as the source of disability ignoring the broader environment of the individual. The 2006 PALS data suggest that Canadian society has continued to progress along this continuum towards increased social acceptance of the reporting of a disability. Text box 3 Severity of disability
Text box 3 Severity of disability An index measuring the severity of the disability was constructed based on the answers to the survey questions. Points were given according to the intensity and the frequency of the activity limitations reported by the respondent. A single score was computed for each type of disability. Each score was then standardized in order to have a value between 0 and 1. The final score is the average of the scores for each type of disability. Since the survey questions differ depending on the age of the respondent, a different scale was constructed for adults (15 years and over), for children under 5 and for children aged 5 to 14. Each scale was then divided into different severity levels. The scale for adults and for children aged 5 to 14 was divided into four groups (that is, mild, moderate, severe and very severe), while the scale for children under 5 was divided into two groups (that is, mild to moderate and severe to very severe).
Statistics Canada – Catalogue no. 89-628-X 14

Participation and Activity Limitation Survey 2006: Analytical Report
The number of persons reporting a mild disability increased by the greatest amount Persons with mild disabilities include individuals who may be on the margin between reporting and not reporting an activity limitation. If people’s tendency to report their particular health problem or physical or mental condition as an activity limitation increases, then the rate of mild disabilities would be expected to rise. Those with moderate and severe disabilities are less likely to not report their disability status. Chart 5 shows that over the five-year period between 2001 and 2006, the severity of disabilities for adults (age 15 and older) increased in a stepped fashion with the largest increase in the number of persons reporting mild disabilities (+26.6%) followed by moderate (+20.6%), severe (+19.2%), and very severe (+16.4%). Chart 5 Growth between 2001 and 2006 in the number of adults aged 15 and older reporting mild, moderate, severe and very severe disabilities, Canada Chart 5 Growth between 2001 and 2006 in the number of adults aged 15 and older reporting mild, moderate, severe and very severe disabilities, Canada
0
5
10
15
20
25
30
Mild Moderate Severe Very severe
severity of disability
percentage
Source: Statistics Canada, Participation and Activity Limitation Survey, 2001 and 2006.
15 Statistics Canada – Catalogue no. 89-628-XIE

Participation and Activity Limitation Survey 2006: Analytical Report
Statistics Canada – Catalogue no. 89-628-X 16
Provinces and territories: rates of disability
Quebec reports the lowest provincial disability rates The reporting of disability rates varied across the country, ranging from 10.4% in Quebec to 20.0% in Nova Scotia. Of the remaining provinces, those in the east had higher disability rates, on average, than those in the west. Ontario reported a disability rate (15.5%), slightly higher than the national rate. For the first time, in 2006, Participation and Activity Limitation Survey (PALS) was conducted in Canada’s three territories, the Yukon, the Northwest Territories, and Nunavut. Among Canada’s three territories, the Yukon had the highest disability rate at 13.5% followed by the Northwest Territories at 8.6% and Nunavut at 6.4%. Table 2 Population with and without disabilities, and disability rate by province, Canada, provinces, and territories, 2006 Table 2 Population with and without disabilities, and disability rate, Canada, provinces, and territories, 2006
Total population
Persons with
disabilities
Persons without
disabilities Disability
rateGeographic name
number % Canada (excluding territories) 30,793,810 4,408,470 26,385,340 14.3Canada (including territories) 30,893,640 4,417,870 26,475,770 14.3 Newfoundland and Labrador 498,920 74,510 424,410 14.9
Prince Edward Island 133,750 21,750 111,990 16.3Nova Scotia 893,790 179,100 714,690 20.0New Brunswick 711,440 122,540 588,900 17.2Quebec 7,396,960 768,140 6,628,830 10.4Ontario 11,970,000 1,853,570 10,116,420 15.5Manitoba 1,075,490 169,170 906,320 15.7Saskatchewan 905,510 145,230 760,290 16.0Alberta 3,212,360 435,820 2,776,540 13.6British Columbia 3,995,600 638,640 3,356,960 16.0Yukon 29,780 4,020 25,760 13.5Northwest Territories 40,730 3,500 37,230 8.6Nunavut 29,320 1,890 27,430 6.4
Note: The sum of the values for each category may differ from the total due to rounding. Source: Statistics Canada, Participation and Activity Limitation Survey, 2006.

Participation and Activity Limitation Survey 2006: Analytical Report
Provincial and territorial age distributions have a big impact on disability rates The age distributions in the Canadian provinces and territories vary considerably. Some areas, such as Alberta and the three territories, have populations that are much younger on average than other provinces such as Nova Scotia, New Brunswick and Saskatchewan. The rate of disability rises as the population ages so the demographic make-up of a province or territory has an impact on its overall disability rate. Chart 6 provides a comparison of the age standardized disability rates for the provinces and territories. The relatively young populations in the three territories and Alberta explain much of the inter-provincial variation but differences remain. Age standardized disability rates in Quebec remain the lowest at 10.2%, followed by Nunavut (12.8%) and the Northwest Territories (13.1%). The highest provincial age-standardized disability rate is in Nova Scotia (18.9%) followed by New Brunswick at 16.4%. Chart 6 Age standardized and non-standardized disability rates, Canada, provinces and territories, 2006 Chart 6 Age standardized and non-standardized disability rates, Canada, provinces and territories, 2006
0
5
10
15
20
25
Canada N.L. P.E.I. N.S. N.B. Que. Ont. Man. Sask. Alta. B.C. Y.T. N.W.T. N.T.
Standardized Non-standardized
percentage
Source: Statistics Canada, Participation and Activity Limitation Survey, 2006.
17 Statistics Canada – Catalogue no. 89-628-XIE

Participation and Activity Limitation Survey 2006: Analytical Report
Chart 7 Disability rate, by age group, Canada and provinces, 2006 Disability rate, by age group Canada and provinces, 2006
0
10
20
30
40
50
60
70
N.L. P.E.I. N.S. N.B. Que. Ont. Man. Sask. Alta. B.C.
percentage
25 to 44 45 to 64 65 to 74 75 and over
Source: Statistics Canada, Participation and Activity Limitation Survey, 2006.
Fewer mild disabilities are reported in Quebec The disability rate for Quebec was lower relative to the other provinces, not only in general but for each severity group (Chart 8). The only exception was among those with very severe disabilities with Alberta, Prince Edward Island, Saskatchewan and Quebec recording similar disability rates. The greatest difference, however, between the Quebec and the national proportions of people reporting a mild, moderate, severe, or very severe disability was among those reporting mild activity limitations. The rate of mild disabilities among residents of Quebec was two thirds of the Canadian rate of mild disabilities. The rates of the three more severe groups ranged from 73.8% to 76.4% of the national rate. This suggests that fewer persons with mild disabilities in Quebec are reporting their activity limitations.
Statistics Canada – Catalogue no. 89-628-X 18

Participation and Activity Limitation Survey 2006: Analytical Report
Chart 8 Disability rate for adults aged 15 and older, Canada, provinces and severity, 2006 Chart 8 Disability rate for adults aged 15 and older, Canada, provinces and severity, 2006
0
2
4
6
8
10
N.L. P.E.I. N.S. N.B. Que. Ont. Man. Sask. Alta. B.C.
Mild Moderate Severe Very severe
percentage
Source: Statistics Canada, Participation and Activity Limitation Survey, 2006.
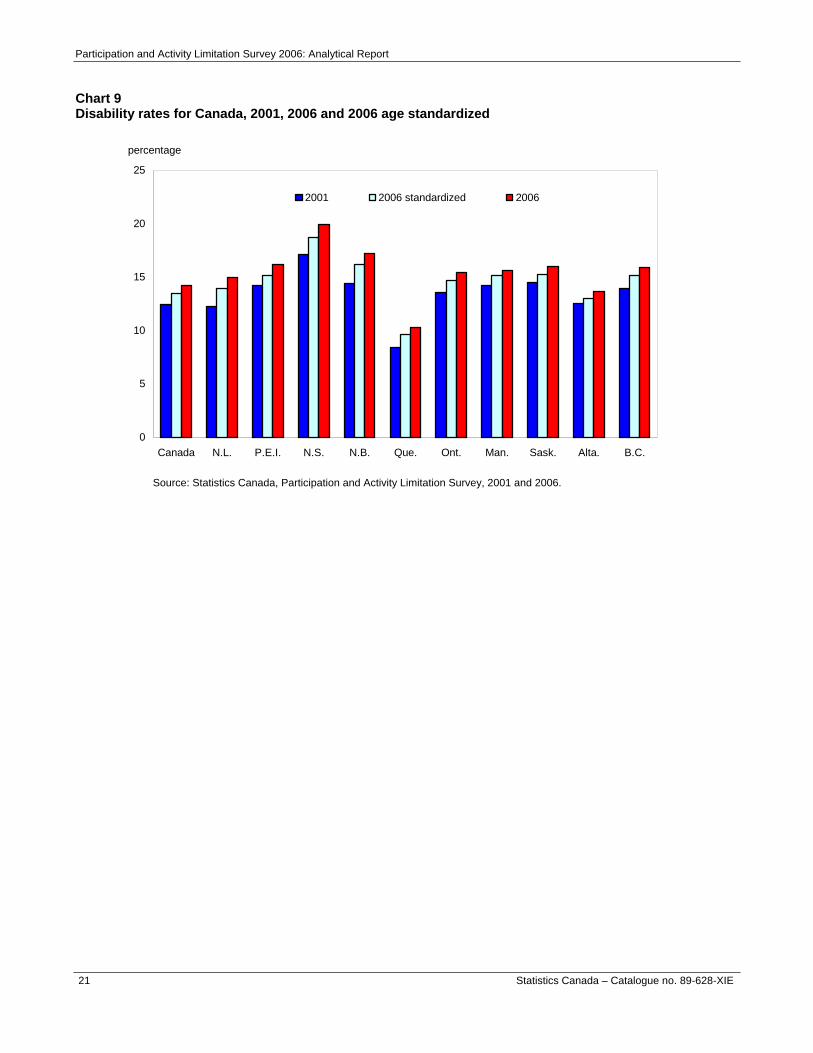
Population aging explains some growth in provincial disability rates Between 2001 and 2006, the provincial disability rates increased in all jurisdictions. These increases ranged from a low of 1.1 percentage points in Alberta to a high of 2.9 percentage points in Nova Scotia. Again, population aging explains part of this increase. Table 3 and Chart 9 show the disability rates by province, age standardized to the 2001 age distribution. Population aging explains more of the growth in the disability rate among the Atlantic Provinces, which have experienced a more significant change in their population distribution since 2001.
19 Statistics Canada – Catalogue no. 89-628-XIE

Participation and Activity Limitation Survey 2006: Analytical Report
Statistics Canada – Catalogue no. 89-628-X 20
Table 3 The 2006 Canada and provincial disability rates standardized to the 2001 population The 2006 Canada and provincial disability rates standardized to the 2001 population
2001 2006 standardized
2006 non standardized Province
percentage
Canada 12.4 13.5 14.3 Newfoundland and Labrador 12.3 13.8 14.9
Prince Edward Island 14.3 14.9 16.2
Nova Scotia 17.1 18.6 20.0
New Brunswick 14.4 16.0 17.2
Quebec 8.4 9.6 10.3
Ontario 13.5 14.6 15.4
Manitoba 14.2 15.1 15.7
Saskatchewan 14.5 15.2 16.0
Alberta 12.5 13.0 13.6
British Columbia 14.0 15.0 16.0 Source: Statistics Canada, Participation and Activity Limitation Survey, 2001 and 2006.
Participation and Activity Limitation Survey 2006: Analytical Report
Chart 9 Disability rates for Canada, 2001, 2006 and 2006 age standardized Disability rates for Canada, 2001, 2006 and 2006 age standardized
0
5
10
15
20
25
Canada N.L. P.E.I. N.S. N.B. Que. Ont. Man. Sask. Alta. B.C.
2001 2006 standardized 2006
percentage
Source: Statistics Canada, Participation and Activity Limitation Survey, 2001 and 2006.
21 Statistics Canada – Catalogue no. 89-628-XIE

Participation and Activity Limitation Survey 2006: Analytical Report
Statistics Canada – Catalogue no. 89-628-X 22
Profile of disability for children
Some types of disabilities are not identified before age 5 Considering the stages and the rate of children’s physical, emotional and intellectual development, it is sometimes difficult to identify certain types of disabilities in children aged 0 to 4. Disability in young children can often be described only as a delay in development, whether physical, intellectual or other. For children aged 0 to 4, the Participation and Activity Limitation Survey (PALS) identified the following five types of disabilities: hearing, seeing, chronic health conditions, delay, and other. For children aged 5 and over, the PALS identifies ten types of disabilities, substituting more specific types of disabilities for developmental delay, namely disability related to speech, mobility, agility or a psychological condition, as well as learning and developmental disabilities. For further information on the different types of disabilities, see the box entitled Type of disabilities among children.
The most widespread disabilities for children aged 0 to 4 are those related to a chronic health condition or a development delay In 2006, 69.8% of children aged 0 to 4 with one or more disabilities had a chronic health condition-related disability, or 1.2% of all Canadian children under the age of 5. Chronic disability was one of the leading types of disabilities for both boys and girls within the 0 to 4 age group, with 1.4% of all boys and 0.9% of all girls within this age group experiencing a chronic health condition-related disability. The most common chronic conditions that were reported were asthma or severe allergies, attention deficit disorder with or without hyperactivity (ADD/ADHD) and autism. Some other conditions identified by Participation and Activity Limitation Survey (PALS) include cerebral palsy, migraines, complex medical care needs and heart conditions. Chronic health conditions that do not cause activity limitations are not considered a disability for the purpose of the PALS. The disability rate for this age group did not change substantially from 2001 to 2006, nor did their most common type of disability.
The transition from home to school is a key time in identifying learning disabilities in children Learning disabilities are not always apparent until the child begins school and these difficulties are often diagnosed within the school setting. At the same time, the school system can provide specialized resources and services that may help to reduce activity limitations, such as those associated with speech difficulties.

Participation and Activity Limitation Survey 2006: Analytical Report
23 Statistics Canada – Catalogue no. 89-628-XIE
Table 4 Type of disabilities among children with disabilities, by age group, Canada, 2006 Type of disabilities among children with disabilities, by age group, Canada, 2006
Age groups 0 to 4 years 5 to 14 years Total Type of
disability number % number % number %
All categories 27,540 100.0 174,810 100.0 202,350 100.0
Hearing1 3,270 E 11.9 E 20,020 11.5 23,290 11.5
Seeing1 3,030 E 11.0 E 16,680 9.5 19,710 9.7
Speech2 … … 78,240 44.8 78,240 44.8
Mobility2 … … 23,160 13.2 23,160 13.2
Agility2 … … 37,240 21.3 37,240 21.3
Learning2 … … 121,080 69.3 121,080 69.3
Developmental2 … … 53,740 30.7 53,740 30.7
Psychological2 … … 60,310 34.5 60,310 34.5
Delay3 17,090 62.1 … … 17,090 62.1
Chronic1 19,230 69.8 116,340 66.6 135,570 67.0
Other1 1,810 E 6.6 E 6,290 3.6 8,100 4.0Note: The sum of the categories is greater than the population with disabilities because persons could report more than on type of disability. 1. Applies to all children under 15. 2. Applies to all children aged 5 to 14. 3. Applies to children aged 0 to 4. E use with caution … not applicable
Source: Statistics Canada, Participation and Activity Limitation Survey, 2006.
Among school-aged children, learning disabilities and chronic health conditions were the two most frequently reported disabilities In 2006, a disability related to learning affected 121,080 children aged 5 to 14. This represents 3.2% of all children aged 5 to 14 in Canada. Learning disabilities (69.3%) and chronic health conditions (66.6% were reported most often among those with one or more disabilities. Learning and chronic disabilities were the leading types of disabilities reported for boys within this age group, with 4.1% of all boys experiencing a learning disability and 3.8% of all boys experiencing a chronic disability. Girls aged 5 to 14 were also likely to experience either chronic health problem-related disabilities or learning disabilities (2.2% for each disability type).
Speech, psychological and developmental disabilities are common in school-age children In 2006, 44.8% of children aged 5 to 14 with one or more disabilities reported a speech disability, making it the third most prevalent disability among this age group. This means that about 78,240 Canadian school-age children experienced a speech disability. Other commonly reported disabilities among school-aged children with disabilities were: psychological disabilities (34.5%) developmental (30.7%) and agility-related disabilities (21.3%). Of all school-age Canadian children, 60,310 reported a psychological disability, whereas 53,740 and 37,240 reported developmental and agility-related disabilities, respectively.

Participation and Activity Limitation Survey 2006: Analytical Report
Text box 4 Types of disabilities among children
Text box 4 Types of disabilities among children The Participation and Activity Limitation Survey (PALS) survey questions allow the identification of the following types of disabilities among children under 15: Hearing*: Difficulty hearing. Seeing*: Difficulty seeing. Speech**: Difficulty speaking and/or being understood. Mobility**: Difficulty walking. This means walking on a flat firm surface, such as a sidewalk or floor. Agility1**: Difficulty using hands or fingers to grasp or hold small objects, such as a pencil or scissors. Learning**: Difficulty learning due to the presence of a condition, such as attention problems, hyperactivity or dyslexia, whether or not the condition was diagnosed by a teacher, doctor or other health professional. Developmental delay***: Child has a delay in his/her development; a physical, intellectual or another type of delay. Developmental disability or disorder**: Cognitive limitations due to the presence of a developmental disability or disorder, such as Down syndrome, autism or mental impairment caused by a lack of oxygen at birth. Psychological**: Limited in the amount or kind of activities that one can do due to the presence of an emotional, psychological or behavioural condition. Chronic condition*: Limited in the amount or kind of activities that one can do due to the presence of one or more chronic health conditions that have lasted or are expected to last six months or more and that have been diagnosed by a health professional. Examples of chronic conditions are asthma or severe allergies, heart condition or disease, kidney condition or disease, cancer, epilepsy, cerebral palsy, Spina Bifida, Cystic Fibrosis, Muscular Dystrophy, Fetal Alcohol Syndrome, etc. Other2*: The type of disability is ‘other’ if the respondent answered YES to the general questions on activity limitations, but did not provide any YES to the questions about type of disability that followed. ________________________________________________
1. In 2006 the disability type ‘dexterity’ was renamed ‘agility’. 2. In 2006 the disability type ‘unknown’ was renamed ‘other’.
* Applicable to all children under 15 ** Applicable to children aged 5 to 14 *** Applicable to children under 5
Aside from children who reported having one of the above-listed disabilities, 3.6% of activity-limited children aged 5 to 14, or, 0.2% of all Canadian children of this age group reported another disability that the 2006 Participation and Activity Limitation Survey (PALS) did not target specifically.
Statistics Canada – Catalogue no. 89-628-X 24

Participation and Activity Limitation Survey 2006: Analytical Report
Chart 10 Types of disabilities among children with disabilities aged 5 to 14 years by sex, Canada, 2006 Types of disabilities among children with disabilities aged 5 to 14 years, by sex, Canada, 2006
0 10 20 30 40 50 60 70 80
Other
Seeing
Mobility
Hearing
Agility
Developmental
Psychological
Speech
Chronic
Learning
percentage
BoysGirls
Source: Statistics Canada, Participation and Activity Limitation Survey, 2006.
Learning disabilities increase most for school age children between 2001 and 2006 The disability rate for children aged 5 to 14 increased from 4.0% in 2001 to 4.6% in 2006. The increase in learning disabilities (from 2.6% to 3.2% of school-aged children) provided the largest part of the increase but chronic disabilities, psychological disabilities and speech disabilities all showed an increase of at least 0.3 percentage points. As seen in Chart 11, the rate for agility disabilities showed a small increase and the rate of seeing and hearing disabilities did not change for school-aged children.
25 Statistics Canada – Catalogue no. 89-628-XIE

Participation and Activity Limitation Survey 2006: Analytical Report
Chart 11 Disability rates by type of disability for children aged 5 to 14 years, Canada, 2001 and 2006 Chart 11 Disability rates by type of disability for children aged 5 to 14 years, Canada, 2001 and 2006
0 10 20 30 40 50 60 70 80
Other
Seeing
Mobility
Hearing
Agility
Developmental
Psychological
Speech
Chronic
Learning
percentage
20012006
Source: Statistics Canada, Participation and Activity Limitation Survey, 2001 and 2006.
Statistics Canada – Catalogue no. 89-628-X 26
Participation and Activity Limitation Survey 2006: Analytical Report
27 Statistics Canada – Catalogue no. 89-628-XIE
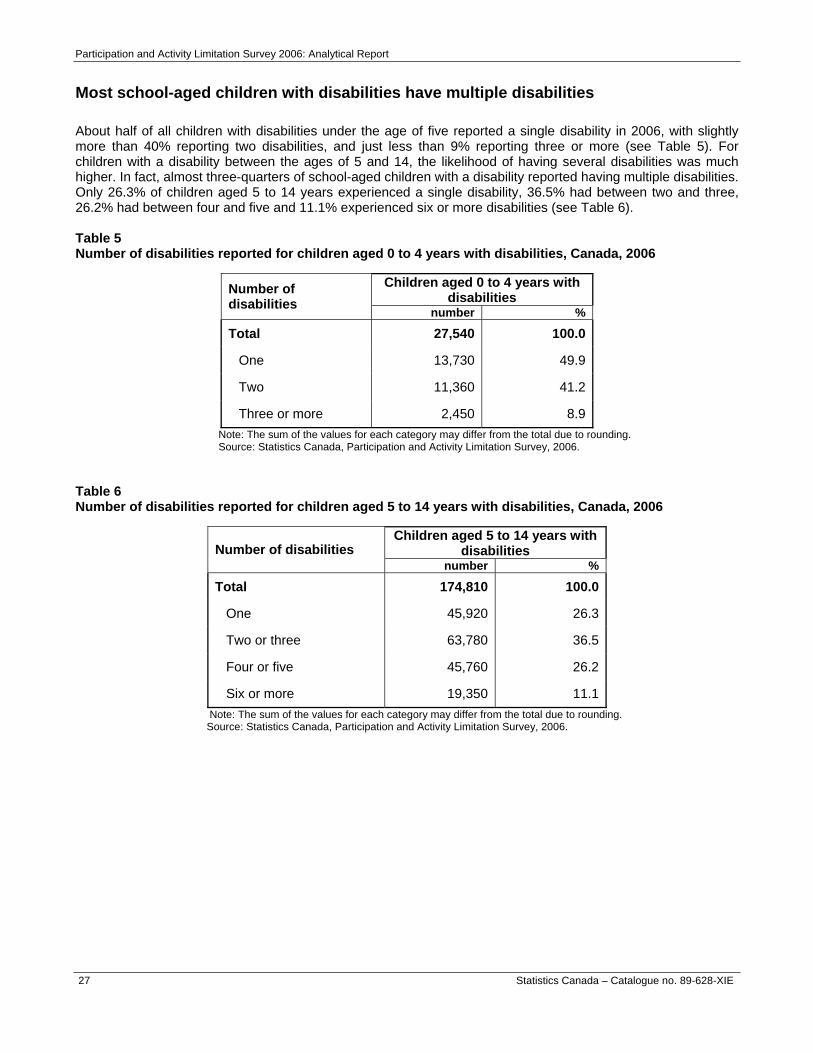
Most school-aged children with disabilities have multiple disabilities About half of all children with disabilities under the age of five reported a single disability in 2006, with slightly more than 40% reporting two disabilities, and just less than 9% reporting three or more (see Table 5). For children with a disability between the ages of 5 and 14, the likelihood of having several disabilities was much higher. In fact, almost three-quarters of school-aged children with a disability reported having multiple disabilities. Only 26.3% of children aged 5 to 14 years experienced a single disability, 36.5% had between two and three, 26.2% had between four and five and 11.1% experienced six or more disabilities (see Table 6). Table 5 Number of disabilities reported for children aged 0 to 4 years with disabilities, Canada, 2006 Number of disabilities reported for children aged 0 to 4 years with disabilities, Canada, 2006
Children aged 0 to 4 years with disabilities Number of
disabilities number %
Total 27,540 100.0
One 13,730 49.9
Two 11,360 41.2
Three or more 2,450 8.9 Note: The sum of the values for each category may differ from the total due to rounding. Source: Statistics Canada, Participation and Activity Limitation Survey, 2006.
Table 6 Number of disabilities reported for children aged 5 to 14 years with disabilities, Canada, 2006 Number of disabilities reported for children aged 5 to 14 years with disabilities, Canada, 2006
Children aged 5 to 14 years with disabilities Number of disabilities
number %
Total 174,810 100.0
One 45,920 26.3
Two or three 63,780 36.5
Four or five 45,760 26.2
Six or more 19,350 11.1 Note: The sum of the values for each category may differ from the total due to rounding. Source: Statistics Canada, Participation and Activity Limitation Survey, 2006.

Participation and Activity Limitation Survey 2006: Analytical Report
Statistics Canada – Catalogue no. 89-628-X 28
There is a link between agility and mobility disabilities for children aged 5 to 14 For 5 to 14-year-old children in Canada who reported one or more disabilities, there is a correlation between agility and mobility-related disabilities. That is, children from this age group who experienced a mobility disability were more likely to have an agility disability as well, and vice versa. This is the most common combination of multiple disabilities. In 2006, 21.3% of respondents reporting at least one disability reported an agility disability as well. Furthermore, 32.4% of respondents with an agility disability also reported a mobility disability. Of all respondents with at least one disability, 6.9% experienced both agility and mobility participation and activity limitations. Altogether, these individuals accounted for slightly less than 10.0% of all multiple disability combinations.
Multiple disabilities affect the severity of disability The number of disabilities influences the degree of severity of a child’s disability. In other words, the severity of overall disability depends not only on the severity of each type of disability, but also the number of disabilities experienced by an individual. Children with multiple disabilities tended to experience a higher overall degree of severity. For further information on the development of the Participation and Activity Limitation Survey (PALS) severity scale, see the box entitled Severity of Disability.
1.5% of all children in Canada have a severe or very severe disability Of the 202,350 Canadian children aged 0 to 14 with disabilities, 58.3% reported having a mild to moderate disability whereas 41.7% reported having a severe to very severe disability. As shown in Table 7, 63.5% of children with a disability aged 0 to 4 reported having a mild to moderate disability. For children with disabilities between the ages of 5 and 14, the greatest portion reported having a mild disability (33.5%) followed by moderate (24.0%), and severe (23.6%), and very severe (18.9%) disabilities (see Table 8). Table 7 Severity of disability among children aged 0 to 4 years with disabilities, Canada, 2001 and 2006 Severity of disability among children aged 0 to 4 years with disabilities, Canada, 2001 and 2006
Children aged 0 to 4 years with disabilities 2001 2006 Degree of severity
number % number %
Total 27,280 100.0 26,210 100.0
Mild to moderate 17,310 63.5 15,080 57.5
Severe to very severe 9,970 36.5 11,130 42.5 Source: Statistics Canada, Participation and Activity Limitation Survey, 2001 and 2006.

Participation and Activity Limitation Survey 2006: Analytical Report
29 Statistics Canada – Catalogue no. 89-628-XIE
Table 8 Severity of disability among children aged 5 to 14 years with disabilities, Canada, 2001 and 2006 Severity of disability among children aged 5 to 14 years with disabilities, Canada, 2001 and 2006
Children aged 5 to 14 years with disabilities 2001 2006 Degree of severity
number % number %
Total 173,180 100.0 154,720 100.0
Mild 57,950 33.5 49,730 32.1
Moderate 41,630 24.0 38,960 25.2
Severe 40,790 23.6 39,480 25.5
Very severe 32,810 18.9 26,550 17.2 Source: Statistics Canada, Participation and Activity Limitation Survey, 2001 and 2006.
Profile of disability among adults
Disabilities related to pain, mobility and agility are the most common Problems related to pain, mobility and agility affect the largest number of adults 15 years of age or older. Close to 3 million Canadian adults (approximately 11% of the total population aged 15 and over) reported one of these limitations. Not only are these the most prevalent disabilities, many of these Canadians experience more than one of these problems. Problems related to mobility, such as walking, climbing stairs, or carrying an object a short distance, are often associated with agility problems or with pain. Approximately 70% of Canadians who reported one of these three disabilities were also affected by the other two. Table 9 Prevalence of disabilities in adults 15 years of age or older by type of disability, Canada, 2006 Prevalence of disabilities in adults 15 years of age or older by type of disability, Canada, 2006
Adults 15 years of age or older Type of
disability number % Hearing 1,266,120 5.0Seeing 816,250 3.2Speech 479,740 1.9Mobility 2,923,000 11.5Agility 2,819,580 11.1Pain 2,965,650 11.7Learning 631,030 2.5Memory 495,990 2.0Developmental 136,570 0.5Psychological 589,470 2.3Other 119,390 0.5
Source: Statistics Canada, Participation and Activity Limitation Survey, 2006.

Participation and Activity Limitation Survey 2006: Analytical Report
Text box 5 Types of disabilities among adults
Text box 5 Types of disabilities among adults The questions in Participation and Activity Limitation Survey (PALS) enabled us to identify the following types of disabilities in adults (15 years of age or older): Hearing: Difficulty hearing what is being said in a conversation with one other person, in a conversation with three or more persons, or in a telephone conversation. Seeing: Difficulty seeing ordinary newsprint or clearly seeing someone’s face from 4 meters away (12 feet). Speech: Difficulty speaking and/or being understood. Mobility: Difficulty walking half a kilometre or up and down a flight of stairs, about 12 steps without resting, moving from one room to another, carrying an object of 5 kg (10 pounds) for 10 metres (30 feet) or standing for long periods. Agility: Difficulty bending, dressing and undressing oneself, getting into or out of bed, cutting own toenails, using fingers to grasp or handling objects, reaching in any direction (for example, above one’s head) or cutting own food. Pain: Limited in the amount or kind of activities that one can do because of a long-term pain that is constant or reoccurs from time to time (for example, recurrent back pain). Learning: Difficulty learning because of a condition, such as attention problems, hyperactivity or dyslexia, whether or not the condition was diagnosed by a teacher, doctor or other health professional. Memory: Limited in the amount or kind of activities that one can do due to frequent periods of confusion or difficulty remembering things. These difficulties may be associated with Alzheimer’s disease, brain injuries or other similar conditions. Developmental disabilities: Cognitive limitations due to an intellectual disability or developmental disorder such as Down’s syndrome, autism or an intellectual disability caused by a lack of oxygen at birth. Psychological: Limited in the amount or kind of activities that one can do due to the presence of an emotional, psychological or psychiatric condition, such as phobias, depression, schizophrenia, drinking or drug problems. Other1: The type of disability is ‘other’ if the respondent answered YES to the general questions on activity limitations, but did not provide any YES to the questions about type of disability that followed. ________________________________________________
1. In 2006 the disability type ‘unknown’ was renamed ‘other’.
Statistics Canada – Catalogue no. 89-628-X 30

Participation and Activity Limitation Survey 2006: Analytical Report
Women are more likely to experience pain and mobility limitations For all age groups, women were more likely to have a disability related to pain or mobility. With the exception of the youngest age groups, this is also true for disabilities related to agility. In 2006, among adults 15 years of age or older, women with disabilities related to mobility, pain or agility represented slightly more than 13% of the Canadian population, whereas men represented slightly over 9%. Interestingly, not only do the rates tend to increase with age, the gender gap does as well. For example, 38.5% of women aged 75 or older stated that pain limited their daily activities, whereas only 28.8% of men in the same age group made the same statement.
Over a million adult Canadians have a hearing disability With respect to sensory disorders (seeing, hearing or speech), approximately 1,265,000 adults (5.0%) reported that they had a hearing disability. Close to 815,000 (3.2%) adults had seeing disabilities and about 480,000 (1.9%) stated that they had a speech disability. The rates of sensory disability are similar for men and women until the age of 65 and over. Women aged 65 and over (10.1%) are more likely than men (7.8%) to have a seeing disability. Chart 12 Prevalence of disabilities in adults 15 years of age or older, by type of disability and sex, Canada, 2006 Prevalence of disabilities in adults 15 years of age or older, by type of disability and sex, Canada, 2006
0 2 4 6 8 10 12 14
Other
Developmental
Memory
Psychological
Speech
Learning
Seeing
Hearing
Mobility
Agility
Pain
percentage
16
MalesFemales
Source: Statistics Canada, Participation and Activity Limitation Survey, 2006.
31 Statistics Canada – Catalogue no. 89-628-XIE

Participation and Activity Limitation Survey 2006: Analytical Report
Nearly a half of a million Canadians report less visible disabilities As noted earlier, the 2006 Participation and Activity Limitation Survey (PALS) attempted to distinguish and recognize less visible types of disabilities such as those associated with psychological problems, memory, learning difficulties, and developmental disabilities. These types of disabilities are subject to special challenges in data collection as the measurement of these types of disabilities is based on the subjective perception of the respondent. This being said, in 2006, about half of a million adults 15 years of age or older reported disabilities of an emotional, psychological, or psychiatric nature (2.3%), memory problems or periods of confusion (2.0%), and learning disabilities (2.5%).
The prevalence of most types of disabilities increases with age As indicated by overall disability rates, most types of disabilities increase with age. In 2006, this proved to be true for disabilities associated with mobility, agility, hearing, seeing and pain. Thus, while disabilities related to mobility are present in less than 2% of Canadians between the ages of 15 and 24, they affect about 44% of people aged 75 and over (see Chart 13). Despite being much less pronounced, the increase in prevalence according to age is also present in memory and speech disorders. In both cases, the percentage of Canadians reporting these limitations rise from about 1% of adults between the ages of 15 and 24 to around 5% in those aged 75 and over. Chart 13 Prevalence of disability in adults 15 years of age or older, by type of disability and age group, Canada, 2006 Prevalence of disability in adults 15 years of age or older, by type of disability and age group, Canada, 2006
Hearing
Seeing
MobilityAgility
Pain
Memory
0
10
20
30
40
50
15 to 24 25 to 44 45 to 64 65 to 74 75 and over
age group
percentage
Source: Statistics Canada, Participation and Activity Limitation Survey, 2006.
Statistics Canada – Catalogue no. 89-628-X 32

Participation and Activity Limitation Survey 2006: Analytical Report
However, this pattern is not seen for all types of disabilities (see Chart 14). For example, disabilities associated with emotional, psychological, or psychiatric problems peak at 3.3% for adults aged 45 to 64 and then decrease in proportion to 2.1% for adults aged 75 and over. Learning disabilities do not fluctuate significantly by age, nor do developmental disabilities. In fact, developmental disabilities show a decrease with age. This may be because the Participation and Activity Limitation Survey (PALS) does not include Canadians living in institutions. As a result of the de-institutionalization that has occurred in Canada in the last thirty years, it is possible that more young people with developmental disabilities live at home and are therefore captured in the survey. Chart 14 Prevalence of disabilities in adults 15 years of age or older by type of disability and age group, Canada, 2006 Prevalence of disabilities in adults 15 years of age or older by type of disability and age group, Canada, 2006
E
0 5 10 15 20 25 30 35
Developmental
Other
Psychological
Learning
Speech
Memory
Seeing
Hearing
Pain
Agility
Mobility
percentage
15 to 2425 to 4445 to 6465 and over
E Use with caution
Source: Statistics Canada, Participation and Activity Limitation Survey, 2006.
33 Statistics Canada – Catalogue no. 89-628-XIE

Participation and Activity Limitation Survey 2006: Analytical Report
Learning disabilities in adults increased between 2001 and 2006 The disability rate for adults rose from 14.6% in 2001 to 16.5% in 2006. As shown in Chart 15, the rates for the majority of disability types increased. The exceptions were psychological and developmental disabilities and disabilities related to memory. The increase was especially important for learning disabilities. As shown above in Chart 14, learning disabilities are not more common in people as they age. Thus, population aging has no effect on the number of learning disabilities, unlike such disabilities as mobility, agility and pain that become much more common in an older population. Chart 15 Disability rate for adults 15 years of age or older, by type of disability, Canada 2001 and 2006 Disability rate for adults 15 years of age or older, by type of disability, Canada 2001 and 2006
0 2 4 6 8 10 12 14
Developmental
Speech
Memory
Psychological
Learning
Seeing
Hearing
Agility
Mobility
Pain
percentage
2001
2006
Source: Statistics Canada, Participation and Activity Limitation Survey, 2001 and 2006.
Statistics Canada – Catalogue no. 89-628-X 34

Participation and Activity Limitation Survey 2006: Analytical Report
35 Statistics Canada – Catalogue no. 89-628-XIE
Most adults with disabilities have multiple disabilities As discussed earlier for mobility, agility and pain, disability in Canada is often multi-faceted. Table 10 shows the numbers of Canadian adults who report more than one disability. In fact, 81.7% of adults living with disabilities have several, as opposed to only 18.4% who report having just one disability. Table 10 Number of disabilities reported in adults 15 years of age or older with disabilities, Canada, 2006 Number of disabilities reported in adults 15 years of age or older with disabilities, Canada, 2006
Adults 15 years of age or older with disabilities Number of
disabilities number %
Total 4,215,530 100.0
One 775,450 18.4
Two 711,410 16.9
Three 1,174,760 27.9
Four or five 1,216,840 28.9
Six or more 337,070 8.0 Note: The sum of the values for each category may differ from the total due to rounding. Source: Statistics Canada, Participation and Activity Limitation Survey, 2006.
Severity of disability in 2006: mild, moderate, severe or very severe? The severity of a disability can have profound effects on the types of limitations experienced by a person with a disability. The 2006 Participation and Activity Limitation Survey (PALS) separate the 4.2 million adults with disabilities into four levels of severity: mild, moderate, severe and very severe. The level of severity depends on the frequency and intensity of the limitations associated with the disability. Thus, the severity of a disability can be driven by two factors, the cumulative effect of multiple disabilities or the overall effect of one significant disability. For example, a person who has no difficulty walking and climbing stairs but cannot stand in line for more than twenty minutes would have a mild mobility-related disability. A person who can only move around in a wheelchair would have their mobility more severely limited, and one who is bedridden for a long term period would have a very severe mobility-related disability. The levels of severity for individual disabilities are combined to provide a measure of the overall level of severity. The Participation and Activity Limitation Survey (PALS) distinguishes ten types of disabilities among adults and the level of severity will increase with the number of disabilities affecting each individual. (For further information on the development of the severity scale, see the box entitled Severity of disability). Mild disabilities were the most common in Canada for 2006 with slightly more than one third (35.4%) of adults with disabilities experiencing mild limitations (see Table 11). Conversely, approximately one in eight (13.5%) adults with disabilities reported having a very severe limitation. This group grows to nearly 40% of adults with a disability when the severe and very severe categories are combined. Mild limitations were more common for men (37.9%) than women (33.4%). Conversely, women were more likely to report severe or very severe limitations (42.2%) compared to men (36.9%).

Participation and Activity Limitation Survey 2006: Analytical Report
Statistics Canada – Catalogue no. 89-628-X 36
Nearly 2 million Canadians aged 15 and over have a severe or very severe disability As shown in Table 12, the 2006 Participation and Activity Limitation Survey (PALS) reveals that 1.7 million people, or 6.6% of Canadians aged 15 and over had a severe or very severe disability. Moderate disabilities were reported by 4.1% of Canadians aged 15 and over (1,045,500 people) while 5.9% of that age group indicated a mild disability (1,492,580 people). The patterns of severity in disability were relatively unchanged for adults between 2001 and 2006. Table 11 Severity of disability among adults aged 15 years and over with disabilities, by sex, Canada, 2006 Severity of disability among adults aged 15 years and over with disabilities, by sex, Canada, 2006
Adults aged 15 years and over with disabilities Both sexes Men Women Degree of
severity number % number % number %
Total 4,215,530 100.0 1,895,480 100.0 2,320,040 100.0
Mild 1,492,580 35.4 717,960 37.9 774,630 33.4
Moderate 1,045,510 24.8 479,140 25.3 566,370 24.4
Severe 1,109,220 26.3 460,490 24.3 648,730 28.0
Very severe 568,220 13.5 237,900 12.6 330,320 14.2 Note: The sum of the values for each category may differ from the total due to rounding. Source: Statistics Canada, Participation and Activity Limitation Survey, 2006.
Table 12 Disability rate for adults aged 15 years and over, by severity of disability, Canada, 2001 and 2006 Disability rate for adults aged 15 years and over, by severity of disability, Canada, 2001 and 2006
Adults aged 15 years and over
2001 2006 Degree of severity
percentage
Mild 5.0 5.9
Moderate 3.6 4.1
Severe 3.9 4.4
Very severe 2.0 2.2 Source: Statistics Canada, Participation and Activity Limitation Survey, 2001 and 2006.
Participation and Activity Limitation Survey 2006: Analytical Report
37 Statistics Canada – Catalogue no. 89-628-XIE
The most common form of disability among working-age adults are activity limitations related to pain Pain and discomfort is the most common activity limitation for the working-age population with disabilities, affecting three out of four persons (74.4%). Looking at all working-age Canadians, this indicates that 8.6%, or 1.8 million persons, experience pain and discomfort-related disabilities.
Women are more likely to report activity limitations related to pain and discomfort Pain and discomfort-related activity limitations are much more common for working-age women than for men. Participation and Activity Limitation Survey (PALS) 2006 found that 79.0% of working-age women with disabilities reported pain-related limitations, compared to 69.3% of working-age males with disabilities. Looking at the Canadian population as a whole, 9.5% of working-age women report activity limitations related to pain versus 7.6% of males.
Pain and discomfort-related activity limitations can be constant or cyclical Pain and discomfort can be a constant or cyclical part of many people’s lives; for this reason, the Participation and Activity Limitation Survey (PALS) addressed not only constant pain but also recurring pain such as migraines or backaches. Overall, 72.1% of working-age people with pain-related limitations experience pain constantly while the remaining 27.9% experience recurring or cyclical episodes of pain.
One in three Canadians aged 65 and over experience mobility limitations The profile of people with disabilities changes as age increases; disability types that were prevalent at younger ages are replaced by different disability types, and the severity of the disability increases. This is not surprising given that older people experience increasing limitations to their daily activities due to declining health. For people with disabilities aged 65 and over, three out of four people (76.4%) reported a mobility limitation, replacing pain as the most common limitation. Considering Canada as a whole, more than 1.3 million people or 33.1% of all Canadians aged 65 or over reported a mobility limitation (see Table 13).
Participation and Activity Limitation Survey 2006: Analytical Report
Statistics Canada – Catalogue no. 89-628-X 38
Table 13 Prevalence of mobility-related disability among adults aged 65 years and over, by age group and sex, Canada, 2006 Prevalence of mobility-related disability among adults aged 65 years and over, by age group and sex, Canada, 2006
Adults aged 65 years and over
All With mobility-related disability
Sex and age groups
number number % Both sexes 65 years and over 4,049,140 1,342,230 33.1
65 to 74 2,239,630 532,890 23.8 75 to 84 1,440,050 585,820 40.7
85 and over 369,460 223,520 60.5 Men 65 years and over 1,801,170 505,870 28.1
65 to 74 1,065,700 216,030 20.3 75 to 84 605,910 215,610 35.6
85 and over 129,560 74,220 57.3 Women 65 years and over 2,247,960 836,360 37.2
65 to 74 1,173,930 316,860 27.0 75 to 84 834,140 370,210 44.4
85 and over 239,900 149,290 62.2 Note: The sum of the values for each category may differ from the total due to rounding. Source: Statistics Canada, Participation and Activity Limitation Survey, 2006.
Mobility limitations are more common for older women Women aged 65 and older are more likely to report mobility limitations than their male counterparts, with 37.2% of all women in Canada aged 65 and over reporting mobility limitations compared to 28.1% of men.
Memory difficulty is the most common non-visible limitation for older Canadians Activity limitations related to memory difficulties are the most common non-visible limitation reported for people aged 65 and older, affecting 10% of all persons with disabilities in this age group. Overall, 4.3% of Canadian seniors experience activity limitations related to memory difficulties. As well, the frequency of reporting memory limitations increases with age all the way up to the 85 and over age group.