analytical needs and services trade data rainer lanz oecd trade and agriculture directorate...
TRANSCRIPT

Analytical Needs and Services Analytical Needs and Services Trade DataTrade Data
Rainer LanzOECD Trade and Agriculture Directorate
Measuring and Enhancing Services Trade Data and Information Conference Washington, D.C., September 14, 2010

OECD Trade & Agriculture 2
1.What is Services Trade?
2.Example of an Analysis: Calculation of Trade Costs using the Gravity Model
3.International Trade in Services Statistics
4.Trade in Intermediate Services
5.Activities of Multinational Enterprises (AMNE)
6.Conclusions
OverviewOverview

OECD Trade & Agriculture 3
•The WTO General Agreement of Trade in Services (GATS) defines four modes of supply:
– Mode 1 – cross-border: “from the territory of one Member into the territory of any other Member”
– Mode 2 – consumption abroad: “in the territory of one Member to the service consumer of any other Member”
– Mode 3 – commercial presence: “by a service supplier of one Member, through commercial presence in the territory of any other Member”
– Mode 4 – movement of natural persons: “by a service supplier of one Member, through presence of natural persons of a Member in the territory of any other Member”
1. What is Services Trade?1. What is Services Trade?
OECD Trade & Agriculture 4
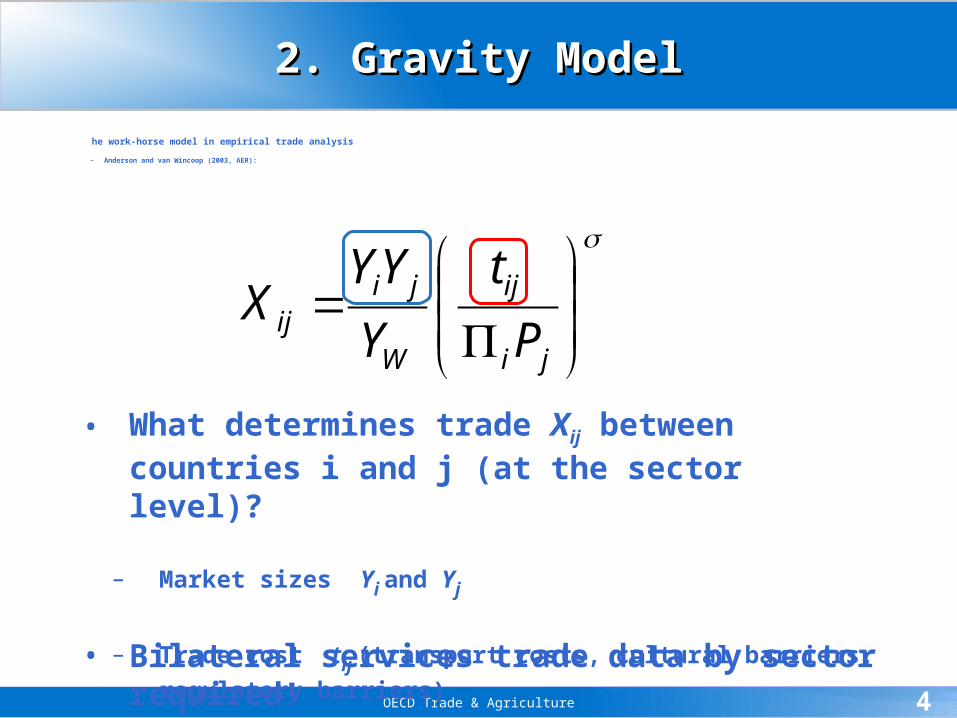
•The work-horse model in empirical trade analysis
– Anderson and van Wincoop (2003, AER):
2. Gravity Model2. Gravity Model
ji
ij
W
jiij P
t
Y
YYX
• What determines trade Xij between countries i and j (at the sector level)?
– Market sizes Yi and Yj
– Trade cost tij (transport costs, cultural barriers, regulatory barriers)
• Bilateral services trade data by sector required!
OECD Trade & Agriculture 5
2. An Application: Calculating Trade Costs2. An Application: Calculating Trade Costs
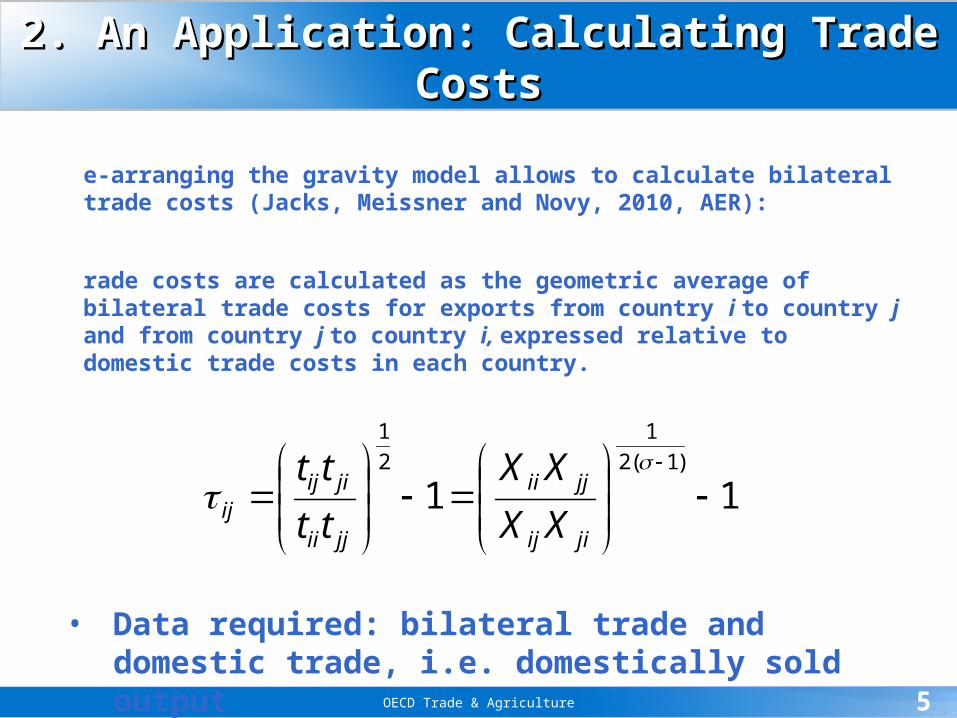
•Re-arranging the gravity model allows to calculate bilateral trade costs (Jacks, Meissner and Novy, 2010, AER):
•Trade costs are calculated as the geometric average of bilateral trade costs for exports from country i to country j and from country j to country i, expressed relative to domestic trade costs in each country.
11)1(2
1
2
1
jiij
jjii
jjii
jiijij XX
XX
tt
tt
• Data required: bilateral trade and domestic trade, i.e. domestically sold output

OECD Trade & Agriculture 6
2. World Trade Costs Indices, 1995-2007 (1995=100)2. World Trade Costs Indices, 1995-2007 (1995=100)
Source: Miroudot, Sauvage and Shepherd (2010)
85
90
95
100
105
Tra
de
cost
s in
dex
(19
95=
100
)
1995 2000 2005 2010Year
Goods Services
OECD Trade & Agriculture 7
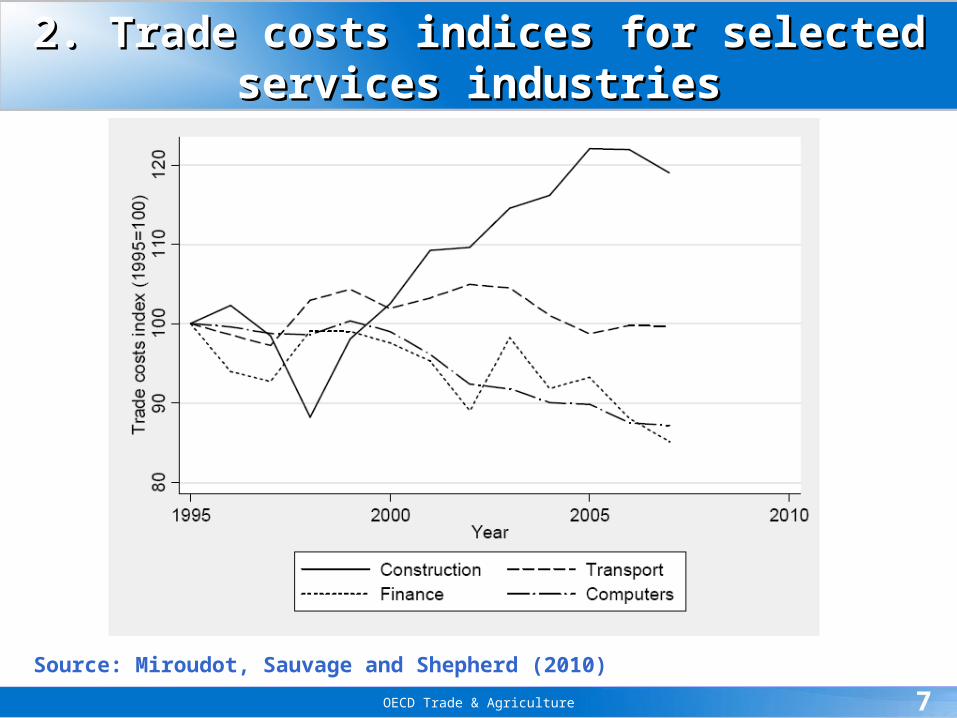
2. Trade costs indices for selected services industries2. Trade costs indices for selected services industries
Source: Miroudot, Sauvage and Shepherd (2010)

OECD Trade & Agriculture 8
•WTO GATS: Mode 1 – cross-border trade (and to some extent Modes 2 and 4)
•OECD Trade in Services by Partner Country (TiSP) database
– Covers all 32 OECD countries as reporters, 280 partner countries (regions) and 91 services sectors
– Follows the Extended Balance of Payments Services (EBOPS) classification which is the international standard
– Data issues
i. Bilateral coverage is limited
ii. Distinguishing between zero and missing trade is difficult
iii. The share of trade volume allocated to partner countries is small
iv. Confidentiality issues
3. International Services Trade Statistics (BoP) 3. International Services Trade Statistics (BoP)

OECD Trade & Agriculture 9
3.i. Number of Partner Countries for Exports in 20073.i. Number of Partner Countries for Exports in 2007
Bilateral coverage is limited, especially for disaggregated EBOPS categories
Country TotalTranspor-
tation TravelCommu-nication Computer
Other Business
Legal & Account.
Architect. & Engin.
Australia 35 35 31 19 25 28 Belgium 227 61 61 35 35 35 35 35Canada 59 4 60 2 2 2 2Czech Republic 228 62 62 38 38 38 38 38Germany 188 60 21 60 60 60 60 60Spain 63 34 32 2 2 2 1 1Finland 141 29 61 9 23 24 20 18France 223 61 61 35 34 35 35 35United Kingdom 228 62 62 1 1 1 1 1Ireland 181 61 61 32 22 33 34 24Italy 227 61 61 35 35 35 35 35Japan 34 34 33 33 32 34 Korea, Rep. 4 4 4 4 4 Netherlands 192 61 61 35 35 35 35 28Norway 42 42 39 15 15 15 15 15New Zealand 4 15 56 31 Poland 228 61 61 35 35 35 35 35Slovak Republic 210 65 65 39 39 39 39 39Sweden 229 61 62 35 35 35 35 35Turkey 1 1 40 1 1 1 1 1United States 22 35 35 OECD 146 44 46 27 29 33 29 29

OECD Trade & Agriculture 10
3.ii. Number of Partner Countries with “0” Exports in 20073.ii. Number of Partner Countries with “0” Exports in 2007
Countries vary strongly in the reporting of “0”s; when is data missing, when “0”?
Country TotalTranspor-
tation TravelCommu-nication Computer
Other Business
Legal & Account.
Architect. & Engin.
Australia 5 6 6 1 Belgium 51 1 8 2 14 23Canada Czech Republic 124 1 16 25 15 2 16 16Germany 27 2 3 1Spain 1 1 Finland 69 2 23 5 1 5 3France 45 2 8 15 8 10United Kingdom 32 Ireland 104 48 29 28 7 1 32 20Italy 49 1 12 22 16 9Japan 5 4 Korea, Rep. Netherlands 25 1 2 1 4Norway 2 7 4 6 7 1 7 5New Zealand 3 Poland 130 2 20 18 21 8 16 19Slovak Republic 143 15 13 31 24 10 24 30Sweden 57 2 30 5 2 2 2Turkey 1 1United States OECD 72 8 13 12 11 3 11 11

OECD Trade & Agriculture 11
3. iii. Share (%) of Exports allocated to Partners Countries in 20073. iii. Share (%) of Exports allocated to Partners Countries in 2007
For disaggregated EBOPS categories, only a small share of exports can be allocated to partner countries
Country TotalTranspor-
tation TravelCommu-nication Computer
Other Business
Legal & Account.
Architect. & Engin.
Australia 82 76 87 54 58 71 Belgium 92 94 98 31 16 35 25 13Canada 91 59 95 69 73 71 49Czech Republic 91 79 93 10 21 5 15 36Germany 92 92 84 98 97 96 97 92Spain 97 86 97 0 0 0 Finland 83 85 96 12 23 10 25 34France 97 85 96 22 37 40 36 35United Kingdom 99 93 91 0 0 0 0 0Ireland 91 97 92 5 13 26 22 5Italy 94 70 97 20 18 21 22 20Japan 92 89 96 96 98 98 Korea, Rep. 50 48 56 58 54 Netherlands 100 93 97 33 37 39 28 47Norway 96 94 100 31 23 38 17 30New Zealand 71 82 88 68 Poland 99 97 83 14 26 23 22 24Slovak Republic 99 99 97 11 20 11 9 8Sweden 94 94 90 26 25 38 35 50Turkey 87 United States 64 81 81 OECD 92 86 89 34 37 39 33 35
OECD Trade & Agriculture 12
•Important for the analysis of the international fragmentation of production, i.e. global value chains
•The UN Broad Economic Categories (BEC) classification allows identifying trade in intermediate goods
•No similar classification exists for services trade
•Standard input-output tables contain information on imported services inputs but not at the bilateral level
– Estimation of bilateral trade in intermediate services by Miroudot, Lanz and Ragoussis (2009)
– International input-output tables
» IDE-JETRO (Institute of Developing Economies)
» WIOD Project (World Input-Output Database)
4. Trade in Intermediate Services4. Trade in Intermediate Services
OECD Trade & Agriculture 13
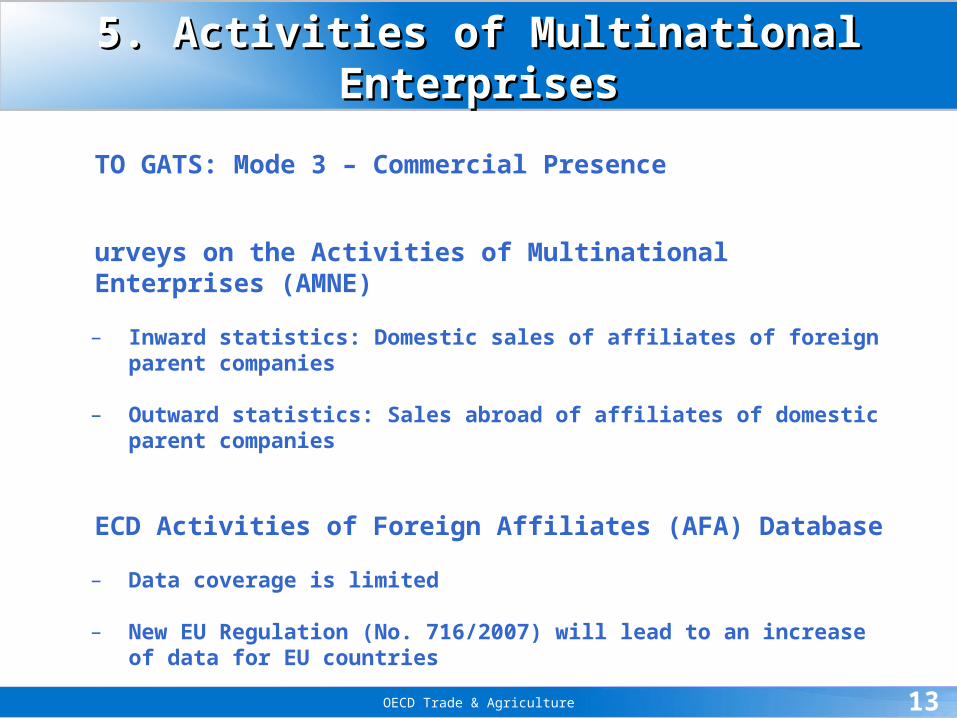
•WTO GATS: Mode 3 – Commercial Presence
•Surveys on the Activities of Multinational Enterprises (AMNE)
– Inward statistics: Domestic sales of affiliates of foreign parent companies
– Outward statistics: Sales abroad of affiliates of domestic parent companies
•OECD Activities of Foreign Affiliates (AFA) Database
– Data coverage is limited
– New EU Regulation (No. 716/2007) will lead to an increase of data for EU countries
5. Activities of Multinational Enterprises5. Activities of Multinational Enterprises
OECD Trade & Agriculture 14
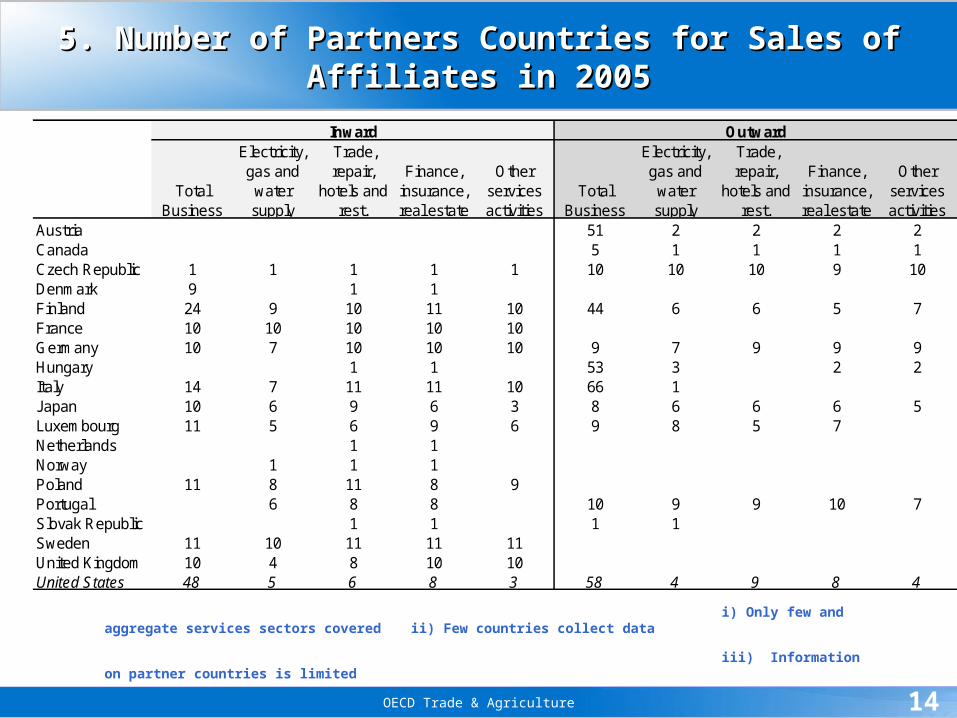
5. Number of Partners Countries for Sales of Affiliates in 20055. Number of Partners Countries for Sales of Affiliates in 2005
Total Business
Electricity, gas and
water supply
Trade, repair,
hotels and rest.
Finance, insurance, real estate
Other services activities
Total Business
Electricity, gas and
water supply
Trade, repair,
hotels and rest.
Finance, insurance, real estate
Other services activities
Austria 51 2 2 2 2Canada 5 1 1 1 1Czech Republic 1 1 1 1 1 10 10 10 9 10Denmark 9 1 1 Finland 24 9 10 11 10 44 6 6 5 7France 10 10 10 10 10Germany 10 7 10 10 10 9 7 9 9 9Hungary 1 1 53 3 2 2Italy 14 7 11 11 10 66 1 Japan 10 6 9 6 3 8 6 6 6 5Luxembourg 11 5 6 9 6 9 8 5 7 Netherlands 1 1 Norway 1 1 1 Poland 11 8 11 8 9Portugal 6 8 8 10 9 9 10 7Slovak Republic 1 1 1 1 Sweden 11 10 11 11 11United Kingdom 10 4 8 10 10United States 48 5 6 8 3 58 4 9 8 4
Inward Outward
i) Only few and aggregate services sectors covered ii) Few countries collect data
iii) Information on partner countries is limited

OECD Trade & Agriculture 15
•Using firm-level datasets to capture the importance of commercial presence in services and global value chains, e.g. ORBIS database from Bureau van Dijk
•Combining ownership information from international firm level data with vertical linkages from input-output tables allows distinguishing affiliates by type
•Distribution of affiliates in ORBIS according to the type of FDI (percentage, 2006)
5. Activities of Multinational Enterprises5. Activities of Multinational Enterprises
Manufacturing industriesHorizontal FDI 38.1%Vertical FDI 49.9%Complex FDI 12.0%
Services industriesHorizontal FDI 29.8%Vertical FDI 62.0%Complex FDI 8.2%
Percentage of affiliates
Source: Lanz and Miroudot, OECD (2010)

OECD Trade & Agriculture 16
•Need for bilateral services trade data at the sector (product) level following EBOPS to facilitate international comparisons
•Limited bilateral by sector coverage for international trade statistics and in particular for sales of foreign affiliates
– New EU regulation likely to increase data on foreign affiliate sales for EU countries
•Increasing trend to use firm level data to analyse global value chains and to understand how firms of different productivity levels are involved in trade
6. Conclusions6. Conclusions

OECD Trade & Agriculture 17
Thank you for your attention!Thank you for your attention!
www.oecd.org/trade