analytical methods for use within an evaluation...2 annex a analytical methods for use within an...
TRANSCRIPT

0
Magenta Book Annex A
Analytical methods for use within an evaluation
March 2020

1
Contents A1. Theory based methods for impact evaluation .................................................................. 3
A1.1. Qualitative Comparative Analysis (QCA) ........................................................ 4 A1.2. Realist evaluation ......................................................................................... 5 A1.3. Process Tracing ............................................................................................ 6 A1.4. Contribution Analysis ................................................................................... 7 A1.5. Bayesian Updating ....................................................................................... 8 A1.6. Contribution Tracing .................................................................................... 9 A1.7. Most Significant Change ............................................................................ 10 A1.8. Outcome harvesting ................................................................................... 11 A1.9. Simulation modelling ................................................................................. 12
A2. Experimental and Quasi experimental methods for impact evaluation ............................. 13
A2.1. Randomised Control Trials .......................................................................... 14 A2.2. Propensity Score Matching ......................................................................... 16 A2.3. Timing of events ........................................................................................ 18 A2.4. Interrupted time series analysis ................................................................... 19 A2.5. Instrumental variables ................................................................................ 20 A2.6. Synthetic Control Methods ......................................................................... 22 A2.7. Difference in Difference .............................................................................. 23 A2.8. Regression Discontinuity ............................................................................. 24
A3. Methods for value-for-money evaluation ...................................................................... 25
A3.1. Cost Benefit Analysis (CBA) ......................................................................... 26 A3.2. Cost effectiveness analysis .......................................................................... 27
A4. Methods for synthesis of existing evidence ................................................................... 28
A4.1. Systematic reviews ..................................................................................... 29 A4.2. Rapid evidence assessment ......................................................................... 30 A4.3. Meta-analysis ............................................................................................. 31 A4.4. Meta-ethnography ..................................................................................... 32 A4.5. Realist synthesis ......................................................................................... 34
A5. Generic research methods used in both process and impact evaluation ........................... 36
A5.1. Interviews and focus groups ....................................................................... 37 A5.2. Case Studies .............................................................................................. 39 A5.3. Surveys and polling .................................................................................... 40 A5.4. Output or performance monitoring ............................................................ 42 A5.5. Qualitative observational studies ................................................................. 43 A5.6. Consultative/deliberative methods .............................................................. 45

2
Annex A Analytical methods for use within an evaluationThis Annex provides some more information on the methods set out in Chapter 3 of the Magenta Book.
Methods are grouped into the following sections:
A1. Theory based methods for impact evaluation
A2. Experimental and quasi-experimental methods for impact evaluation
A3. Methods for value-for-money evaluation
A4. Methods for synthesis of existing evidence
A5. Generic research methods used in both process and impact evaluation

3
A1. Theory based methods for impact evaluation Theory based methods can be used for impact evaluation to address questions about whether the intervention caused an impact, how and why it occurred, how context may have influenced outcomes and help understand to what extent results are generalizable.
They allow attribution of causality, but none gives precise estimates of effect sizes.
Theory based methods can also be used to address process evaluation questions, with the evidence generated helping answer questions about how the intervention was delivered.
4
A1.1. Qualitative Comparative Analysis (QCA)
What is it?
Qualitative Comparative Analysis (QCA) is a pragmatic method to compare different aspects of an intervention and contextual factors to understand the different characteristics or combinations of characteristics which are associated with outcomes. It enables systematic comparison based on qualitative knowledge. Rather than examining the factors causing a specific outcome in depth as in a single case study, QCA focuses on identifying a variety of patterns. This allows for both complex causation (combinations of factors) and ‘equifinality’ (multiple causes of an outcome) to be accounted for.
How is it used?
It is useful when the context within which an intervention is implemented is likely to influence its impact. The nature of QCA makes it useful for complex fields where multiple factors may need to be in place to achieve a desired outcome. It can identify which factors are necessary for the success or failure of an intervention, and in what combination(s). It can be useful to understand why an intervention has worked in some contexts (such as areas) but not others. It could also be used to compare the efficacy of smaller interventions within a wider programme.
Factors of interest are first identified, for instance using a theory of change, before data on whether factors are present or not is collected. This can be measured as a binary attributes, although an ordinal ‘fuzzy scale’ can be used (e.g. 1: completely present, 0.75: more present than not…). Data can then be systematically compared, and combinations that are associated with the desired outcome can be identified. Specialised software to support QCA is available which can assist with this: See http://www.u.arizona.edu/~cragin/fsQCA
Examples of uses of QCA include research to better understand the factors that influence the success of ICT-based reporting to improve rural water supply sustainability (Welle et al. 2015), and an exploration of varying progress across local authority areas tackling health inequalities (Blackman, Wistow & Byrne 2011).
Pros and cons
Pros:
• A pragmatic method that can identify groups of causal factors that can reasonably beused in post hoc evaluation.
• QCA works best when data on all the cases of interest are available and the numberof cases is neither too small nor too large, around ten to fifty cases.
Cons:
• It can be used with larger numbers of cases however, depth of understanding will benecessarily reduced.
• It may be difficult to determine which cases represent more ‘success’ or ‘failure’ thanothers.
Sources:
• Blackman, T., Wistow, J. & Byrne, D. (2011) A Qualitative Comparative Analysis of factors associated withtrends in narrowing health inequalities in England. Social Science & Medicine, 72, pp. 1965-1974.
• Welle, K., Williams, J., Pearce J. & Befani, B. (2015) Testing the Waters: A Qualitative Comparative Analysisof the Factors Affecting Success in Rendering Water Services Sustainable Based on ICT Reporting. Wateraid,itad & IRC.

5
A1.2. Realist evaluation
What is it?
Realist evaluation is a type of theory-based evaluation design that seeks to understand ‘what works, for whom and in what circumstances’.
In a realist evaluation, specific, hypothesised causal mechanisms, in context, are articulated and evidence gathered for each. The key formula is:
Context + Mechanism = Outcome.
For example, social programmes often work by creating opportunities that the participants may (or may not) take advantage of, depending on the context. Understanding why a participant decides to take advantage of a programme (or not) is key to causal inference and is known, in Realist terms, as the ‘mechanism’. Realist evaluation recognises that context determines how, or if, this causal mechanism operates.
How is it used?
First developed by Pawson and Tilley (1997), realist evaluation is used to understand what works in which contexts. This means realist evaluation is particularly appropriate for evaluating:
• new initiatives, pilot programmes and trials, or programmes that seem to work but‘who for and how’ is not yet understood;
• programmes that will be scaled up, to understand how to adapt the intervention tonew contexts;
• programmes that have previously demonstrated mixed patterns of outcomes, tounderstand how and why the differences occur.
Pros and cons
Pros:
• Refines public policy theory through the testing of underlying theories of how socialsystems work;
• Provides a method to undertake impact evaluation when a counterfactual is notfeasible;
• Builds the wider evidence base of an area by providing a framework for testinghypotheses that may be relevant beyond a particular intervention; and
• Is method-blind in the sense that RE is an evaluation design that can employ a varietyof analytical methods with it.
Cons:
• Is time consuming and resource intensive for both commissioner and contractor;• Requires subject-matter expertise to undertake; and• Depending on the design of the evaluation, it may not provide an average net effect
of the intervention.Sources:
• Pawson, R. and Tilley, N. (1997). Realistic Evaluation. London: Sage.

6
A1.3. Process Tracing
What is it?
A structured method to developing and assessing theories about how a particular outcome arose. It examines a single case of change and tests whether a hypothesised causal mechanism, such as that proposed by a theory of change, explains the outcome. This allows for single cases to be examined where there is no counterfactual and multiple cases for comparison are unavailable.
Process tracing can be combined with logical techniques such as Bayesian updating (where the probability of a contribution claim being true is calculated statistically – see A3.2.5) to help formalise and increase the rigour of causal claims.
How is it used?
Process tracing can be used to test the contribution of an intervention to an impact. A hypothesised causal mechanism, or several, is identified using a theory of change. Researchers then identify the implications (outcomes) which would be observable if the theory of change were true, and those which would be observable should the theory be false. Evidence on these observable implications is then collected. Here particular attention is paid to evidence that would only be present should a particular causal theory be true or false; evidence that would be present in either case is less useful. Evidence tests include:
• the ‘hoop test’ where if a specific outcome is not present the theory is likely to befalse but if present does not increase the likelihood it is true by a great deal;
• the ‘smoking gun test’ where the evidence strongly supports a hypothesis but doesnot strongly refute the null hypothesis;
• the ‘straw in the wind test’, with an equally low influence on likelihood either way.These evidence tests can be combined with Bayesian updating to quantify probabilityof causal impact.
An example of its use is an evaluation of the impact of a civil society-led healthcare campaign in Ghana which tested the claim that the campaign had influenced government policy. (Befani & Stedman-Bryce 2017).
Pros and cons
Pros:
• Process tracing is a practical method for understanding and testing causal hypothesisin ‘real world’ situations that can be used in ex-post evaluation of a single case.
Cons:
• This method must be used with rigour to prevent inferential errors; alternativeexplanations must be carefully considered. Equifinality (the support of one causalmechanism may not preclude others) should also be considered.
Sources: • Befani, B. & Stedman-Bryce, G. (2017) Process Tracing and Bayesian Updating for impact evaluation.
Evaluation, 23(1), pp.42-60.• Bennett, A. & Checkel, J. (Eds.) (2014) Process Tracing: From Metaphor to Analytic Tool. Cambridge
University Press.

7
A1.4. Contribution Analysis
What is it?
Contribution Analysis refers to methods which are used to understand the likelihood the intervention has contributed to an outcome observed, or not: known as a contribution claim (for example the process tracing method). It does this through a step-by-step process which explores how the contribution would have come about and uses a broad range of evidence to test this. Contribution Analysis can make use of a broad range of evidence types and can be used for all types of interventions no matter how complex the theory of change is.
How is it used?
Contribution Analysis is used where it may not be possible to establish an experimental design testing cause and effect. This argues that a reasonable contribution causal claim can be made if:
• There is a reasoned theory of change for the intervention: the key assumptions behindwhy the intervention is expected to work make sense, are plausible, may be supportedby evidence and/or existing research, and are agreed upon by at least some of the keyplayers.
• Activities of the intervention were implemented as per the theory of change.• The theory of change is supported by and confirmed by evidence on observed results
and underlying assumptions - the chain of expected results occurred. The theory ofchange has not been disproved.
Other influencing factors have been assessed and either shown not to have made a significant contribution or their relative role in contributing to the desired result has been recognized.
An example of contribution analysis is the Qualitative Impact Assessment Protocol (QUIP) tool, used assess the impact of African rural development programmes (Remnant and Copestake, 2015).
Pros and cons
Pros:
• Useful where there is limited scope or opportunity to affect roll out of a programme(to allow for experimental methods)
• Able to confirm or revise a theory of change.Cons:
• The quality of the eventual analysis and contribution claim is dependent on the qualityof the thinking about the attribution problem and theory of change.
• Contribution Analysis does not provide definitive proof that the intervention has had acausal effect but rather an evidenced logical line of reasoning which gives some levelof confidence of an intervention’s contribution.
• Works on average effects, therefore, should not be used if there is a large degree ofvariance about how a programme has been implemented or an expectation ofdifferent outcomes for different groups.
Sources: • Mayne, J. (2008) Contribution Analysis: An approach to exploring cause and effect. ILAC methodological
brief.• Remnant, F.; Copestake, J. (2015) The Qualitative Impact Assessment Protocol (QUIP). Centre for
Development Studies, University of Bath, Bath, UK pp. 1-9.

8
A1.5. Bayesian Updating
What is it?
Bayesian updating is an extension of other theory-based methods such as contribution analysis and process tracing to strengthen the rigour used in assessing whether the evidence supports contribution claims. It does this using Bayes theorem, where the probability of a contribution claim being true given the existence of a piece of evidence is estimated from the:
• The probability of the claim being true before observation of the new evidence (“theprior”).
• The probability of observing the evidence if the claim is true (“the sensitivity”).• The probability of observing the evidence if the claim is false (“the type 1 error”).
Estimation of the probabilities can use different methods – either through use of empirical data (where available), use of computational simulations, or using subjective probabilities (through consensus or mathematical pooling).
How is it used?
Bayesian updating has been used in a number of different sectors and provides particular use in assessing outcomes which are qualitative contribution claims and difficult to observe using other means. This means the method is well suited to evaluation of complex programmes in complex settings (CECAN, 2016) and provides a means to make theory based methods more rigorous.
Bayesian updating is gaining traction in evaluation having been used in other professions for a number of years. One of the earlier studies of Bayesian updating was undertaken in assessing alternate harvest options for hake in Namibia, as part of an evaluation for the Department for International Development (1998).
Pros and cons
Pros:
• Useful where contribution claims cannot be directly observed and measured, makingthem difficult to test, particularly in complex settings
• Useful where there is a broad range of evidence of varying quality available.• Can build consensus for contribution claims as stakeholders can be included in the
judging the strength of evidence supporting the contribution claim.Cons:
• The reliance on formulas and probabilities can make the findings more opaque to theresearcher and research users.
• It is easy for the scale of the exercise to escalate, so parameters need to be set earlyon.
• The rigour of the method depends on the robustness of the probabilities.• Evidence can support both a contribution claim and an opposing theory.
Sources: • CECAN (2016) Testing Contribution Claims with Bayesian Updating. A CECAN Evaluation and Policy Practice
Note for policy analysts and evaluators Note No. 2.1. Winter 2016• Kirkwood, G. and McAllister, M. (1998) Bayesian stock assessment and policy evaluation: a review and
example application of using the logistical model. ICES Journal of Marine Science, 55, pp. 1031-1060.

9
A1.6. Contribution Tracing
What is it?
Contribution Tracing (CT) is inspired by both the principles of Process Tracing and Bayesian updating (probability).
It is a rigorous mixed qual-quant participatory method to establish the validity of contribution claims in evaluation, with explicit criteria to guide evaluators in data collection and measuring confidence in findings.
How is it used?
Contribution Tracing gathers evidence which supports (or is against) a contribution claim. Evidence is analysed using mathematical formulae (Bayesian updating) to put a numerical value on the level of confidence in a particular claim.
Contribution Tracing is a participatory method which involves consultation with all relevant stakeholders through a series of steps i.e.
(1) making the claim(2) developing a Theory of Change(3) holding a contribution ‘trial’ with all the stakeholders to establish what would prove
or disprove the claim(4) identification of alternative causes(5) application of Bayesian confidence updating (‘put a number on it’).
Some steps can be taken in parallel e.g. steps 1 and 2, and 2 and 4
Pros and cons
Pros: • Points to what evidence to look for and what it means in relation to the claim. It only
uses evidence with the ‘highest probative value’ i.e. evidence with the power toincrease or decrease confidence in a specific claim, so time is not wasted asking otherquestions.
• Specificity of the contribution claim increases the conceptual precision, clarity andquality of theories of change.
• Minimizes confirmation bias by using ‘critical friends’ during the contribution testingphase, who represent other plausible explanations of the observable change
• Participatory and collaborativeCons:
• Not so useful in answering how a programme compares with other programmes.• Schedule of undertaking needs to be right – the intervention needs to have been
going for long enough for the ‘traces’ to be visible• Must spend equal time and resources on exploring other potential causes to ensure all
views appropriately considered.Sources:
• Befani, B. and Sredman-Byrce, G. (2016). Process tracing and Bayesian updating for impact evaluation. SageJournals.
• Annmurraybrown.com. (2016). Contribution tracing: A brand new evaluation approach to prove programmeimpact. [online]. Available at: https://www.annmurraybrown.com/single-post/2016/06/20/Contribution-Tracing-A-Brand-New-Evaluation-Approach-to-PROVE-Your-Programmes-Impact[Accessed 12th November 2019]

10
A1.7. Most Significant Change
What is it?
Most significant change (MSC) is a participatory monitoring and evaluation method used in complex interventions. It is participatory as many stakeholders are involved in both deciding the sorts of changes to be recorded and in analysing data collected. It is a form of monitoring as it occurs throughout the programme cycle. It can be used in evaluation as it provides data on outcomes and impact which can be used to assess the performance of an intervention as a whole.
MSC involves the collection of significant change stories emanating from field level and the systematic selection of the most significant of these stories by panels of designated stakeholders. Stakeholders search for impact. Once the changes have been captured, selected groups discuss the changes and the value of each of them, lifting the most significant to the surface.
How is it used?
First developed by Rick Davies in the mid-1990s, MSC is useful when:
• It is not possible to predict in any detail or with any certainty what the outcome willbe
• Where outcomes will vary widely across beneficiaries• Where there may not be agreement between stakeholders on which outcomes are the
most important• Where interventions are expected to be highly participatory.
Pros and cons
Pros:
• Builds understanding and focus across teams and stakeholders.Cons:
• Is time consuming and resource intensive – needs robust facilitationSources:
• Davies, Rick. (2015). The ‘Most Significant Change’ (MSC) Technique: A Guide to Its Use”.[pdf]. Available at:https://www.researchgate.net/publication/275409002_The_'Most_Significant_Change'_MSC_Technique_A_Guide_to_Its_Use [Accessed 12th November 2019]
• Dart, J. and Davies, R (2003) A Dialogical, Story-based evaluation tool: the Most significant changeTechnique American Journal of Evaluation 24 (2) pp. 137 -155 DOI: 101177/109821400302400202

11
A1.8. Outcome harvesting
What is it?
Outcome harvesting (OH) is a monitoring and evaluation methodology used to identify, describe, verify and analyse the changes brought about through development intervention. It is designed to collect evidence of change and then work backwards to assess contribution to that change.
OH was partly inspired by outcome mapping; the two are often seen as complementary methodologies.
How is it used?
OH is used for ongoing monitoring throughout a programme/intervention in order to produce real time information on change. It can be used within evaluations.
OH is designed to encourage participation of different stakeholders in monitoring and evaluation.
OH consists of 6 steps:
1. Design the harvest2. Gather data and draft descriptions3. Engage with informants4. Substantiate outcomes5. Analyse and interpret6. Support the use of findings.
OH is useful when the focus is primarily on outcomes rather than activities, and where the programming context is complex, and to help learn after the evaluation.
Pros and cons
Pros:
• Useful where participation is easily fostered• Beneficial where stakeholders are disparate; helps to render views visible to all
Cons:
• Resource intensive.Sources:
• Wilson Grau, R. (2108) Outcome Harvesting: Principles, Steps and Evaluation Applications. Information AgePub Inc.
• Betterevaluation.org (2019). Better Evaluation Official Website [online]. Available at:https://www.betterevaluation.org/ [Accessed 12th November 2019]

12
A1.9. Simulation modelling
What is it?
Simulation modelling brings together new and existing evidence using a conceptual understanding of how the system responds to a change. In evaluation this can identify the impact of an intervention, where the impact pathway is complex and attribution of change in an individual outcome may be difficult due to confounding factors; and/or to estimate outcomes which have not yet been realised or are too complex to observe. Simulation modelling enables existing studies to be combined and to build in new evidence where there are gaps through primary data collection. This means that new data collection can be focussed on a robustly assessing one specific element of the impact pathway, drawing on existing studies to estimate other parts of the impact pathway.
How is it used?
Simulation models are used to design and develop mathematical representations of complex scenarios. In practice, developing a simulation model involves mapping out the impact pathway, through use of a method such as logic modelling. Then by combining data, evidence-based assumptions and using simulation logic the model is used to simulate a set of outcomes from a set of inputs. Simulation modelling requires combining existing and new data collection which can be quantitatively compared (such as having equivalent effect sizes). This is dependent on having comparable ‘endpoints’, measuring change in outcomes in comparable units between the steps of a logic model. There are many types of simulation model for dynamic systems, which include:
• Discrete event simulation; systems as a discrete series of events over time, where anevent marks a change in the system (Sharma, 2015)
• System dynamics; a deterministic model which assumes that the structure of thesystem gives rise to its observable and predictable behaviour (Winz et al, 2009)
• Agent based modelling; systems consist of autonomous agents which interact witheach other and the environment and behave according to defined decision rules (Abaret al, 2017)
Pros and cons
Pros:
• Provides a systematic method for evaluation of a complex intervention• Enables estimation of the size of future long-term outcomes or unobservable
outcomes which cannot be otherwise accounted for.Cons:
• Strength is dependent on quality of data, assumptions and simulation logic.• Some models use specialist software, which may be costly• May be time consuming and expensive to construct accurate models.
Sources: • Sharma, P. (2015). Discrete Event Simulation. International journal of scientific and technology research;
4(4), pp. 136-140.• Winz, I.; Brierly, G. and Trowsdale, S. (2009). The Use of System Dynamics Simulation in Water Resources
Management. Water Resources Management; 23(7); pp. 1301–1323.• Abar, S. Theodoropoulus, G. Lemariner, P. and O’Hare, G. (2017). Agent Based Modelling and Simulation
tools: A review of the state-of-art software. Computer Science Review, 24; pp 13-33.

13
A2. Experimental and Quasi experimental methods for impact evaluation
The methods outlined below are useful for generating an impact estimate; the size and significance of change brought about by an intervention. These methods are less able to answer questions about how and why impacts occurred (sometimes known as the ‘black box’), who was affected, how context played an influence and the extent to which impacts are generalizable.

14
A2.1. Randomised Control Trials
What is it?
Randomised Control Trials (RCTs), also known as experimental designs, involve providing a robust comparison between one or more groups receiving an intervention (treatment group) and a group that does not receive the same intervention (control group) through randomly assigning participants to each group. This ensures there are no observable or unobservable differences (or bias) between the treatment and control, meaning that any differences in measured outcomes between the two groups can be reliably attributed to the intervention, not an unrelated factor.
How is it used?
RCTs have been used for many years in medical science and are generally considered the ‘gold standard’ for clinical trials. In evaluation, RCTs are used to measure impact, where:
• Reasonable sample sizes can be constructed to allow for tests to be carried out ondata which have sufficient statistical power.
• The randomisation for the RCT can be feasibly and practically integrated into theintervention design before it is implemented.
• It can be confidently assumed that the intervention has no impact on the controlgroup
• Restricting the intervention is appropriate and does not cause undue ethical risks.
RCTs have been widely used across many policy areas. Examples include evaluations of the Teens and Toddlers youth development and teenage pregnancy prevention programme (Maisley et al, 2012) and a Community based English Language Provision programme (Patel et al, 2018). There are a number of variations of RCTs for various needs and situations including; factorial RCTs; cluster RCTs; stepped-wedge RCTs, Sequential Multiple Assignment Randomized Trial (SMART) and Multiphase Optimisation Strategy (MOST).
Pros and cons
Pros:
• Allows robust comparison between groups, minimising bias in sample selection• When implemented correctly, considered to produce robust estimates of impact
Cons:
• The assumption of no impact on the control group may not be plausible. ‘Blinding’(where participants, those administering the intervention and researchers do notknow who is in the treatment or control groups) is rarely feasible in socialinterventions.
• Best used where the mechanisms by which the intervention is expected to work arewell understood: this is often not the case.
• Best used when there is little variation in the execution of the intervention: it requiresrigorous and uniform execution. It can therefore lack generalisability.
Sources: • Maisey, R; Speight, S.; Keogh, P.; Wollny, I.; Bonell, C.; Sorhaindo, A.; Wellings, K. and Purdon, S. (2012)
Randomised controlled trial of the ‘Teens and Toddlers’ programme, Department for Education, ResearchReport DFE-RR211.
• Patel, A.; Hoya, C.; Bivand, P.; McCallum, A.; Stevenson, A. and Wilson, T (2018). Measuring the impact ofCommunity-Based English Language Provision: Findings from a Randomised Control Trial. National Learningand Work Institute, Ministry of Housing, Communities and Local Government.

15
• BetterEvaluation.org (2019). Randomised Controlled Trial [online]. Available at:https://www.betterevaluation.org/en/plan/approach/rct [Accessed 12th November 2019]
• Lei, H., Nahum-Shani, I., Lynch, K., Oslin, D., & Murphy, S. A. (2012). A “SMART” design for buildingindividualized treatment sequences. Annual Review of Clinical Psychology, 8, 14.1 – 14.28.
• The Methodology Centre. Penn State Colleage of Health and Human Development. Overview of MOST.[online] Available at: https://www.methodology.psu.edu/ra/most/research/ [Accessed 12th November 2019]

16
A2.2. Propensity Score Matching
What is it?
Propensity Score Matching (PSM) is a statistical technique that enables evaluators to construct a counterfactual group to estimate the impact of an intervention. This is achieved by matching treatment observations to one or more control observations based on their probability of being treated (or their propensity score). This is calculated using observable characteristics that determine the likelihood of participation and varies between 0 and 1 (where 1 is 100% likely to be treated). By comparing the outcomes of interest between the two matched groups an impact estimate can be calculated.
How is it used?
PSM can be considered when RCTs are either not feasible or not desirable. In order to estimate a robust counterfactual PSM requires:
• A varied dataset available for matching made up of pre-intervention data to estimatethe propensity score (as the treatment may affect post-treatment characteristics)
• Recipient and non-recipient groups should have a number of group members withsimilar scores (called, ‘presence of common support’)
• The assumption that assignment to treatment is only dependent on observablecharacteristics (known as ‘unconfoundedness’ or ‘Conditional IndependenceAssumption’)
There are a number of examples of PSM being used in evaluation such as the evaluation of the Livelihood Empowerment Against Poverty (LEAP) programme in Ghana, which used PSM and Difference-in-Difference (University of North Carolina, 2014)
Pros and cons
Pros: • Allows an estimate of impact where Randomised Control Trials (RCTs) are not
appropriate• The estimated impact is the average effect of the treatment on all those treated,
rather than a marginal impact on a small subset of the treated group• Where rich data on factors affecting participation and outcomes is available, it is
possible to use all of this with relatively few assumptions about the precise nature ofthese effects
Cons: • As matching is only based on observable characteristics, where treatment and
outcomes are affected by unobservables, impact estimates will be biased, and itcannot be determined analytically that there are no such unobservable factors. Thesensitivity of results to unobserved characteristics can be explored through sensitivityanalysis and can be mitigated somewhat by the addition of a difference-in-differenceto the evaluation.
• As a result, rich data on both treated and untreated individuals are needed, preferablyfrom the same source. If different sources are used the data must be directlycomparable.
• As matching can only be done on pre-intervention characteristics, these data eitherneed to be time-invariant (e.g. gender, year of birth) or collected beforehand.
Sources:

17
• Ipsos Mori Social research institute (2018) Sheffield Hallam University and London Economics.
• University of North Carolina, University of Ghana, Food & Agricultiural Organisation of the United Nations(2014) Livelihood Empowerment Against Poverty Program Impact Evaluation, North Carolina.

18
A2.3. Timing of events
(Related to and also known as: duration modelling, (mixed) proportional hazard models)
What is it?
Duration modelling generally is the process of modelling the amount of time which elapses before a given event, or the time an individual spends in a given state, for example, how long somebody remains unemployed. The evaluation method generally referred to as timing of events involves modelling jointly the time at which somebody participates in an intervention and the time at which the outcome state of interest changes. For example, in an intervention aimed at helping benefit claimants return to work, this would be the time at which they participate in the intervention, and the duration subsequent to that before they left benefit. The strength of the method is that it is generally assumed that both participation and observable outcomes are dependent on some unobserved variables e.g. motivation, and are assumed to be correlated, and can therefore be approximated. This allows the causal impact of the intervention to be estimated, even in the presence of unobserved factors influencing selection into the intervention.
How is it used?
The method can be used when the timing of the intervention is not fixed, but has some random component, which can be modelled on observed factors, but where it is reasonable to assume that there are unobserved factors at play as well which affect outcomes as well as participation. A necessary condition of use is that there are no anticipation effects – that participation in the intervention only affects outcomes after participation begins.
For example Arni et al (2013) use the method to estimate the impact of benefit sanctions on subsequent employment outcomes. In most countries’ unemployment benefit systems, there is provision for a sanction to be imposed on claimants who do not comply with the conditions of benefit receipt. There is interest in the effect this has on their subsequent labour market outcomes; identifying this is made difficult because those who are sanctioned are likely to differ from those who are not, including in ways which are not observed. By jointly modelling the time at which a sanction is imposed, and the timing of subsequent labour market transitions, the authors estimate a causal effect of this sanction.
Pros and cons
Pros:
• It explicitly assumes that there are unobserved factors influencing selection, andallows for that in the estimation
• Produces data on when anticipated changes can be expected to be achieved, whichhas benefits for development and roll out of new interventions.
Cons:
• The method is computationally intensive – analysis can take a considerable amount oftime
• The assumption of no anticipation may not be plausible.Sources:
• Arni, P; Lalive, R; van Ours, J (2013). How effective are unemployment benefit sanctions? Looking beyondunemployment exit. Journal of Applied Econometrics, 28 (7) pp. 1153-1178.

19
A2.4. Interrupted time series analysis
What is it?
Interrupted Time Series Analysis (ITSA) is a quasi-experimental method to establish the causal effect of an intervention. ITSA uses time-series data to test whether there is a change in the trend of outcomes following the introduction of an intervention. ITSA is particularly useful when an intervention is implemented at population level (such as estimating the effect of a new law) and when there is a clear time point of introduction.
ITSA does not require a control group. Without a control group, impacts are estimated by assuming that trends would continue in the absence of the intervention. The method therefore relies on the absence of other interventions or short-term time effects that might influence trends around the time of the intervention. If this is not plausible, those changes can potentially be estimated by reference to a control group which has historically followed similar trends, which is not subject to the intervention, but which is subject to the same external influences.
How is it used?
ITSA requires time series data from before and after the intervention, and is ideally used with administrative data. A data series which is too short can impact the power of statistical tests and resulting estimates should be treated with caution. Trends that extend beyond the impact of the intervention, on the other hand, can lead to inaccuracies if slow-moving long-term trends start to influence the model. It is best to use visual inspection of trends to decide ideal length of series.
Ordinary Least Squares (OLS) is used to test for statistical significance in the level and slope of the time series trend following the introduction of the intervention, using a dummy and interaction term, respectively. It is important to build the ITSA model based on a priori consideration of how the intervention would affect outcomes, for example whether you would expect a permanent or temporary change, and whether you would expect a change in level or trend (or both).
ITSA must take account of seasonality, autocorrelation (where data items are correlated with lagged versions of themselves in the same time series) and non-stationarity (effects from trends that are unrelated to the intervention itself, for example related to the fact that the intervention is new). Various methods are discussed in the literature for addressing these. ITSA can also be enhanced through the use of additional non-intervention sites as controls. This adds a difference-in-difference component that can filter out the influence of events that affect both treatment and control groups.
Pros and cons:
Pros • ITSA produces internally valid estimates of intervention effects even in the absence of
randomisation, assuming confounding factors are stable over time (i.e. no otherinterventions are introduced that affect outcomes and relevant population parametersremains stable)
• ITSA can be implemented retrospectively using administrative data• ITSA works best when there is a clear intervention time point, although gradual or
delayed intervention introduction can be accounted for
Cons: • ITSA requires sufficient time-series data to take account of seasonality,
autocorrelation and non-stationarity

20
A2.5. Instrumental variables
What is it?
Instrumental Variable (IV) regression is a method of estimating impact that makes use of a different variable (the instrument) to predict treatment in an econometric analysis. An IV is a factor which influences participation in the treatment, but which otherwise has no impact on the outcome. Providing an instrument is found which meets these conditions, an unbiased estimate of the impact of the treatment can be derived.
How is it used?
IV may be appropriate to use when: • Interventions may have been placed in a biased way which would also effect
outcomes (e.g. in areas with higher rates of deprivation)• Individuals may self-select suggesting they have characteristics that make them more
likely to be treated, or that also affect outcomes (e.g. prior experience of a similarproject)
• There is time-varying selection bias, that is when individuals change their likelihood oftreatment over time.
For IV to work it is essential to find an instrument that strongly affects selection into the programme but is not correlated with any characteristics affecting outcomes (the ‘exclusion restriction’). IV regression solves the above by predicting treatment, whilst simultaneously (by removing the treatment variable itself) removing the bias created by uncaptured characteristics correlated with the treatment.
IV can be drawn from a number of sources such as geographies, other policies, external shocks and programme design. Maurin and McNally (2008) use the disruption of the examination system during the 1968 student unrest in France, and subsequent step-increase in examination pass rates, to estimate the returns to university education as substantially more students than usual went to university. The unrest is the instrument, leading to an increased likelihood of going to university, and assumed otherwise to have no long-term impact on earnings.
Pros and cons:
Pros
• Useful in instances where other quasi- and experimental methods are not possible• Does not require assumptions about there being no other sources of selection bias.
Cons • Finding a valid instrument is difficult, and usually cannot be planned in advance. If
the instrument is only weakly correlated with treatment, great care is needed to derivevalid impact estimates.
• The derived impact estimate is a Local Average Treatment Effect – the impact onthose who are on the margins of participation. In the example above for instance, theanalysis gives the impact for those students who, in any other year, would not haveattended university, and does not apply to those who would have attended anyway.
Sources:

21
• Maurin, E. and McNally, S. (2008). Vive la Révolution! Long‐Term Educational Returns of 1968 to the AngryStudents. Journal of Labor Economics 26,1: pp.1-33.

22
A2.6. Synthetic Control Methods
What is it?
Synthetic control is a quantitative method which uses historical data to construct a ‘synthetic clone’ of a group receiving a particular intervention . Divergence between the treatment and its synthetic clone provide the impact estimate.
How is it used?
The synthetic control method is often used at the macro-level for policy evaluation and is particularly appropriate when there are a small number of treated observations. A relatively common application is where the units of treatment are areas.
The method requires a pool of potential comparable observations from which to draw a weighted average that approximates the treatment observation e.g. counties, villages. This weighted average is calculated using historical data and then continued through the time-series after implementation to form the ‘synthetic clone’.
Synthetic controls have been used in California’s Tobacco Control Program (Abadie et al, 2012) using the relationship between per-capita cigarette sales in California and those in other states before the programme (between 1970 and 1988). The data was then extrapolating forwards to model the level of sales that would have happened in California had the relationship continued unchanged, creating the synthetic clone. Cigarette sales in California fell faster following the introduction of the programme than in the synthetic clone.
Pros and cons
Pros:
• The key advantage of this method is that it can create a relevant and highly visualpoint of comparison where no suitable comparators exist.
• It may be particularly suitable for analysing the effects of policy interventionstargeting specific local economic outcomes and other areas where large volumes ofsecondary data is already available.
Cons:
• The analysis is only viable where it is possible to establish a historical relationshipbetween the behaviour of the treatment and control groups.
Source: • Abadie, A.; Daimond, A.; and Hainmuller, J (2012) Synthetic Control Methods for Comparative Case Studies:
Estimating the Effect of California’s Tobacco Control Program, Journal of the American StatisticalAssociation, 105: 490,pp. 493-505.
• Fremeth, A.; Holburn, G. and Richter, B. (2016) Bridging Qualitative and Quantitative Methods inOrganizational Research: Applications of Synthetic Control Methodology in the U.S. Automobile Industry,Organization Science 27; 2, pp 1-21.
• Craig, P. (2015) Synthetic controls: a new approach to evaluating interventions, What Works Scotland,Working paper.
23
A2.7. Difference in Difference
What is it?
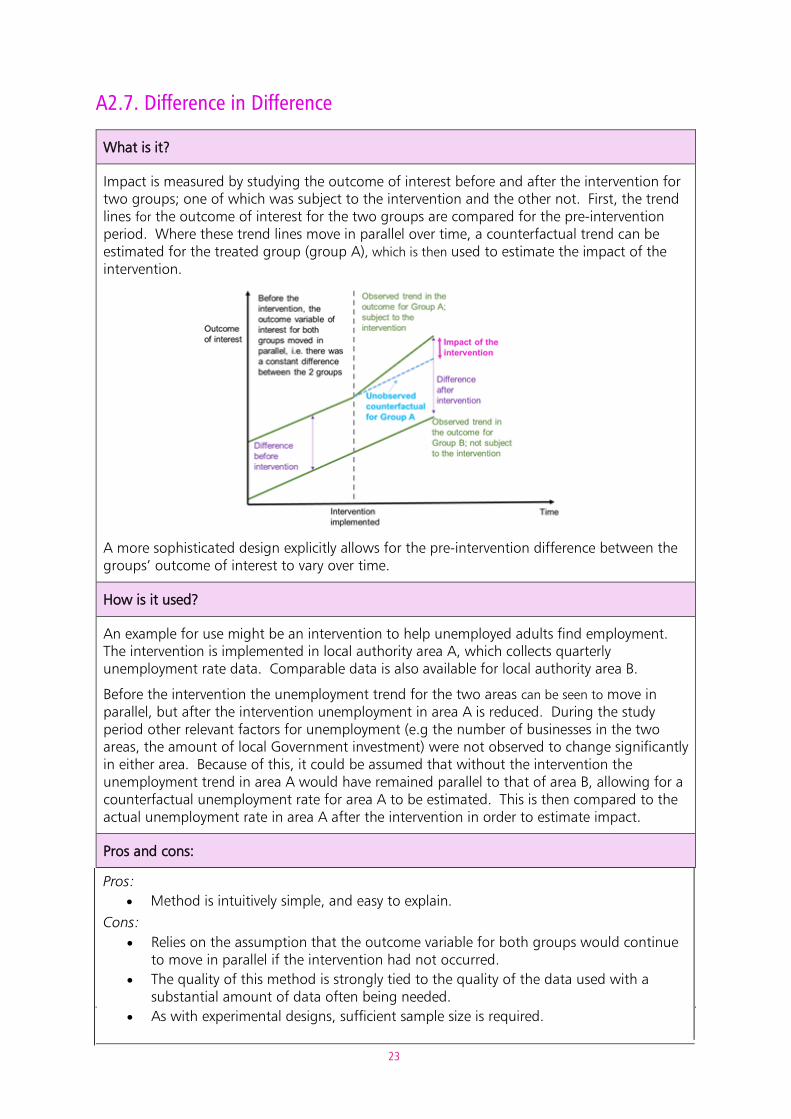
Impact is measured by studying the outcome of interest before and after the intervention for two groups; one of which was subject to the intervention and the other not. First, the trend lines for the outcome of interest for the two groups are compared for the pre-intervention period. Where these trend lines move in parallel over time, a counterfactual trend can be estimated for the treated group (group A), which is then used to estimate the impact of the intervention.
A more sophisticated design explicitly allows for the pre-intervention difference between the groups’ outcome of interest to vary over time.
How is it used?
An example for use might be an intervention to help unemployed adults find employment. The intervention is implemented in local authority area A, which collects quarterly unemployment rate data. Comparable data is also available for local authority area B.
Before the intervention the unemployment trend for the two areas can be seen to move in parallel, but after the intervention unemployment in area A is reduced. During the study period other relevant factors for unemployment (e.g the number of businesses in the two areas, the amount of local Government investment) were not observed to change significantly in either area. Because of this, it could be assumed that without the intervention the unemployment trend in area A would have remained parallel to that of area B, allowing for a counterfactual unemployment rate for area A to be estimated. This is then compared to the actual unemployment rate in area A after the intervention in order to estimate impact.
Pros and cons:
Pros: • Method is intuitively simple, and easy to explain.
Cons: • Relies on the assumption that the outcome variable for both groups would continue
to move in parallel if the intervention had not occurred.• The quality of this method is strongly tied to the quality of the data used with a
substantial amount of data often being needed.• As with experimental designs, sufficient sample size is required.

24
A2.8. Regression Discontinuity
What is it?
This method estimates the impact of an intervention by using a cut-off threshold to assign the intervention.
The method relies on the assumption that the individuals just below and above a cutoff threshold will be similar, with the only significant difference between the 2 groups being whether they received the intervention or not.
By comparing the value of the outcome variable for the individuals just above and below the cut-off threshold, the method infers the impact of the intervention.
How is it used?
The method was first used in 1960 to estimate the impact of a merit-based scholarship scheme by Thistlethwaite and Campbell. Simply comparing the attainment grades of students who were given the scholarship versus those who didn’t would lead to a biased estimate of the impact of the scheme, because more able students were given the scholarship so would likely have better attainment whether they received the scholarship or not. To overcome this, the students who were only just eligible for the scholarship (who only just passed the scholarship test) were compared with those who only just missed the cut-off grade for the scholarship award. These “only just” unsuccessful students were very similar in their ability to those who were “only just” successful so they made a good comparison group. By comparing the outcomes of both groups in later years, the impact of the scholarship could be estimated.
Pros and cons:
Pros: • Can be useful method where randomisation is not possible in the intervention design.
Cons: • The method only allows estimation of the impact of the intervention for individuals
close to the cut-off (local average treatment effect). The effect of the interventionmay differ for those individuals further away from the cut-off.
• As with other quasi-experimental methods, many assumptions must be made in orderto assert attribution.
Sources • Thistlethwaite, D.; Campbell, D. (1960). "Regression-Discontinuity Analysis: An alternative to the ex post
facto experiment", Journal of Educational Psychology, 51 (6) pp.309–317. doi:10.1037/h0044319.

25
A3. Methods for value-for-money evaluation These methods are used to answer questions about the net value of an intervention. It compares its benefits relative to its costs. By determining the relative benefit to cost of different interventions, Government can ensure that public money is used to produce the most value for society.
26
A3.1. Cost Benefit Analysis (CBA)
What is it?
Also called Social Cost Benefit Analysis (SCBA), CBA is a method of comparing the relevant costs and benefits of policy decisions. The ultimate objective is to compare costs and benefits to assess whether the intervention represents value-for-money for society.
The costs and benefits include the financial, environmental and social consequences accruing to society as a result of the policy. The costs and benefits of each policy option must be assessed relative to the counterfactual). Each cost and benefit is expressed in monetary terms where possible, to enable their comparison. When it is not practical or possible to apply a monetary value, costs and benefits should still be included qualitatively.
A CBA typically uses two measures to compare between interventions; the Net Present Social Value (the total present value of benefits minus costs), and the Benefit Cost Ratio (present value of benefits divided by relevant costs).
The HM Treasury Green Book details CBA in further detail.
How is it used?
Applying CBA requires a good understanding of the relevant costs and benefits. Costs can include capital, resource direct and indirect costs to the public sector, private actors and wider society as a whole. Benefits could include direct and indirect benefits to public, private sectors (and to the UK society as a whole). These costs and benefits then need to be quantified and converted in to monetary units for comparison, after adjusting (discounting) for social time preference.
It’s also good practice to include distribution analysis, so that the impact of the intervention on different groups of society can be taken into account.
Pros and cons
Pros: • CBA enables a holistic view of an intervention or options including financial as well as
wider economic impacts (such as environmental and social impacts) that may or maynot be exchanged in the markets. This allows for an objective comparison ofintervention options.
• Given data availability, CBA can capture short-term and long-terms impacts in asystematic way.
• CBA allows uncertainty, risks and optimism bias to be captured in the appraisalthrough sensitivity analysis and weights.
Cons: • Quality of results relies heavily on available data and ability to monetise the impacts.
Sources: • HM Treasury (2018) The Green Book: Central Government Guidance on Appraisal and Evaluation. London.
Crown Copyright. Available at:https://assets.publishing.service.gov.uk/government/uploads/system/uploads/attachment_data/file/685903/The_Green_Book.pdf [Accessed 12th November 2019]

27
A3.2. Cost effectiveness analysis
What is it?
Cost Effectiveness Analysis (CEA) enables policy makers to compare various options in terms of the implied cost of the option, and the likely outcomes from pursuing that option. Often this method is used where cost benefit analysis is not possible, either because the cost to quantify and monetise benefits is too high or where wider benefits remain unchanged no matter how the intervention is delivered.
In some situations, CEA focuses on the cost of delivering an additional unit (the marginal cost), such as the cost of detecting an additional lung cancer patient through a second round of tests with some underlying probability of success of detection.
How is it used?
Policy analysts need to identify the unit of effectiveness of the intervention, such as lives saved, and the cost of delivering the intervention that will achieve these outcomes. Though these outcomes are not expressed in monetary terms, the unit of effectiveness can help in identifying the cost effectiveness ratio (CE), which measures the cost of delivering an outcome against the effectiveness in measurable units. Comparison of CE of various options can then enable decision makers to identify the most beneficial option.
Cost effectiveness analysis is used in a number of sectors where monetising outcomes may not be possible, or may be difficult to do, and has previously often been used in evaluation of health interventions. Some examples include: a cost effectiveness analysis to support decision making in HIV prevention in the Ukraine (Kumaranayake, 2002), and a cost effectiveness analysis of human resources intervention to reduce the shortage of nurses in rural South Africa (Lagarde et al, 2012).
Pros and cons
Pros:
• Enables comparison where benefits either cannot be converted into monetary unit or the cost of doing so is prohibitive.
• Provides systematic comparability of options. Cons:
• The absence of benefits in monetary metrics may limit its effectiveness in supporting decision making, especially when comparing against options that have been appraised using social cost benefit analysis.
Sources: • Kumaranayake, L.; Vickerman, P.; Watts, C.; Guinness, L. (2002) Cost-effectiveness analysis: aiding decision-
making in HIV prevention in the Ukraine. Report prepared for British Council/DFID. • Lagarde, M.; Blaauw, D.; Cairns, J. (2012) Cost-effectiveness analysis of human resources policy
interventions to address the shortage of nurses in rural South Africa. Social Science and Medicine 75 (5) pp. 801-806. [DOI: 10.1016/j.socscimed.2012.05.005

28
A4. Methods for synthesis of existing evidenceThe synthesis of existing evidence can be used to answer evaluation questions relating to the impact of an intervention, the process by which it was implemented and the value for money of the intervention.

29
A4.1. Systematic reviews
What is it?
A systematic review is a synthesis which uses a systematic method to identify, assess, extract and bring together evidence from multiple studies. The focus of a systematic review is to provide an exhaustive review of all relevant data to answer a clearly defined research question.
The purpose of the review is to identify all relevant studies in an unbiased, transparent and replicable way. Systematic reviews differ from literature reviews in having a more refined scope for identifying information, being more comprehensive and in evaluating the quality of supporting sources (in terms of bias and quality of evidence). Systematic reviews can be undertaken as part of meta-analysis, meta-ethnography and realist synthesis.
How is it used?
Systematic reviews aim to reduce bias and provide a comprehensive overview of studies through use of five key steps: framing the question, identifying relevant publications, assessing study quality, summarising the evidence and interpreting the findings (Khan et al, 2003).
Systematic reviews originated in medical sciences in the 1970s but have since extended to cover a wide range of different fields including health, education, and international development. Examples include a systematic review into child weight management services (Sutcliffe et al, 2017), a review of models of analysing significant harm to children (Barlow et al, 2012) and a review of evidence on the relationship between education, skills and economic growth in low income countries (Hawkes, 2012). In health, there is the Cochrane Database of Systematic Reviews. The Campbell Collaboration provides a similar service across a number of policy areas.
Pros and cons
Pros: • Provide a comprehensive assessment of evidence within a field.• Have a rigorous method to assessing studies and referencing
Cons: • A full systematic review can be resource intensive and is likely to require
multiple researchers.• Systematic reviews can take a long time to conduct thoroughly which may
not be practical.• Dependent on there being a substantial body of evidence to review, so
may be less effective when used in fields with limited evidence.Sources:
• Khan, K.; Kunz, R.; Kleijnen, J. and Antes, G. (2003). Five steps to conducting a literaturereview. Journal of the Royal Society of Medicine, 96 (3) pp. 118–121.
• Barlow, J; Fisher, J. and Jones, D. (2012. Systematic review of models of analysing significantharm. Department for Education, London.
• Hawkes, D. and Ugur, M. (2012). Evidence on the relationship between education, skills andeconomic growth in low-income countries: A systematic review. EPPI-Centre, Social ScienceResearch Unit, Institute of Education, University of London, London, UK. 83 pp. ISBN 978-1-907345-32-6

30
A4.2. Rapid evidence assessment
What is it?
A Rapid Evidence Assessment (REA) is a method to undertake a review of literature in a subject area in a shorter period of time than a systematic review, while using a similar methodology. While a REA is quicker to conduct than a systematic review, the focus of a REA is narrower, and concessions are made on the breadth or depth of studies included.
REAs use targeted searches of literature and may also use interviews with subject matter experts (such as academics) to rapidly identify literature.
How is it used?
There are a number of different uses of Rapid Evidence Assessments, particularly where:
• There is uncertainty about the effectiveness of a policy in a scoping stageof policy development
• A map of evidence on a particular subject is required• A decision is required in a short timeframe• A starting point is required prior to further primary or secondary research
(such as a fuller systematic review of literature)
A Rapid Evidence Assessment should provide transparency on the scope and methods deployed to conduct the review. Due to the pragmatism of the method, REAs are widely used within evaluation and research. The Government Social Research Service have developed a Rapid Evidence Assessment Toolkit to support commissioning or conducting REAs.
There are numerous examples of Rapid Evidence Assessments, including a review of ‘what works’ for teaching numeracy (Welsh Government, 2012) and a review of methods by which city governments in low income countries can increase their access to public or private resources (Nixon et al, 2015).
Pros and cons
Pros:
• A quick way to undertake a review of literature on a focused researchquestion.
• Is a more directed search for evidence compared to ad hoc literaturereviewing.
• A number of different applications in policy development and informingfurther research.
Cons:
• REAs are less effective where the research question does not easily map onto the existing body of evidence.
• This method can be more open to bias than a systematic review.Sources:
• Welsh Government (2012). Rapid Evidence Assessment on ‘What Works’ for NumeracyTeaching. Cardiff, Welsh Government.
• Nixon, H., Cambers, V., Hadley, S. and Hart, T. (2015) Urban Finance: Rapid EvidenceAssessment. London: Overseas Development Institute.

31
A4.3. Meta-analysis
What is it?
Meta-analysis provides a quantitative and systematic assessment to bring together evidence from experimental (or quasi-experimental studies) and is frequently referred to as the ‘analysis of analyses’.
Meta-analysis brings together a number of studies to estimate the overall effect of an intervention, to either improve the estimates of the size of effect, or to resolve uncertainty between studies. The method implies a “rigorous alternative to the casual, narrative discussions of research studies” (Glass, 1976).
How is it used?
Meta-analysis is used to support decision making regarding the validity or efficacy of a particular intervention, through increasing the number of studies on which a particular intervention is based. Meta-analysis helps to remove some of the uncertainty in a hypothesis based on one study, by comparing results from a singular study with other studies, through use of statistical techniques.
By comparing multiple studies, meta-analysis can provide a more objective assessment of the research question than using just a single study.
Meta-analysis is often used with experimental designs, such as RCTs, although can also be used for quasi-experimental approaches. With the latter, however, some academics have raised concerns as to the ability of meta-analyses to account for bias and confounding factors (Colliver et al, 2008). Examples include a meta-analysis of pragmatic lifestyle changes for the prevention of Type 2 diabetes (Ashra et al, 2015) and a review of infant exposure to antiretroviral drugs during breastfeeding (Waitt et al, 2015).
Pros and cons
Pros
• Add weight to the evidence of the impact of an individual intervention• Differences between studies may be addressed in analysis.
Cons
• The extent to which results can be relied upon is dependent on the qualityof the studies included within the meta-analysis.
• Limitations to the comparability of outcomes between different studies• Validity of the method depends on the inclusion criteria.
Sources: • Glass, G. (1976). Primary, Secondary and Meta-Analysis of Research. Educational Researcher,
5, (10) pp. 3-8• Colliver, J.; Kucera, K. and Verhulst, S. (2008). Meta‐analysis of quasi‐experimental research:
are systematic narrative reviews indicated?. Medical Education, 42 (9) pp. 858-865• Ashra, N.; Spong, R.; Carter, P.; Davies, M.; Dunkley, A.; Gillies, C.; Greaves, C.; Khunti, K; ,
Sutton, S.; Yates, T.; Youssef, D. and Gray, L. (2015). A systematic review and meta-analysisassessing the effectiveness of pragmatic lifestyle interventions for the prevention of type 2diabetes mellitus in routine. Public Health England, London.
• Waitt, C.; Garner, P.; Bonnett, L.; Khoo, S. and Else, L. (2015). Is infant exposure toantiretroviral drugs during breastfeeding quantitatively important? A systematic review andmeta-analysis of pharmacokinetic studies. Journal of Antimicrobial Chemotherapy, 70, (7) pp1928-41.

32
A4.4. Meta-ethnography
What is it?
Meta-ethnography brings together qualitative data on multiple individual personal lived experiences to identify new insights. Researchers select, analyse and interpret narrative accounts within studies to answer questions on a particular subject by identifying concepts and metaphors across studies. It can provide wider insight as to why and how interventions work (or do not) in different situations or for different individuals. Unlike a literature review, which looks at the quality and scope of existing literature within a field, meta-ethnography looks for meaning not apparent within the original studies, to identify new insights and conclusions.
How is it used?
Meta-ethnography was developed in education research and pioneered by Noblit & Hare (1988). Their process was to: decide what is relevant to the initial interest; read the studies; determine how the studies are related; translate the studies into one another; synthesise translations; and express the synthesis. Since then, meta-ethnography has been used in other fields, particularly in health.
There are three different methods of synthesis used in meta-ethnography (Barnett Page and Thomas, 2009):
• Reciprocal translational analysis – evolving overall concepts throughtranslation of one account to another.
• Refutational synthesis – explaining conflicts or differences in stories• Lines of Argument synthesis – building a picture of the study subject from
many different narrative accounts (e.g. building a picture of anorganisation).
An example of meta-ethnography is a review into patient reported barriers and drivers of adherence to antiretroviral therapy (ART) in Africa, which identified local concepts of illness and distrust in Western medicine, and why traditional medicine was more widely used as an alternative to ART. (Martin-Hilber et al, 2010).
Pros and cons
Pros: • Provides insight on behaviour that would not be apparent in single
studies.• Different methods of synthesis mean the method can be applied flexibly.• Can inform and compliment primary qualitative research.
Cons: • Beliefs, experiences and contexts change quite rapidly over time, so
findings may not remain relevant.• Some meta-ethnography studies lack clarity on the methodology which
can compromise their perceived rigour.Sources:
• Noblit, G. and Hare, R. (1988). Meta-Ethnography: Synthesizing Qualitative Studies. Sage;London.
• Barnett-Page, B. and Thomas, J. (2009). Methods for the synthesis of qualitative research: acritical review. BMC Medical Research Methodology, 9, pp. 59.

33
• Martin-Hilber, A.; Musheke, M.; Merten, S.; Kenter, E.; McKenzie, O. and Ntalasha, H. (2010) Patient-reported barriers and drivers of adherence to antiretrovirals in sub-Saharan Africa: a meta-ethnography, Tropical Medicine and International Health (2010) 15 (S1), pp. 16-33.

34
A4.5. Realist synthesis
What is it?
Realist synthesis is a method to reviewing evidence on interventions to explain not only ‘what works’ but to develop this further, to understand “what works, for whom in what circumstances, in what respects and how?’ (Pawson et al, 2004).
This method brings together systematic review methods with Realistic Evaluation theory to review literature with an objective of being able to understand underlying mechanisms which may support or inhibit the effectiveness of an intervention. The objective of a realistic synthesis is therefore to review literature to understand the underlying context, mechanism and outcome relationship of an intervention.
How is it used?
Realist synthesis is used frequently to assess complex policy interventions which themselves are based in complex environments. For example, a systematic review may enable evidence to be collected about the use of particular medicines, but implementation of a new health initiative for delivering health care will not have one simple causal mechanism, and will be highly influenced by context. As such, realist reviews:
• Have methods to deal with complexity and heterogeneity between contexts
• Help to understand how outcomes are achieved
Realist synthesis is a more recent method of reviewing literature compared to other techniques. It has frequently been used to review health care interventions, such as a realist synthesis to identify the evidence of collaboration in interprofessional healthcare teams (Sims et al, 2013). There are also some published examples relating to the international development context such as the review of school accountability in low and middle income countries (Eddy-Spicer et al, 2016).
Pros and cons
Pros
• Method to structure a review based on premise of trying to explain outcomes from an intervention.
• Takes into account the “real world situation” surrounding an intervention by accounting for differences in between study contexts and study designs.
Cons
• There are broad concepts to the method, but these cannot easily be reproduced or standardised into a fixed method.
• Requires some researcher knowledge of the intervention context, and understanding of programme implementation.
Sources: • Pawson, R.; Greenhalgh, T.; Harvey, G. and Walsh, K. (2004). Realist synthesis: an
introduction. ESRC Research Methods Programme, RMP Methods Paper 2/2004. • Sims, S.; Hewitt, G. and Harris, R. (2013). Evidence of collaboration, pooling of resources,
learning and role blurring in interprofessional healthcare teams: a realist synthesis. Journal of Interprofessional Care, 29 (1) pp. 20-25.

35
• Eddy-Spicer, D.; Ehren, M.; Bangpan, M.; Khatwa, M. and Perrone, F (2016) . Under what conditions do inspection, monitoring and assessment improve system efficiency, service delivery and learning outcomes?. EPPI-Centre, Social Science Research Centre, UCL Institute of Education, University College London

36
A5. Generic research methods used in both process and impact evaluation
This annex provides some more details on the generic research methods used in both process and impact evaluation.

37
A5.1. Interviews and focus groups
What is it?
Qualitative interviews and focus groups are used in process and impact evaluation as a means to elicit views of individuals involved with a programme – these might include stakeholders, staff delivering an intervention or beneficiaries of an intervention. Interviews or focus groups may elicit views on: intentions, experiences, and self-reported impact of a programme intervention.
Interviews enable an in depth exploration with participants, and allow some flexibility for the evaluator to probe or gather further detail to identify the impact of programmes on an individual. Focus groups are useful to elicit similar views, but from a group rather than an individual, where a collective viewpoint (or diversity in views within a group) may be gathered.
How is it used?
Interviews and focus groups are commonly used to elicit qualitative data on programme delivery and impact beyond what quantitative data can provide (CDC, 2016). They also allow more time to explore the views of programme participants, and to explore issues in depth. This presents an advantage over other techniques, such as surveying, in understanding ‘why’ and ‘how’ a programme or intervention has worked in the way it has, particularly where interviews may be conducted longitudinally at multiple points during the roll out of a programme. Both focus groups and interviews may use tools to elicit responses, such as visual aids.
Interviews are more appropriate when wishing to elicit an individual perspective on the topic. Focus groups may be used to gain a collective view of a group, particularly where participants in the group may be less responsive to a solo interview (for example, young children may feel more confident to be interviewed with their peers than on their own). Focus groups can be used pragmatically, to gather a wide range of views from a number of respondents at once, or opportunistically linked to programme activities (for example, following a staff team meeting).
Pros and cons
Pros:
• Allow for the collection of in-depth or collective views on an intervention • Offer explanation into data collected through other methods
Cons:
• Interviews and focus groups may be more time intensive than other forms of data collection for the evaluator and the participant.
• There can be a risk of bias with this method – some individuals will be more or less willing to take part in an interview or focus group than others.
• Focus groups require careful moderation to ensure all participants have equal opportunity to communicate their views
Sources: • CDC (2008). Data Collection Methods for Program Evaluation: Focus Groups. Evaluation ETA
Evaluation briefs, No.13, July 2018. Available online at: https://www.cdc.gov/healthyyouth/evaluation/pdf/brief13.pdf [Accessed 12th November 2019]

39
A5.2. Case Studies
What is it?
A case study is an in-depth investigation of a phenomenon of interest (e.g. a person, group or event) within its real world context. Subjects are often purposively selected because they are unusual and reveal information – rather than being representative. They use multiple sources of evidence, quantitative or qualitative to build a deep understanding, and can employ various data collection methods including interviews, surveys or experiments.
How is it used?
Case studies can serve multiple purposes including descriptive, exploratory or explanatory.
Descriptive case studies articulate in detail what is already known about a phenomenon.
Exploratory case studies may investigate phenomena when less is known about them or where specific hypothesis is being tested.
Explanatory case studies consider different explanations about how or why the phenomenon is as it is, and offers a logical conclusion, based how well the explanations compare with the facts.
Where different strands of an evaluation look at different parts of a complex system, case studies can help understand how all of these interact.
Pros and cons
Pros:
• Can capture real life situations in depth and detail. • Can help understand complex phenomena. • Work well in combination with or supplementing other methods such as
surveys. • Can be helpful for communicating to stakeholders what interventions
have worked for particular organisations in certain contexts. Cons:
• It is difficult to generalise findings to different context, situations or phenomena.
Sources:
• Case Study Evaluations. 1990. US General Accounting Office. [pdf] Available at: https://www.gao.gov/special.pubs/10_1_9.pdf [Accessed 12th November 2019]
• Morra, Linda G.; Friedlander, Amy C.(1999). Case Study Evaluations. [pdf] World Bank working paper. Available at: http://documents.worldbank.org/curated/en/323981468753297361/Case-study-evaluations [Accessed 12th November 2019]

40
A5.3. Surveys and polling
What is it?
Surveys and polling are data collection methods commonly used to collect data from a large number of individuals. Surveys and polling as terms are often used interchangeably but have some key differences: polling is normally used to answer one key question (where a respondents will be asked to identify one response from a list), whereas surveying normally consists of multiple questions which may be either closed or open. The accuracy of both methods is reliant on ensuring the sample for the survey is representative of the wider group being surveyed.
How is it used?
There are five key methods for surveying and polling: face to face, by post, online, by telephone or by handout. The efficacy of each method will vary by context and intended participants. For example, sending an online survey to all staff through an organisation’s mailing list may be a more effective survey method than to hand out paper surveys to staff, however, this is unlikely to work for other groups. Surveying is frequently used to collect longitudinal data over the course of an evaluation.
Depending on the method of distribution, surveys and polling can be an effective and lower cost method to engage a large number of individuals than other methods of primary data collection, and as such are used widely. Surveys are widely used in evaluation, e.g. the evaluation of children centres in England (Maisey et al, 2015) and of activity pilots to get young people into work (Tanner et al, 2010).
Pros and cons
Pros: • Compared to administrative data, survey data is typically much richer,
giving information on a wide variety of topics• A low cost (relative to qualitative research) method for engaging a large
number of people in an evaluation• Opportunities to easily collect longitudinal data and to collect statistical
data.Cons:
• Sampling bias: there is likely to be systematic differences between thosewho agree to participate and those who do not, leading to non-responsebias (this can be mitigated if the differences are on observedcharacteristics, but not if the factors are unobserved).
• Timing and data frequency: typically, survey data is only collected for asubset of the population and at specific points in time (in contrast toadministrative data which covers the whole population of interest and atfrequent intervals)
• Measurement error – the data collected may be incorrect. This can arise formany reasons, including respondents providing false information;imperfect recall; misinterpreting the question etc. Experts can helpmitigate these risks.
Sources:

41
• Maisey, R.; Poole, E.; Chanfreau, J. and Fry, A. (2015). Children’s centres evaluation in England:Strand 2: longitudinal survey of families using children’s centres in the most disadvantagedareas. Research report, Department for Education, London.
• Tanner, E.; D’Souza, J.; Taylor, E.; Finch, S.; Purdon, S. and Maguire, M. (2010). ActivityAgreement Pilots – Follow-Up Survey of 2007-2008 Participants. Department for Education,Research report DFE-RR010.

42
A5.4. Output or performance monitoring
What is it?
Output or performance monitoring is a method which provides leaders, managers, and stakeholders with a data collection strategy to continuously monitor, measure and review performance of a project or programme, which might include indicators and targets on efficiency, effectiveness and impact.
While performance or output monitoring may be used in a wide range of contexts where evaluation is not being considered, evaluation can bring additional value to performance monitoring through providing contextual detail on how the programme operates, defining success criteria and comparisons for judging performance and identifying appropriate sources of information to monitor performance with (Funnell, 2004).
How is it used?
Performance or output monitoring is widely used in the development of interventions to enable data to be collected to track progress of the intervention. Monitoring performance may involve collecting data on outputs (such as number of hip operations performed, number of children receiving a free school meal), but also to monitor outcomes (such as improvement in quality of life, increases in educational attainment).
Performance monitoring for evaluation can involve using routinely collected data (data which otherwise might be collected by the organisation) or involve development of additional indicators which may be necessary to measure outputs identified through use of theory based evaluation methods.
Pros and cons
Pros:
• Provides data to allow users to identify if an intervention is working asintended
• Can provide rapid feedback• It is often routinely collected operational data and therefore cheap and
easy to gather• To provide regular proxy data where other evaluation data is collected
infrequently due to complexity or cost.Cons:
• Data collection can feel onerous for participants if it is not alreadyroutinely collected.
• Staff may find performance monitoring oppressive or lack the capacity tocollect the data.
• May be susceptible to data quality issues if relying on delivery staff tocollect it.
• Requires careful consideration of what data to monitor to ensureperformance monitoring provides added value.
Sources: Funnell, C. (2004). Developing and using a program theory matrix for program evaluation and performance monitoring. Indigenous evaluation, 2000 (7) pp. 91-101.

43
A5.5. Qualitative observational studies
What is it?
Observational studies involve observing and noting behaviour, often supplemented with interviewing individuals within their own environments, to determine the impact which an intervention has had on an individual’s day to day life. Ethnography is one form of observational study, which is characterised by a ‘long term participant observation where the researcher spends an extended period of time in a social group in order to collect data.’ (Morgan-Trimmer and Wood, 2016).
In practice, this involves an evaluator being embedded within a particular community or individual environment for a prolonged length of time to allow for the collection of rich qualitative data, gathered through a combination of observed data and data collection with individuals through interviews or similar methods.
How is it used?
Observational studies, and particularly ethnography, offer the opportunity to support evaluation through ensuring other data collected is understood within the context and is used to build theories relevant to that context. Through the evaluator placing themselves within a local environment, they can form a deep understanding which can be used to better understand both the process and impact findings.
There have been a number of examples of ethnographic methods used in evaluation, including an evaluation of a programme to improve people’s experience of ageing (Design Council, 2017) and an evaluation of a quality improvement project of transitions of care for older people (Sutton et al, 2016).
Pros and cons
Pros: • Evaluator can build a rapport with participants, leading to greater
respondent openness• Evaluator gains a rich understanding through observing impacts first-hand• Behaviour can be observed and understood in different contexts• Reduces reliance on self-reported behaviour inherent in other methods
Cons: • Not all contexts will allow observation.• There may be some limitations on how generalizable findings are from
ethnography or observational methods as they are tied so closely toindividual study participants.
• Gaining ethical approval may be more difficult than other methods.• Presence of a researcher and knowledge of being observed may alter the
behaviour of participants• Time and resource intensive
Sources: • Morgan-Trimmer, S. and Wood, F. (2016). Ethnographic methods for process evaluations of
complex health behaviour interventions. Trials, 17, pp. 232.• Design Council (2017). Phase 1: Exploring the challenge: the impact of the design process.
Transform Ageing.

44
• Sutton E.; Dixon-Woods, M. and Tarrant, C. (2016). Ethnographic process evaluation of aquality improvement project to improve transitions of care for older people. BMJ Open, 6,pp.8.

45
A5.6. Consultative/deliberative methods
What is it?
Deliberative or consultative methods are used within evaluation as a means to engage citizens in discussing (often complex) issues. Deliberative methods differ from other research methods in three main ways (Burchardt, 2012):
• The aim of the research is to reach a considered judgement on an issuethrough a process of public reasoning (which may involve justifyingopinions in relation to others)
• The process involves researchers providing information to participants toreview and consider in forming their judgement
• There is scope for the beliefs and values of participants to be transformedby the research.
Deliberative methods are often seen as mixture of research and consultation with an aim to involve citizens in a meaningful way through providing information to ensure citizens assess, review and debate the information to come to a collective decision on the basis of the evidence.
How is it used?
Deliberative methods tend to be used on more complex issues, which participants require more information to form a judgement on and to meaningfully engage in. There are various methods by which a deliberative method can be taken, through interviews, polling, ‘citizen juries’ or workshops, amongst other methods. This method of citizen engagement tends to take more time than other methods for engaging citizens (such as focus groups).
Deliberative methods have origins within health research and have increasingly been used over the last thirty years across other sectors. A recent example includes work commissioned by the Environment Agency on people’s inquiry on nanotechnology and the environment (Irving et al, 2006).
Pros and cons
Pros:
• Help the public to engage with more complex issues• Can provide an equal platform for experts and citizens to have a
conversation about a particular issue• Can provide more detailed responses than other methods
Cons:
• Time intensive for participants and the evaluator• Reliant on information being clearly communicated by policy makers or
evidence leads• A robust sampling strategy for participants is important to limit bias
Sources: • Burchardt, T. (2012). Deliberative research as a tool to make value judgements. CASE paper
159, Centre for Analysis of Exclusion, London School of Economics, London.
• Irving, P.; Bone, B.; Hayes, E.; Colvin, J.; Irwin, J.; Stilgoe, J. and Jones, K. (2006). Usingscience to create a better place: A people’s inquiry on nanotechnology and the environment.Science report, Environment Agency, London.