analytical methods for quality control of beer mix beverages · analytical methods for quality...
TRANSCRIPT
Analytical methods for quality
control of beer mix beverages
H. Klein, C. Forster

• General aspects of quality control of beer mixes beverages
• Challenge to the analytics
• Critical remarks and additional information of analytical parameters
• Example of troubleshooting and performance of modern analytical systems
Overview

• Specification of base beer
• Specification of raw materials (multi-juice syrup with compound, sugar or syrup…)
• Evaluation of mixing process
• Specification of finished product
• Product stability (sedimentation, BBD…)
• Verifying the autenthicity of raw materials
• Troubleshooting
Quality control and investigation performed for
raw materials
mixing process
final product
base beer
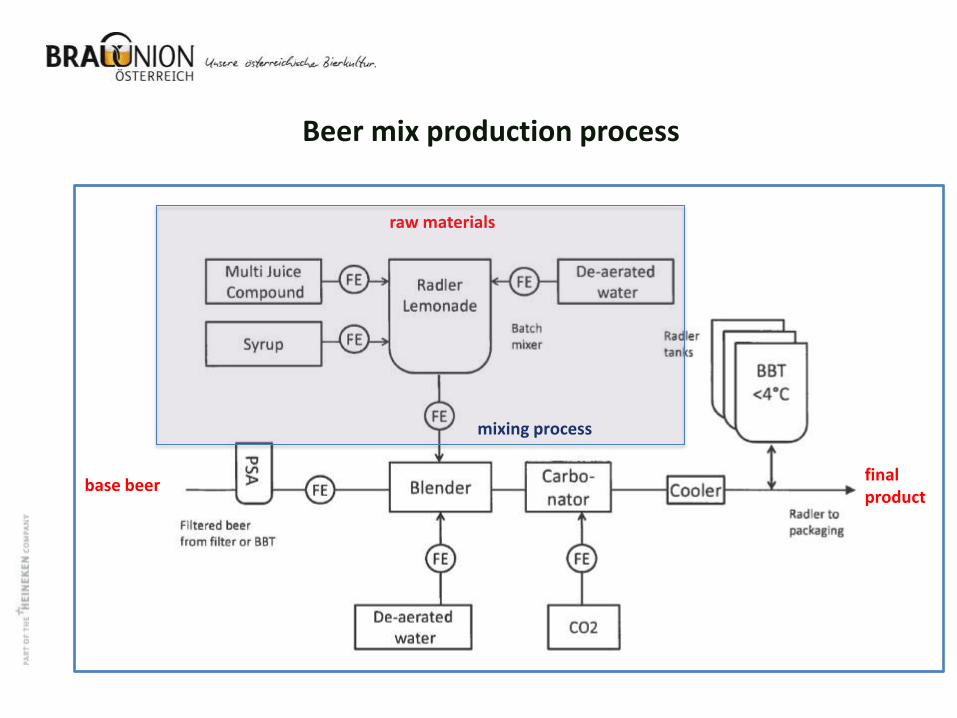
Beer mix production process
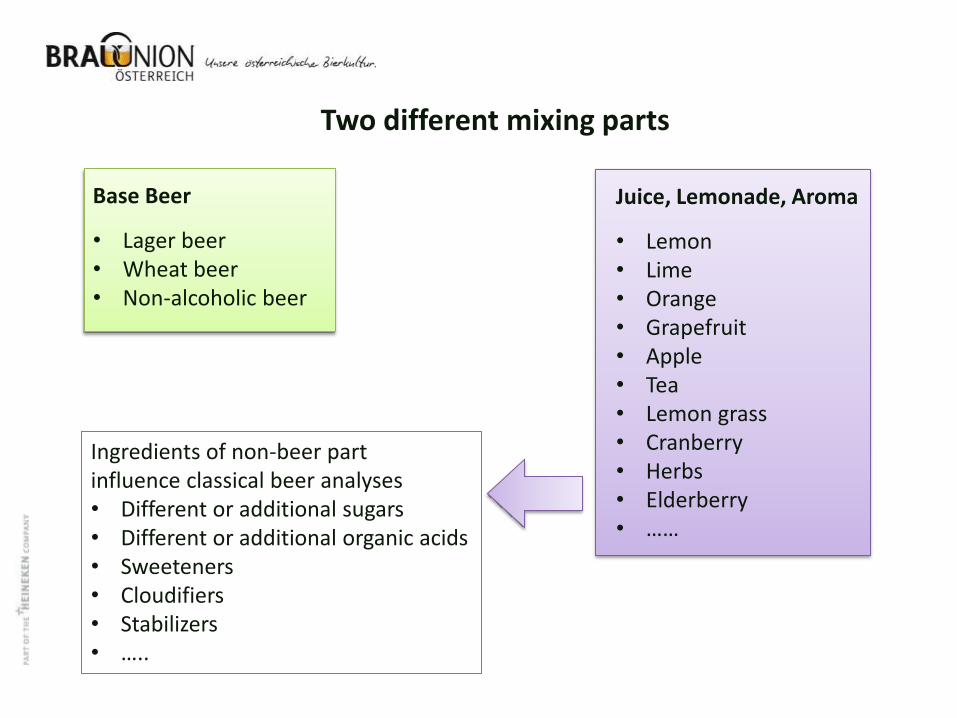
Base Beer
• Lager beer • Wheat beer • Non-alcoholic beer
Juice, Lemonade, Aroma
• Lemon • Lime • Orange • Grapefruit • Apple • Tea • Lemon grass • Cranberry • Herbs • Elderberry • ……
Ingredients of non-beer part influence classical beer analyses • Different or additional sugars • Different or additional organic acids • Sweeteners • Cloudifiers • Stabilizers • …..
Two different mixing parts

base beer: small ranges
beer mix beverage: large ranges
matrix effect
0
2
4
6
8
10
12
14
OriginalGravity
[mass%]
Alcohol[Vol%]
pH Total Acid[g/l]
citric acid[g/l]
fermentablesugar
[g/100ml]
0
2
4
6
8
10
12
14
OriginalGravity
[mass%]
Alcohol[Vol%]
pH Total Acid[g/l]
citric acid[g/l]
fermentablesugar
[g/100ml]
Concentration range of main analytical parameters

• Beer: EBC, MEBAK, ASBC • Juices: IFU (International Federation of Fruit Juice Producers)
Parameter Beer Juice Beer Mix
Brix
Density
Original Gravity
Alcohol
pH
Bitterness
CO2
Foam stability
Turbidity
Total acid
Organic acids
Sweeteners
Sugars
Analytical reference methods
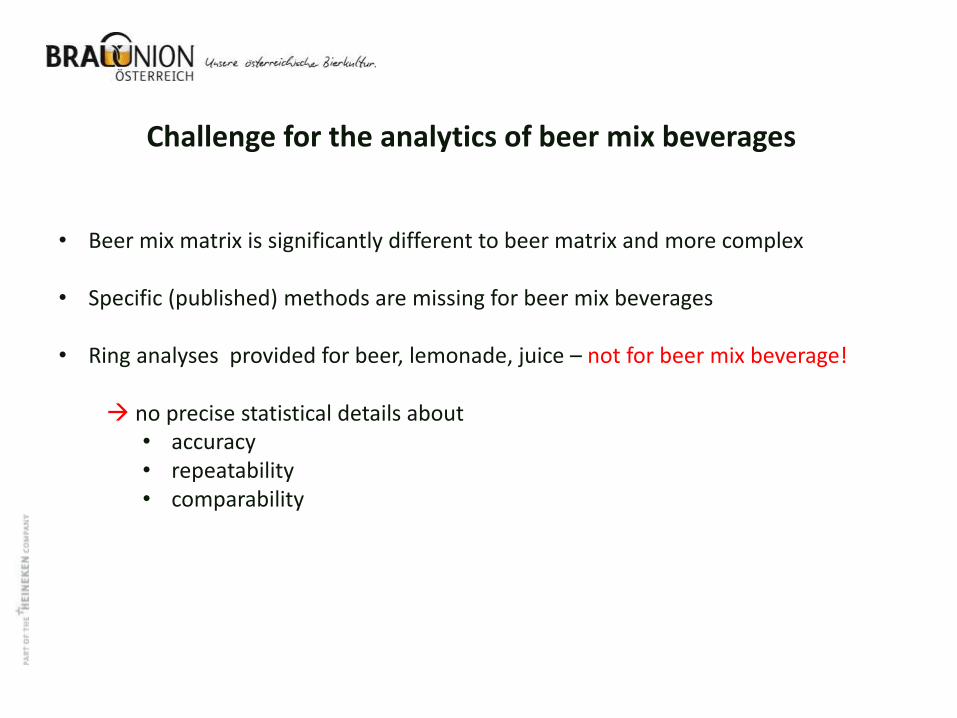
• Beer mix matrix is significantly different to beer matrix and more complex
• Specific (published) methods are missing for beer mix beverages
• Ring analyses provided for beer, lemonade, juice – not for beer mix beverage!
no precise statistical details about
• accuracy • repeatability • comparability
Challenge for the analytics of beer mix beverages
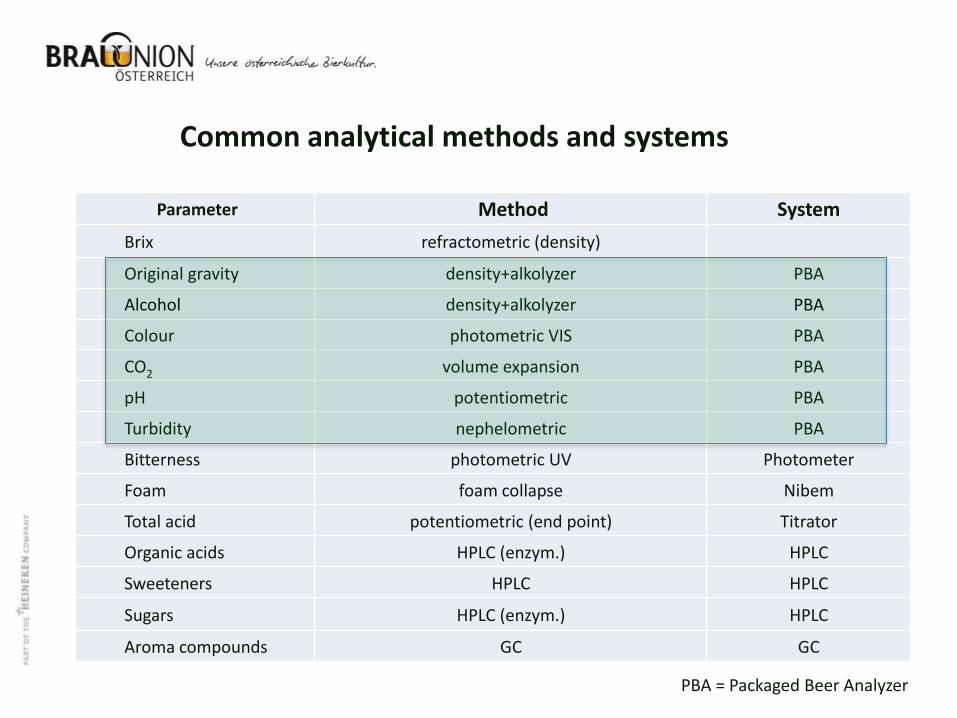
Parameter Method System
Brix refractometric (density)
Original gravity density+alkolyzer PBA
Alcohol density+alkolyzer PBA
Colour photometric VIS PBA
CO2 volume expansion PBA
pH potentiometric PBA
Turbidity nephelometric PBA
Bitterness photometric UV Photometer
Foam foam collapse Nibem
Total acid potentiometric (end point) Titrator
Organic acids HPLC (enzym.) HPLC
Sweeteners HPLC HPLC
Sugars HPLC (enzym.) HPLC
Aroma compounds GC GC
Common analytical methods and systems
PBA = Packaged Beer Analyzer

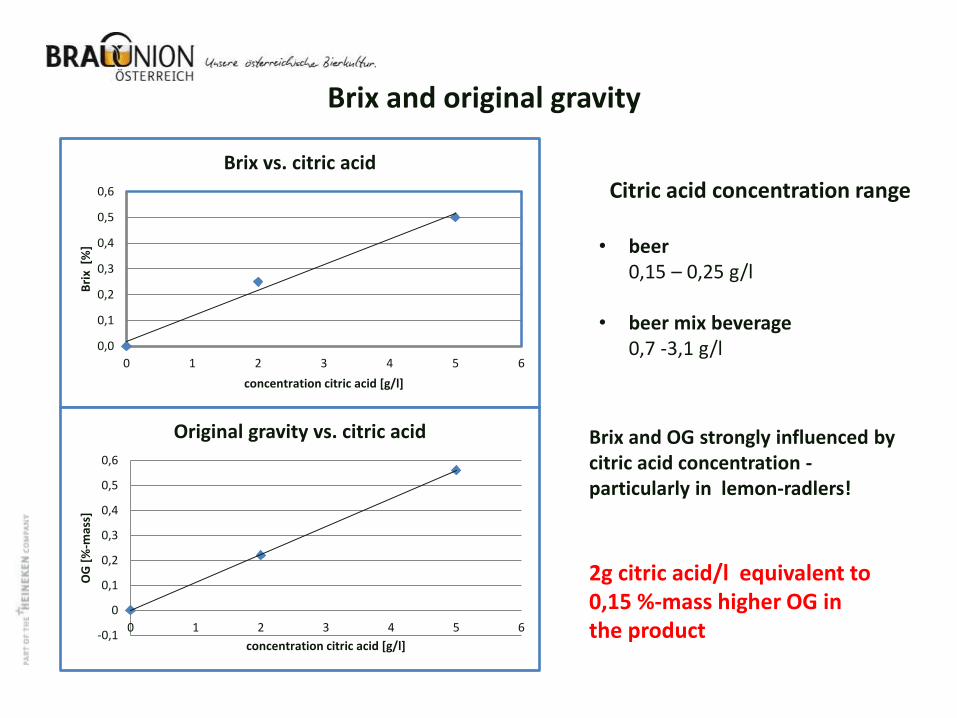
Brix: [°Bx] • Traditionally used in sugar, juice and honey manufacturing • 1 degree Brix = 1 gramm sucrose in 100g solution %-mass • Measured by refractometer or density • Standardized on sucrose table!
Original Gravity: [° Plato] • Used by brewing industrie (comparable scale to Brix if alcohol is absent!) • Calculated from density (oscillating U-tube) and alcohol measurement • Standardized on sucrose table!
Alcohol content: [%vol] • Current available technology using Alcolyzer Anton Paar (NIR technology)
Gravity and alcohol
0,0
0,1
0,2
0,3
0,4
0,5
0,6
0 1 2 3 4 5 6
Bri
x [
%]
concentration citric acid [g/l]
Brix vs. citric acid
-0,1
0
0,1
0,2
0,3
0,4
0,5
0,6
0 1 2 3 4 5 6
OG
[%
-mas
s]
concentration citric acid [g/l]
Original gravity vs. citric acid
Citric acid concentration range
• beer 0,15 – 0,25 g/l
• beer mix beverage
0,7 -3,1 g/l
Brix and OG strongly influenced by citric acid concentration - particularly in lemon-radlers!
2g citric acid/l equivalent to 0,15 %-mass higher OG in the product
Brix and original gravity
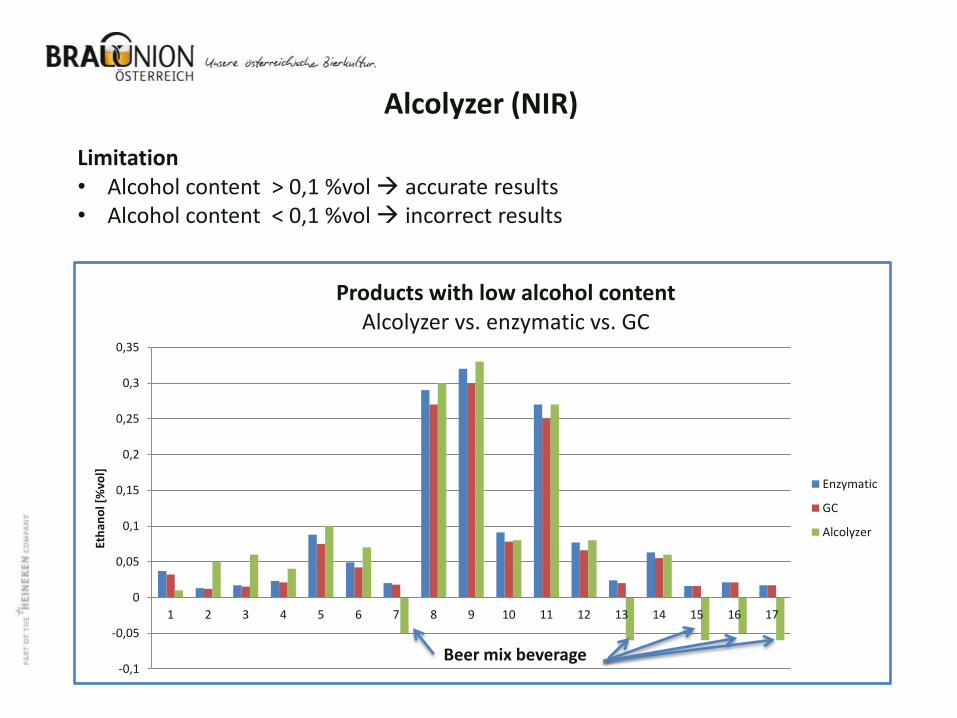
Limitation • Alcohol content > 0,1 %vol accurate results • Alcohol content < 0,1 %vol incorrect results
-0,1
-0,05
0
0,05
0,1
0,15
0,2
0,25
0,3
0,35
1 2 3 4 5 6 7 8 9 10 11 12 13 14 15 16 17
Eth
ano
l [%
vol]
Products with low alcohol content Alcolyzer vs. enzymatic vs. GC
Enzymatic
GC
Alcolyzer
Alcolyzer (NIR)
Beer mix beverage

Colour: [EBC] VIS 430nm
• Sample must be clear • Sometimes depending on amount/size of particle filtration difficult or impossible Remark: • E700nm > 0.020 A additional preparation is necessary! • Kieselguhr - membrane filtration - centrifugation - comparator • Products presenting other colours than yellow must be measured at suitable wave
length(s) or special equipment Bitterness: [EBU] iso-octan extraction, UV 275nm
• Ingredients of non-beer part can influence the result • e.g. coffein shows higher bitterness results
Colour and bitterness

Foam: [s] Nibem foam meter • Generally foam stability in beer mix beverage is lower than in beer because of
influence of essential oil in non-beer part
• Effect is time dependant and strong directly after filling Remark: • not to be analysed directly after filling!
80
90
100
110
120
130
140
filling date after 3 days after 1week
after 2week
after 3week
after 4week
after 5week
NIB
EM [
s]
Foam stability vs. time of analyses
Foam

Turbidity: [EBC]
Lagerbeer
• Turbidity 0,6 EBC • Particles: 12.000 / 5 ml • Main size < 1 µm
Beer mix beverage (Lemon Typ)
• Turbidity 54 EBC • Particles: 850.000 / 5 ml • Main size 4 - 10 µm
Turbidity

• depends on average of particle diameter and particle count • various types of product not comparable • visuell impression not always linear to measured result Remark:
• Homogensiation necessary using bottle turner due to the sedimentation
• Expand calibration range
up to 200 EBC
• Some instruments have a measurung limit at 100 EBC
(Dilution?)
0,
10,
20,
30,
40,
50,
60,
70,
0, 10, 20, 30, 40, 50, 60, 70, 80,
dir
ect
me
asu
red
[EB
C]
diluted and recalculated [EBC]
Turbidity diluted-recalculated vs. direct measurement
Turbidity

pH: • in radler approx. 1 unit lower • in case of the higher acid content
beer: pH = 4,0 - 4,6 radler: pH = 3,2 – 3,8
Remark: • Not applicable for the determination
of (total-)acid concentration (tricarbon acid / dicarbon acid)
Total acid (titratable): [g/l] • Based on endpoint of main acid
and prescribed calculation factors
• Result expressed as: e.g. total acid 2,3 g/l calculated as citric acid
pH factor
Malic acid 8,1 0,67
Citric acid 8,1 0,64
Tartaric acid 7,0 0,75
Total acid = consumption caustic * factor
0
0,5
1
1,5
2
2,5
3
3,5
4
3 3,2 3,4 3,6 3,8 4 4,2
tota
l aci
d [
g/l]
pH
pH vs total acid
Main acid is not citric acid
pH and total acid

Oganic acids: HPLC or enzymatic • Composition/ratio of different acids provide information about
origin/authenticity of non-beer part • Presence of specific/rare acids are typical for some fruits (e. g. salicylic acid in berries, sorbic acid in cranberry)
0
1
2
3
4
5
6
Co
nce
ntr
atio
n [
g/l]
Organic acids in different fruits
Malic Acid
Citric Acid
0,0
10,0
20,0
30,0
40,0
50,0
60,0
Rat
io
Ratio citric / malic acid
> 500
Organic acids

• Ratio citric acid / i-citric acid is usually used in juice industrie for evaluation of authenticity of products
• Presence of i-citric acid is good indicator for origin from citric acid in lemon based mixed beverages
• Ratio citric acid / i-citric acid in beer is approx. 10-15
• Ratio citric acid / i-citric acid in lemon radler with natural citric acid from the fruit is
approx. 30-60
• Ratio citric acid / i-citric acid in radler with added citric acid > 100 up to 300
Organic acids

Sugars: [g/100ml] HPLC
• In beer nearly all fermentable sugars present in low concentration • Spectrum of carbohydrates in beer mix beverage provide additional information:
Is sugar or artifical sweetener or both used to sweeten the product and which type of sugar is used?
0
1
2
3
4
5
6
[g/l
]
Type of sweetener
Overview of radlers from Austrian market
∑ carbohydrates
∑ sucrose, fructose, glucose
Sugars
non fermentable
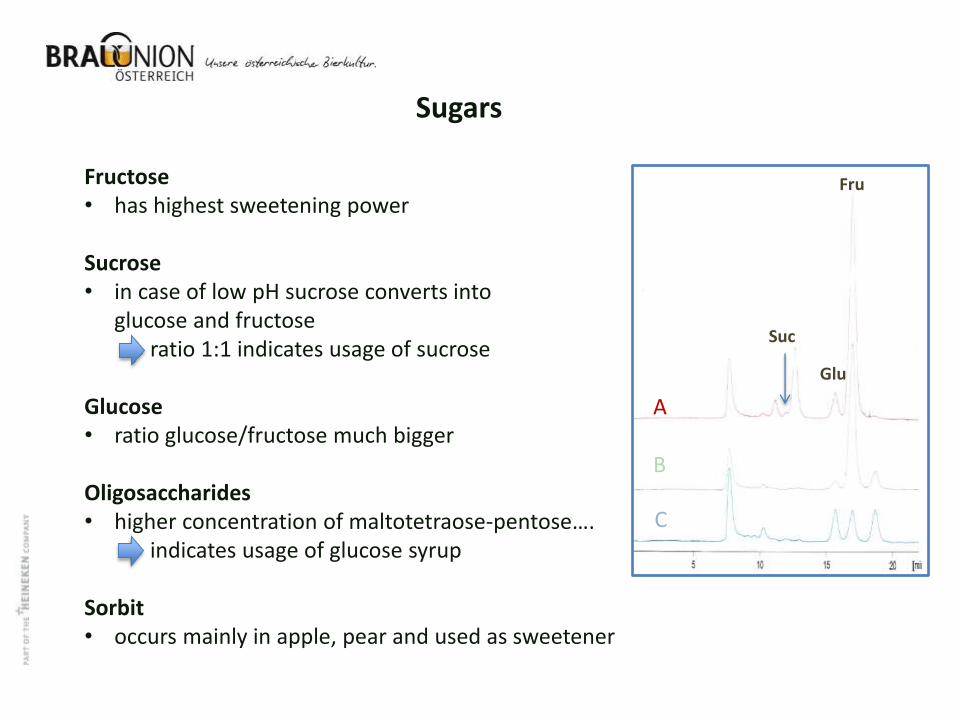
Fructose • has highest sweetening power Sucrose • in case of low pH sucrose converts into
glucose and fructose ratio 1:1 indicates usage of sucrose Glucose • ratio glucose/fructose much bigger Oligosaccharides • higher concentration of maltotetraose-pentose…. indicates usage of glucose syrup Sorbit • occurs mainly in apple, pear and used as sweetener
Fru
Glu
Suc
Sugars
A
B
C

Example: GC • Contamination of beer with turbid lemon radler • Positive sensory detection at concentration of about 0,4% Radler (4 ml/l) in beer • Analytical detection possible due to differences in matrix of beer compared to radler
e.g. turbidity, fructose, particle, aroma….
Turbidity 25°
Particle
Fructose
Citric acid
GC head space
GC extraction
EBC count g/100ml g/l peak height peak height
Pure beer 0,09 5.700 8 0,175 0 0
Beer + 0,2% radler 0,2 6.700 8 0,18 330 4.270
Beer + 1% radler 0,46 10.400 23 0,197 1.680 26.800
Beer + 3% radler 1,16 15.500 47 0,23 5.080 75.000
Detection limit too low too low too low too low 500 µl/l 100 µl/l
Limonen
Using modern technologies such as GC-SPME-MS detection limit approx. of 2µl radler in 1l beer is possible!
Troubleshooting
• Matrix of beer mix beverages more complex compared to beer
• Additional quality parameters relevant for beer mix berverages
• Matrix of non-beer part influences classical beer analyses
• No validated (normed) analytical methods available for beer mix beverages
• Specific analytes provide information on origin and authenticity of raw materials and ingredients
Conclusion