analytical mass spectrometry1 peter j baugh quay pharma training progamme day 4, september 28, 2004
TRANSCRIPT

Analytical Mass Spectrometry 1
Analytical Mass Spectrometry
Peter J Baugh
Quay Pharma Training Progamme
Day 4, September 28, 2004

Analytical Mass Spectrometry 2
Analytical Mass Spectrometry
Mass spectrometry is an extremely powerful analytical instrumental tool in its own right but also, and importantly, when coupled to a range of introductory and/or chromatographic systems, such as GC (SFC) and LC. It is used by chemists, biochemists, biologists and physicists in many fields – analytical/environmental, molecular biological, toxicological, clinical, medical and physical
MS has been at the forefront of the recent high powered research to elucidate/characterise the Human Genome and without its capability in analysis no advances would have been made in this field.
This training session is designed to introduce MS as a stand alone analytical tool and when interfaced to chromatographic systems. The following areas will be covered:
• Theory of MS – ion production, processes and mechanisms• Instrumental configurations – ionisers, analysers, detectors, data systems, scan
modes and functions• Introductory and interfaced systems• Applications in selected areas

Analytical Mass Spectrometry 3
Introduction to MS
Background: Aston in 1920s designed a mass spectrograph using a magnet to mass analyse and photographic plate to detect positive ions produced by ionisation of gases and vapours. Using this mass spectrograph he identified in excess of 200 isotopes of a wide range of chemical elements and received the Nobel prize for this work. Today we use his foundation work as a basis for the field of mass spectrometry (a term now used more frequently rather than the older term of mass spectroscopy the latter inferring that a spectroscopic detector is utilised).
Nowadays, the analysers are more wide ranging in type and in combination as follows:
• Magnetic (B) and electrostatic (E) analysers in combination, EB or reverse geometry BE
• Quadrupole (Q) and ion trap (IT) – electric fields only
• Time of flight (TOF)
• Ion cyclotron resonance (Fourier transform MS)
• In addition both hybrid and tandem analyser systems have been designed to conduct analysis using more complex scan modes, EBqQ, QTOF, ; QqQ, EBBE
Analytical Mass Spectrometry 4
Theory of Mass SpectrometryMuch work has been carried out on the theory of ion production and ion processes. Until the
1970s only positive ion mass analysis could be conducted because the ionisation modes , such as, EI, FD (FI) produced only positive ions in sufficient abundance from solids bombarded by electrons emitted from a hot filament, or by desorption - electric field application. Sample introduction was via a solids probe. Strictly speaking electrons generated could be captured by molecules in the ionisation source but with almost zero efficiency because of the large mean free path – high vacuum, very low pressure atmosphere. In fact, the efficiency of ionisation to generate positive ions is only a few %.
A positive ion, M+., are generated from a molecule of a chemical solid, M, in Electron Impact ionisation with highest efficiency by employing electrons with Ee = 70 eV as follows:
M + e- M+. + 2e-
If the radical cation formed is unstable which is often the case because it has too much kinetic energy imparted to it during the ionisation process it can break up in a number ways to produce secondary ions and neutral radicals or ions and molecular products.
M+. A+ + B. or A. + B+ or C+ + H2
The secondary ions, A+ , B+, or C+, are accelerated from the ion source using an applied voltage Vacc (high or low depending on the mode of MS) , mass analysed and detected. Some ions can also break down in flight – metastables, and such ions can be analysed also by linked scanning (EB or BE instruments only).
Analytical Mass Spectrometry 5
Theory of Mass Spectrometry Stabilisation and fragmentation of positive ions produced by EIMechanisms of positive ion breakdown are numerous and vary depending on the stability of the
ion and the nature of the molecule. The molecular ion produced by EI is commonly unstable and the breakdown or fragmentation leads to more stable ions which vary in abundance and the distinctive pattern characteristic of the molecule is termed the mass spectrum (%relative abundance versus m/z ratio). The most stable ion is termed the base ion or the base peak in the mass spectrum (100% relative abundance). The structure of a molecule can often be deduced from the mass spectral fragmentation pattern and molecules with similar structures show similar mass spectra, however, knowledge of the mass (m/z) of the molecular ion is required for confirmation. An homologous series of compounds exhibit similar mass spectra and the same base ion (100%).
For example:
N-alkanes. m/z, 57, C4H9+ , the butyl ion ; N-alkenes, m/z , 55, C4H7
+, butylene ion
; fatty acid methyl esters, m/z, 74, a stabilised ion via a McClafferty rearrangement,
CH3O – C = CH2 ]+
OHAromatic compounds exhibit molecular ions or stabilised fragment ions with the aromatic
structure intactOther ionisation modesFD generates, preferentially molecular ions or stabilised ions by elimination of water. Pseudo molecular positive and negative ions and adduct ions are form by other ionisation
processes – CI, FAB, TSP and ESI, APCI, MALDI (Laser desorption/ionisation), PD (plasma desorption 252Californium)

Analytical Mass Spectrometry 6
Mass Spectrometric instrumentationEssentially, a mass spectrometer comprises an ion source, mass analyser(s) and a detector in a high
vacuum system, almost always nowadays electronically-interfaced to a data system (DS). Ion source: (see schematic diagram – 1)Sample introduction for EI in its simplest form is via a solids probe heated to several hundred 0C.
This type of introduction is limited to organic solids of up to about 600 u RMM. Oligomers, Peptides and proteins of high RMM undergo excessive fragmentation to yield low RMM fragment ions. Excessive decomposition occurs in organic solids that decompose on heating, i.e., have no m.pt. The ions are generated in the ion source by bombardment with electrons emitted from a heated filament e.g., rhenium wire, to which a voltage is applied - 150 V. The electron energy, Ee, can be varied (10 – 120 eV) and the molecular ion stability
is inversely proportional to Ee . In an EI source the electrons are collected (go to earth). A high accelerating voltage is employed for EI in EB or BE MS and a low voltage is used for quadrupole MS. In the CI source the electrons are not collected.
Mass analysers:1. Magnetic sector/electric sector analysers: MS is fundamentally based on magnetic sector
analysers, such instruments are single focussing (SF) with respect to mass through use of a magnet only. Double focusing (DF) sector instruments either focus ions first through the electric sector (ESA), energy focusing and then the magnet (B), mass or momentum focussing, or vice versa in reversed geometry, i.e., EB or BE. The DF systems are capable of high mass resolution (0.001 u or 1 ppm), scanning metastables and linked scan functions (based on E, B and possibly Vacc together).
Analytical Mass Spectrometry 7
Diagram – 1.EI Ion Source
Analytical Mass Spectrometry 8
Mass analysers continued:Although the equation describing the relationship between m/z (m/e), B2, Vacc , r, the field radius is
based on the SF magnetic sector instrument that for the DF sector MS is more appropriate which describes the relationship between m/z, B2, the electric sector voltage, E, the distance between the ESA plates, d, the field radius, r , and the radius of curvature of the ESA, R.
m/z = B2 r2 d/ ER .
It can be seen that m/z is independent of Vacc . Scanning is conducted with respect to E, B (or V) or linked E/B or B2/E , etc. The accelerating voltage is 2 – 8 kV. The magnetic field flux is normally scanned, exponentially downwards, where m = mo. exp(-2bt) with scan rates being described in terms of seconds per decade of mass. Until the 1980s the magnet scanning was hampered by long reset times imposed by hysteresis of the magnet – the magnetic cycle involves scan-up, scan down and reset phases. Thus the scanning of a quadrupole was much faster at that stage in time. The introduction of low hysteresis magnets (laminated) with rapid reset times allowed improved scan speeds (< 0.1 sec per decade) compatible with quadrupole systems.
See schematic diagram -2 and 3 of DF magnetic sector instrument

Analytical Mass Spectrometry 9
Diagram – 2BESA of a Double Focusing MS
Diagram – 2CNormal Geometry DF MS
energy and momentum focusing
to increase mass resolution

Analytical Mass Spectrometry 10
Diagram – 3Normal Geometry DF MS showing ion optics

Analytical Mass Spectrometry 11
Mass analysers continued:2. Quadrupole mass analyser: The basic quadrupole mass analyser is an electric sector
device depending only on generation of electric fields. The analyser comprises circular (hyperbolic) four rods making up the quadrupole in which diametrically opposed rods (x and y directions) are electrically coupled to a combination of dc and rf amplitude voltages, U and V (see schematic diagram - 4).
To operate the analyser to enable mass analysis a combination of U and V must be applied to the x and y rods such that the ratio of U/V is constant. Varying the voltages over a set range allows ions of a selected m/z to undergo stable z-direction oscillations in the electric field generated at the appropriate U/V (the quadrupole is termed a mass filter for this reason). The Mathieu equations describing the trajectory in the combined field in x and y directions are not discussed here. However, it is useful to note that the application of U and V voltages is governed as follows:
x-axis rods + U + Vcos(wt) ; y-axis rods -U + Vcos(wt)The coswt relationship implies that the rf amplitude voltage,V, is 180o out of phase with the dc
voltage.The stability diagram (triangle) describing the region in which ions of a selected m/z is stable is obtained from solutions of the Mathieu equations (terms a and q) and provides information about the conditions under which mass analysis can be conducted. Essentially, only ions of a selected m/z can be analysed at a particular U/V and mass selection is maximised when ions of different m/z attain the same velocity (imposed by varying the accelerating voltage up to 20 V applied to the ions exiting from the ion source, coincidently with U/V) (see schematic diagrams – 5 and 6).
Transmission of ions is lost towards the apex of the triangle where the resolution (mass selection) is greatest and a quadrupole mass analyser is essentially capable only of low mass resolution (unit mass accuracy) where as a DF magnetic/electrostatic sector analyser system is capable of low and high mass resolution.)

Analytical Mass Spectrometry 12
Diagram – 4Quadrupole MS showing
a. X (+) and Y (-) rods coupled to dc and rf voltages forming the mass analyser
and b. ion trajectory
Analytical Mass Spectrometry 13
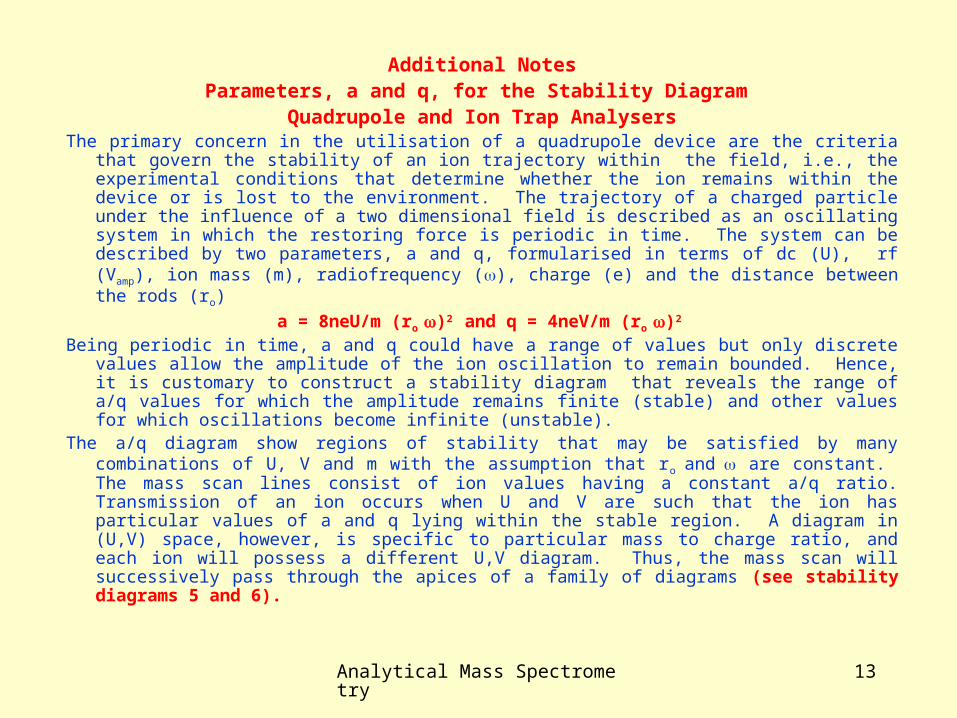
Additional NotesParameters, a and q, for the Stability Diagram
Quadrupole and Ion Trap AnalysersThe primary concern in the utilisation of a quadrupole device are the criteria that govern the
stability of an ion trajectory within the field, i.e., the experimental conditions that determine whether the ion remains within the device or is lost to the environment. The trajectory of a charged particle under the influence of a two dimensional field is described as an oscillating system in which the restoring force is periodic in time. The system can be described by two parameters, a and q, formularised in terms of dc (U), rf (Vamp), ion mass (m), radiofrequency (), charge (e) and the distance between the rods (ro)
a = 8neU/m (ro )2 and q = 4neV/m (ro )2
Being periodic in time, a and q could have a range of values but only discrete values allow the amplitude of the ion oscillation to remain bounded. Hence, it is customary to construct a stability diagram that reveals the range of a/q values for which the amplitude remains finite (stable) and other values for which oscillations become infinite (unstable).
The a/q diagram show regions of stability that may be satisfied by many combinations of U, V and m with the assumption that ro and are constant. The mass scan lines consist of ion values having a constant a/q ratio. Transmission of an ion occurs when U and V are such that the ion has particular values of a and q lying within the stable region. A diagram in (U,V) space, however, is specific to particular mass to charge ratio, and each ion will possess a different U,V diagram. Thus, the mass scan will successively pass through the apices of a family of diagrams (see stability diagrams 5 and 6).

Analytical Mass Spectrometry 14
Diagram – 5Stability Curve for ions, m1 , m2 and m3
only m2 within the region of stability, is transmitted and detected.
Diagram – 6Stability curves for ions m1 , m2 and m3

Analytical Mass Spectrometry 15
Mass analysers continued:Quadrupole analysers are said to discriminate across the mass range as m/z increases, i.e., the
transmission is reduced whereas magnetic analysers do not exhibit this effect.The triple quadrupole is capable of MS-MS, see later.Mass scanning is conducted linearly upwards with respect to the voltage applied.3. Ion trap analyser: The IT analyser can be described as a 3D quadrupole with three
hyperbolic electrodes comprising a ring and two end caps that form the core of the instrument. Similarly to the quadrupole only an electric field is generated in the ion trap and ions generated are held in the ion trap when the dc and rf amplitude voltage are applied to the ring electrode. Ion ejection is initiated by selective ramping of the fundamental rf amplitude voltage that sequentially makes ion trajectories unstable allowing mass analysis and a mass spectrum to be generated by sequential ejection of fragment ions from low to high m/z.. Ions are ejected through holes in the endcap electrode and detected by an electron multiplier. (see schematic diagram - 7)
There are two scan modes of operation • mass selective stability whereby dc and rf voltage applied to the ring electrodes are ramped
at a constant rf/dc ratio to allow stability and storage of ions of a single m/z for mass analysis
• mass selective instability whereby all ions created over a given time period are trapped and then sequentially ejected from the IT to the detector (EM). Thus ions of differing m/z are stored while mass analysis is performed. Unlike the mode above this mode coupled with the presence of helium gas (1 mtorr) in the trapping volume greatly improves mass resolution by contracting the ion trajectories to the centre of the trap and reducing the kinetic energy of the ions allowing ions of a given m/z to form a packet. These advances allowed the successful development of the commercial ITMS.

Analytical Mass Spectrometry 16
Ion Trapping: Ions created by EI, ESI or MALDI are focused using an electrostatic lensing system into the ion trap. An electrostatic ion gate pulses open (-V) and closed (+V) to inject ions into the ion trap. The pulsing of the gate differentiates ion traps from beam instruments where ions continually enter the mass analyser. The time during which the ions are allowed into the trap, termed the ionisation period, is set to maximise the signal while minimising the space-charge effects. Space-charge results from too many ions in the trap that cause a distortion of the electrical fields leading to an overall reduction in performance. The ion trap is filled typically with helium (1 mtorr). Collisions with helium molecules dampens the kinetic energy of the ions and serve to quickly contract ion trajectories toward the centre of the trap, enabling trapping of injected ions. Trapped ions are further focused toward the centre of the trap the use of an oscillating potential, referred to as the fundamental (rf), applied to the ring electrode. An ion will be stably trapped depending on the values of m/z of the ion, the size of the ion trap (r), the oscillating frequency (), and Vamp . The dependence of ion motion on these parameters is described by the dimensionless parameter qz,
qz = 4eV/mr2w2
(see schematic diagram – 7 & diagram - 8 ).
Analytical Mass Spectrometry 17
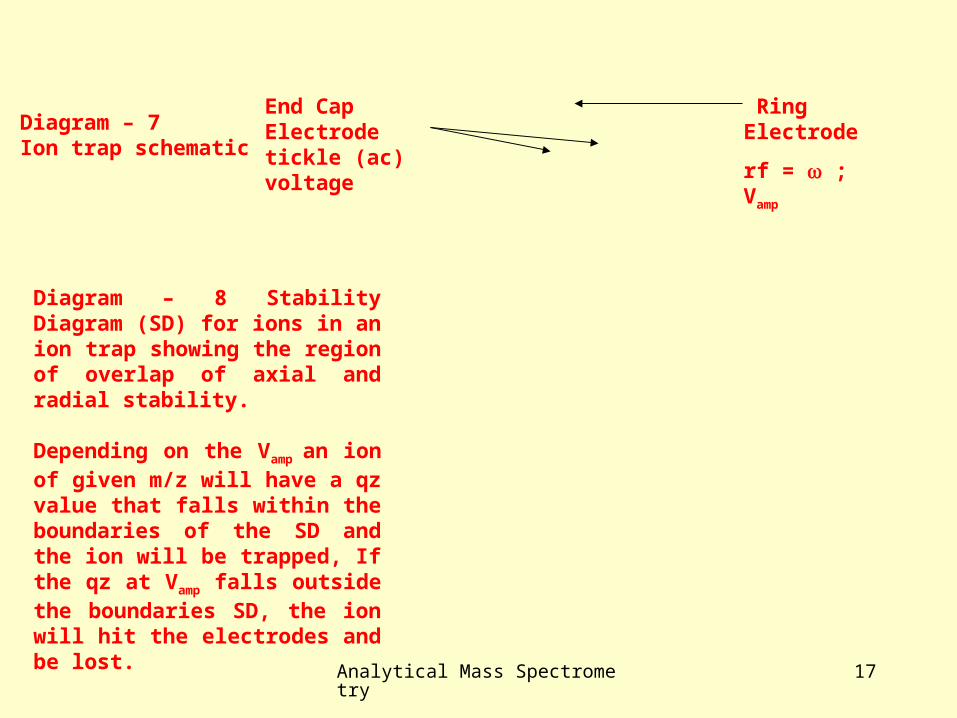
Diagram – 7Ion trap schematic
Diagram – 8 Stability Diagram (SD) for ions in an ion trap showing the region of overlap of axial and radial stability.
Depending on the Vamp an ion of given m/z will have a qz value that falls within the boundaries of the SD and the ion will be trapped, If the qz at Vamp falls outside the boundaries SD, the ion will hit the electrodes and be lost.
Ring Electrode
rf = ; Vamp
End Cap Electrode tickle (ac) voltage

Analytical Mass Spectrometry 18
Ion trap Glossary1. ac voltage- a voltage placed on the endcap electrodes used to induce resonance excitation
and resonance ejection.2. bath gas, damping gas, target gas He- in the trapping volume at 1 mtorr serves to cool the
kinetic energies and focus ion trajectories into a tight packet in the centre of the trap.3. fundamental rf- typically 1.1 MHz potential applied to the ring electrode, the amplitude of
which determines the range of m/z values that can be trapped and is ramped to eject ions.4. high resolution- the mass scan of the instrument is reduced resulting in an increase in the
density of data points per unit m/z thus increasing mass resolution.5. qz- dimensionless parameter that determines stability of ion trajectories depending upon their
m/z ratio, the size of the trap, and the amplitude and frequency of the rf.6. Resonance- an ac voltage is applied to the endcap and the qz value of an ion of interest is
changed until the secular frequency of the ion matches the frequency of the applied voltage. When resonance occurs, the amplitudes of the ion trajectories increase linearly with time. A high amplitude ac voltage will cause resonance ejection, while a low ac voltage will cause resonance excitation.
7. secular frequency- the frequency dependent upon the qz value, with which an ion oscillates in the trap.
8. space-charge effects- too many ions in the trap distort the electric fields, leading to significantly impaired performance.
9. tickle voltage- an ac voltage applied to the endcaps during the excitiation period. The amplitude is generally small so as to enable fragmentation of the ions by collision with the helium damping gas rather than ejection.

Analytical Mass Spectrometry 19
Ion excitation and ejection: Ions oscillate with a frequency, known as the secular frequency, that is determined by the values of az and qz and rf, . Resonance conditions are induced by matching the frequency of a supplementary potential by the application of a low amplitude ac resonance signal across the end cap electrodes causing the ion kinetic energies to increase and leads to ion dissociation due to many collisions with the helium damping gas. This process causes random fragmentation of the ion analogous to that obtained in TSQ MS. A mass spectrum is generated by sequentially ejecting fragment ions from low to high m/z by choosing amplitudes of the fundamental rf potential that sequentially make ion trajectories unstable. Ions are ejected through holes in the encap electrodes and detected using an electron multiplier.

Analytical Mass Spectrometry 20
The mass scanning is conducted in a manner similar to that for a quadrupole (linearly for m/z with respect to voltage).
The generation of the electric field is governed by complex Mathieu equations that do not need to be discussed here.
The nominal mass range has been extended from m/z 650 to 70,000 greater than a quadrupole MS but less than a TOF-MS. Worth noting is that multi-stage MS-MS (or MSn where n = 1 – 12) can be carried out in an ion trap directly by introduction of a collision gas (argon) causing collisionally-induced decomposition (CID) of the initial ions trapped. This feature is beyond the capability of of TSQ or TOF-MS and greatly increases the the structural information obtainable for a given molecule.
The ITMS is extremely sensitive being able to detect as few as 1.5 million peptide molecules and this feature together with others has created an interest in applications of ITMS to biological molecules. Easy access to different modes of scanning for different experiments is provided without the need for extensive manual set-up and tuning and in-depth understanding of theory thus extending the power to biologist and biochemists.

Analytical Mass Spectrometry 21
Mass analysers continued:4. Time of flight mass analyser: The TOF analyser discriminates between ions of differing
m/z by the time taken to traverse a flight tube, drift to the detector A pulse of ions is accelerated out of the source by application of a reasonably high voltage. Ions of all m/z have the same energy . Thus the velocity v decreases with increasing m/z and the time taken to reach the detector increases with m/z. The separation of ions of differing m/z depends on the time of traverse. A time signal is initiated when ions are pulsed and also when ions arrive at the detector so that the time of flight for each m/z can be measured.
See schematic diagram - 9The velocity, v, of an ion is determined by the accelerating voltage. The kinetic energy is given
by:m2v/2 = zV
where m = mass ; z = charge on ion (electronic charge) and V = accelerating voltageThe time of flight of an ion, t, is given by t = l/v where l is the length of the flight. The mass of
ion can be calculated if the time of flight, the length of flight, the charge on the electron and the accelerating voltage are known, as follows:
m/z = 2V2t2 / l2
The mass range of a TOF analyser is almost infinite and so for this reason with MALD it has found application recently in the analysis of high mass polymers for biomolecular (protein) and synthetic polymer research and applications. The resolution of a TOF-MS depends on the time spread of the ion beam and was limited to ca. 2000 u. Recent advances employ reflectron lenses (electrostatic repeller field – ion mirror) and the resulting delayed extraction allows improved resolution by minimising small differences in ion energies and resolutions of up to 12000 u
. Higher energy ions penetrate deeper into the ion mirror than lower energy ions of the same m/z and will be turned around and arrive at the detector at the same time.

Analytical Mass Spectrometry 22
Diagram – 9Reflectron TOF MS
Reflectron TOF

Analytical Mass Spectrometry 23
Ionisation methodsIonisation of a compound to produce positive ions has been exemplified so far by the well-
established conventional EI (FD) in an ion source under high vacuum conditions. Other ionisation methods are available leading to the stabilisation of pseudo molecular ions, negative ions and adduct ions. Many methods employ energetic electrons to initiate the ionisation – primary ionisation. However, if a reagent (reactant) gas is introduced a reaction of the primary ion occurs and chemical ionisation results as a secondary process leading to the production of a secondary ion from molecules of the sample to be analysed. Ionisation can be produced electrically (ESI) Atoms and ions can also be used to ionise molecules under soft ionisation conditions (FAB). Lasers can be used to desorb and ionise molecules (MALDI)
1. Chemical ionisation – positive ion CI: Chemical ionisation occurs when a reagent gas
such CH4, NH3 or isopropane is introduced into the ion source at low pressure (< 1 torr) ionisation occurs in the reagent gas to produce positive ions characteristic of the reagent gas:
CH4 + e- CH4
+ + 2e- ; CH4+ + CH4 CH3
. + CH5+ ; M + CH5
+ MH+ + CH4
The positive ion produced because of its high acidity will protonate a neutral molecule of the sample introduced to generate a pseudo-molecular ion (M + H)+ characteristic of the compound analysed. If this ion is produced in an energetic state, excess internal energy imparted during protonation, as is the case with methane, it will decompose leading to lower m/z fragment ions. However, if a softer chemical ionisation is employed as with NH3 or isopropane , the pseudo molecular ion will be more stable. NH3 leads to the formation of adduct ions at m/z, (M + 18)+ and (M + 35)+ but only with molecules containing heteroatoms with lone pairs, such as O and N.

Analytical Mass Spectrometry 24
Ionisation methods continued:2. Chemical ionisation – Negative ion CI: NICI can be achieved in several ways. When a
reagent gas is introduced the electrons emitted from the filament ionise this gas producing more electrons which have lower energies brought about through inelastic collisions with neutral molecules. Thermal electrons are subsequently produced when the electron energy is reduced to that of the surroundings and these electrons undergo resonance capture reaction with molecules of a compound to be analysed having a finite electron affinity. The process of electron capture is simply as follows:
M + e-t M.- A- + B.
The radical anion produced is sometimes unstable and undergoes dissociative electron capture
resulting in the formation of stabilised A- characteristic of the molecule. Little fragmentation often occurs in NICI.
NICI can also be conducted by using a reactant gas, X, from which reactant gas ions, X -, are generated on interaction with electrons produced by ionisation of the reactant gas. The reactant gas ion undergoes charge transfer with a molecule of a compound introduced frequently by proton transfer [X- + M XH + (M – H)- ].
3. Fast atom bombardment and secondary ion MS : The molecular ion generated through electron bombardment is very frequently unstable because the molecule is sensitive to breakdown. A much softer ionisation must be employed to produce stable molecular ions in this instance. FAB employs fast atoms or ions to sputter ions from molecules of the analyte in a liquid matrix, e.g. glycerol in which the solid compound is dispersed. The process is essentially one of desorption ionisation. Fast atoms are prepared by accelerating xenon (or argon) ions to an energy in the range of 6 – 9 KeV and then neutralising these ions by charge exchange (electron transfer) as they pass almost stationary xenon atoms at low pressures, the excess kinetic energy is transferred to the xenon atoms formed.
Analytical Mass Spectrometry 25
Xe+ + Xe Xe + Xe+
When the fast atoms impart energy into the solution of the sample in the matrix molecules of the compound are desorbed, often as ions, by momentum transfer. FAB has the capability to analyse large polar molecules and it is beneficial to couple a FAB source to magnetic sector instrument having a mass range of up to 10, 000 – 12, 000 daltons at full accelerating voltage. An alternative matrix is thioglycerol/diglyerol (1/1). It is important that the sample dissolves in the matrix and is marginally more hydrophobic than the matrix thus occupying the matrix/vacuum interface. Cs+ ions are also employed in FAB analysis (see schematic diagram - 10).
Positive and negative ion FAB mass spectra can be recorded, MH+ and (M-H+)- the molecular ion species are usually the most abundant ions and since large molecules can be analysed RMM determination is extremely easy by these techniques.
4. Plasma desorption: The principle of plasma desorption employing 252Cf PD source is illustrated in the diagram (see schematic diagram - 11). The sample is deposited on a thin metal foil, usually nickel. Spontaneous fission of 252Cf occurs and each fission event results in the formation of two fragments travelling diametrically at 180o (momentum conservation). A typical pair of fragments is 142Ba18+ and 106Tc22+ with kinetic energies of roughly 79 and 104 Mev, respectively. When a high-energy fission fragment passes through the sample foil, extremely localised heating occurs, producing a temperature in the region of 10,000 K. The molecules in this plasma zone are desorbed with the production of both positive and negative ions. The ions formed may be accelerated out into the analyser system.
252Cf PD is more able to produce molecular ion signals than FAB or SIMS in the RMM range 10,000 – 20,000 daltons, where the precision of mass determination may be +/- 10 – 20 mass units.

Analytical Mass Spectrometry 26
5. MALDI-MS: Matrix-Assisted Laser Desorption Ionisation TOF.MS is an alternative to PD-MS, see Diagram 12. For this technique a matrix is required in which the target compound is dissolved usually a viscous organic liquid – glycerol, cinnamic acid, nitrophenol derivative Since lasers only generate coherent light at specific wavelengths not all compounds undergo MALDI. The firing of the laser is synchronised with the TOF to enable accurate flight times and m/z to be recorded.

Analytical Mass Spectrometry 27
Diagram – 10FAB mechanism
Analytical Mass Spectrometry 28
Diagram –11Plasma Desorption MS

Analytical Mass Spectrometry 29
Diagram – 12MALDI MS

Analytical Mass Spectrometry 30
5. Ionisation methods and interfaces for chromatography: Ionisation devices have been specially designed for applications with chromatography in addition to
the universally used EI and CI mode (stand alone MS). The development has been rapid and GC was first coupled to mass spectrometry via a jet separator for packed column analysis and by direct insert for capillary column mode. Whereas, for LC applications the advances were more recent and have been slower, progressing through more design stages – Moving belt, Particle Beam, (FAB also stand alone), Thermospray, PD, Atmospheric Pressure Chemical Ionisation and API/Electrospray (originally developed in 1930s). Because the mobile phase is a liquid and a flow rate of 1 ml/min entering the MS on vaporisation, would create a volume of vapour which the mass spectrometer pumping system could not cope with. Therefore, there is a need in the design of the interface to reduce the volume of vapour entering.
i. The directly coupled interface for GC requires an interface oven heated to 300oC between the GC and MS through which the capillary column passes before entry into the ion source. The column exit will be at low pressure because of the vacuum effect of MS manifold reducing the column performance and shortening retention times. To overcome this effect the column can be connected via a split coupling to allow ambient pressure at the column exit by introducing helium gas via an auxiliary line (and cutting of the analytes/solvent eluting from the column if required). This device enables matching of retention data from GC/MS analysis to that obtained from conventional GC.
ii. Interfaces for LC: The interfaces developed specifically for LC include MBI, PBI, TSP, APCI and ESI. The discussion will focus mainly on APCI and API/ESI. The interface can be divided into two types, ionisation interfaces, TSP and ESI and pre-ionisation interfaces, APCI (MBI and PBI) whereby ionisation occurs in the ion source region.

Analytical Mass Spectrometry 31
Electrospray ionisation: ESI is a technique used to produce gaseous ionised species from a liquid solution generated by creating a fine spray of charged molecules in the presence of a strong electric field. The charged molecules are sprayed from the tip of metal nozzle held at approximately 3 – 4 kV and then electrostatically directed towards the mass spectrometer inlet. Either gas, heat or a combination of both are applied to the droplets to induce vaporisation prior to entering the MS. As the solvent evaporates, the electric field density increases, hence the mutual Coulombic repulsion between individual species becomes so great that it exceeds the surface tension and at the Rayleigh limit the droplet explodes forming a series of smaller, lower charged droplets. Ions leave the droplet through what is known as a ‘Taylor Cone’. The process of shrinking is repeated until individually charged analyte ions are formed. Increasing the solvent evaporation, by introducing a drying gas flow counter current to the sprayed ions increases multiple charging.
A Schematic diagram - 13 of an ESI Source and B diagram – 14 demonstrating formation of a Taylor cone and ion ejection
Atmospheric Pressure Ionisation can be carried out in two ways:(i) AP MS employing ESI which is termed, ionisation in the interface. To aid solvent evaporation and reduction in droplet
size a dryng gas N2 is introduced prior to discharge ; also later as a curtain gas to reduce clustering of ions which is a feature of ESI.
(ii) AP MS using chemical ionisation whereby a fine spray from a nebuliser is directed into the ion source to which an ionisation device is fitted, such as discharge needle (Corona) at 7 – 8 kV or plasma generated by 252Cf. Here also N2 is introduced to aid evaporation.
The AP assists in reducing the flow rate of liquid eluting from the HPLC column from 0.5 ml/min to 10 – 100 l/min so that the vacuum system of the MS can handle the inflow of the vapour generated from the liquid (NB. 1 ml of liquid, usually water, produces over 1000 ml vapour).

Analytical Mass Spectrometry 32
Diagram – 13Electrospray ion source

Analytical Mass Spectrometry 33
Diagram – 14 ESI and formation of Taylor Cone (coulombic explosion)

Analytical Mass Spectrometry 34
Tandem (Hybrid) Mass Spectrometry for Multiple Modes of Scanning (MS-MS) T(H)MS is an instrumental technique in which multiple MS-MS modes of scanning can be
conducted, is divided into three categories comprising, for the first two, combinations of analysers:
1. one type of mass spectrometer only: EB-EB, BE-EB or Q-q-Q both pure tandem MS-MS (the lower case q denotes a transmission only quadrupole)
2. two or more types of analyser in a hybrid configuration: EBqQ ; Q-TOF ; EB-Q-TOFOR a single MS system3. Ion trap MS in which MSn can be conducted where n = 1 - 12.The tandem MS-MS involving E an B sector analysers has been largely superseded by 1. TMS
involving Q analysers, 2. hybrid MS and 3. ion trap MS.The advantages of TMHS are several – higher specificity for characterising a target compound in a
complex mixture and higher sensitivity, particularly at higher mass resolution for the compound of interest (reduced ion background interference, higher S/N ratio).
The TMS configuration, QqQ, for example, allows primary or reactant ions to be selected in the first Q, to undergo collision-induced deactivation (CID) in second Q (collision gas – argon ; transmission only) and the product ions resulting to be analysed by dynamic mass scanning of the third Q (see type (i) below). For a full demo of the operation for MS-MS see Applied BioSystems HPLC TSQ MSppt notes.
The scanning can be of three types:i. Static mass scanning of the first Q and dynamic mass or selected mass scanning of the third
Q (reactant ions fragmenting to the product ionsii. Dynamic mass scanning of the first Q and static mass scanning of the third Q (product ions
having the same reactant ion)iii. Static mass scanning of the first Q and static offset mass scanning of the third Q to monitor
constant neutral loss (mass difference between reactant ion 1 and product ion 2).
Analytical Mass Spectrometry 35
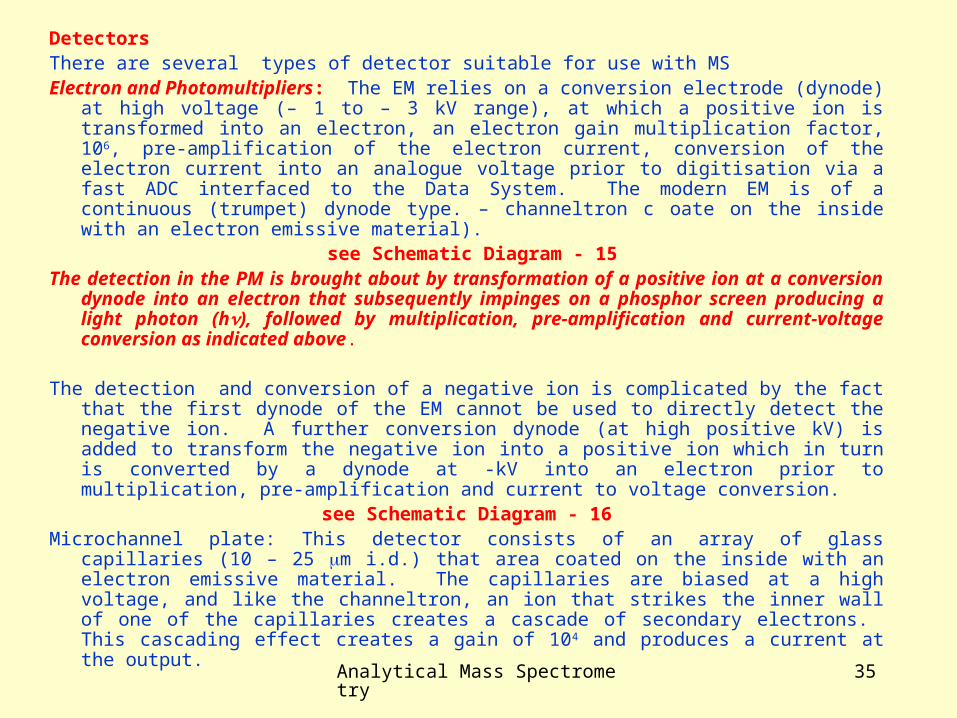
DetectorsThere are several types of detector suitable for use with MSElectron and Photomultipliers: The EM relies on a conversion electrode (dynode) at high
voltage (– 1 to – 3 kV range), at which a positive ion is transformed into an electron, an electron gain multiplication factor, 106, pre-amplification of the electron current, conversion of the electron current into an analogue voltage prior to digitisation via a fast ADC interfaced to the Data System. The modern EM is of a continuous (trumpet) dynode type. – channeltron c oate on the inside with an electron emissive material).
see Schematic Diagram - 15The detection in the PM is brought about by transformation of a positive ion at a conversion
dynode into an electron that subsequently impinges on a phosphor screen producing a light photon (h), followed by multiplication, pre-amplification and current-voltage conversion as indicated above.
The detection and conversion of a negative ion is complicated by the fact that the first dynode of the EM cannot be used to directly detect the negative ion. A further conversion dynode (at high positive kV) is added to transform the negative ion into a positive ion which in turn is converted by a dynode at -kV into an electron prior to multiplication, pre-amplification and current to voltage conversion.
see Schematic Diagram - 16Microchannel plate: This detector consists of an array of glass capillaries (10 – 25 m i.d.) that
area coated on the inside with an electron emissive material. The capillaries are biased at a high voltage, and like the channeltron, an ion that strikes the inner wall of one of the capillaries creates a cascade of secondary electrons. This cascading effect creates a gain of 104 and produces a current at the output.

Analytical Mass Spectrometry 36
Schematic Diagram - 15

Analytical Mass Spectrometry 37
Schematic Diagram - 16
Schematic Diagram - 16

Analytical Mass Spectrometry 38
Data Systems:Data system electronically interfaced to MS is vitally important for 1. Control of MS – modes of scanning, voltages, currents, etc., tuning and mass calibration2. data acquisition – the digital voltage signal response for each ion scanned transmitted from
the fast ADC3. data processing – to obtain mass spectra, %RA abundance lists, elemental composition,
selected mass chromatograms, library search – NBS/Wiley, quantitation (total ion chromatogram, TIC)
Following tuning to optimise the response – mass peak shape/intensity using a calibrant gas – pftba (quadrupole) or pfk (EB or BE) and (PEG oligomers and Cs ion clusters for high mass) and mass calibration, acquisition of data can be carried out – in conjunction with chromatography (GC or LC) or solid probe with ionisation modes - EI, FD/FI, CI, FAB, APCI/ESI, laser - LD/I, 252Cf - PD
Centroiding of the mass peak The digitised voltage and intensity of the signal (Im/z) of the ion peak detected (m/z) is proportional to the current carried by that ion and related to the time of appearance (tm/z) of that ion in the scan (a typical total scan time, span, is 0 - 1 s). The calibration table stored on the DS is used to relate the tm/z to the mass (m/z) and thus the intensity v. m/z relationship can obtained to build up the mass spectrum from the molecular ion and all the fragment ions (m/z) detected for the compound being analysed. For accurately obtaining the mass of each ion detected a process of mass centroiding is require. An adequate sampling (data points per unit time) of the mass peak is required so that the centre of mass can be determined from the mass peak profile. The width of the mass peak decreases with resolution and thus the ADC sampling rate must be extremely fast (MHz range) for EB instruments.
see Schematic Diagrams – 17 & 18

Analytical Mass Spectrometry 39
Schematic Diagram - 17

Analytical Mass Spectrometry 40
Schematic Diagram - 18
Schematic Diagram - 18

Analytical Mass Spectrometry 41
Scan modes:
Full Scan: For acquisition of the complete mass spectrum of a component in a complex mixture (GC or LC) or single compound on a probe the mode of scanning is full scan over the required mass range and 40 – 650 u is adequate for most organic compounds that are volatile (gas chromatographable). The mass range for a quadrupole is 1000 – 3000 u while that for a magnetic sector is dependent on the accelerating voltage.
Selected ion monitoring/recording (SIM or SIR): For detection of low levels of a particular known target compound in a complex mixture, monitoring of a single ion, or selected ions characteristic of the compound is required. Accurate mass tuning and optimisation is required prior to SIM. The enhancement is proportional to the time of residence on the ion selected which is typically 0.1 sec for a mass span of +/- 0.02 u as compared to full scan, 1 - 2 msec for a mass span of 1 u. The employment of internal standards (13C or 2H labelled analogues) assists in the quantitation of target compounds. For EB or BE instruments a device to lock the mass selected for the standard to that of the target is required and accurate mass is carried by out by reference to the mass calibration gas (pfk)
Multiple or selected reaction monitoring (MRM): This mode of scanning is possible only for tandem MS and similar to above the MRM can be general used or specifically to detect low levels of a target compound in a complex mixture by selecting the reactant ion and product ions generated, in one or several targets to be analysed, such that the CID is operated in a unique fashion.

Analytical Mass Spectrometry 42
Examples of Data Processing
1. Total ion chromatogram (TIC), sum of all the ions detected during a chromatographic run in each GC peak and the background (chemical noise). Diagram 19 & 20
2. Mass Spectrum, raw and refined, RA of each m/z with respect to the base ion m/z (100%). Diagram 21
3. Relative Abundance Mass Lists, raw refined, %RA of an ion, m/z, relative to the base m/z (100%).
4. Mass Chromatogram / fragmentogram processing for location of target compounds in the TIC. using selected characteristic ions, m/z. Diagram 22
5. Library search and match factors for raw and refined mass spectra to determine absolute, probable, possible and tentative ID.
Examples of Scan function operation
1. Full Scan involves a selected mass range, 45 – 450 u, depending on maximum m/z expected generating a Total Ion Chromatogram (TIC).
2. Selected or Single Ion Monitoring (SIM/SIR) requires mass calibration and full scan chromatogram operation (TIC) to obtain the accurate masses of the ions to be monitored in the GC peak of the target compounds, usually the 100% m/z and two diagnostic ions, prior to SIM chromatogram generation.
3. Selected or Multiple Reaction Monitoring (SRM/MRM) in MS-MS involves scanning of characteristic precursor ions in Q1, CID in Q2 and scanning of the product ions in Q3. Precursor ions for different compounds undergo different fragmentation reactions that may be compound specific. SIM can also be conducted using MS-MS.

Analytical Mass Spectrometry 43
Diagram 19 Typical MRM chromatogram
API 2000™ LC/MS/MS system with TurboIonSpray® source
Desethylatrazine
188/146 2ng/mL
Desisopropylatrazine
174/68 10ng/mL
Simazine
202/68
1ng/mL
Atrazine
216/174
1ng/mL
Propazine
230/146
1ng/mL
Analytical Mass Spectrometry 44
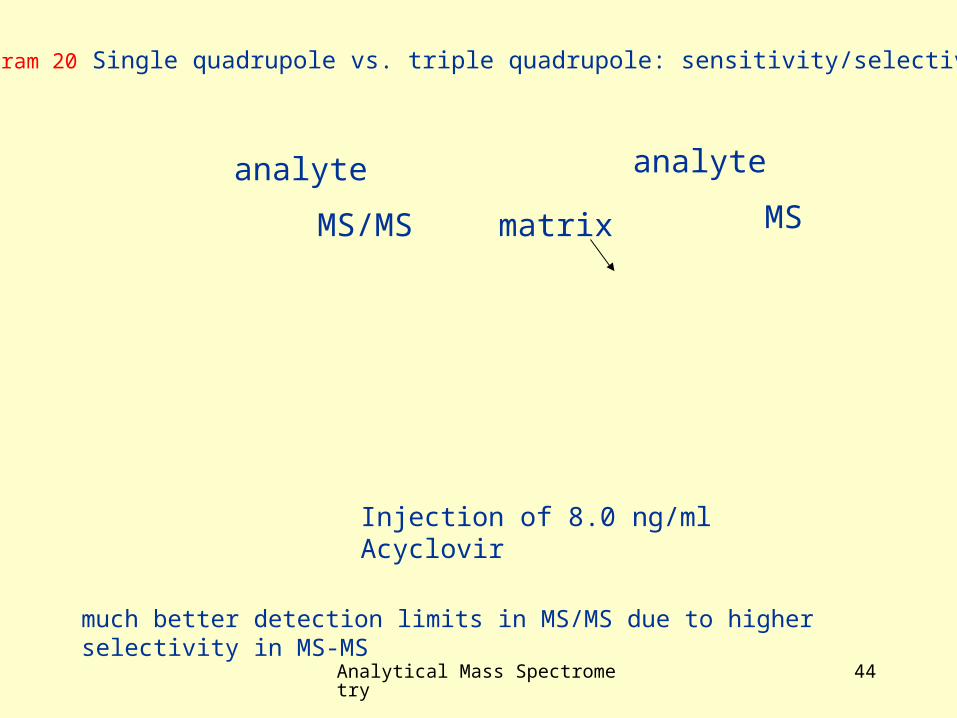
Diagram 20 Single quadrupole vs. triple quadrupole: sensitivity/selectivity
MS/MS
analyte
MS
analyte
matrix
Injection of 8.0 ng/ml Acyclovir
much better detection limits in MS/MS due to higher selectivity in MS-MS
Analytical Mass Spectrometry 45
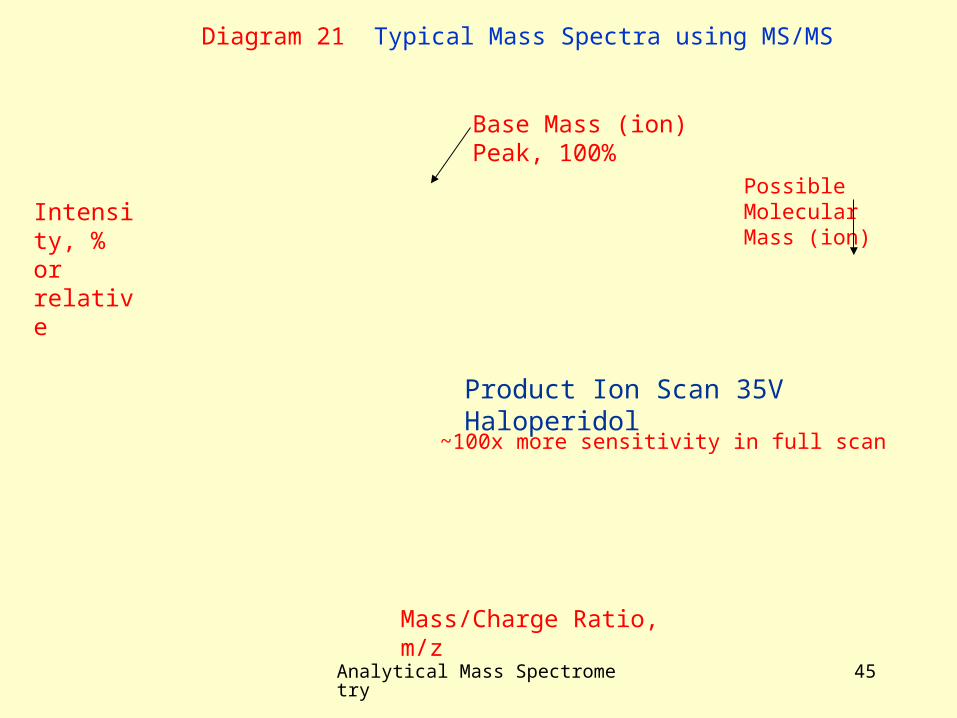
Diagram 21 Typical Mass Spectra using MS/MS
Mass/Charge Ratio, m/z
Intensity, % or relative
Base Mass (ion) Peak, 100%
Possible Molecular Mass (ion)
Product Ion Scan 35V Haloperidol
~100x more sensitivity in full scan

Analytical Mass Spectrometry 46
Diagram 22. Mass Chromatograms (Fragmentograms) generated through Data Processing from the Total Ion Chromatogram (m/z 191 and 218 selected),