analytical functions to predict cosmic-ray neutron spectra
TRANSCRIPT

544
RADIATION RESEARCH 166, 544–555 (2006)0033-7587/06 $15.00� 2006 by Radiation Research Society.All rights of reproduction in any form reserved.
Analytical Functions to Predict Cosmic-Ray Neutron Spectrain the Atmosphere
Tatsuhiko Satoa,1 and Koji Niitab
a Japan Atomic Energy Agency (JAEA) and b Research Organization for Information Science and Technology (RIST), Ibaraki, Japan
Sato, T. and Niita, K. Analytical Functions to Predict Cos-mic-Ray Neutron Spectra in the Atmosphere. Radiat. Res. 166,544–555 (2006).
Estimation of cosmic-ray neutron spectra in the atmospherehas been an essential issue in the evaluation of the aircrewdoses and the soft-error rates of semiconductor devices. Wetherefore performed Monte Carlo simulations for estimatingneutron spectra using the PHITS code in adopting the nucleardata library JENDL-High-Energy file. Excellent agreementswere observed between the calculated and measured spectrafor a wide altitude range even at the ground level. Based ona comprehensive analysis of the simulation results, we proposeanalytical functions that can predict the cosmic-ray neutronspectra for any location in the atmosphere at altitudes below20 km, considering the influences of local geometries such asground and aircraft on the spectra. The accuracy of the an-alytical functions was well verified by various experimentaldata. � 2006 by Radiation Research Society
INTRODUCTION
In the last decade, protection for aircrews against terres-trial cosmic rays has been one of the most extensively dis-cussed issues in dosimetry. Furthermore, increasing atten-tion has been paid to the soft errors of semiconductor de-vices induced by the cosmic rays even at the ground level,since the miniaturization of the devices causes a large de-crease in their critical charges. These radiation effects aretriggered predominantly by neutrons produced by nuclearreactions between the cosmic rays and atmospheric com-ponents. Therefore, estimation of cosmic-ray neutron spec-tra in the atmosphere is an essential issue in the evaluationof the aircrew doses and the soft-error rates (SERs).
A number of studies have been devoted to the estimationof neutron spectra. For instance, Ziegler (1) proposed anempirical formula for predicting the high-energy neutronspectra to estimate SERs at ground level. O’Brien et al. (2)developed a deterministic code LUIN based on an analyt-
1 Address for correspondence: Research Group for Radiation Protec-tion, Division of Environment and Radiation Sciences, Nuclear Scienceand Engineering Directorate, Japan Atomic Energy Agency, Tokai, Naka,Ibaraki, 319-1195, Japan; e-mail: [email protected].
ical two-component solution of the Boltzmann transportequation. The code is capable of estimating the altitudedependences of aircrew doses and integrated neutron fluxesprecisely and is adopted in the route dose calculation codeCARI-6 (3). Several authors (4–6) adopted a Monte Carloparticle transport code, FLUKA (7, 8), for the calculationof the cosmic-ray propagation in the atmosphere. Their cal-culation methods were successful in reproducing the neu-tron spectra measured at high altitudes, and a similar modelwas employed in the European Program Package for theCalculation of Aviation Route Doses, EPCARD (9). How-ever, the cosmic-ray neutron spectra depend not only on theatmospheric depth, cut-off rigidity and solar modulation(referred to here as global conditions) but also on the struc-ture of the aircraft (10) and the water density around thepoint of interest (4) (referred to here as local geometries)in an intricate manner, and none of the existing models canreproduce the measured neutron spectra at any location andtime with satisfactory accuracy.
With these situations in mind, we have calculated thecosmic-ray neutron spectra by performing a Monte Carloparticle transport simulation in the atmosphere based on theParticle and Heavy Ion Transport code System, PHITS (11),using the latest version of the nuclear data library JENDL-High-Energy File (JENDL/HE) (12, 13). In the simulation,cosmic rays with charges up to 28 (Ni) were incident onthe Earth system represented by the concentric sphericalshells, and the neutron spectra in each shell, i.e. a certainaltitude range, were obtained. Based on a comprehensiveanalysis of the simulation results, we proposed analyticalfunctions to predict the cosmic-ray neutron spectra at anyglobal condition at altitudes below 20 km, considering thelocal geometry effect.
This paper describes the details of the simulation pro-cedure, together with the comparison of results between thecalculated and experimental neutron spectra. The derivationand verification of the analytical function are also discussedin detail below.
MONTE CARLO SIMULATION
Incident Cosmic Rays
In the simulation, cosmic rays were incident on the Earthsystem at the altitude of 86 km up to which the US-Stan-

545PREDICTION OF COSMIC-RAY NEUTRON SPECTRA
dard-Atmosphere-1976 has atmospheric data. Protons, �particles and heavy ions with charges up to 28 (Ni) wereconsidered as the source particles, although the contribu-tions of heavy ions to the cosmic-ray neutron spectra aregenerally small.
The spectra of the incident particles were estimated bythe CREME96 code (14). In the code, the effect of thegeomagnetic field on the spectra was considered by speci-fying the McIlwain L, where the vertical cut-off rigidity rc
in units of GV is related to this parameter by the simpleformula
2r � 14.5/L .c (1)
It should be noted that the output fluxes of CREME96 arethe averaged values for all directions after accounting forthe solid Earth’s shadowing effect. Hence the values shouldbe converted into downward fluxes by multiplying the fac-tor of 4�/(4� � �E), where �E is the solid angle of theEarth from a point at the altitude of 86 km, to be employedin our simulation.
Atmospheric Propagation
The atmospheric propagation of the incident cosmic raysand their associated cascades was simulated by the PHITScode, which can deal with the transports of all kinds ofhadrons and heavy ions with energies up to 200 GeV/nu-cleon. PHITS is based on the high-energy hadron transportcode NMTC/JAM (15) and incorporates the MCNP4C code(16) for low-energy neutron transports and the JAERIQuantum Molecular Dynamics (JQMD) model (17) forsimulating nucleus-nucleus interactions. PHITS can alsotreat the transport of photons, electrons and muons, but theywere not considered in our current simulation, since ourprimary interest was in the evaluation of the neutron spec-trum, in which they play a negligible role. Note that suchelectromagnetic radiations have a significant contributionto the total aircrew dose, and a simulation to estimate theirspectra in aircraft is to be performed in the future.
For nuclear reactions induced by neutrons and protonsbelow 3 GeV, the latest version of JENDL/HE was adoptedin our simulation instead of the widely used model of theintranuclear cascade (INC) (18). This is because the INCmodel tends to overestimate the yields of high-energy sec-ondary particles knocked out from light nuclei such as ni-trogen and oxygen, which are the dominant components ofthe atmosphere. This tendency causes the overprediction ofneutron fluences in deep-penetration calculations.
The atmosphere was divided into 28 concentric sphericalshells. The densities and temperatures of each shell weredetermined referring to the US-Standard-Atmosphere-1976.The atmosphere is assumed to be composed of 75.4% ni-trogen, 23.3% oxygen and 1.3% argon by mass above thealtitude of 2 km, and additionally, 0.06% hydrogen by massbelow this altitude due to the existence of water vapor. Notethat argon was replaced by the atom with the same mass
number—calcium—in our simulation, since JENDL/HEdoes not yet include the data for argon. The Earth wasrepresented as a sphere with the radius of 6378.14 km, andits composition was assumed to be 59.2% oxygen, 28.0%silicon, 10.6% aluminum and 2.2% hydrogen by mass. Thisconstitution corresponds to 60% SiO2, 20% Al2O3 and 20%H2O by mass. The particles arriving at 1000 g/cm2 belowthe ground level were discarded in the simulation for re-ducing the computational time, since there are few albedoneutrons from so deep underground to the atmosphere.
Comparison with Experiments
Figure 1 shows the comparisons of the calculated neutronspectra with the corresponding experimental data obtainedby Goldhagen et al. (19) and Nakamura et al. (20). Notethat all the neutron spectra are expressed in terms of perunit lethargy throughout this paper. The statistical errors inthe values obtained by the simulation are generally small—less than approximately 5% and 20% for the high-altitudeand ground-level data, respectively, except for very highand low energies. The results at the altitudes below 2 m(�1035 g/cm2) are depicted in the figure at the ground levelto consider the effect of the Earth’s albedo neutrons pre-cisely. The spectra predicted by the analytical functionsproposed in the next section are also plotted in the figures.
Two peaks around 1 MeV and 100 MeV can be observedin every spectrum. The former is attributed to neutronsemitted by the evaporation process, while the latter is at-tributed to those produced by the pre-equilibrium and in-tranuclear cascade processes; these are called the evapora-tion and the pre-equilibrium peak, respectively, in this pa-per. The peaks at the thermal energy can be found only inthe spectra at the ground level, since they are composedpredominantly of the Earth’s albedo neutrons.
It is evident from the figure that our simulation can re-produce the experimental data for a variety of global con-ditions very well. We therefore concluded that the cosmic-ray neutron spectra estimated by our simulation are preciseenough to be used in systematic analysis for developinganalytical functions. It should be noted that slight overes-timations by the simulation can be observed in the evapo-ration peaks at high altitudes. This discrepancy is due toour ignorance of the shielding effect of aircraft in the spec-tra; the details of the effect will be discussed in the nextsection.
ANALYTICAL FUNCTION
Global Condition Dependence of Cosmic-Ray NeutronSpectrum
To analyze the dependences of the cosmic-ray neutronspectra on the global conditions, the simulations of the at-mospheric propagation in semi-infinite atmosphere wereperformed to obtain reference spectra without the distur-bance of the local geometry effects. The semi-infinite at-

546 SATO AND NIITA
FIG. 1. Calculated and experimental neutron spectra in the atmosphere for various global conditions. Panels A and B show the comparison withthe data measured by Goldhagen et al. (19) and Nakamura et al. (20), respectively. The values of d and rc are the atmospheric depth and the cut-offrigidity, respectively, while smin and smax indicate the solar minimum and maximum, respectively. These denotations are also used in the other figures.Equations (10) and (18) were adopted in the calculation of the analytical values for the ground level and high altitudes, respectively.
FIG. 2. Neutron flux ratios normalized at (panel A) sea level and (panel B) the solar minimum with the cut-off rigidity 1 GV, obtained by the MonteCarlo simulation for the semi-infinite atmosphere. Panel A shows the atmospheric-depth dependence of the neutron spectra, fixing the cut-off rigidityand the solar condition, while panel B depicts spectral dependence on the cut-off rigidity and the solar condition at a conventional commercial flightaltitude. The gray lines in panel A indicate the spectra for the altitudes over the Pfotzer maximum.
mosphere consists of the dry air only, even at subterraneanregions down to 1000 g/cm2 below sea level. The simula-tions were carried out for the solar minimum and solarmaximum with modulation potentials of approximately 465
and 1700 MV, respectively, and 15 geomagnetic fields withthe vertical cut-off rigidities from 0.1 to 14 GV.
Figure 2 provides graphical presentations of the globalcondition dependences of the neutron spectra in the semi-

547PREDICTION OF COSMIC-RAY NEUTRON SPECTRA
FIG. 3. Integrated fluxes of neutrons with energies below 15 MeV �L
under the solar minimum and with several cut-off rigidities.
infinite atmosphere. It is found from the figures that theshapes of the neutron spectra below 15 MeV are almostindependent of the global conditions, except for those atthe altitudes over Pfotzer maximum (�18 km) as denotedby gray lines in Fig. 2A. This is because equilibrium be-tween production and deceleration of neutrons is estab-lished in the lower energy regions. We therefore expressthe neutron spectra in the semi-infinite atmosphere Inf asthe product of the basic spectrum B and the integratedneutron flux below 15 MeV denoted as �L as follows:
(s, r , d, E) � (s, r , d, E)� (s, r , d),Inf c B c L c (2)
where s, rc, d and E denote the solar modulation potential,vertical cut-off rigidity, atmospheric depth and neutron en-ergy, respectively; we analyze the dependences of �L andB on the parameters separately. The advantage of intro-ducing B is that the spectrum below 15 MeV is almostindependent of the global conditions for altitudes under 20km, and it can be expressed by a relatively simple equation,as described later in this section. Since commercial flightsnever exceed the altitude of 20 km, we will discard theneutron spectra above the altitude in the following analysisfor the purpose of simplification and propose analyticalfunctions for predicting the neutron spectra at altitudes un-der 20 km.
Low-Energy Neutron Flux
The low-energy neutron fluxes �L obtained by the sim-ulations under the solar minimum with several cut-off ri-gidities are shown in Fig. 3 as a function of the atmosphericdepth. As expected from previous studies, �L reaches itsmaximum at around 100 g/cm2 and then decreases with theincrease in the atmospheric depth. Assuming that the equi-librium between incoming and outgoing low-energy neu-
trons fluxes is established, the differential equation of �L
with respect to the depth can be expressed by
� (s, r , d)L c � N (s, r , d) � � � (s, r , d), (3)p c A L cd
where NP and �A�L, respectively, are the number of pro-duced and absorbed neutrons with energies below 15 MeVin the unit volume, with �A denoting the macroscopic ab-sorption cross-section in the atmosphere. The parameter NP
is significantly related to the high-energy particle fluxes,and we assumed that the dependence of NP on the depthcan be represented by an exponential decay curve. Basedon the assumption, �L can be expressed by
� (s, r , d) � a (s, r ){exp[�a (s, r )d]L c 1 c 2 c
� a (s, r )exp[�a (s, r )d]}, (4)3 c 4 c
where a1 to a4 are the parameters depending on the mod-ulation potential and cut-off rigidity. In the derivation ofthe equation, we also assumed that no neutron exists at thetop of the atmosphere, i.e. �L(s, rc, 0) � 0. If the all as-sumptions were completely true, then a3 and a4 should beequal to 1 and �A, respectively. However, the validity ofthese assumptions is not always established, and hence a3
and a4 are also regarded as the global condition-dependentparameters in our model. The values of the parameters afor each condition were determined by least-squares fittingof the �L data.
Figure 4 plots the parameters obtained as a function ofthe cut-off rigidity and solar modulation. It is seen fromthe figure that the differentials of the parameters with re-spect to the cut-off rigidity generally become the maximumat rc around 4 GV. The solar modulation affects the param-eters only at lower cut-off rigidities except for a1, since theincident particle spectra calculated by CREME96 are al-most independent of the solar condition at higher cut-offrigidities. We therefore introduced a sigmoid function togenerate the best-fitting curve to the parameters:
b (s)i2a (s, r ) � b (s) � , (5)i c i1 1 � exp[(r � b )/b ]c i3 i4
where bi1 to bi4 are free parameters, and only b11 and bi2
are related to the solar modulation; i.e., b21, b31, b41, bi3 andbi4 are the constant. It should also be noted that the sigmoidfunction was also adopted in the work of Lewis et al. (21)for expressing the dependence of aircrew doses on the cut-off rigidity. Table 1 summarizes the numerical values of theparameters b obtained from the least-squares fitting of thea data shown in Fig. 4. We assumed that the dependencesof b11 and bi2 on the solar modulation s can be expressedas a linear relationship:
b(s )(s � s) � b(s )(s � s )min max max minb(s) � , (6)s � smax min
where smin and smax denote the minimum and maximum ofs, 465 and 1700 MV, respectively. The validity of the lin-

548 SATO AND NIITA
FIG. 4. The dependences of parameters a used in Eq. (4) on the cut-off rigidity. The solid and open circles are the values obtained by theleast-squares fitting of the Monte Carlo simulation results for the solarminimum and maximum, respectively, while the solid lines denote thevalues calculated by the sigmoid function of Eq. (5).
TABLE 1Numerical Values of the Parameters b used in Eq.(5) Obtained from the Least-Squares Fitting of the
a Data Shown in Fig. 4
Unit of ai bi1 bi2 bi3 (GV) bi4 (GV)
a1 (cm�2 s�1) 13.9 25.5 5.62 1.79(12.9) (15.7)
a2 (cm2 g�1) 0.00706 6.73 10�4 5.99 1.94(5.70 10�4)
a3 0.975 0.292 0.99 2.24(�0.210)
a4 (cm2 g�1) 0.00840 0.00582 2.24 2.66(0.00441)
Notes. The values in parentheses are the data for the solar maximum,while the others are those for the solar minimum or the solar-independentparameters. The units of bi1 and bi2 are the same as those of ai.
FIG. 5. The mean basic spectrum B. The gray line indicates the av-eraged spectrum for the Monte Carlo results of B for all the globalconditions except for altitudes over 20 km, while the dashed line denotesthe values calculated by Eq. (7).
ear-relationship assumption could not be verified, since weperformed the Monte Carlo simulation only for the solarminimum and maximum conditions. However, the differ-ences in �L between the two conditions are at most 50%,and the error associated with introducing the assumptioncan be considered small.
The calculated a parameters using Eq. (5) are also de-picted in Fig. 4. The agreements between the data are quitesatisfactory for all the cases. The low-energy neutron flux�L can be estimated analytically by substituting the param-eters a obtained from Eq. (5) into Eq. (4); the results arealso shown in Fig. 3. It is evident from this graph that theanalytical function can reproduce the Monte Carlo resultsvery well.
Mean Basic Spectrum
Although the basic spectrum B depends on the globalconditions, it is worthwhile to analyze the mean basic spec-
trum B that can be obtained by averaging B for all thecases—18 altitude ranges below 20 km, two solar condi-tions, and 15 geomagnetic fields. The graphical presentationof B is given in Fig. 5. To reproduce B by an analyticalfunction, we propose the following equation composed ofthree terms that represent the evaporation and pre-equilib-rium peaks, and the pedestal part, respectively:
c3 2E �E �[log (E) � log (c )]10 10 5 (E) � c exp � c expB 1 4 2� � � � � �c c 2[log (c )]2 2 10 6
E E� c log 1 � tanh c log7 10 9 10� �� � � �[ ]c c8 10
E 1 � tanh c log , (7)11 10� � � �[ ]c12
where c1 to c12 are constant parameters. The parameter c3
is fixed at 0.5 for the conventional evaporation spectrum,but it is regarded as a free parameter in our model sincethe peak has been disturbed by the deceleration and ab-sorption before the equilibrium is accomplished. Note that

549PREDICTION OF COSMIC-RAY NEUTRON SPECTRA
TABLE 2Numerical Values of the Parameters c used in Eq.(7) Obtained from the Least-Squares Fitting of the
B Data Shown in Fig. 5�
Unit of ci ci
c1 (lethargy�1) 0.229c2 (MeV) 2.31c3 0.721c4 (lethargy�1)a 0.0516c5 (MeV) 126c6 (MeV) 2.17c7 (lethargy�1) 0.00108c8 (MeV) 3.33 10�12
c9 1.62c10 (MeV) 9.59 10�8
c11 1.48c12 (MeV)a 299
a Dependent on the global conditions assumed for estimating B.
FIG. 6. The parameters c4 and c12 used in Eq. (7) for representing theglobal-condition dependence of the neutron spectra in the semi-infiniteatmosphere.
the second and third terms in the equation were introducedonly for reproducing the simulation result, and little phys-ical meaning exists in their forms.
The numerical values of the parameters c obtained fromthe least-squares fittings of the B data shown in Fig. 5 arelisted in Table 2. The B calculated from Eq. (7) is depictedin Fig. 5. The figure clearly indicates that the analyticalfunction can reproduce the simulation results very well.
Global Condition Dependence of Basic Spectrum
As mentioned before, the basic spectrum B depends onthe global conditions at energies above 15 MeV. It can bededuced from Fig. 2 that the global conditions affect B
with regard to the height of the pre-equilibrium peak andthe high-energy edge of the spectra. Figure 2B also showsthat the influence of the solar condition on B is limited tothe lower cut-off rigidity cases. We therefore surmised thatc4 and c12, which are respectively related to the magnitudeof the pre-equilibrium peak and the high-energy edge ofthe pedestal part, are dependent on both atmospheric depthand cut-off rigidity, and the others are the constant for allthe conditions.
Figure 6 plots the values of c4 and c12 obtained from theleast-squares fitting of B after fixing the other c parametersfor several cut-off rigidities as a function of the atmosphericdepth. In general, c4 rises with an increase in the atmo-spheric depth and a decrease in the cut-off rigidity, whereasthe relation is reversed for c12. For the purpose of estimatingthe depth dependences of c4 and c12, we introduced the fol-lowing functions:
a d6c (r , d) � a (r ) � and (8)4 c 5 c 1 � a exp(a d)7 8
c (r , d) � a (r ){exp[�a (r )d] � a (r )exp(�a d)},12 c 9 c 10 c 11 c 12
(9)
where a5 to a12 are free parameters, and only a5, a9, a10 anda11 are related to the cut-off rigidity. The numerical values
of the parameters can be obtained by the least-squares fit-ting of the parameters c4 and c12. The dependences of a5,a9, a10 and a11 on the cut-off rigidity are illustrated in Fig.7. For best-fit curves to reproduce the cut-off rigidity de-pendences of the parameters, we also employed the sigmoidfunction defined in Eq. (5). Table 3 summarizes the nu-merical values of the parameters b obtained from the least-squares fitting of the a data shown in Fig. 7, together withthe constant values of a6, a7, a8 and a12. The calculatedresults from the analytical functions adopting these param-eters are also shown in Figs. 6 and 7. It is clear from thediagrams that the analytical functions can reproduce thesimulation result fairly well.
The basic spectrum B for each condition can be esti-mated using Eq. (7), using the c4 and c12 values obtainedfrom Eqs. (8) and (9), respectively, instead of the data listedin Table 2. The neutron spectra in the semi-infinite atmo-sphere Inf can be predicted by multiplying B by the low-energy neutron flux �L obtained from Eq. (4), as indicatedby Eq. (2).
Comparison with Simulation Results
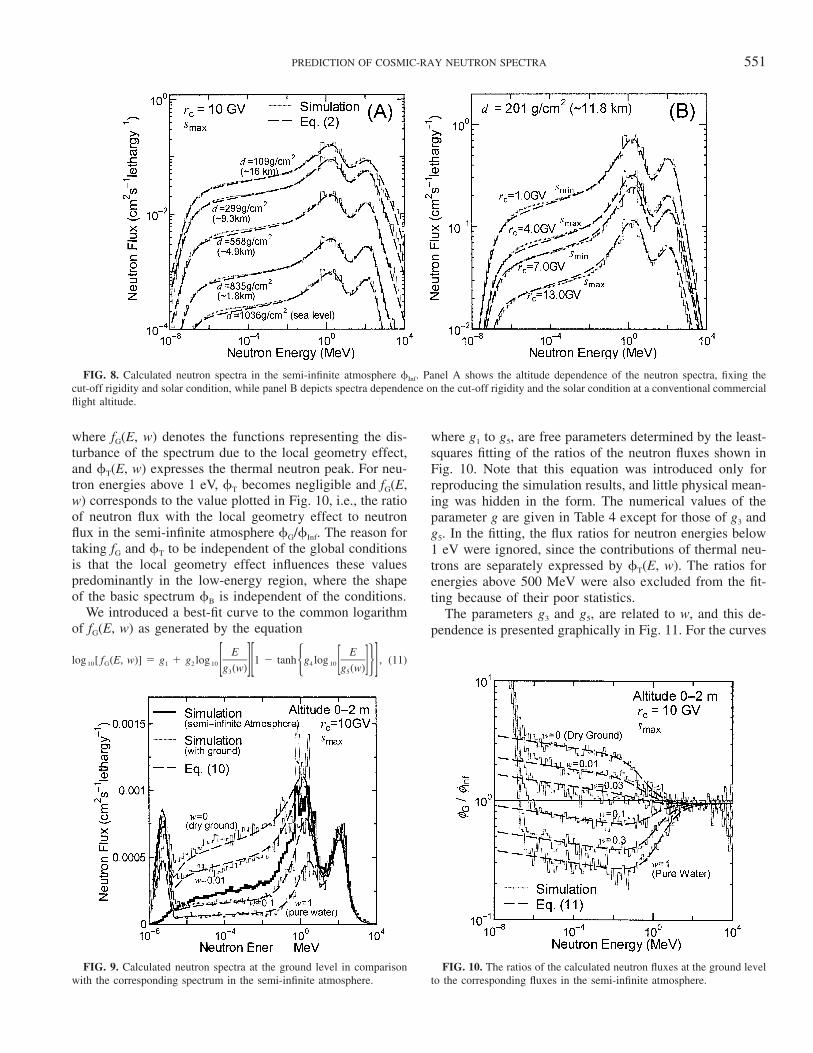
Figure 8 provides graphical presentations of the compar-isons between the neutron spectra in the semi-infinite at-mosphere obtained by the simulation and by the analyticalfunction. It is evident from the graphs that the results es-timated by the analytical function agree with those by thesimulation very well for a variety of global conditions.

550 SATO AND NIITA
FIG. 7. The dependences of the parameters a used in Eqs. (8) and (9)on the cut-off rigidity.
TABLE 3Numerical Values of the Parameters a and b used in Eq. (8) and (9) Obtained from the
Least-Squares Fittings
Unit of ai Function ai or bi1 bi2 bi3 (GV) bi4 (GV)
a5 (lethargy�1) Eq. (5) �0.00701 0.0258 10.9 2.38a6 (cm2 g�1 lethargy�1) constant 1.71 10�4
a7 constant 0.530a8 (cm2 g�1) constant 0.00136a9 (MeV) Eq. (5) 642 �189 2.32 0.897a10 (cm2 g�1) Eq. (5) 0.00112 1.81 10�4 8.84 0.587a11 Eq. (5) 1.26 �0.958 3.18 1.47a12 (cm2 g�1) constant 0.0133
Note. The units of bi1 and bi2 are the same as those of ai.
Equivalent agreements can be observed in the comparisonsin other cases, and this enables us to conclude that theanalytical function is capable of reproducing the simulationresults of the neutron spectra in the semi-infinite atmo-sphere for any global condition for altitudes under 20 km.
Local Geometry Effect
In practice, the cosmic-ray neutron spectra are differentfrom those in the semi-infinite atmosphere, since they are
influenced by the local structures such as the ground con-ditions, buildings and aircraft. The water density around thepoint of interest is one of the key quantities in the esti-mation of spectra at the ground level (4), while the config-uration of aircraft is of great importance at higher altitudes(10). We therefore analyzed the dependences of the neutronspectra on the water density and the aircraft structure asrepresentative of the local geometry effects.
Estimation of Neutron Spectra at Ground Level
To analyze the water-density dependence of the neutronspectra at the ground level, simulations were performed thatwere similar to those described in the Monte Carlo Simu-lation section, but with the weight fraction of water, w, inthe subterranean region changed from 0 (dry ground) to 1(pure water). In the simulation, the composition of the restof the ground is assumed to be 75% SiO2 and 25% Al2O3
by mass; e.g., the ground consists of 60% SiO2, 20% Al2O3
and 20% H2O by mass for w � 0.2, which corresponds tothe condition described in the Monte Carlo Simulation sec-tion. The neutron spectra for a particular global condition—altitudes below 2 m from the ground level, the solar max-imum, and 10 GV cut-off rigidity—were estimated for eachground condition.
Figures 9 and 10 show the absolute and relative valuesof the neutron spectra compared to the corresponding spec-trum in the semi-infinite atmosphere. The figures clearlyindicate the significant dependence of the neutron spectraon w especially for lower energies. The low-energy neutronfluxes become larger with the existence of dry ground,since it can be regarded as a reflector of the neutrons. Onthe other hand, the fluxes decrease with an increase of w,since water works as an absorber of the neutrons. Theground also causes the thermal neutron peak, which cannotbe observed in the neutron spectra in the semi-infinite at-mosphere.
For the purpose of reproducing the neutron spectra at theground level G by an analytical function, we propose thefollowing equation:
(s, r , d, E, w)G c
� � (s, r , d)[ (s, r , d, E) f (E, w) � (E, w)], (10)L c B c G T
551PREDICTION OF COSMIC-RAY NEUTRON SPECTRA
FIG. 8. Calculated neutron spectra in the semi-infinite atmosphere Inf. Panel A shows the altitude dependence of the neutron spectra, fixing thecut-off rigidity and solar condition, while panel B depicts spectra dependence on the cut-off rigidity and the solar condition at a conventional commercialflight altitude.
FIG. 9. Calculated neutron spectra at the ground level in comparisonwith the corresponding spectrum in the semi-infinite atmosphere.
FIG. 10. The ratios of the calculated neutron fluxes at the ground levelto the corresponding fluxes in the semi-infinite atmosphere.
where fG(E, w) denotes the functions representing the dis-turbance of the spectrum due to the local geometry effect,and T(E, w) expresses the thermal neutron peak. For neu-tron energies above 1 eV, T becomes negligible and fG(E,w) corresponds to the value plotted in Fig. 10, i.e., the ratioof neutron flux with the local geometry effect to neutronflux in the semi-infinite atmosphere G/Inf. The reason fortaking fG and T to be independent of the global conditionsis that the local geometry effect influences these valuespredominantly in the low-energy region, where the shapeof the basic spectrum B is independent of the conditions.
We introduced a best-fit curve to the common logarithmof fG(E, w) as generated by the equation
E Elog [ f (E, w)] � g � g log 1 � tanh g log , (11)10 G 1 2 10 4 10� �[ ][ ][ ]g (w) g (w)3 5
where g1 to g5, are free parameters determined by the least-squares fitting of the ratios of the neutron fluxes shown inFig. 10. Note that this equation was introduced only forreproducing the simulation results, and little physical mean-ing was hidden in the form. The numerical values of theparameter g are given in Table 4 except for those of g3 andg5. In the fitting, the flux ratios for neutron energies below1 eV were ignored, since the contributions of thermal neu-trons are separately expressed by T(E, w). The ratios forenergies above 500 MeV were also excluded from the fit-ting because of their poor statistics.
The parameters g3 and g5, are related to w, and this de-pendence is presented graphically in Fig. 11. For the curves

552 SATO AND NIITA
TABLE 4Numerical Values of the Parameters g used in Eqs.
(11) and (17) Obtained from the Least-SquaresFittings of the Neutron Flux Ratios shown in Figs.
10 and 12, Respectively
Unit of gi gi gi1a gi2
b
g1 �0.0235 �0.0379 �0.121g2 �0.0129 �0.0179 �0.0220g3 (MeV) Eq. (12) 6.03 10�8 5.42 10�10
g4 0.969 1.36 1.40g5 (MeV) Eq. (13) 5.52 6.45
a Location of a pilot.b Location of a cabin passenger.
FIG. 11. The dependences of the parameters g used in Eqs. (11) and(14) on the weight fraction of water in the ground.
TABLE 5Numerical Values of the Parameters h used in Eqs.
(12), (13) and (15) Obtained from the Least-Squares Fitting of the g(w) Data Shown in Fig. 11
Unit of gi hi1 hi2 hi3 hi4 hi5
g3 (MeV) �25.2 2.73 0.0715g5 (MeV) 0.348 3.35 �1.57g6 (lethargy�1) 0.118 0.144 3.87 0.653 42.8
Notes. The units of h51, h52, h53, h61 and h62 are the same as those ofthe corresponding g parameters. The value of g3 in unit of MeV can beestimated from Eq. (12) with the given h3l values.
best fitting g3 and g5 respectively, we introduced the func-tion
h32log [g (w)] � h (12)10 3 31w � h33
and the third-order polynomial
2g (w) � h � h w � h w ,5 51 52 53 (13)
respectively, where the parameters h are the fitting con-stants. Table 5 summarizes the numerical values of the pa-rameters h obtained from the least-squares fitting of theg(w) data shown in Fig. 11, together with those of the con-stant g parameters. The calculated results of the analyticalfunctions adopting these parameters are also depicted inFigs. 10 and 11. The figures clearly indicate the suitabilityof the analytical functions for reproducing the simulationresults.
The spectrum of the thermal neutron peak can be ex-pressed by
2E �E (E, w) � g (w) exp , (14)T 6 � � � �E ET T
where g6 denotes the magnitude of the peak and ET repre-sents the thermal energy. The values of g6 can be deter-mined by the equation
1eV
[ (s, r , d, E, w)/� (s, r , d) � (s, r , d, E) f (E, w)] dE/E� G c L c B c G
0g (w) �6 1eV
2(E/E ) exp(�E/E ) dE/E� T T
0
(15)
to reproduce the total flux of thermal neutrons using theanalytical functions. The calculated results setting ET �0.025 eV are also shown in Fig. 11. Note that the MonteCarlo simulation results were employed for the G data inthe calculation, while the values obtained from the analyt-ical functions were adopted for �L, B and fG. It is clearfrom this graph that g6 generally becomes larger with adecrease of w, probably due to the lower number of thermalneutrons absorbed by water, but the relationship is reversedat the lowest values of w because of a rapid increase of fG
as shown in Fig. 10. For a best-fit curve to g6, we introducethe function
h � h exp(�h w)6l 62 63g (w) � , (16)6 1 � h exp(�h w)64 65
where the parameters h6l are fitting constants determined bythe least-squares fitting of the g6 data. The numerical valuesof h6l are also given in Table 5, while the graphical fittingresult is depicted in Fig. 11.
The neutron spectra at the ground level G can be esti-mated from Eq. (10) by substituting the calculated valuesof the analytical functions for �L, B, fG and T. The resultsare presented graphically in Fig. 9. The graph indicates thatthe analytical functions can express the water-density de-pendence of the neutron spectra satisfactorily. It should be

553PREDICTION OF COSMIC-RAY NEUTRON SPECTRA
FIG. 12. The ratios of the calculated neutron fluxes inside Airbus-340at the positions of a pilot and a cabin passenger to those in the freeatmosphere. The numerical values denoted by the symbols were calcu-lated from the data shown in figure 4 (A) of ref. (10).
noted that not only the weight fraction of water in groundbut also the structures of surroundings such as concrete walland flooring are relevant to the neutron spectra. Further-more, ground generally consists of a variety of materialswith several layers, and hence the assumption of groundwith a uniform composition is over simplified for somecases. Therefore, the weight fraction of water used in thefunctions should be considered not as a purely physicalquantity but an adjustable index for representing the exis-tence of various materials, especially for hydrogen, aroundthe point of interest.
Estimation of Neutron Spectra in Aircraft
The influence of aircraft on the neutron spectra was wellanalyzed by Ferrari et al. (10). In their work, the particletransport simulations in the mathematical model of Airbus-340 were performed with the FLUKA code, and the neutronspectra at the several locations in the aircraft such as thecockpit and the cabin were estimated. Figure 12 shows theratios of their calculated neutron spectra inside the aircraftat the positions of a pilot and a cabin passenger to those inthe free atmosphere, these data were taken from Figure 4(A) in their paper (10).
A comparison of Figs. 10 and 12 indicates that the air-craft disturbs the neutron spectra in a manner similar to theground except for the thermal energies. For the function fAl
that represents the disturbance of the spectrum due to air-craft, we introduced an equation similar to that describingfG:
log [ f (E, m )]10 Al A
M E EA� g � g log 1 � tanh g log , (17)1l 2l 10 4l 10[ ] [ ]� �� � � �m g gA340 3l 5l
where l indicates the location of interest, i.e. of a pilot ora passenger, g1l to g5l are the fitting constants, and mA andmA340 denote the mass of the aircraft being considered andAirbus-340, respectively. Although the detailed dependenceof the spectrum on the aircraft size has not been well in-vestigated, we simply assumed that the common logarithmof fAl was proportional to mA since the influence of theaircraft structure on the spectrum generally could be ex-pected to become larger with the mass. The values of theparameters g were determined by the least-squares fittingof the data shown in Fig. 12 and by setting mA � mA340.The obtained values were also listed in Table 4, while thecalculated results using the parameters are depicted in Fig.12. It is evident from the graph that the analytical functionis capable of reproducing the simulation results well.
The neutron spectra in aircraft Al can be simply esti-mated by the equation
(s, r , d, E, m ) � � (s, r , d) (s, r , d, E) f (E, m ). (18)Al c A L c B c Al A
This equation has no term representing the thermal neutronpeak, which was considered separately in the estimation ofG as expressed by Eq. (10). This is justified by the factthat aircraft generally are not large enough to form a ther-mal neutron peak, as indicated from experimental data (19,20). It should be noted that not only the location and themass of aircraft but also detailed configuration character-istics, such as the number of passengers and the amount offuel, affect the neutron spectra, and further studies are de-sired to develop a more sophisticated model for describingthe influence of the aircraft structure on the spectra.
Comparison with Experimental Data
The neutron spectra calculated by Eqs. (10) and (18) forthe ground level and high altitudes, respectively, are shownin Fig. 1 for the corresponding global conditions to theexperimental data. The weight fraction of water was set at0.2 for the calculation at the ground level. At high altitudes,the calculations were performed for the pilot location, andthe masses of the aircrafts were assumed to be a quarter ofmA340, apparently since the airplanes used in their measure-ments—ER-2 and DC-8—were smaller than Airbus-340.
It is evident from the figures that the neutron spectra ofthe experiments and the calculations are in excellent agree-ment. Furthermore, the analytical functions are substantial-ly superior to the Monte Carlo simulation in reproducingexperimental data at lower energies, since they can considerthe local geometry effect on the spectra even at high alti-tudes.
The accuracy of the analytical functions was also verifiedby comparing their calculation results with the experimentaldata by Kowatari et al. (22), as shown in Fig. 13. Theseresearchers measured the neutron spectra at the ground lev-el at different altitudes while climbing up Mt. Fuji in Japan.The weight fraction of water w was also set at 0.2 for theanalytical calculation. It can be seen clearly from the graph

554 SATO AND NIITA
FIG. 13. Neutron spectra calculated with Eq. (10) compared to themeasured data in the Mt. Fuji area at the altitudes of 20, 1020 and 2400m, where the corresponding atmospheric depths are approximately 1030,915 and 770 g/cm2, respectively.
that the analytical function can reproduce the experimentaldata very well. Note that the corresponding Monte Carlodata have not been generated, since it is very time-consum-ing to perform the simulations with different altitudes ofthe ground level.
From these considerations, we concluded that our ana-lytical functions can predict cosmic-ray neutron spectrawith enough accuracy for any global condition except foraltitudes over 20 km, taking the local geometry effects intoaccount.
CONCLUSION
Monte Carlo simulations were performed for estimatingthe cosmic-ray neutron spectra in the atmosphere by usingthe PHITS code adopting JENDL/HE. Excellent agreementwas observed between the calculated and measured spectraeven at the ground level. Based on the comprehensive anal-ysis of the simulation results, we proposed analytical func-tions that can predict the cosmic-ray neutron spectra forany time and location at the altitudes under 20 km, consid-ering the local geometry effects. The accuracy of the ana-lytical functions was clearly verified by comparing theirresults with various experimental data.
In the future, the systematic analysis of doses estimatedby our analytical functions is needed for their validation inpractical use. Further studies are desired to improve themodel for describing the local geometry effect on the neu-tron spectra, since that proposed in this paper incorporatesseveral simplifications. More experimental data for neutronspectra at locations with detailed information on the sur-rounding structures are required for the purpose, especiallyfor those inside aircraft. Estimation of the photon andcharged-particle spectra at high altitudes, also of great im-
portance in aircrew dosimetry, can also be done by apply-ing the Monte Carlo simulation technique established bythis work. The simulation technique is also capable of con-tributing to the estimation of the particle spectra in the at-mosphere at solar-geomagnetic storm conditions, an arearequiring additional study. Application of this work to theestimation of neutron spectra on the Martian surface willbe of great interest in future NASA human space explora-tions.
ACKNOWLEDGMENTS
We would like to thank Dr. Y. Watanabe and Dr. T. Fukahori for theirsupport in incorporating JENDL/HE into PHITS and Dr. A. Endo, Dr. M.Kowatari, Dr. T. Nunomiya, Dr. H. Yasuda and Dr. T. Nakamura for theiradvice on this work. We also wish to thank the technical staff of theCCSE office of JAEA for their help in performing the Monte Carlo sim-ulation.
Received: February 28, 2006; accepted: May 11, 2006
REFERENCES
1. J. F. Ziegler, Terrestrial cosmic ray intensities. IBM J. Res. Dev. 42,117–139 (1998).
2. K. O’Brien, W. Friedberg, H. H. Sauer and D. F. Smart, Atmosphericcosmic rays and solar energetic particles at aircraft altitudes. Environ.Int. 22 (Suppl. 1), S9–S44 (1996).
3. W. Friedberg, K. Copeland, F. E. Duke, K. O’Brien and E. B. Darden,Guidelines and technical information provided by the U.S. FederalAviation Administration to promote radiation safety for air carriercrew members. Radiat. Prot. Dosim. 86, 323–327 (1999).
4. S. Roesler, W. Heinrich and H. Schraube, Calculation of radiationfields in the atmosphere and comparison to experimental data. Radiat.Res. 149, 87–97 (1998).
5. A. Ferrari, M. Pelliccioni and T. Rancati, Calculation of the radiationenvironment caused by galactic cosmic rays for determining air crewexposure. Radiat. Prot. Dosim. 93, 101–114 (2001).
6. J. M. Clem, G. De Angelis, P. Goldhagen and J. W. Wilson, Newcalculations of the atmospheric cosmic radiation field–results for neu-tron spectra. Radiat. Prot. Dosim. 110, 423–428 (2004).
7. A. Fasso, A. Ferrari and P. R. Sala, Electron-photon transport in FLU-KA: status. In Proceedings of the Monte Carlo 2000 Conference,Lisbon, Oct. 23–26 (A. Kling, F. Barao, M. Nakagawa, L. Tavoraand P. Vaz, Eds.), pp. 159–164. Springer-Verlag, Berlin, 2001.
8. A. Fasso, A. Ferrari, J. Ranft and P. R. Sala, FLUKA: status andprospective for hadronic applications. In Proceedings of the MonteCarlo 2000 Conference, Lisbon, Oct. 23–26 (A. Kling, F. Barao, M.Nakagawa, L. Tavora and P. Vaz, Eds.), pp. 955–960. Springer-Ver-lag, Berlin, 2001.
9. H. Schraube, V. Mares, S. Roesler and W. Heinrich, Experimentalverification and calculation of aviation route doses. Radiat. Prot. Do-sim. 86, 309–315 (1999).
10. A. Ferrari, M. Pelliccioni and R. Villari, Evaluation of the influenceof aircraft shielding on the aircrew exposure through an aircraft math-ematical model. Radiat. Prot. Dosim. 108, 91–105 (2004).
11. H. Iwase, K. Niita and T. Nakamura, Development of a general-purpose particle and heavy ion transport Monte Carlo code. J. Nucl.Sci. Technol. 39, 1142–1151 (2002).
12. T. Fukahori, Y. Watanabe, N. Yoshizawa, F. Maekawa, S. Meigo, C.Konno, N. Yamano, A. Yu. Konobeyev and S. Chiba, JENDL HighEnergy File. J. Nucl. Sci. Technol. Suppl. 2, 25–30 (2002).
13. Y. Watanabe, T. Fukahori, K. Kosako, N. Shigyo, T. Murata, N. Ya-mano, T. Hino, K. Maki, H. Nakashima and S. Chiba, Nuclear dataevaluations for JENDL high-energy file. In Proceedings of Interna-

555PREDICTION OF COSMIC-RAY NEUTRON SPECTRA
tional Conference on Nuclear Data for Science and Technology, pp.326–331. American Institute of Physics, New York, 2005.
14. A. J. Tylka, J. H. Adams, Jr., P. R. Boberg, B. Brownstein, W. F.Dietrich, E. O. Flueckiger, E. L. Petersen, M. A. Shea, D. F. Smartand E. C. Smith, CREME96: A revision of the cosmic ray effects onmicro-electronics code. IEEE Trans. Nucl. Sci. 44, 2150–2160(1997).
15. K. Niita, S. Meigo, H. Takada and Y. Ikeda, High Energy ParticleTransport Code NMTC/JAM. JAERI-Data/Code 2001-007, JapanAtomic Energy Research Institute, Ibaraki, 2001.
16. J. F. Briesmeister, MCNP—A General Monte Carlo n-Particle Trans-port Code. LA-12625-M, Los Alamos National Laboratory, Los Al-amos, NM, 1997.
17. K. Niita, S. Chiba, T. Maruyama, H. Takada, T. Fukahori, Y. Naka-hara and A. Iwamoto, Analysis of the (N,xN�) reactions by quantummolecular dynamics plus statistical decay model. Phys. Rev. C52,2620–2635 (1995).
18. H. W. Bertini, Low-energy intranuclear cascade calculation. Phys.Rev. 131, 1801–1821 (1963).
19. P. Goldhagen, J. M. Clem and J. W. Wilson, The energy spectrum ofcosmic-ray induced neutrons measured on an airplane over a widerage of altitude and latitude. Radiat. Prot. Dosim. 110, 387–392(2004).
20. T. Nakamura, T. Nunomiya, S. Abe, K. Terunuma and H. Suzuki,Sequential measurements of cosmic-ray neutron spectrum and doserate at sea level in Sendai, Japan. J. Nucl. Sci. Technol. 42, 843–853(2005).
21. B. J. Lewis, L. G. I. Bennett, A. R. Green, M. J. McCall, B. Ellas-chuk, A. Butler and M. Pierre, Galactic and solar radiation exposureto aircrew during a solar cycle. Radiat. Prot. Dosim. 102, 207–227(2002).
22. M. Kowatari, K. Nagaoka, S. Satoh, Y. Ohta, J. Abukawa, S. Tach-imori and T. Nakamura, Evaluation of the altitude variation of thecosmic-ray induced environmental neutrons in the Mt. Fuji area. J.Nucl. Sci. Technol. 42, 495–502 (2005).