analytical foundations assessment –agriculture (rural productivity), final sector assessment
DESCRIPTION
The Analytical Foundations Assessment Report provides USAID/Georgia with the necessary background, analysis, recommendations and perspective to help develop support to the agricultural sector over the medium‐to‐long term, with a particular eye to the formulation of the Mission’s Country Development Cooperation Strategy (CDCS).TRANSCRIPT
Analytical Foundations Assessment – Agriculture (Rural Productivity) Sector Assessment
ANALYTICAL FOUNDATIONS ASSESSMENT – AGRICULTURE (RURAL PRODUCTIVITY)
FINAL SECTOR REPORT
Prepared for United States Agency for International Development (USAID/Georgia)
Prepared By: Patrick Sommerville, Team Leader
Robert E Lee, PhD Rati Shavgulidze Ilia Kvitaishvili
November 23, 2011
The Mitchell Group, Inc. 1816 11th Street N. W. Washington, DC 20001
Telephone: +1 202 745‐1919 Fax: +1 202 234‐1697
Internet: www.the‐mitchellgroup.com Email: chrisb@the‐mitchellgroup.com
Counterpart International 2345 Crystal Drive, Suite 301
Arlington, VA 22202 Telephone: +1 703 236‐1200
Fax: +1 703 412‐5035 Internet: www.counterpart.org
Email: [email protected]
Acknowledgments The Assessment Team would like to recognize the immense contributions of a number of individuals and organizations that made this report possible. First and foremost, we would like to thank the many scores of informants to this report, including farmers, agribusiness owners and government officials, who so generously provided input into our report, proved and disproved our data, and enabled the team to complete this report with a high degree of specificity and confidence. Thanks go to the Counterpart Georgia team, led by Irakli Saralidze, providing us with office facilities, transportation, logistical and administrative support. Special appreciations in this regard go to the extra efforts of Mark Granius, Sopo Motsonelidze, Alex Gogiashvili, Becka Jandeiri and Iveelt Tsog. Thank you to Chris Brown, GBTI II Project Director, for his outstanding leadership, coordination and invaluable technical input into our assessment and reporting. Appreciations go to the Counterpart and TMG Washington‐based home offices teams, in particular the efforts of Amy Southworth in providing editing support and pulling together the final report. The team benefited greatly from the input and synergies with the Financial Sector assessment team, whom we cooperated with through all steps of the process, and learned a great deal from. Finally, many thanks to our colleagues at USAID Georgia, in particular to Grant Morrill and the Economic Growth office staff. The amount of time and input that you made available to us was invaluable to pulling together an assessment and report that will be of service to USAID and other development practitioners and policy‐makers long into the future.

Acronyms and Abbreviations
ADA Agricultural Development Activity AMFO Association of Microfinance Organizations (Georgia) APLR Association for Protection of Landowners' Rights ARET Agriculture, Research, Education, and Training ASF African Swine Fever BCR Business Climate Reform BOG Bank of Georgia CDCS Country Development Cooperation Strategy CHF CHF International CIB Comprehensive Institutional Building CIS Commonwealth of Independent States CNFA Citizen’s Network for Foreign Affairs CRRC Caucasus Research Resource Center DCA Development Credit Authority DCFTA Deep Comprehensive Free Trade Area EBRD European Bank for Reconstruction ECA Europe and Central Asia EPI Economic Prosperity Initiative EU European Union EXW Grains purchased from factory, from silo, from elevator FINCA Foundation for International Community Assistance FMD Foreign Market Development FSC Field Service Center FSU Former Soviet Union FSVPP Food Safety, Veterinary, and Plant Protection FVGWR German Business Association in Georgia GAC Georgian Agricultural Corporation GCMI Georgia Community Mobilization Initiative GDA Georgian Drug Agency GDP Gross domestic product GEGI Georgia Enterprise Growth Initiative GEII Georgia Employment and Infrastructure Initiative GEL Georgian Lari GIPA Georgian Institute of Public Affairs GIS Geographic information system GMSE Georgia Microfinance Stabilization and Enhancement GOG Government of Georgia GRDF Georgia Rural Development Fund GTZ Deutsche Gesellschaft für Internationale Zusammenarbeit FAO Food and Agriculture Organization HACCP Hazard analysis and critical control points IDCDP Irrigation and Drainage Community Development IFAD International Fund for Agricultural Development IPPC International Plant Protection Convention KFW KfW Bankengruppe MCC Millennium Challenge Corporation
MFI Microfinance Institution MOA Ministry of Agriculture MPC Multi‐Purpose Center MSC Machinery Service Centers NEO New Economic Opportunities NFA National Food Agency NH Ammonia NPK nitrogen (N), phosphorus (P), potassium (K) OIE World Organisation for Animal Health PHH Post‐harvest handling RASFF Rapid Alert System for Food and Feed SA Social Assistance SME Small and Medium Enterprise SPS Sanitary and Phytosanitary TA Technical Assistance TBC TBC Bank UNDP United Nations Development Programme UNHCR United Nations High Commissioner for Refugees USA United States of America USAID United States Agency for International Development USDA United States Department of Agriculture USG United States Government VA Value Added VAT Value Added Tax VET Vocational Education and Training WB World Bank WDR World Development Report
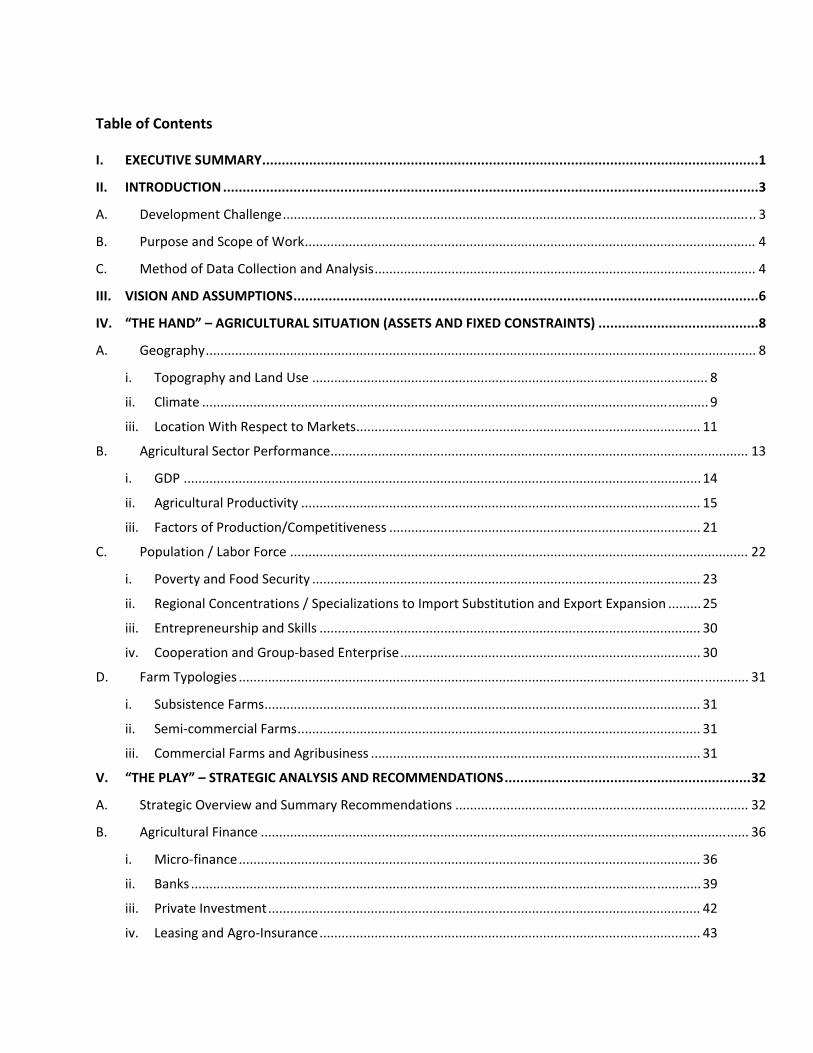
Table of Contents I. EXECUTIVE SUMMARY ............................................................................................................................... 1
II. INTRODUCTION ......................................................................................................................................... 3
A. Development Challenge ................................................................................................................................. 3
B. Purpose and Scope of Work ........................................................................................................................... 4
C. Method of Data Collection and Analysis ........................................................................................................ 4
III. VISION AND ASSUMPTIONS ....................................................................................................................... 6
IV. “THE HAND” – AGRICULTURAL SITUATION (ASSETS AND FIXED CONSTRAINTS) ......................................... 8
A. Geography ...................................................................................................................................................... 8
i. Topography and Land Use ............................................................................................................ 8
ii. Climate .......................................................................................................................................... 9
iii. Location With Respect to Markets .............................................................................................. 11
B. Agricultural Sector Performance .................................................................................................................. 13
i. GDP ............................................................................................................................................. 14
ii. Agricultural Productivity ............................................................................................................. 15
iii. Factors of Production/Competitiveness ..................................................................................... 21
C. Population / Labor Force ............................................................................................................................. 22
i. Poverty and Food Security .......................................................................................................... 23
ii. Regional Concentrations / Specializations to Import Substitution and Export Expansion ......... 25
iii. Entrepreneurship and Skills ........................................................................................................ 30
iv. Cooperation and Group‐based Enterprise .................................................................................. 30
D. Farm Typologies ........................................................................................................................................... 31
i. Subsistence Farms ....................................................................................................................... 31
ii. Semi‐commercial Farms .............................................................................................................. 31
iii. Commercial Farms and Agribusiness .......................................................................................... 31
V. “THE PLAY” – STRATEGIC ANALYSIS AND RECOMMENDATIONS ............................................................... 32
A. Strategic Overview and Summary Recommendations ................................................................................ 32
B. Agricultural Finance ..................................................................................................................................... 36
i. Micro‐finance .............................................................................................................................. 36
ii. Banks ........................................................................................................................................... 39
iii. Private Investment ...................................................................................................................... 42
iv. Leasing and Agro‐Insurance ........................................................................................................ 43
C. Knowledge and Training .............................................................................................................................. 43
i. Technical Research and Education / Training ............................................................................. 43
ii. Extension and Skills Development .............................................................................................. 50
iii. Institutional Strengthening and Policy ........................................................................................ 53
iv. Youth and Cooperative Development ........................................................................................ 54
D. Land .............................................................................................................................................................. 55
E. Agricultural Services ..................................................................................................................................... 58
i. Irrigation ...................................................................................................................................... 59
ii. Inputs .......................................................................................................................................... 63
iii. Veterinary Services ..................................................................................................................... 75
F. Markets and Trade ....................................................................................................................................... 78
i. Post‐harvest Handling ................................................................................................................. 80
i. Transportation ............................................................................................................................ 90
ii. Market Information .................................................................................................................... 91
iii. Product Promotion / Market Development ................................................................................ 93
G. Food Safety .................................................................................................................................................. 95
ANNEXES ...................................................................................................................................................... 103
Annex 1: Matrix of Challenges, Opportunities and Prioritized interventions .................................................. 103
Annex 2: Background Literature Review, Availability and Ranking of Relevance ............................................ 109
Annex 3: Discussion of Commodities Offering Potential for Import substitution or Exports ........................... 128
Figures Figure V‐1: Type of Land Use in Georgia ........................................................................................................ 9
Figure V‐2: Top Agricultural Import/Export Markets .................................................................................. 12
Figure V‐3: Agricultural Growth Substantially Below Potential .................................................................. 14
Figure V‐4: Proportion of Arable Land Treated with Fertilizers and Pesticides, percent ........................... 15
Figure V‐5 : Vegetable Productivity Comparison Charts ............................................................................. 16
Figure V‐6: Fruit, Nuts, Citrus, and Berry Productivity Comparison Charts ................................................ 18
Figure V‐7: Grains & Oilseed Productivity Comparison Charts ................................................................... 20
Figure V‐8: Comparison of Diesel Fuel Prices between Selected Countries ............................................... 22
Figure V‐9: Agriculture Value Added Per Worker (Constant 2000 $US) ..................................................... 23
Figure V‐10: Poverty Incidence, by Type of Employment and Urban/Rural Location (2007) ..................... 24
Figure V‐11: Map: Regional Specialization and Potential ......................................................................... 28
Figure VI‐1: Breakdown of National Loan Portfolio (by Size) ...................................................................... 40
Figure VI‐2: Breakdown of National Loan Portfolio (by Maturity) .............................................................. 41
Figure VI‐4: Education System of Georgia .................................................................................................. 44
Figure VI‐6: Proportion of Arable Land Treated with Fertilizers and Pesticides ......................................... 66
Figure VI‐8: FSC Locations in Georgia......................................................................................................... 69
Figure VI‐10: Location of MSC’s in Georgia ................................................................................................. 73
Figure VI‐11: Dry Storage Facilities Regional Presence ............................................................................... 83
Figure VI‐12: Grain Storage Regional Capacity ........................................................................................... 83
Figure VI‐13: Grain Storage Regional Concentration .................................................................................. 84
Figure VI‐16: Cold Storage Facility Regional Presence ................................................................................ 87
Figure VI‐17: Cold Storage Facility Regional Capacity ................................................................................ 87
Figure VI‐18: Cold Storage Facility Regional Presence ............................................................................... 88
Tables Table V‐1: Agriculture Trade in Relation to Total Trade .............................................................................. 13
Table V‐2: Agriculture, Hunting, Fishing, and Forestry: Economic Importance, 1990‐2010 ...................... 15
Table V‐3: Selected key Input Costs between Countries ............................................................................ 21
Table V‐4: Share and Rank and Agriculture Value Added in Total Regional Value Added ......................... 25
Table V‐5: Social Assistance Beneficiary Rural Population Statistics, 2009‐2010 ....................................... 25
Table V‐6: Current Situation and Potential in Crop Production .................................................................. 26
Table V‐7: Regional Contribution to Total Output ..................................................................................... 27
Table V‐8: Market Supply with Locally Produced Commodities and Imported Equivalent ........................ 29
Table VI‐1: Financial Institution Agro Lending rate ..................................................................................... 37
Table VI‐2: Loan Portfolio of MFIs June 2010 ............................................................................................. 38
Table VI‐4: Total Agricultural lending by Institution ................................................................................... 40
Table VI‐6: Impact of extension on farm productivity ............................................................................... 52
Table VI‐8: Agricultural Land in Georgia .................................................................................................... 57
Table VI‐9: Proportion of Villages Vulnerable to Drought ......................................................................... 60
Table VI‐11: Overview of use of Fertilizers & Pesticides in Georgia .......................................................... 66
Table VI‐13: Location of Farm Service Centers in Georgia ......................................................................... 68
Table VI‐14: Availability of seeds, fertilizers and chemicals ...................................................................... 70
Table VI‐16: Accessibility of fertilizers, chemicals, and seed materials ...................................................... 71
Table VI‐17: MSC Regional/District Presence in Georgia ........................................................................... 72
Table VI‐18: Accessibility of Machinery Services to farmers in Georgia .................................................... 74
Table VI‐20: Availability of Machinery Services to farmers in Georgia ....................................................... 74
Table VI‐21: Availability and Accessibility to Local Veterinary Service Centers .......................................... 77
Table VI‐23: Dry Storage Facilities .............................................................................................................. 82
Table VI‐26 Cold Storage Facilities .............................................................................................................. 86
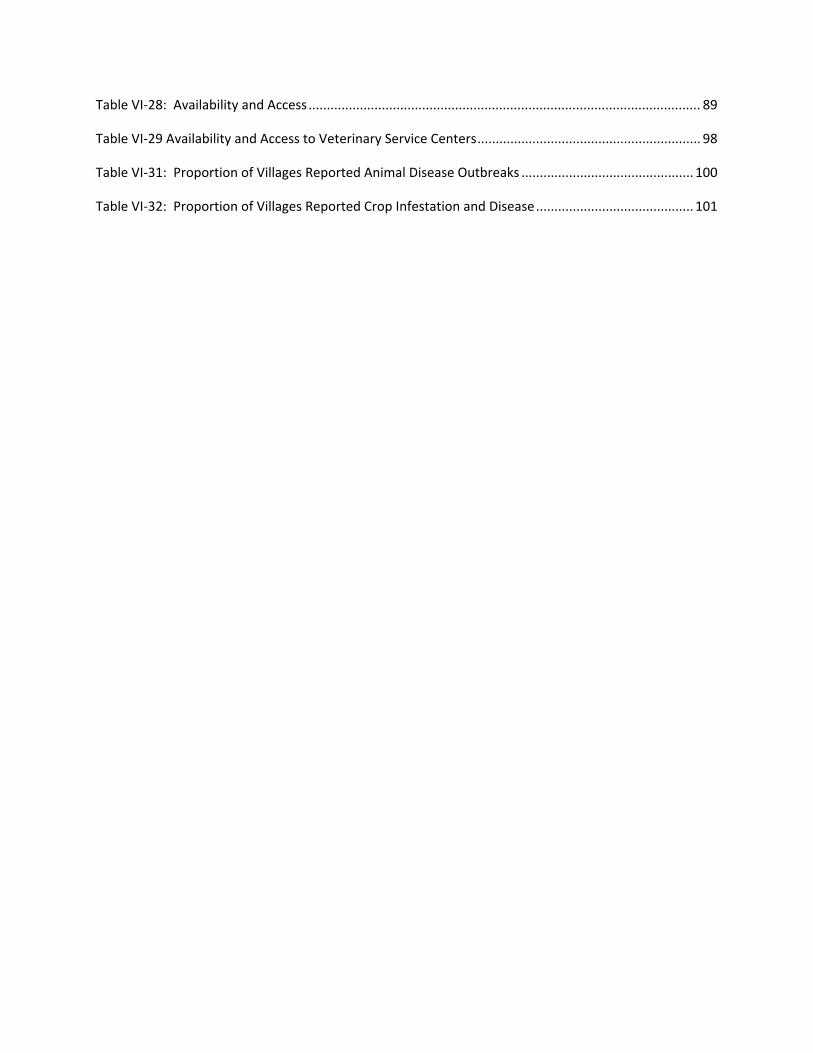
Table VI‐28: Availability and Access ........................................................................................................... 89
Table VI‐29 Availability and Access to Veterinary Service Centers ............................................................. 98
Table VI‐31: Proportion of Villages Reported Animal Disease Outbreaks ............................................... 100
Table VI‐32: Proportion of Villages Reported Crop Infestation and Disease ........................................... 101
1 | P a g e
I. EXECUTIVE SUMMARY
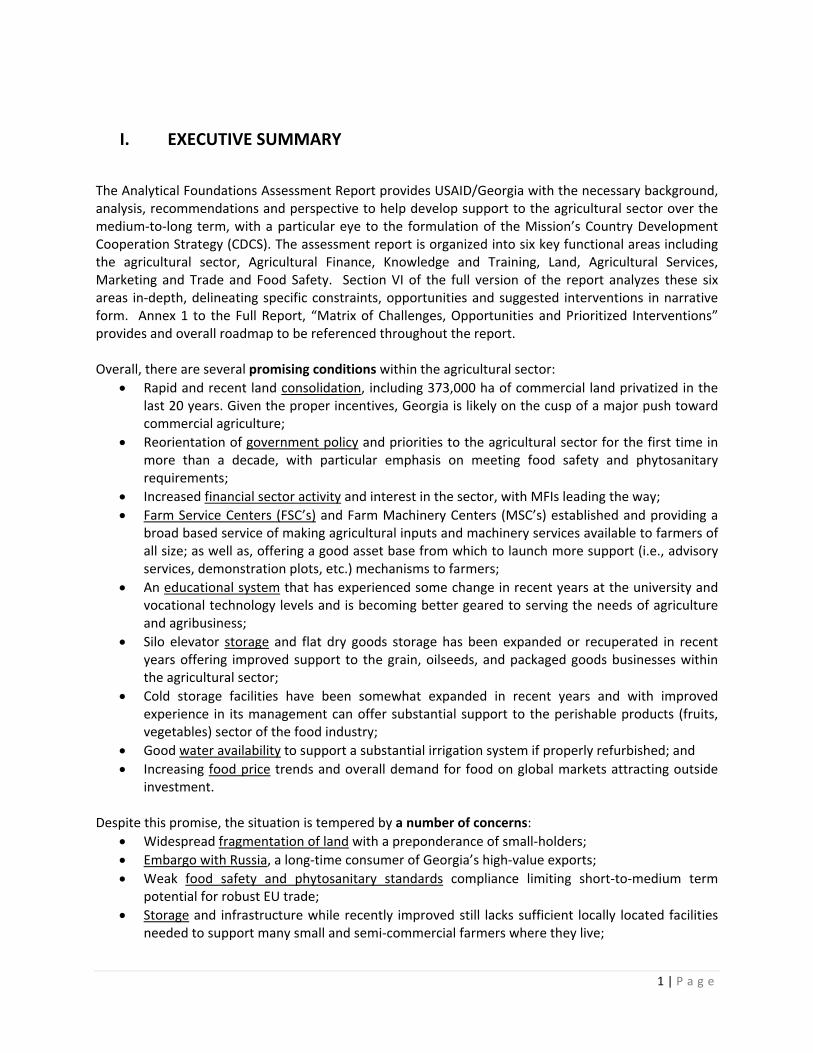
The Analytical Foundations Assessment Report provides USAID/Georgia with the necessary background, analysis, recommendations and perspective to help develop support to the agricultural sector over the medium‐to‐long term, with a particular eye to the formulation of the Mission’s Country Development Cooperation Strategy (CDCS). The assessment report is organized into six key functional areas including the agricultural sector, Agricultural Finance, Knowledge and Training, Land, Agricultural Services, Marketing and Trade and Food Safety. Section VI of the full version of the report analyzes these six areas in‐depth, delineating specific constraints, opportunities and suggested interventions in narrative form. Annex 1 to the Full Report, “Matrix of Challenges, Opportunities and Prioritized Interventions” provides and overall roadmap to be referenced throughout the report. Overall, there are several promising conditions within the agricultural sector:
Rapid and recent land consolidation, including 373,000 ha of commercial land privatized in the last 20 years. Given the proper incentives, Georgia is likely on the cusp of a major push toward commercial agriculture;
Reorientation of government policy and priorities to the agricultural sector for the first time in more than a decade, with particular emphasis on meeting food safety and phytosanitary requirements;
Increased financial sector activity and interest in the sector, with MFIs leading the way;
Farm Service Centers (FSC’s) and Farm Machinery Centers (MSC’s) established and providing a broad based service of making agricultural inputs and machinery services available to farmers of all size; as well as, offering a good asset base from which to launch more support (i.e., advisory services, demonstration plots, etc.) mechanisms to farmers;
An educational system that has experienced some change in recent years at the university and vocational technology levels and is becoming better geared to serving the needs of agriculture and agribusiness;
Silo elevator storage and flat dry goods storage has been expanded or recuperated in recent years offering improved support to the grain, oilseeds, and packaged goods businesses within the agricultural sector;
Cold storage facilities have been somewhat expanded in recent years and with improved experience in its management can offer substantial support to the perishable products (fruits, vegetables) sector of the food industry;
Good water availability to support a substantial irrigation system if properly refurbished; and
Increasing food price trends and overall demand for food on global markets attracting outside investment.
Despite this promise, the situation is tempered by a number of concerns:
Widespread fragmentation of land with a preponderance of small‐holders;
Embargo with Russia, a long‐time consumer of Georgia’s high‐value exports;
Weak food safety and phytosanitary standards compliance limiting short‐to‐medium term potential for robust EU trade;
Storage and infrastructure while recently improved still lacks sufficient locally located facilities needed to support many small and semi‐commercial farmers where they live;
2 | P a g e
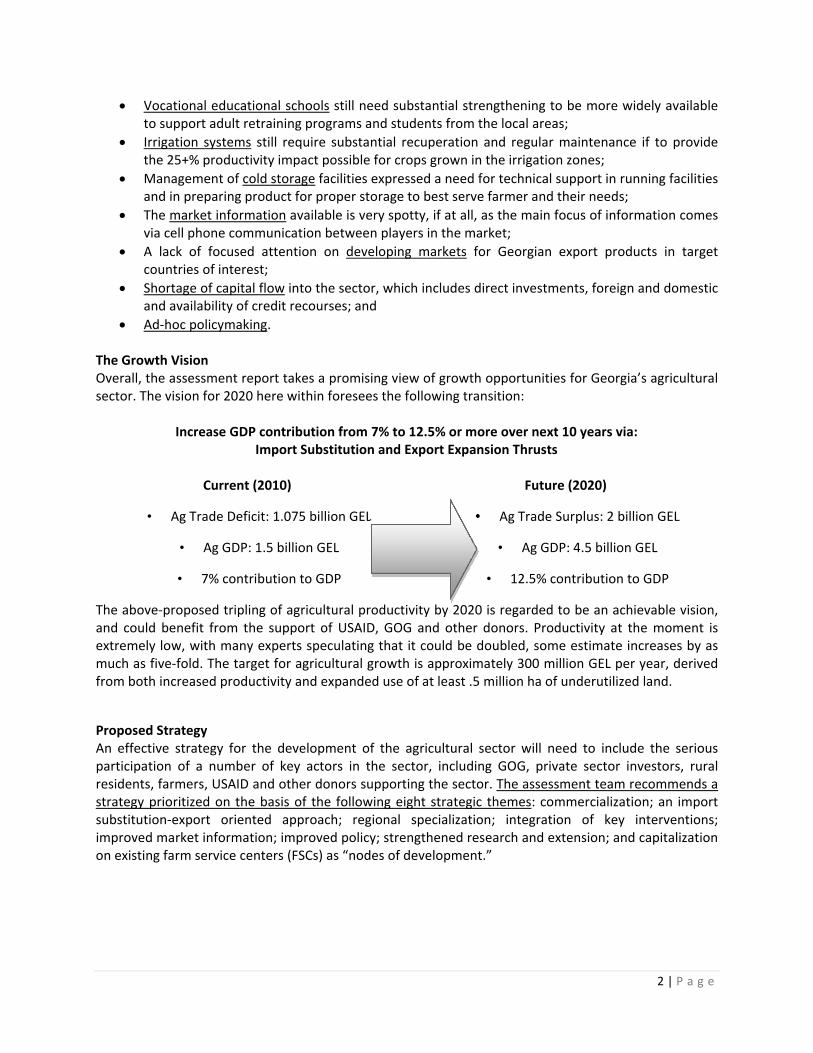
Vocational educational schools still need substantial strengthening to be more widely available to support adult retraining programs and students from the local areas;
Irrigation systems still require substantial recuperation and regular maintenance if to provide the 25+% productivity impact possible for crops grown in the irrigation zones;
Management of cold storage facilities expressed a need for technical support in running facilities and in preparing product for proper storage to best serve farmer and their needs;
The market information available is very spotty, if at all, as the main focus of information comes via cell phone communication between players in the market;
A lack of focused attention on developing markets for Georgian export products in target countries of interest;
Shortage of capital flow into the sector, which includes direct investments, foreign and domestic and availability of credit recourses; and
Ad‐hoc policymaking. The Growth Vision Overall, the assessment report takes a promising view of growth opportunities for Georgia’s agricultural sector. The vision for 2020 here within foresees the following transition:
Increase GDP contribution from 7% to 12.5% or more over next 10 years via:
Import Substitution and Export Expansion Thrusts
Current (2010)
• Ag Trade Deficit: 1.075 billion GEL
• Ag GDP: 1.5 billion GEL
• 7% contribution to GDP
Future (2020)
• Ag Trade Surplus: 2 billion GEL
• Ag GDP: 4.5 billion GEL
• 12.5% contribution to GDP
The above‐proposed tripling of agricultural productivity by 2020 is regarded to be an achievable vision, and could benefit from the support of USAID, GOG and other donors. Productivity at the moment is extremely low, with many experts speculating that it could be doubled, some estimate increases by as much as five‐fold. The target for agricultural growth is approximately 300 million GEL per year, derived from both increased productivity and expanded use of at least .5 million ha of underutilized land.
Proposed Strategy An effective strategy for the development of the agricultural sector will need to include the serious participation of a number of key actors in the sector, including GOG, private sector investors, rural residents, farmers, USAID and other donors supporting the sector. The assessment team recommends a strategy prioritized on the basis of the following eight strategic themes: commercialization; an import substitution‐export oriented approach; regional specialization; integration of key interventions; improved market information; improved policy; strengthened research and extension; and capitalization on existing farm service centers (FSCs) as “nodes of development.”
3 | P a g e
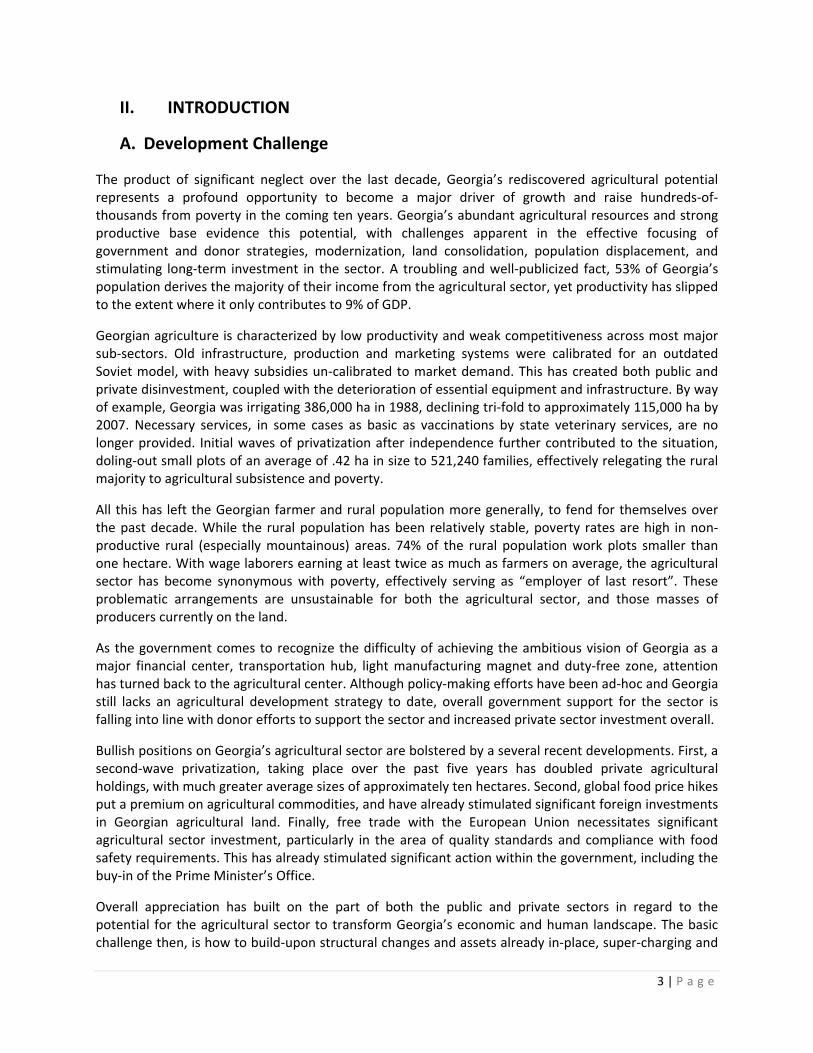
II. INTRODUCTION
A. Development Challenge
The product of significant neglect over the last decade, Georgia’s rediscovered agricultural potential represents a profound opportunity to become a major driver of growth and raise hundreds‐of‐thousands from poverty in the coming ten years. Georgia’s abundant agricultural resources and strong productive base evidence this potential, with challenges apparent in the effective focusing of government and donor strategies, modernization, land consolidation, population displacement, and stimulating long‐term investment in the sector. A troubling and well‐publicized fact, 53% of Georgia’s population derives the majority of their income from the agricultural sector, yet productivity has slipped to the extent where it only contributes to 9% of GDP.
Georgian agriculture is characterized by low productivity and weak competitiveness across most major sub‐sectors. Old infrastructure, production and marketing systems were calibrated for an outdated Soviet model, with heavy subsidies un‐calibrated to market demand. This has created both public and private disinvestment, coupled with the deterioration of essential equipment and infrastructure. By way of example, Georgia was irrigating 386,000 ha in 1988, declining tri‐fold to approximately 115,000 ha by 2007. Necessary services, in some cases as basic as vaccinations by state veterinary services, are no longer provided. Initial waves of privatization after independence further contributed to the situation, doling‐out small plots of an average of .42 ha in size to 521,240 families, effectively relegating the rural majority to agricultural subsistence and poverty.
All this has left the Georgian farmer and rural population more generally, to fend for themselves over the past decade. While the rural population has been relatively stable, poverty rates are high in non‐productive rural (especially mountainous) areas. 74% of the rural population work plots smaller than one hectare. With wage laborers earning at least twice as much as farmers on average, the agricultural sector has become synonymous with poverty, effectively serving as “employer of last resort”. These problematic arrangements are unsustainable for both the agricultural sector, and those masses of producers currently on the land.
As the government comes to recognize the difficulty of achieving the ambitious vision of Georgia as a major financial center, transportation hub, light manufacturing magnet and duty‐free zone, attention has turned back to the agricultural center. Although policy‐making efforts have been ad‐hoc and Georgia still lacks an agricultural development strategy to date, overall government support for the sector is falling into line with donor efforts to support the sector and increased private sector investment overall.
Bullish positions on Georgia’s agricultural sector are bolstered by a several recent developments. First, a second‐wave privatization, taking place over the past five years has doubled private agricultural holdings, with much greater average sizes of approximately ten hectares. Second, global food price hikes put a premium on agricultural commodities, and have already stimulated significant foreign investments in Georgian agricultural land. Finally, free trade with the European Union necessitates significant agricultural sector investment, particularly in the area of quality standards and compliance with food safety requirements. This has already stimulated significant action within the government, including the buy‐in of the Prime Minister’s Office.
Overall appreciation has built on the part of both the public and private sectors in regard to the potential for the agricultural sector to transform Georgia’s economic and human landscape. The basic challenge then, is how to build‐upon structural changes and assets already in‐place, super‐charging and
4 | P a g e
focusing public, private sector and donor investment on poverty reduction via rapid transformation of the agricultural economy.
B. Purpose and Scope of Work
This Analytical Foundations Assessment Report provides USAID/Georgia with the necessary background, analysis, recommendations and perspective to help develop support to the sector over the medium‐to‐long term, with a particular eye to the formulation of the Mission’s Country Development Cooperation Strategy (CDCS). This Agriculture (Rural Productivity) assessment was undertaken and coordinated with a Financial Sector Assessment, both contributing to USAID’s overall economic growth strategy for Georgia. The Agriculture assessment specifically assesses the composition and characteristics of the population engaged in agriculture, and its potential for development. With a specific focus on rural productivity, the analysis endeavors to:
Identify the major opportunities and constraints to increased agricultural productivity and assess the relative importance of each;
Assess the composition and characteristics of the population engaged in agriculture and its potential for economic development; and
Outline the dynamics of the rural community and how they interact with government agricultural policies, institutions, markets and other influencing factors.
The time horizon for the assessment covers the recent past and future strategic planning period from 2012 to 2017. Overall, a vision for the next ten years of Georgia’s agricultural development is taken into consideration. Importantly, the vision is a strategic, not tactical, one. In this regard, the focus of the analysis asks, “Are we doing the right things?” rather than “Are we doing the right things right?.” This analysis does not confine itself to the constraints of available donor financing or short time horizons.
C. Method of Data Collection and Analysis
The assessment team combined quantitative and qualitative techniques in the collection and analysis of information. The high level of attention on the part of donors since the 2008 conflict means an abundance of assessment and analysis of Georgia’s rural sector, in addition to statistics provided by the Government of Georgia. The assessment team reviewed and catalogued this information, cited throughout and annexed to this report. In addition to this, the assessment team conducted interviews with 59 key informants throughout the four‐month period of the assessment. Finally, field verification visits were conducted to see first‐hand the issues confronting a range a players in the agricultural sector, including producers, agribusinesses, rural community members and government officials.
The activity was broken into three phases, each roughly one month: 1) Data collection; 2) Field verification and presentation to USAID; and 3) Analysis and report write‐up. Information and data sources utilized by the assessment team included the following:
Review and analysis of existing literature: 117 source documents were reviewed in preparation of this report. Nearly 100% of the literature was specific to Georgia, with topics including agricultural production, marketing, rural poverty, sector strategies, value chain / crop‐specific analysis, finance, legal/regulatory policy, among others.
5 | P a g e
Statistical analysis: A number of primary data sources were analyzed in the preparation of this report. Sources included the following: 2004 Agricultural Census, 2010 Agriculture and General Statistics Yearbooks (Georgia, Azerbaijan, Armenia), 2010 Village Infrastructure Census, GTZ International Fuel Prices, Energy and Water Regulatory Commission (Georgia, Azerbaijan, Armenia, Russia), FAO Statistics, Ministry of Finance Revenue Service. The online GeoStat database was utilized heavily in the analysis and preparation of materials presented in this report. The team experienced some constraints in obtaining up‐to‐date data, particularly related to recent agricultural land privatization and comparative energy price analysis.
Semi‐structured interviews: The assessment team conducted semi‐structured interviews with 59 key informants. Semi‐structured interview guides were developed during Phase 1 of the assessment, with specific topical areas and illustrative queries developed for: Government officials, Business & entrepreneurs, Donor and assistance agencies, Farmers and community members, Agro‐service providers, Agricultural experts and Financial institutions.
Field visits: Gaining direct insight into the challenges in the rural environment, the assessment dedicated significant energy to conducting field visits to eight regions of Georgia. This included interviews, focus groups and site visits to Shida Kartli, Mtskheta‐Mtianeti, Kvemo Kartli, Kakheti, Imereti, Samegrelo, Guria and Adjara. Field verification included visits to a number of notable rural sector enterprises and activities, including several operated by the Georgian Agricultural Corporation, MFIs with extensive rural sector lending activities, successful cooperatives, etc.
6 | P a g e
III. VISION AND ASSUMPTIONS The vision for the agricultural sector presented in this report is one that builds upon the numerous positive developments in the sector, Georgia’s history as a major agricultural producer, and a well‐informed review of its constraints. The vision projects nearly ten years into the future, to 2020. As outlined above, USAID/Georgia’s Country Development Cooperation Strategy is anticipated to be en‐force from 2012 to 2017. While this vision embraces the new CDCS period through 2017, it also envisions a strategy that can be utilized over the coming five years, and extends to envision impacts well into 2020.
Overall, the agriculture sector vision for 2020 foresees the following transition:
Increase GDP contribution from 7% to 12.5% or more over next 10 years via: Import Substitution and Export Expansion Thrusts
Current (2010)
• Ag Trade Deficit: 1.075 billion GEL
• Ag GDP: 1.5 billion GEL
• 7% contribution to GDP
Future (2020)
• Ag Trade Surplus: 2 billion GEL
• Ag GDP: 4.5 billion GEL
• 12.5% contribution to GDP
The assessment team regards the above‐proposed tripling of agricultural productivity by 2020 to be an achievable vision. Productivity at the moment is extremely low, with many experts speculated that it could be doubled, some estimate increases by as much as five‐fold. The target for agricultural growth is approximately 300 million GEL per year, derived from both increased productivity and expanded use of at least .5 million ha of underutilized land. The team’s projections are grounded on the basis of a number of concrete factors, which include:
Georgia’s proven agricultural productive capacity, with sowed agricultural lands nearly twice the amount they are now, representing as much as 41.7% of GDP;
Recent privatization and consolidation of agricultural land holdings totaling an estimated 373,697 ha in the last five years with average holdings of approximately 10 ha in size;
Renewed interest on the part of the GOG to prioritize agriculture as a key sector to push forward economic growth and poverty reduction; and
Proximity and ongoing engagement with EU markets.
There are a number of key assumptions that underlie the above vision for the sector. Taken in sum, they represent some of the more significant variables/externalities that have the potential to greatly impact the sector. While the current reading of the sector indicates that these assumptions will be en‐force for some time, any significant changes may have the potential to significantly alter the vision and strategy outlined here within. In line with this, assumptions include:
Predictable government policy and level of support necessary to assist private‐sector led growth in agricultural sector;
7 | P a g e
Land ownership continues to be regularized and consolidated;
Continued support by donors to sector for several more years;
Continued embargo on exports of Georgian goods to Russia;
Continued efforts to integrate with European Union trade standards;
Domestic and foreign investment steadily increases in agriculture /agribusiness; and
Rural dislocation of jobs to non‐farm sector.
The Agriculture Sector Analytical Foundations Assessment is presented below in two parts: first “The Hand”, a review of conditions, constraints and challenges in the sector; second “The Play, inclusive of the assessment team’s analysis, findings and strategic recommendations. Annex A, “Matrix of Challenges, Opportunities and Prioritized Recommendations”, is an important reference point throughout this report, providing an overall roadmap for the narrative in a condensed and easy‐to‐digest format.
8 | P a g e
IV. “THE HAND” – AGRICULTURAL SITUATION (ASSETS AND FIXED CONSTRAINTS)
The development of a strategy is based on the “hand” (the circumstances, constraints and opportunities) that is dealt. Each sector of the economy is dealt a different set of conditions that define the limits of what can and cannot be achieved. In this case, the focus is on the conditions that have been dealt to Georgia’s agricultural sector. Starting on the basis of these fixed assets and constraints, a strategic approach for growing agriculture’s contribution will be determined.
”The Hand” is organized around the following four thematic areas:
Geography: pertains to absolute advantages with respect to location to markets; the topography and soils characterize the basic building blocks for the production of agricultural crops and livestock; as do the climate that exists in support of agriculture of various types; and the water resources that are available to ensure the productivity of agriculture.
Agricultural Sector Performance: involves a review of the sector to understand its contribution to the economy from the point of view of GDP and trade; the performance of agriculture in terms of productivity both present and potential; and Georgia’s position with respect to the basic costs of production.
Population/Labor force: involves a discussion of the population from a demographic perspective; the concentration of people in regions by specialization; the entrepreneurial character and skill levels in the rural areas; and the willingness of people in the rural communities to work together in group based initiatives.
Farm Typology: a discussion and categorization of land holdings by size to help categorize farmers into different groups – subsistence, semi‐commercial, and commercial – farms for which specific varied development strategies will work.
A. Geography
Georgia is situated in the Caucasus region, centered between latitudes 41⁰ and 44⁰, and longitudes 40⁰ and 47⁰, with an area of 67,900 km2 (6.8 million hectares). The Greater Caucasus Mountain Range forms the northern border of Georgia and the southern portion of the country is bounded by the Lesser Caucasus Mountains. The Greater Caucasus Range rises to peaks that reach more than 16,000 ft. above sea level, much higher than the Lesser Caucasus. The Likhi Range divides the country into eastern and
western halves. Overall, the country is very mountainous and this limits the agricultural area to a swath that runs west to east through the middle of the country and to several micro‐climatic mountain valleys. In general, soils are of volcanic origin located in the river valleys. They tend to be quite fertile and reasonably easy to cultivate for agricultural purposes. Soil on the sloped grazing areas in foothill areas tend to be rockier and more difficult to till. Overall, the majority of soils on well‐situated agricultural lands are permissive of most modern agricultural practices
i. Topography and Land Use The landscape within the nation's boundaries is quite varied. Western Georgia's landscape ranges from low‐land marsh‐forests, swamps, and temperate rainforests to eternal snows and glaciers. The eastern part of the country is equally diverse, even containing a small segment of semi‐arid plains. Much of the
9 | P a g e
natural habitat in the low‐lying areas of Western Georgia has disappeared over the last 100 years due to agricultural development and urbanization. The large majority of forests that covered the western central plains are now virtually non‐existent, with the exception of the regions that are included in the national parks and reserves. At present, the forest cover generally remains outside of the low‐lying areas and is mainly located along the foothills and the mountains. Western Georgia's forests consist mainly of deciduous trees below 2,000 ft. above sea level, comprising species such as oak, hornbeam, beech, elm, ash, and chestnut. Evergreen species are also found in some areas.
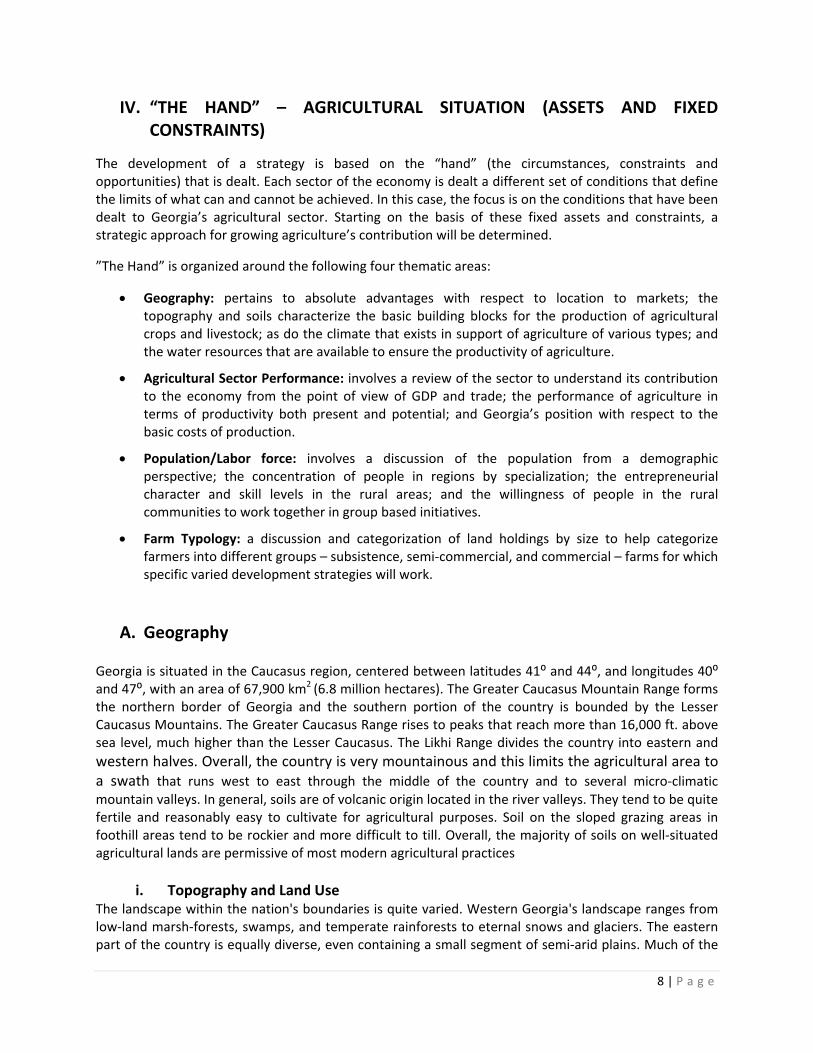
Figure IV‐1: Type of Land Use in Georgia
Eastern Georgia's landscape (referring to the territory east of the Likhi Range) is considerably different from that of the west, although, much like the central plain in the west, nearly all of the low‐lying areas of eastern Georgia including the Mtkvari and Alazani River plains have been deforested for agricultural purposes. In addition, because of the region's relatively drier climate, some of the low‐lying plains, (especially in Kartli and south‐eastern Kakheti) were never covered by forests in the first place. The general landscape of eastern Georgia comprises numerous valleys and gorges that are separated by mountains. Nearly 85% of the forests of the region are deciduous. Coniferous forests only dominate in the Borjomi Gorge and in the extreme western areas. Of the deciduous species of trees, beech, oak, and hornbeam dominate. Other deciduous species include varieties of maple, aspen, ash, and hazelnut.
Based on Georgia’s overall geography and topography, it can be appreciated that the terrain limits agricultural areas. Of the 6.8 million ha controlled by the country, approximately 43.7% of the total area is considered agricultural, including pasture‐lands and meadows. The Land Use Map set out as Figure V‐1 shows a breakdown of land into various classes of soil and land cover. A further discussion of agricultural land can be found in the Land section of this report.
ii. Climate Considering the country’s small size, Georgia’s climate is extremely diverse. There are two main climatic zones, roughly separating Eastern and Western parts of the country. The Greater Caucasus Mountain
10 | P a g e
Range plays an important role in moderating Georgia's climate and protects the country from the penetration of colder air masses from the north. The Lesser Caucasus Mountains partially protect the region from the influence of dry and hot air masses from the south. In spite of the climatic variations, agriculture is well supported.
Much of western Georgia lies within the northern periphery of the humid subtropical zone with annual precipitation ranging from 1,000–4,000 mm (39.4–157.5 in). The precipitation tends to be uniformly distributed throughout the year, although the rainfall can be particularly heavy during fall months. The climate of the region varies significantly with elevation and while much of the lowland areas of western Georgia are relatively warm throughout the year, the foothills and mountainous areas (including both the Greater and Lesser Caucasus Mountains) experience cool, wet summers and snowy winters (snow cover often exceeds 2 meters in many regions).
Eastern Georgia has a transitional climate from humid subtropical to continental. The region's weather patterns are influenced both by dry, Caspian air masses from the east and humid, Black Sea air masses from the west. The penetration of humid air masses from the Black Sea is often blocked by the Likhi and Meskheti mountain ranges that separate the eastern and western parts of the country. Annual precipitation in the east is considerably less than that of western Georgia, ranging from 400–1,600 mm (15.7–63.0 in).
The wettest periods generally occur during spring and autumn while winter and the summer months tend to be the driest. Much of eastern Georgia experiences hot summers (especially in the low‐lying areas) and relatively cold winters. As in the western parts of the nation, elevation plays an important role in eastern Georgia where climatic conditions above 5,000 ft. are considerably colder than in the low‐lying areas. Regions that lie above 6,500 ft. frequently experience frost, even during the summer months. With the reasonably high rainfalls in several regions of the country and high snow packs in the mountains, Georgia is blessed with a good source of water to support irrigation.
Summary: As a result of this geographic, topographic, and climatic diversity, Georgia has a great variety of ecological and climatic zones that allow for the production of most types of temperate and even sub‐tropical food and agricultural products. This permits extension of the growing seasons to serve markets both early and late in northern countries such as those of the EU and Russia (irrespective of the current embargo). These include early and late vegetables, potatoes, essential oils, flowers, medicinal herbs, grapes, and a wide variety of fruits and nuts. Additionally, grains, oilseeds, animal fodder, and other crops like tea, tobacco, and citrus are grown. With approximately 1.8 million hectares of pastureland and meadows, grazed livestock (cattle, sheep, and goats) is quite common. Finally, swine and poultry production is carried out near cities and villages to serve the local markets.
11 | P a g e
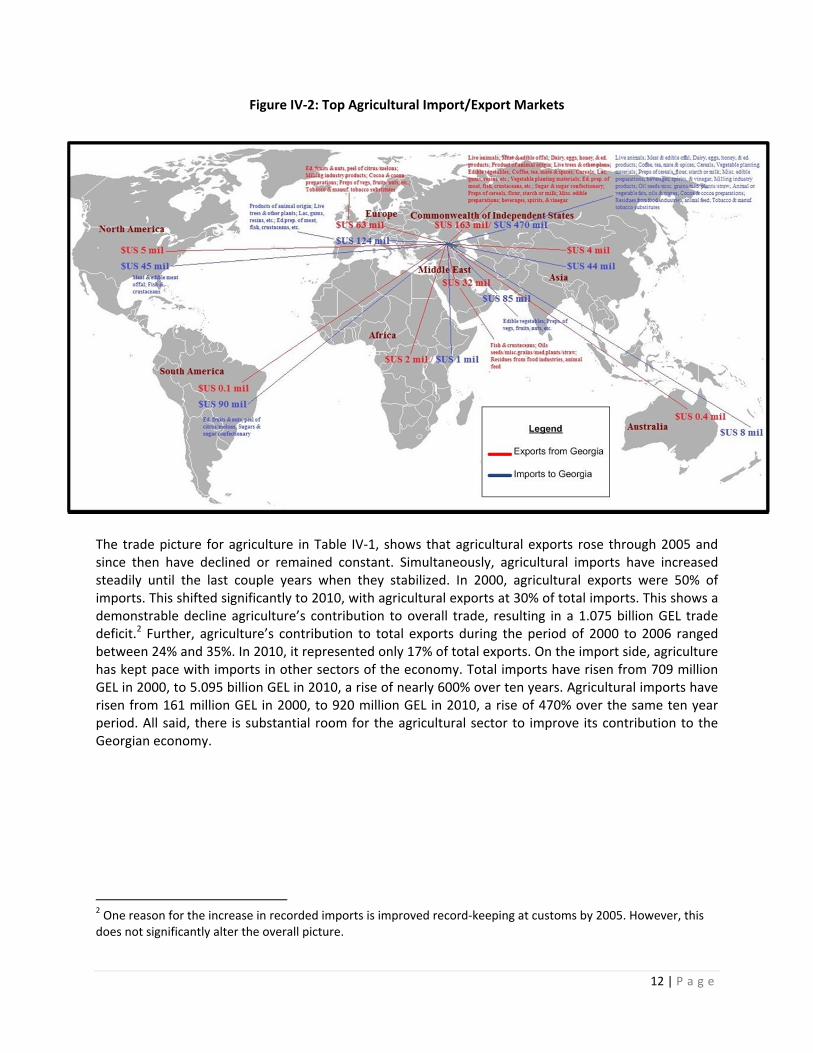
iii. Location With Respect to Markets Georgia is well located with respect to many major markets – traditional CIS markets, and newer ones in the EU and Middle East. Georgia has traditionally been a major supplier of agricultural products to FSU countries, particularly Russia and Ukraine. At present, however, the country is under an embargo by Russia and is unable to put Georgian product on the shelves of the retail stores of its formerly top trading partner. Ukraine has become a major trading partner with more than 25% of agricultural (see Figure IV‐3), and another 14% of trade with Azerbaijan and Georgia. These traditional trade relationships between Ukraine, Belarus, Kazakhstan, Azerbaijan1 and other CIS countries should continue. However, Georgia should work to develop and strengthen market ties with the EU and Middle East. Establishment of these relationships will do much to diversify and reduce Georgia’s dependence on CIS markets for food and agricultural trade. As well, the opportunity to serve more demanding markets will trigger Georgia’s graduation from basic production and marketing systems to a greater sophistication able to meet more demanding market requirements.
In addition to being well located with respect to the EU and Middle East markets, the climatic conditions of Georgia permit production for many months of the year when the demand for selected commodities (fruits, vegetables, herbs, and other high value products) in Northern EU countries is strong. Further, numerous countries in the Middle East and North Africa offer high‐income markets with strong demand for selected commodities such as beef, sheep, fruits, vegetables. For example, presently several Middle East countries import live sheep from Australia and New Zealand. Given increased quality and scale, Georgia’s location and productive potential bear prospects of competing in this market.
1 Azerbaijan just recently has become a significant agricultural trading partner with Georgia, with live cattle export to Azerbaijan accounting for several million dollars in value. End markets and overall sustainability of these trading relationships, largely risking up since the Russian embargo, is unclear.
12 | P a g e
Figure IV‐2: Top Agricultural Import/Export Markets
The trade picture for agriculture in Table IV‐1, shows that agricultural exports rose through 2005 and since then have declined or remained constant. Simultaneously, agricultural imports have increased steadily until the last couple years when they stabilized. In 2000, agricultural exports were 50% of imports. This shifted significantly to 2010, with agricultural exports at 30% of total imports. This shows a demonstrable decline agriculture’s contribution to overall trade, resulting in a 1.075 billion GEL trade deficit.2 Further, agriculture’s contribution to total exports during the period of 2000 to 2006 ranged between 24% and 35%. In 2010, it represented only 17% of total exports. On the import side, agriculture has kept pace with imports in other sectors of the economy. Total imports have risen from 709 million GEL in 2000, to 5.095 billion GEL in 2010, a rise of nearly 600% over ten years. Agricultural imports have risen from 161 million GEL in 2000, to 920 million GEL in 2010, a rise of 470% over the same ten year period. All said, there is substantial room for the agricultural sector to improve its contribution to the Georgian economy.
2 One reason for the increase in recorded imports is improved record‐keeping at customs by 2005. However, this does not significantly alter the overall picture.
13 | P a g e
Table IV‐1: Agriculture Trade in Relation to Total Trade
Unit 2000 2001 2002 2003 2004 2005 2006 2007 2008 2009 2010
Ag Exports $US 91,778,933 78,943,791 95,944,674 146,951,939 167,379,719 303,891,962 266,171,932 249,347,736 250,507,582 286,909,611 267,845,358
Ag Imports $US 161,975,358 155,555,876 154,446,324 182,863,454 367,458,451 433,725,561 561,719,621 762,092,482 942,064,725 737,310,772 920,015,542
Ag export coverage of ag imports
% 57 51 62 80 46 70 40 33 27 39 29
Change in ag exports
% ‐14 22 53 14 82 ‐26 10 0 15 ‐7
Change in ag imports
% ‐4 ‐1 18 101 18 30 36 24 ‐22 25
Total Exports
$US 323,938,267 317,150,882 345,736,068 431,310,038 646,902,963 865,455,633 936,374,627 1,232,110,470 1,495,345,238 33,622,400 1,583,345,098
Total Imports
$US 709,509,126 752,010,912 794,691,603 1,139,039,159 1,844,342,929 2,487,548,346 3,674,832,445 5,212,150,246 6,301,540,343 4,366,105,654 5,095,460,281
Change in total
exports % ‐2 9 33 40 34 8 32 21 ‐24 40
Change in total
imports % 6 6 43 62 35 48 42 21 ‐31 17
Ag share in total
exports % 28 25 28 32 26 35 24 20 17 25 17
Ag share in total
imports % 23 21 19 16 20 17 15 15 15 17 18
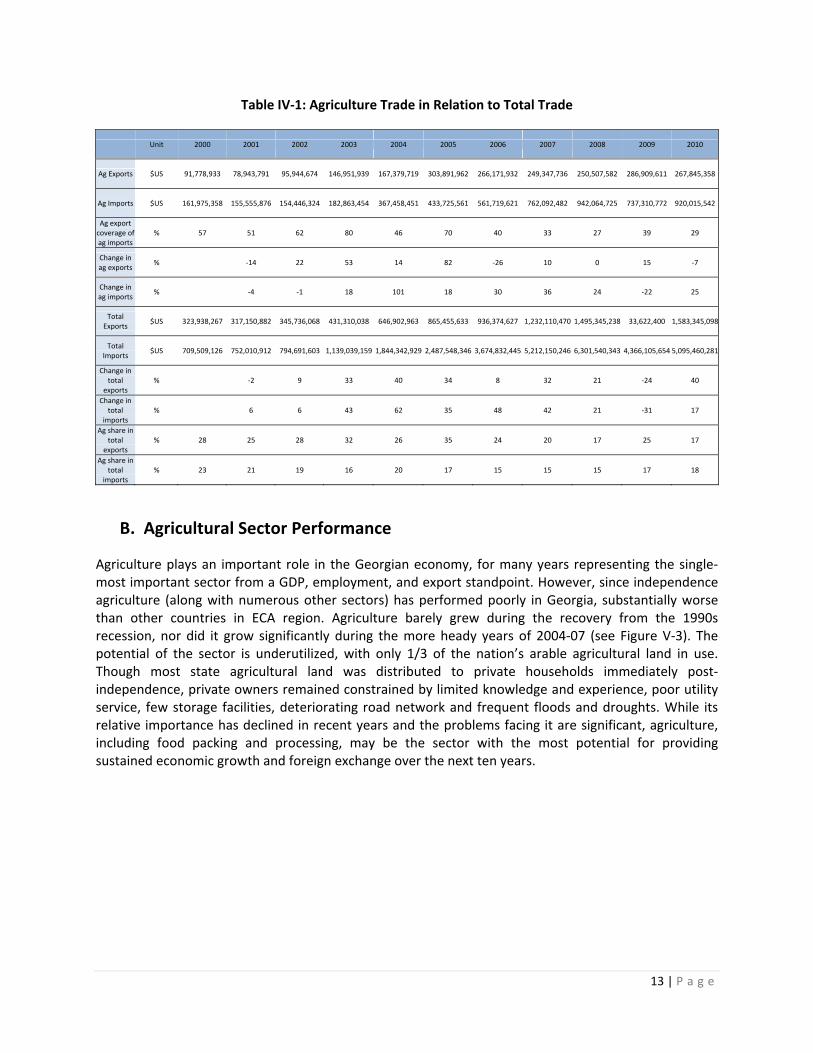
B. Agricultural Sector Performance
Agriculture plays an important role in the Georgian economy, for many years representing the single‐most important sector from a GDP, employment, and export standpoint. However, since independence agriculture (along with numerous other sectors) has performed poorly in Georgia, substantially worse than other countries in ECA region. Agriculture barely grew during the recovery from the 1990s recession, nor did it grow significantly during the more heady years of 2004‐07 (see Figure V‐3). The potential of the sector is underutilized, with only 1/3 of the nation’s arable agricultural land in use. Though most state agricultural land was distributed to private households immediately post‐independence, private owners remained constrained by limited knowledge and experience, poor utility service, few storage facilities, deteriorating road network and frequent floods and droughts. While its relative importance has declined in recent years and the problems facing it are significant, agriculture, including food packing and processing, may be the sector with the most potential for providing sustained economic growth and foreign exchange over the next ten years.
14 | P a g e
Figure IV‐3: Agricultural Growth Substantially Below Potential
Source: WDR
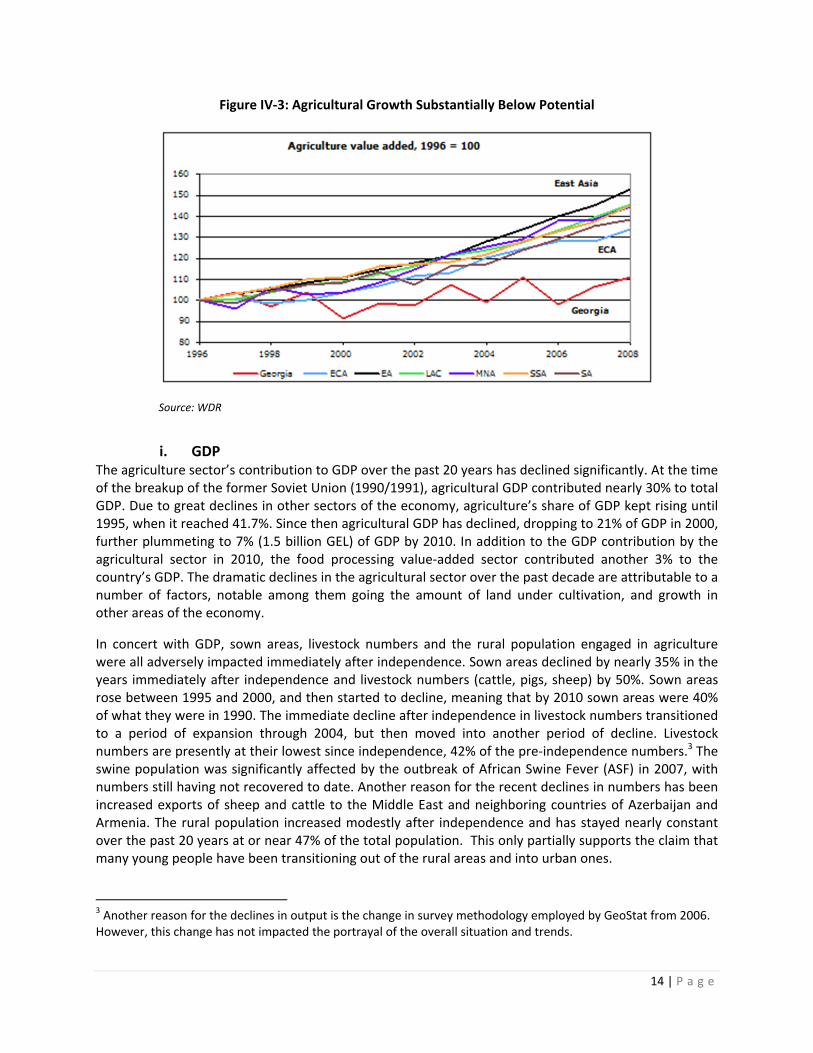
i. GDP The agriculture sector’s contribution to GDP over the past 20 years has declined significantly. At the time of the breakup of the former Soviet Union (1990/1991), agricultural GDP contributed nearly 30% to total GDP. Due to great declines in other sectors of the economy, agriculture’s share of GDP kept rising until 1995, when it reached 41.7%. Since then agricultural GDP has declined, dropping to 21% of GDP in 2000, further plummeting to 7% (1.5 billion GEL) of GDP by 2010. In addition to the GDP contribution by the agricultural sector in 2010, the food processing value‐added sector contributed another 3% to the country’s GDP. The dramatic declines in the agricultural sector over the past decade are attributable to a number of factors, notable among them going the amount of land under cultivation, and growth in other areas of the economy.
In concert with GDP, sown areas, livestock numbers and the rural population engaged in agriculture were all adversely impacted immediately after independence. Sown areas declined by nearly 35% in the years immediately after independence and livestock numbers (cattle, pigs, sheep) by 50%. Sown areas rose between 1995 and 2000, and then started to decline, meaning that by 2010 sown areas were 40% of what they were in 1990. The immediate decline after independence in livestock numbers transitioned to a period of expansion through 2004, but then moved into another period of decline. Livestock numbers are presently at their lowest since independence, 42% of the pre‐independence numbers.3 The swine population was significantly affected by the outbreak of African Swine Fever (ASF) in 2007, with numbers still having not recovered to date. Another reason for the recent declines in numbers has been increased exports of sheep and cattle to the Middle East and neighboring countries of Azerbaijan and Armenia. The rural population increased modestly after independence and has stayed nearly constant over the past 20 years at or near 47% of the total population. This only partially supports the claim that many young people have been transitioning out of the rural areas and into urban ones.
3 Another reason for the declines in output is the change in survey methodology employed by GeoStat from 2006. However, this change has not impacted the portrayal of the overall situation and trends.
15 | P a g e
Table IV‐2: Agriculture, Hunting, Fishing, and Forestry: Economic Importance, 1990‐2010
Year Sown Areas (ha)* Livestock Numbers % of GDP % Rural Population
in Total
1990 701,900 4,287,900 29.7 43.9
1995 453,100 2,104,300 41.7 48
2000 610,800 2,248,400 20.6 48.8
2001 564,500 2,284,800 21 47.7
2002 577,000 2,361,600 19.2 74.8
2003 561,700 2,438,000 19.3 47.8
2004 534,000 2,466700 16.4 48.8
2005 539,600 2,461,200 14.8 47.5
2006 330,200 2,213,000 11.2 47.5
2007 297,200 1,955,500 9.2 47.4
2008 329,300 1,901,200 8.1 47.3
2009 308,300 1,823,700 8.1 47.3
2010 275,300 1,813,000 7.3 46.9 * Excludes perennial crops and grazing landsSource: 2008 and 2010 Georgia Agriculture Statistical Abstract, Department of Statistics
ii. Agricultural Productivity Georgian agriculture is characterized by low productivity and weak competitiveness across most major agricultural sectors. This can best be illustrated by a review of several crops produced in Georgia compared to the productivity levels of the same crops produced in several other countries of the region or countries that lead the world in the production of selected crops.
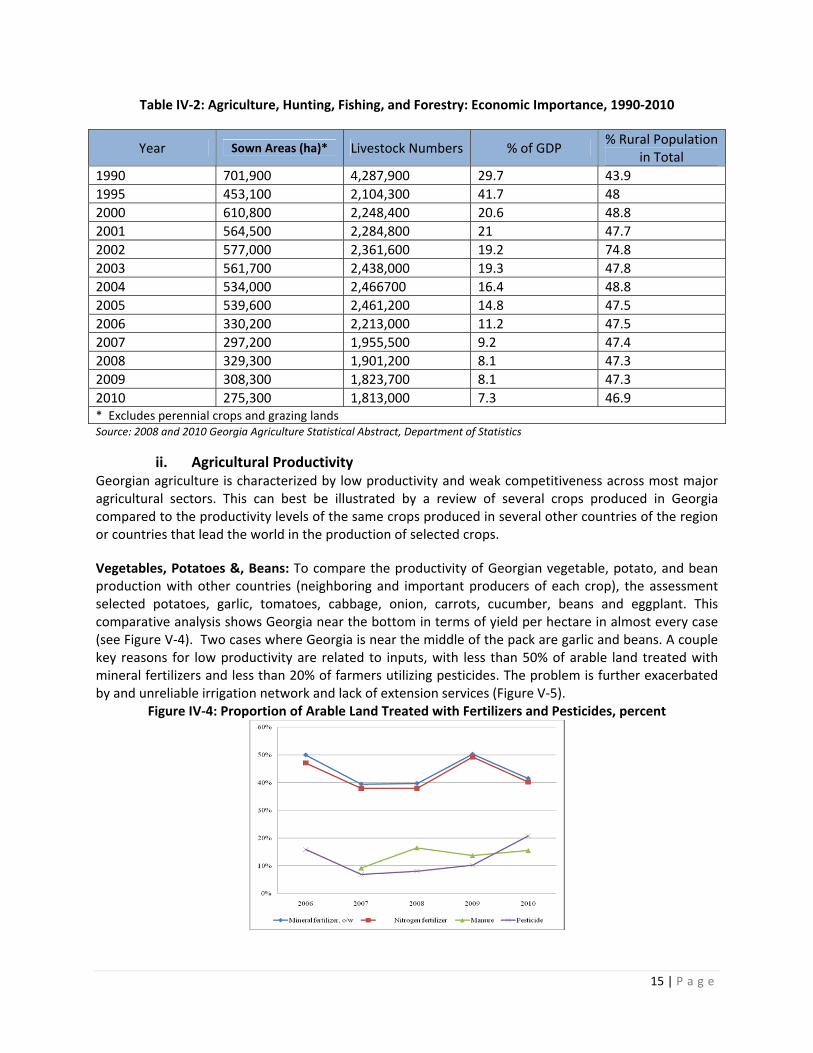
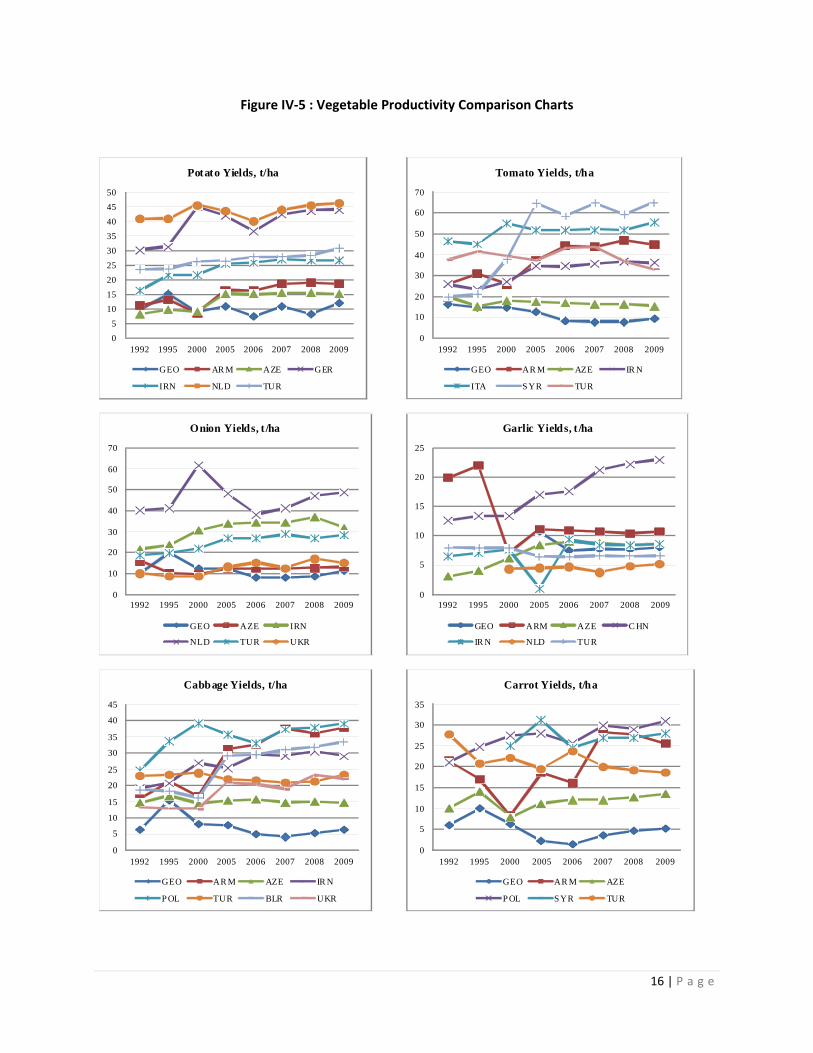
Vegetables, Potatoes &, Beans: To compare the productivity of Georgian vegetable, potato, and bean production with other countries (neighboring and important producers of each crop), the assessment selected potatoes, garlic, tomatoes, cabbage, onion, carrots, cucumber, beans and eggplant. This comparative analysis shows Georgia near the bottom in terms of yield per hectare in almost every case (see Figure V‐4). Two cases where Georgia is near the middle of the pack are garlic and beans. A couple key reasons for low productivity are related to inputs, with less than 50% of arable land treated with mineral fertilizers and less than 20% of farmers utilizing pesticides. The problem is further exacerbated by and unreliable irrigation network and lack of extension services (Figure V‐5).
Figure IV‐4: Proportion of Arable Land Treated with Fertilizers and Pesticides, percent
16 | P a g e
Figure IV‐5 : Vegetable Productivity Comparison Charts
0
5
10
15
20
25
30
35
40
45
50
1992 1995 2000 2005 2006 2007 2008 2009
Potato Yields, t/ha
GEO AR M AZE GER
IRN NLD TUR
0
10
20
30
40
50
60
70
1992 1995 2000 2005 2006 2007 2008 2009
Tomato Yields, t/ha
GEO AR M AZE IR N
ITA S YR TUR
0
10
20
30
40
50
60
70
1992 1995 2000 2005 2006 2007 2008 2009
Onion Yields, t /ha
GEO AZE IRN
NLD TUR UKR
0
5
10
15
20
25
1992 1995 2000 2005 2006 2007 2008 2009
Garlic Yields, t /ha
GEO ARM AZE C HN
IR N NLD TUR
0
5
10
15
20
25
30
35
40
45
1992 1995 2000 2005 2006 2007 2008 2009
Cabbage Yields, t/ha
GEO AR M AZE IR N
P OL TUR BLR UKR
0
5
10
15
20
25
30
35
1992 1995 2000 2005 2006 2007 2008 2009
Carrot Yields, t/ha
GEO AR M AZE
P OL S YR TUR
17 | P a g e
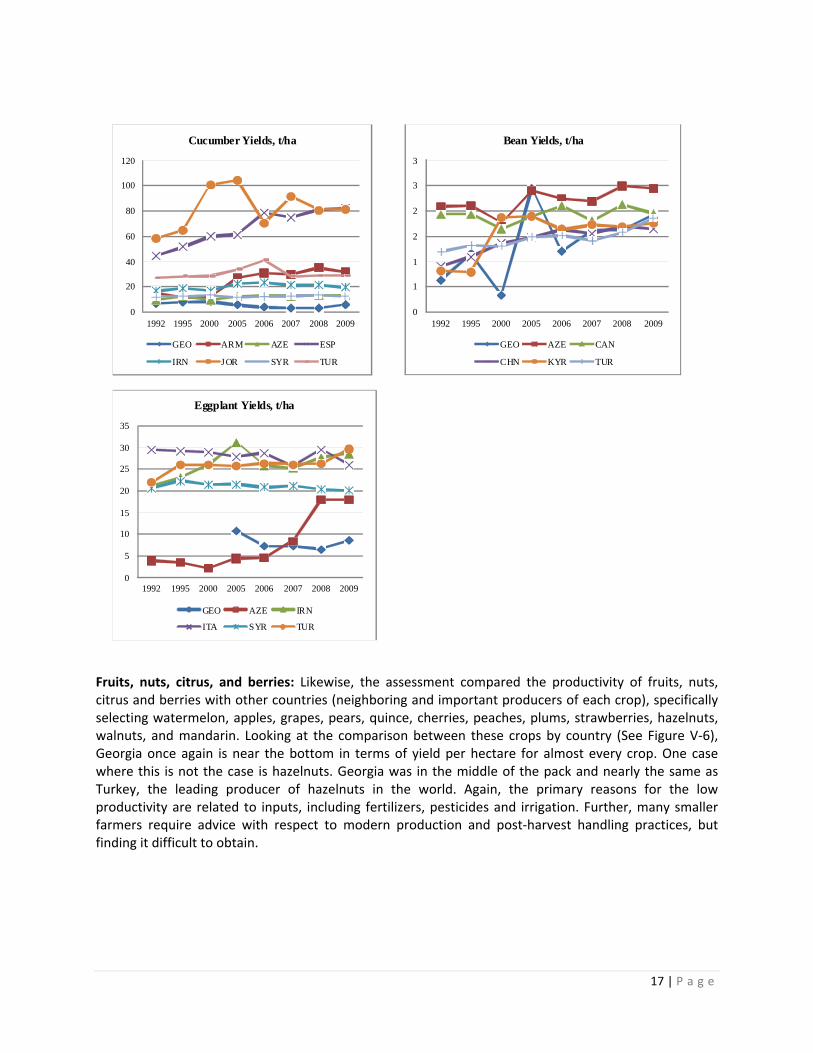
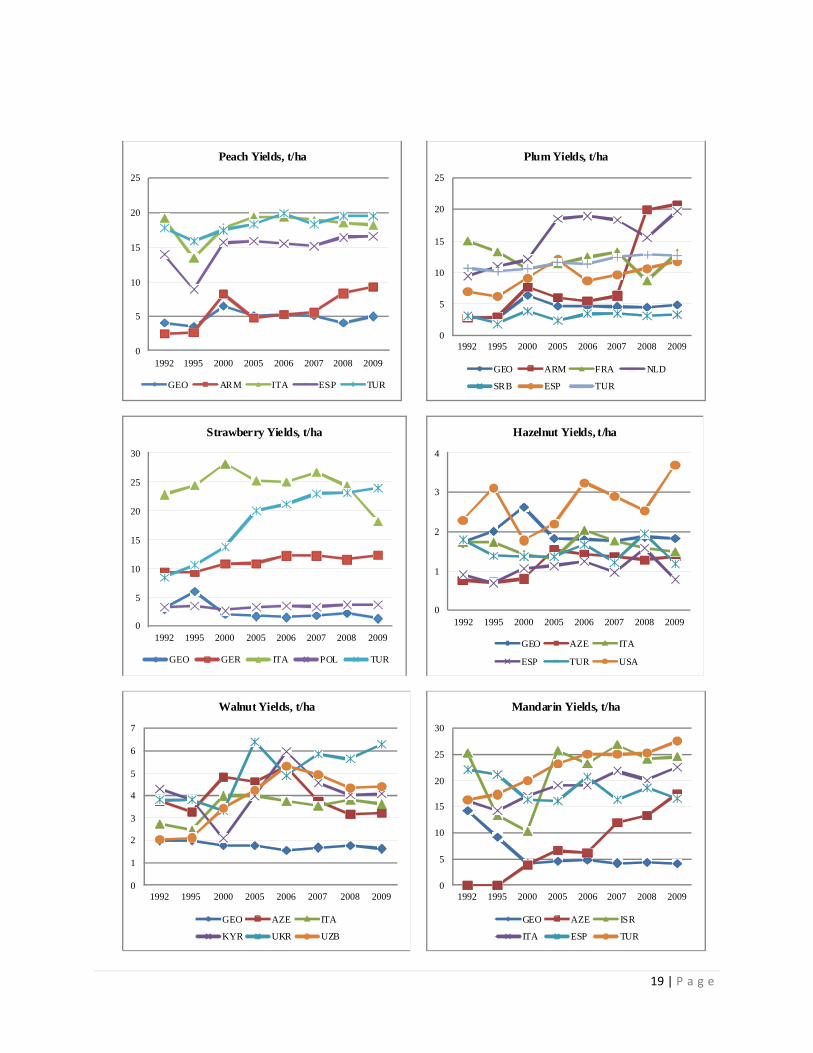
Fruits, nuts, citrus, and berries: Likewise, the assessment compared the productivity of fruits, nuts, citrus and berries with other countries (neighboring and important producers of each crop), specifically selecting watermelon, apples, grapes, pears, quince, cherries, peaches, plums, strawberries, hazelnuts, walnuts, and mandarin. Looking at the comparison between these crops by country (See Figure V‐6), Georgia once again is near the bottom in terms of yield per hectare for almost every crop. One case where this is not the case is hazelnuts. Georgia was in the middle of the pack and nearly the same as Turkey, the leading producer of hazelnuts in the world. Again, the primary reasons for the low productivity are related to inputs, including fertilizers, pesticides and irrigation. Further, many smaller farmers require advice with respect to modern production and post‐harvest handling practices, but finding it difficult to obtain.
0
20
40
60
80
100
120
1992 1995 2000 2005 2006 2007 2008 2009
Cucumber Yields, t/ha
GEO ARM AZE ESP
IRN JOR SYR TUR
0
1
1
2
2
3
3
1992 1995 2000 2005 2006 2007 2008 2009
Bean Yields, t/ha
GEO AZE CAN
CHN KYR TUR
0
5
10
15
20
25
30
35
1992 1995 2000 2005 2006 2007 2008 2009
Eggplant Yields, t/ha
GEO AZE IRN
ITA SYR TUR

18 | P a g e
Figure IV‐6: Fruit, Nuts, Citrus, and Berry Productivity Comparison Charts
0
5
10
15
20
25
30
35
40
45
50
1992 1995 2000 2005 2006 2007 2008 2009
Watermelon Yields, t/ha
GEO ARM AZE IRN
ESP SYR TUR
0
5
10
15
20
25
30
35
40
45
50
1992 1995 2000 2005 2006 2007 2008 2009
Apple Yields, t/ha
GEO FRA IRN NLD
POL TUR UKR
0
2
4
6
8
10
12
14
16
18
1992 1995 2000 2005 2006 2007 2008 2009
Grape Yields, t/ha
GEO ARM AZE IRN
ITA TUR UZB
0
5
10
15
20
25
30
35
40
1992 1995 2000 2005 2006 2007 2008 2009
Pear Yields, t/ha
GEO AZE CHN GER
ITA NLD TUR
0
2
4
6
8
10
12
14
16
1992 1995 2000 2005 2006 2007 2008 2009
Quinces Yields, t/ha
GEO SRB ESP TUR
0
2
4
6
8
10
12
14
1992 1995 2000 2005 2006 2007 2008 2009
Cherry Yields, t/ha
GEO ARM ITA
POL ESP TUR
19 | P a g e
0
5
10
15
20
25
1992 1995 2000 2005 2006 2007 2008 2009
Peach Yields, t/ha
GEO ARM ITA ESP TUR
0
5
10
15
20
25
1992 1995 2000 2005 2006 2007 2008 2009
Plum Yields, t/ha
GEO ARM FRA NLD
SRB ESP TUR
0
5
10
15
20
25
30
1992 1995 2000 2005 2006 2007 2008 2009
Strawberry Yields, t/ha
GEO GER ITA POL TUR
0
1
2
3
4
1992 1995 2000 2005 2006 2007 2008 2009
Hazelnut Yields, t/ha
GEO AZE ITA
ESP TUR USA
0
1
2
3
4
5
6
7
1992 1995 2000 2005 2006 2007 2008 2009
Walnut Yields, t/ha
GEO AZE ITA
KYR UKR UZB
0
5
10
15
20
25
30
1992 1995 2000 2005 2006 2007 2008 2009
Mandarin Yields, t/ha
GEO AZE ISR
ITA ESP TUR
20 | P a g e
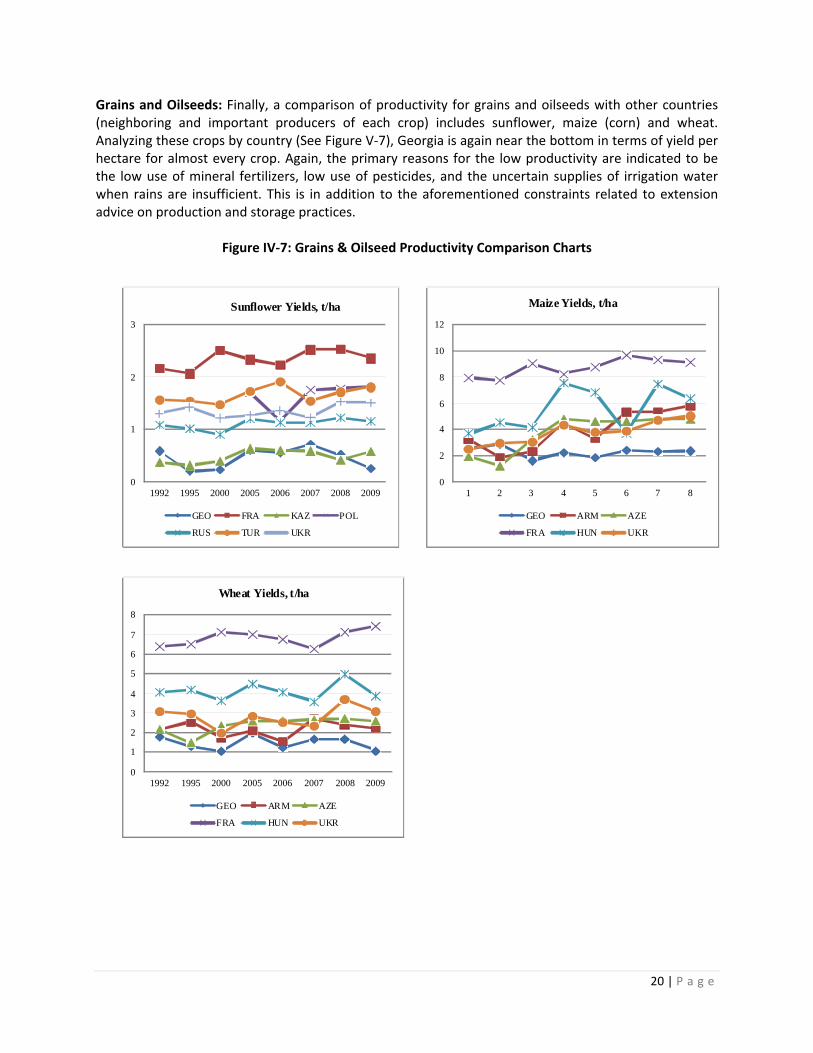
Grains and Oilseeds: Finally, a comparison of productivity for grains and oilseeds with other countries (neighboring and important producers of each crop) includes sunflower, maize (corn) and wheat. Analyzing these crops by country (See Figure V‐7), Georgia is again near the bottom in terms of yield per hectare for almost every crop. Again, the primary reasons for the low productivity are indicated to be the low use of mineral fertilizers, low use of pesticides, and the uncertain supplies of irrigation water when rains are insufficient. This is in addition to the aforementioned constraints related to extension advice on production and storage practices.
Figure IV‐7: Grains & Oilseed Productivity Comparison Charts
0
1
2
3
1992 1995 2000 2005 2006 2007 2008 2009
Sunflower Yields, t/ha
GEO FRA KAZ POL
RUS TUR UKR
0
2
4
6
8
10
12
1 2 3 4 5 6 7 8
Maize Yields, t/ha
GEO ARM AZE
FRA HUN UKR
0
1
2
3
4
5
6
7
8
1992 1995 2000 2005 2006 2007 2008 2009
Wheat Yields, t/ha
GEO ARM AZE
FRA HUN UKR
21 | P a g e
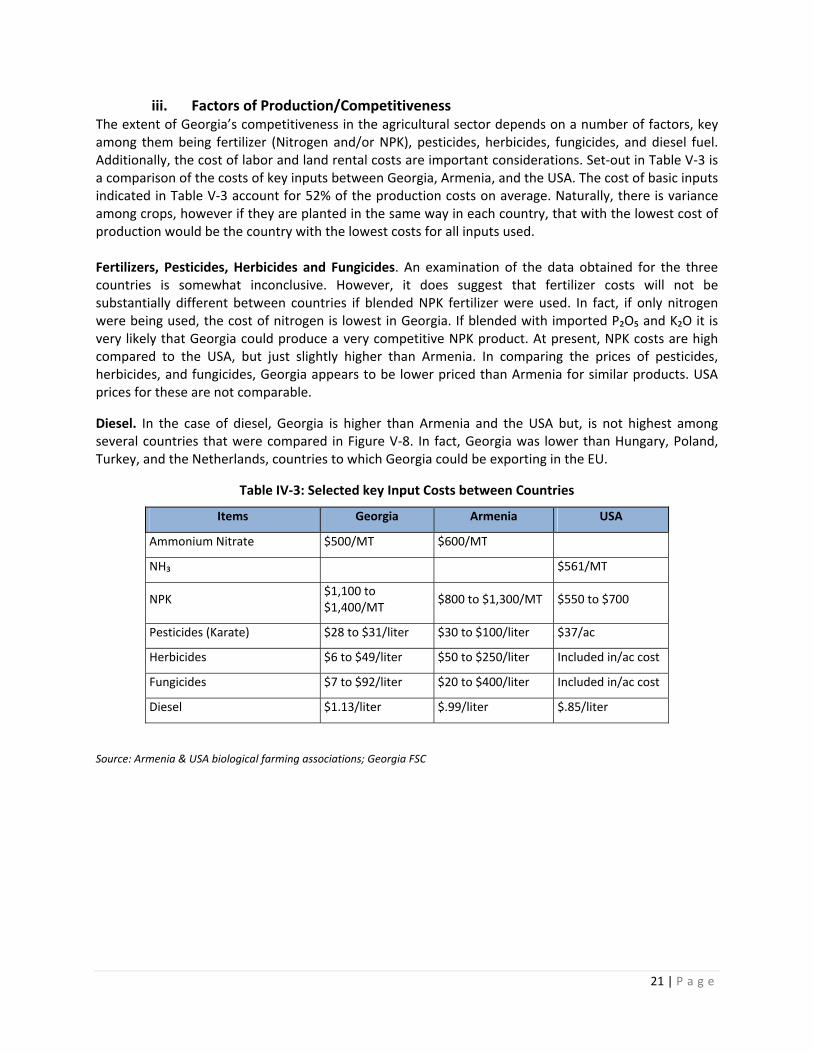
iii. Factors of Production/Competitiveness The extent of Georgia’s competitiveness in the agricultural sector depends on a number of factors, key among them being fertilizer (Nitrogen and/or NPK), pesticides, herbicides, fungicides, and diesel fuel. Additionally, the cost of labor and land rental costs are important considerations. Set‐out in Table V‐3 is a comparison of the costs of key inputs between Georgia, Armenia, and the USA. The cost of basic inputs indicated in Table V‐3 account for 52% of the production costs on average. Naturally, there is variance among crops, however if they are planted in the same way in each country, that with the lowest cost of production would be the country with the lowest costs for all inputs used. Fertilizers, Pesticides, Herbicides and Fungicides. An examination of the data obtained for the three countries is somewhat inconclusive. However, it does suggest that fertilizer costs will not be substantially different between countries if blended NPK fertilizer were used. In fact, if only nitrogen were being used, the cost of nitrogen is lowest in Georgia. If blended with imported P₂O₅ and K₂O it is very likely that Georgia could produce a very competitive NPK product. At present, NPK costs are high compared to the USA, but just slightly higher than Armenia. In comparing the prices of pesticides, herbicides, and fungicides, Georgia appears to be lower priced than Armenia for similar products. USA prices for these are not comparable.
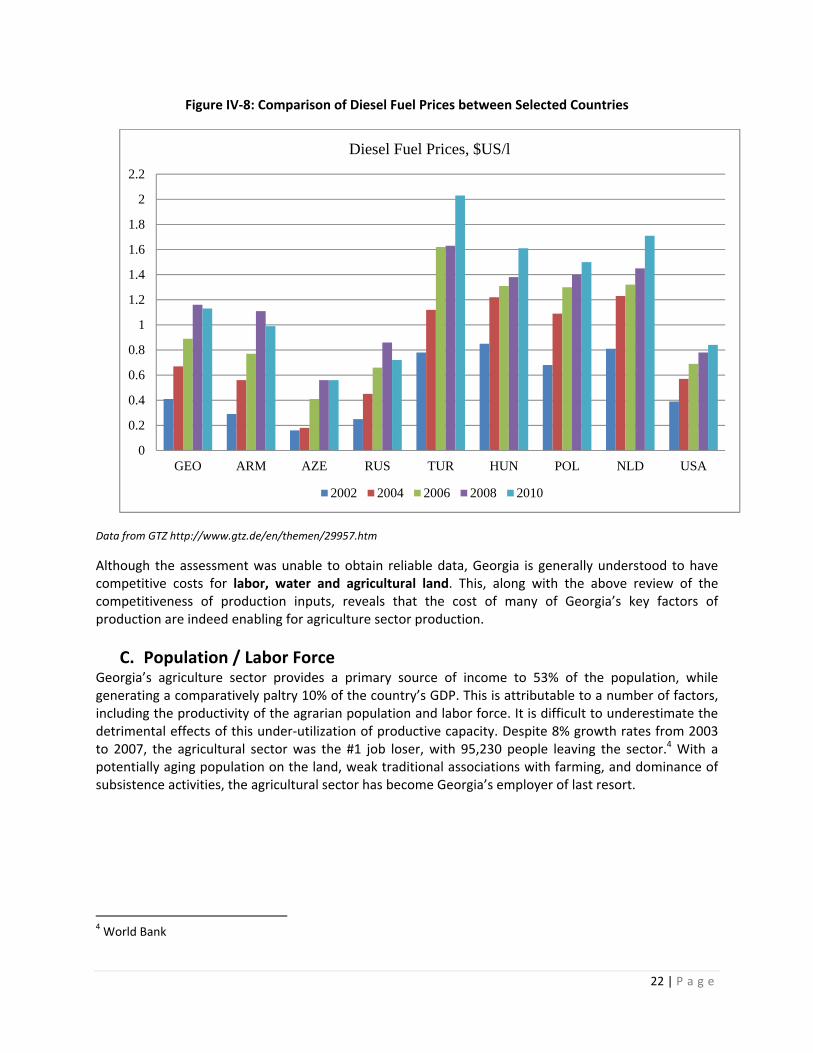
Diesel. In the case of diesel, Georgia is higher than Armenia and the USA but, is not highest among several countries that were compared in Figure V‐8. In fact, Georgia was lower than Hungary, Poland, Turkey, and the Netherlands, countries to which Georgia could be exporting in the EU.
Table IV‐3: Selected key Input Costs between Countries
Items Georgia Armenia USA
Ammonium Nitrate $500/MT $600/MT
NH₃ $561/MT
NPK $1,100 to $1,400/MT
$800 to $1,300/MT $550 to $700
Pesticides (Karate) $28 to $31/liter $30 to $100/liter $37/ac
Herbicides $6 to $49/liter $50 to $250/liter Included in/ac cost
Fungicides $7 to $92/liter $20 to $400/liter Included in/ac cost
Diesel $1.13/liter $.99/liter $.85/liter
Source: Armenia & USA biological farming associations; Georgia FSC
22 | P a g e
Figure IV‐8: Comparison of Diesel Fuel Prices between Selected Countries
Data from GTZ http://www.gtz.de/en/themen/29957.htm
Although the assessment was unable to obtain reliable data, Georgia is generally understood to have competitive costs for labor, water and agricultural land. This, along with the above review of the competitiveness of production inputs, reveals that the cost of many of Georgia’s key factors of production are indeed enabling for agriculture sector production.
C. Population / Labor Force Georgia’s agriculture sector provides a primary source of income to 53% of the population, while generating a comparatively paltry 10% of the country’s GDP. This is attributable to a number of factors, including the productivity of the agrarian population and labor force. It is difficult to underestimate the detrimental effects of this under‐utilization of productive capacity. Despite 8% growth rates from 2003 to 2007, the agricultural sector was the #1 job loser, with 95,230 people leaving the sector.4 With a potentially aging population on the land, weak traditional associations with farming, and dominance of subsistence activities, the agricultural sector has become Georgia’s employer of last resort.
4 World Bank
0
0.2
0.4
0.6
0.8
1
1.2
1.4
1.6
1.8
2
2.2
GEO ARM AZE RUS TUR HUN POL NLD USA
Diesel Fuel Prices, $US/l
2002 2004 2006 2008 2010
23 | P a g e
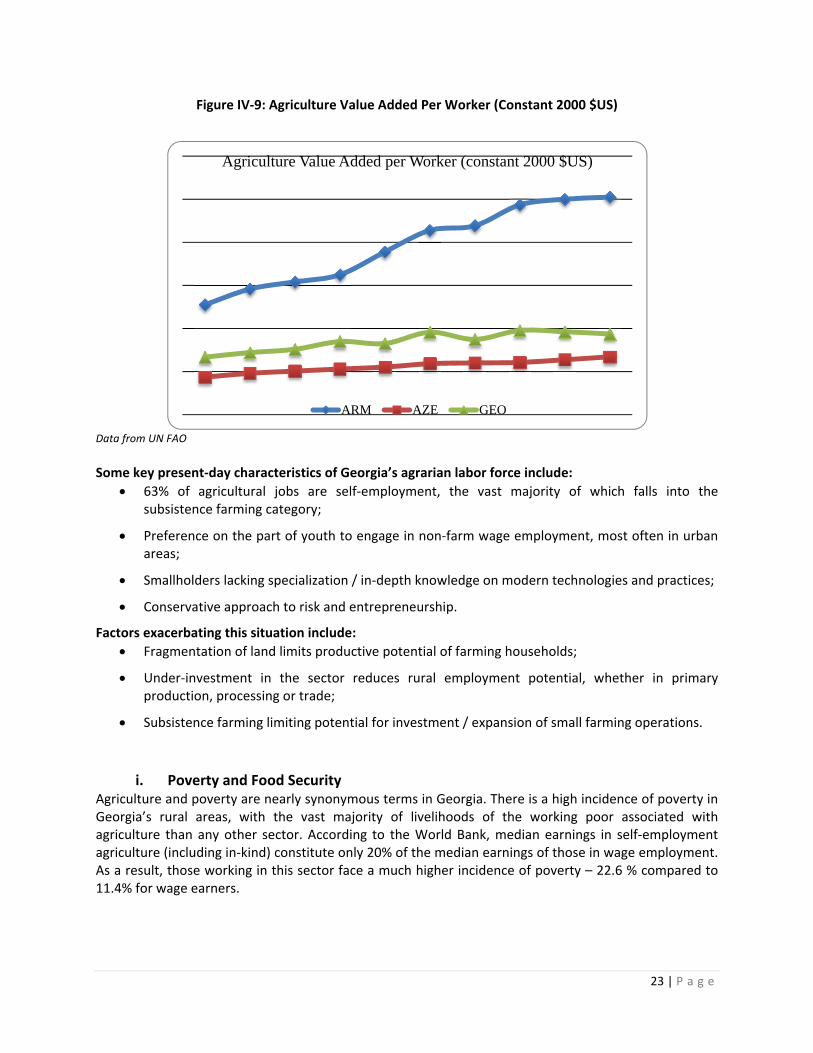
Figure IV‐9: Agriculture Value Added Per Worker (Constant 2000 $US)
Data from UN FAO
Some key present‐day characteristics of Georgia’s agrarian labor force include:
63% of agricultural jobs are self‐employment, the vast majority of which falls into the subsistence farming category;
Preference on the part of youth to engage in non‐farm wage employment, most often in urban areas;
Smallholders lacking specialization / in‐depth knowledge on modern technologies and practices;
Conservative approach to risk and entrepreneurship.
Factors exacerbating this situation include:
Fragmentation of land limits productive potential of farming households;
Under‐investment in the sector reduces rural employment potential, whether in primary production, processing or trade;
Subsistence farming limiting potential for investment / expansion of small farming operations.
i. Poverty and Food Security Agriculture and poverty are nearly synonymous terms in Georgia. There is a high incidence of poverty in Georgia’s rural areas, with the vast majority of livelihoods of the working poor associated with agriculture than any other sector. According to the World Bank, median earnings in self‐employment agriculture (including in‐kind) constitute only 20% of the median earnings of those in wage employment. As a result, those working in this sector face a much higher incidence of poverty – 22.6 % compared to 11.4% for wage earners.
Agriculture Value Added per Worker (constant 2000 $US)
ARM AZE GEO

24 | P a g e
Figure IV‐10: Poverty Incidence, by Type of Employment and Urban/Rural Location (2007)
There are striations of poverty throughout various regions of Georgia, with those less commercial agricultural areas tending to be the poorest. Poverty is significantly greater in the northern mountain arc (Shida Kartli, Mtskheta‐Mtianeti, Kakheti) compared to the southern arc (Imereti, Samegrelo, Samtskhe‐Javakheti and Kvemo Kartli).5
Georgia’s rich natural resources do, to some extent, provide a food security buffer that many other countries may not be so fortunate to enjoy. The great variety of both wild and cultivated food resources, combined with a relatively small population provides a sort of safety net. For example, a report by CHF International determined that collecting wild herbs and berries alone can account for earnings ranging between $120 and $2,100 per season.6 Incidentally, many of these wild herb and berry resources are located in Georgia’s poorest, high‐mountain regions.
Notwithstanding its poor performance, agriculture remains the main source of income and food security for households. In 2007, subsistence agriculture accounted for 41% of income, mainly in the form of in‐kind own consumption. Lowest income households (lowest quintile) are highly dependent on social transfers and less so on farm income (farm produce sales plus the value of in‐kind own consumption). Highest income households (highest quintile) generate nearly 4/5 of their total income from farm production, salary, wage and self‐employment and a tenth from social transfers. The two middle quintiles generate 2/5 of their income from farm production and the rest from salary, wage and self‐employment incomes as well as social transfers.7
Analysis of agricultural productivity by region and social assistance statistics further bears‐out the important role that agricultural productivity has to play in poverty alleviation. While Samtskhe‐Javakheti
5 Georgia Poverty Assessment Report – Key facts and Findings. World Bank, November 2008. Doc 6, p20. 6 Herbs and Medicinal Plants. Sub‐sector Report/ CHF. Doc 14 7 Georgia Poverty Assessment Report – Key facts and Findings. World Bank, November 2008. Doc 6.
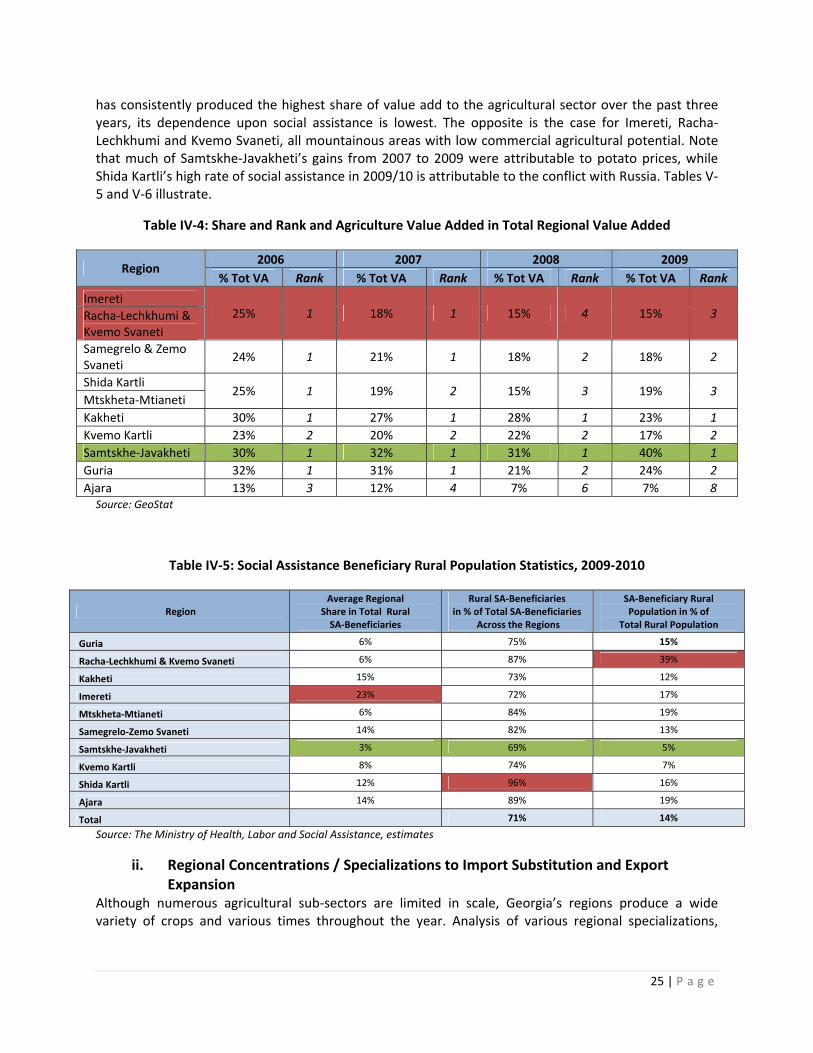
25 | P a g e
has consistently produced the highest share of value add to the agricultural sector over the past three years, its dependence upon social assistance is lowest. The opposite is the case for Imereti, Racha‐Lechkhumi and Kvemo Svaneti, all mountainous areas with low commercial agricultural potential. Note that much of Samtskhe‐Javakheti’s gains from 2007 to 2009 were attributable to potato prices, while Shida Kartli’s high rate of social assistance in 2009/10 is attributable to the conflict with Russia. Tables V‐5 and V‐6 illustrate.
Table IV‐4: Share and Rank and Agriculture Value Added in Total Regional Value Added
Region 2006 2007 2008 2009
% Tot VA Rank % Tot VA Rank % Tot VA Rank % Tot VA Rank
Imereti 25% 1 18% 1 15% 4 15% 3 Racha‐Lechkhumi &
Kvemo Svaneti
Samegrelo & Zemo Svaneti
24% 1 21% 1 18% 2 18% 2
Shida Kartli 25% 1 19% 2 15% 3 19% 3
Mtskheta‐Mtianeti
Kakheti 30% 1 27% 1 28% 1 23% 1
Kvemo Kartli 23% 2 20% 2 22% 2 17% 2
Samtskhe‐Javakheti 30% 1 32% 1 31% 1 40% 1
Guria 32% 1 31% 1 21% 2 24% 2
Ajara 13% 3 12% 4 7% 6 7% 8 Source: GeoStat
Table IV‐5: Social Assistance Beneficiary Rural Population Statistics, 2009‐2010
Region Average Regional
Share in Total Rural SA‐Beneficiaries
Rural SA‐Beneficiaries in % of Total SA‐Beneficiaries
Across the Regions
SA‐Beneficiary Rural Population in % of
Total Rural Population
Guria 6% 75% 15%
Racha‐Lechkhumi & Kvemo Svaneti 6% 87% 39%
Kakheti 15% 73% 12%
Imereti 23% 72% 17%
Mtskheta‐Mtianeti 6% 84% 19%
Samegrelo‐Zemo Svaneti 14% 82% 13%
Samtskhe‐Javakheti 3% 69% 5%
Kvemo Kartli 8% 74% 7%
Shida Kartli 12% 96% 16%
Ajara 14% 89% 19%
Total 71% 14%
Source: The Ministry of Health, Labor and Social Assistance, estimates
ii. Regional Concentrations / Specializations to Import Substitution and Export Expansion
Although numerous agricultural sub‐sectors are limited in scale, Georgia’s regions produce a wide variety of crops and various times throughout the year. Analysis of various regional specializations,
26 | P a g e
productivity rates and seasonality provide insight into potentials for import substitution and export expansion, two complementary prongs of the vision for agricultural development.
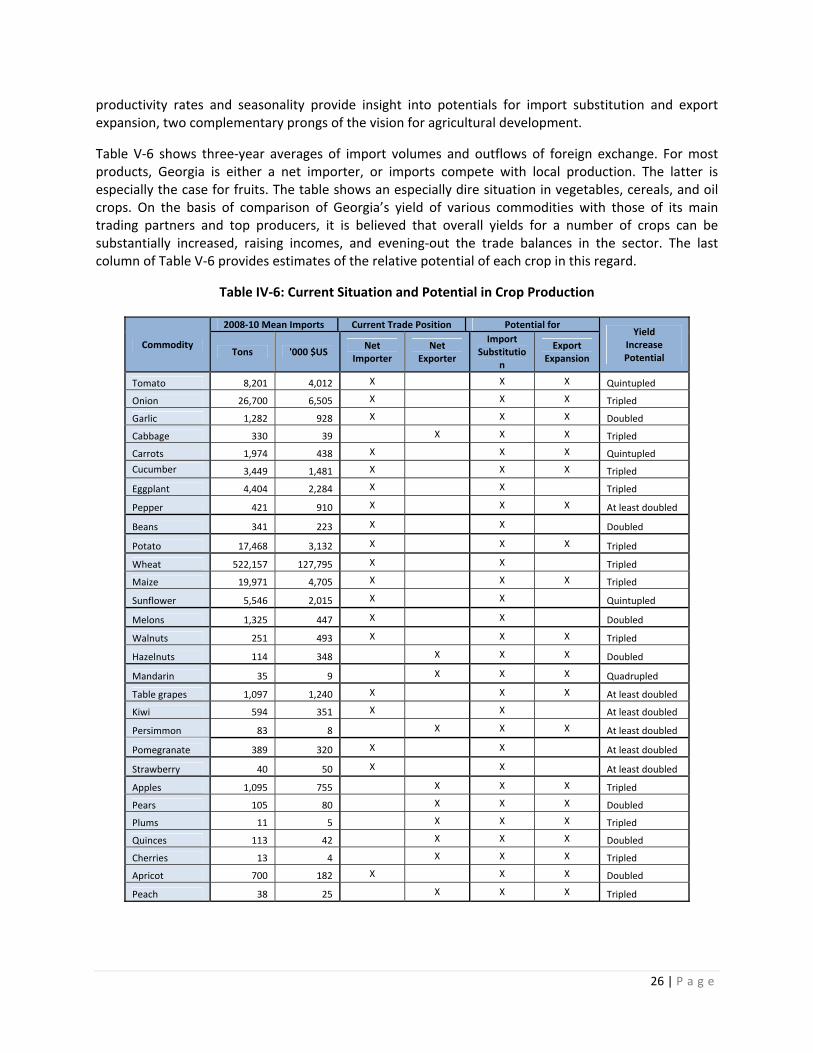
Table V‐6 shows three‐year averages of import volumes and outflows of foreign exchange. For most products, Georgia is either a net importer, or imports compete with local production. The latter is especially the case for fruits. The table shows an especially dire situation in vegetables, cereals, and oil crops. On the basis of comparison of Georgia’s yield of various commodities with those of its main trading partners and top producers, it is believed that overall yields for a number of crops can be substantially increased, raising incomes, and evening‐out the trade balances in the sector. The last column of Table V‐6 provides estimates of the relative potential of each crop in this regard.
Table IV‐6: Current Situation and Potential in Crop Production
Commodity
2008‐10 Mean Imports Current Trade Position Potential forYield
Increase Potential
Tons '000 $US Net
Importer Net
Exporter
Import Substitutio
n
Export Expansion
Tomato 8,201 4,012 X X X Quintupled
Onion 26,700 6,505 X X X Tripled
Garlic 1,282 928 X X X Doubled
Cabbage 330 39 X X X Tripled
Carrots 1,974 438 X X X Quintupled
Cucumber 3,449 1,481 X X X Tripled
Eggplant 4,404 2,284 X X Tripled
Pepper 421 910 X X X At least doubled
Beans 341 223 X X Doubled
Potato 17,468 3,132 X X X Tripled
Wheat 522,157 127,795 X X Tripled
Maize 19,971 4,705 X X X Tripled
Sunflower 5,546 2,015 X X Quintupled
Melons 1,325 447 X X Doubled
Walnuts 251 493 X X X Tripled
Hazelnuts 114 348 X X X Doubled
Mandarin 35 9 X X X Quadrupled
Table grapes 1,097 1,240 X X X At least doubled
Kiwi 594 351 X X At least doubled
Persimmon 83 8 X X X At least doubled
Pomegranate 389 320 X X At least doubled
Strawberry 40 50 X X At least doubled
Apples 1,095 755 X X X Tripled
Pears 105 80 X X X Doubled
Plums 11 5 X X X Tripled
Quinces 113 42 X X X Doubled
Cherries 13 4 X X X Tripled
Apricot 700 182 X X X Doubled
Peach 38 25 X X X Tripled
27 | P a g e
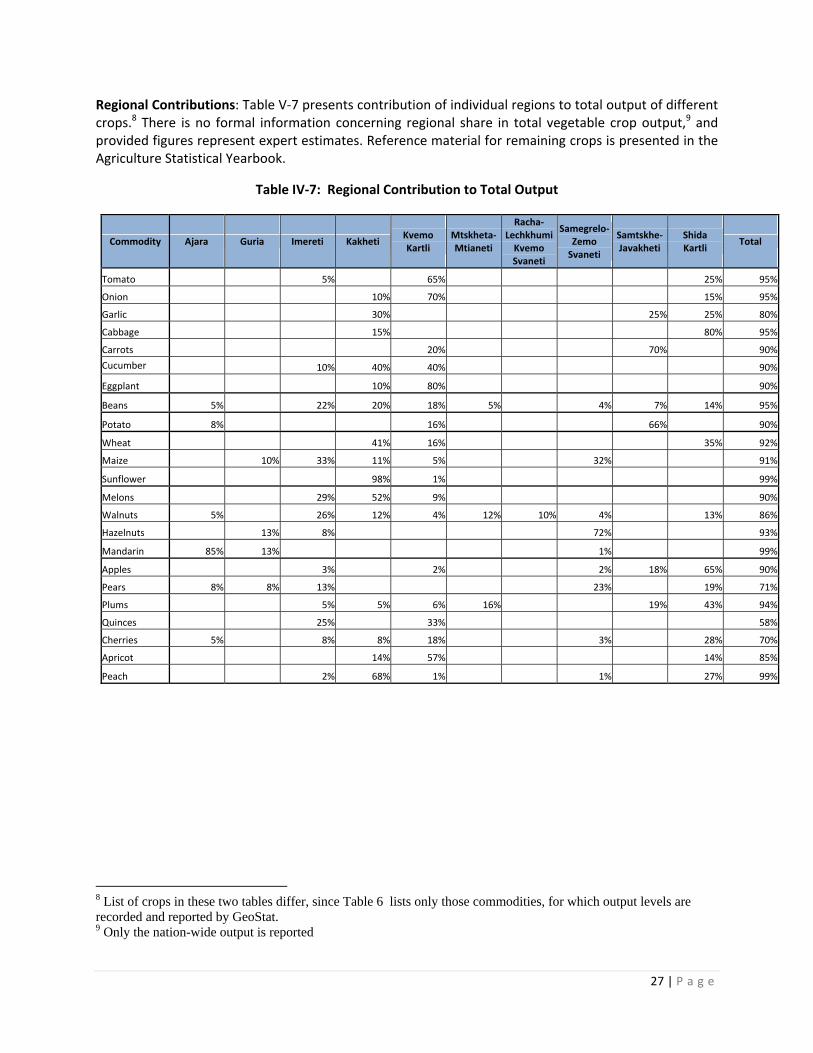
Regional Contributions: Table V‐7 presents contribution of individual regions to total output of different crops.8 There is no formal information concerning regional share in total vegetable crop output,9 and provided figures represent expert estimates. Reference material for remaining crops is presented in the Agriculture Statistical Yearbook.
Table IV‐7: Regional Contribution to Total Output
Commodity Ajara Guria Imereti Kakheti Kvemo Kartli
Mtskheta‐Mtianeti
Racha‐Lechkhumi Kvemo Svaneti
Samegrelo‐ Zemo Svaneti
Samtskhe‐Javakheti
Shida Kartli
Total
Tomato 5% 65% 25% 95%
Onion 10% 70% 15% 95%
Garlic 30% 25% 25% 80%
Cabbage 15% 80% 95%
Carrots 20% 70% 90%
Cucumber 10% 40% 40% 90%
Eggplant 10% 80% 90%
Beans 5% 22% 20% 18% 5% 4% 7% 14% 95%
Potato 8% 16% 66% 90%
Wheat 41% 16% 35% 92%
Maize 10% 33% 11% 5% 32% 91%
Sunflower 98% 1% 99%
Melons 29% 52% 9% 90%
Walnuts 5% 26% 12% 4% 12% 10% 4% 13% 86%
Hazelnuts 13% 8% 72% 93%
Mandarin 85% 13% 1% 99%
Apples 3% 2% 2% 18% 65% 90%
Pears 8% 8% 13% 23% 19% 71%
Plums 5% 5% 6% 16% 19% 43% 94%
Quinces 25% 33% 58%
Cherries 5% 8% 8% 18% 3% 28% 70%
Apricot 14% 57% 14% 85%
Peach 2% 68% 1% 1% 27% 99%
8 List of crops in these two tables differ, since Table 6 lists only those commodities, for which output levels are recorded and reported by GeoStat. 9 Only the nation-wide output is reported
28 | P a g e
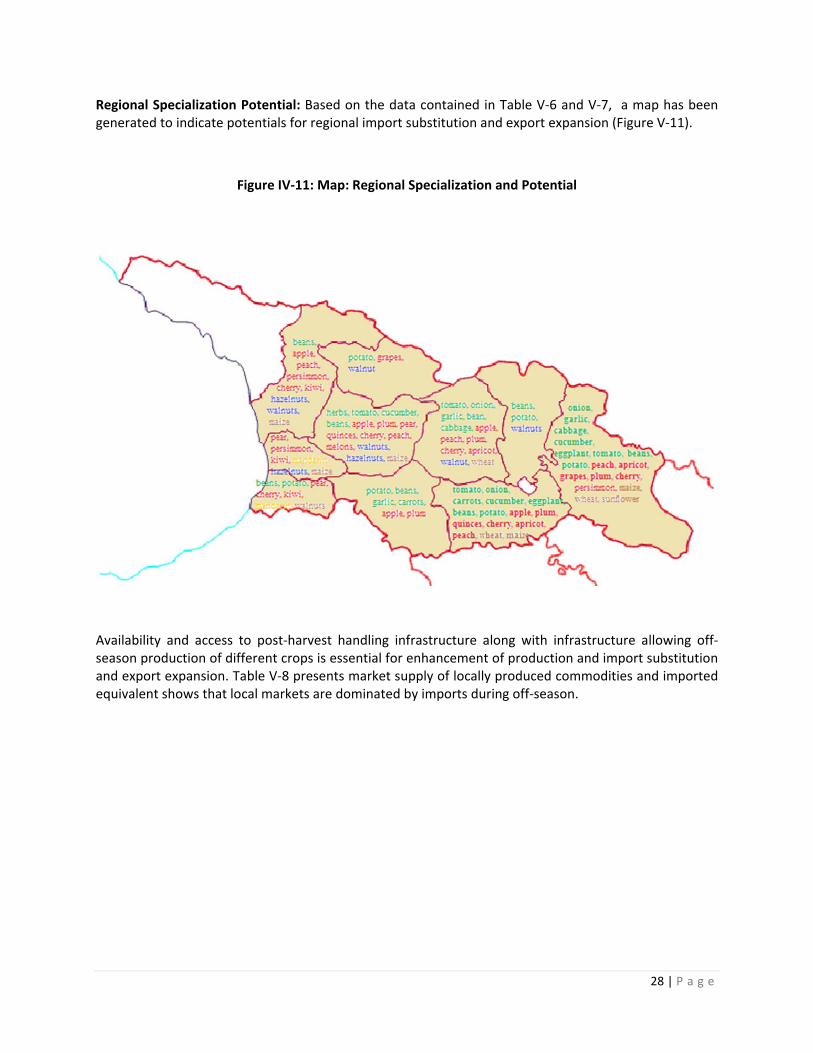
Regional Specialization Potential: Based on the data contained in Table V‐6 and V‐7, a map has been generated to indicate potentials for regional import substitution and export expansion (Figure V‐11).
Figure IV‐11: Map: Regional Specialization and Potential
Availability and access to post‐harvest handling infrastructure along with infrastructure allowing off‐season production of different crops is essential for enhancement of production and import substitution and export expansion. Table V‐8 presents market supply of locally produced commodities and imported equivalent shows that local markets are dominated by imports during off‐season.

29 | P a g e
Table IV‐8: Market Supply with Locally Produced Commodities and Imported Equivalent
Crop Origin Jan Feb Mar Apr May Jun Jul Aug Sep Oct Nov Dec
Tomato local
imported peak trough
Onion local
imported peak trough
Garlic local
imported peak trough
Cabbage local
imported peak trough
Carrots local
imported trough peak
Cucumber local
imported peak trough
Eggplant local
imported peak trough
Beans local
imported trough peak
Potato local
imported trough peak
Wheat local
imported trough peak
Maize local
imported peak trough
Sunflower local
imported peak trough
Melons local
imported trough peak
Apples local
imported trough peak
Pears local
imported
Plums local
imported
Quinces local
imported
Cherries local
imported
Apricot local
imported trough peak
Peach local
imported
For a more detailed commodity‐specific analysis, please refer to Annex 3 of this report.
30 | P a g e
iii. Entrepreneurship and Skills Low productivity of Georgia’s agrarian labor force is exacerbated by a low degree of entrepreneurship and skills development. With an aging rural population and little public investment in the sector, the situation has become discernibly more critical over the decade. Villages typically have a handful of semi‐commercial farmers that are reasonably knowledgeable on cultivation strategies and modern practices. Knowledge transfer and pooled resources such as tractor hire can take place on an informal basis, but is nonetheless limited overall. In the case of veterinary services, there is typically a handful of former state vets that are able to provide services or advice in exchange for cash or barter. There is virtually no extension system in Georgia and very limited formal educational opportunities for professional development in the agricultural sphere.
iv. Cooperation and Group‐based Enterprise Cooperative development is a well‐documented constraint in Georgia’s agricultural sector, and society overall. This is attributable to a number of factors, most notably the legacy of the former Soviet “kolkhoz” system. This phenomenon is exacerbated by other factors, including an adverse tax code and low levels of social capital. In an agricultural sector that his highly fragmented with a preponderance of subsistence farmers, the poor track record of cooperatives, associations, and other business groups is discouraging. Given the appropriate organization and investment resources, cooperatives could be an effective tool to enable to rural poor to achieve commercial success.
While the picture in relation to cooperative development in Georgia is indeed grim, it is not without examples of success. Dairy collection is most notable of these successes, with various initiatives taking place among smallholder producers. Informal cooperation is also widespread. This sort of cooperation is oftentimes found around some specific products, frequently taking place on the self‐initiative of rural communities, in the absence of any donor or state support.
Social capital: A high‐profile report by the Caucasus Research Resource Center (CRRC) entitled “Social Capital in Georgia: Final Report and Recommendations” identified a number of causes and impacts of low levels of social capital in Georgia, prominently including agricultural cooperatives in its investigations. A key distinction made by the report distinguished between Georgia’s high levels of “bonding capital” and low levels of “bridging capital.” A business cooperative fundamentally requires the latter. The report concludes that it will take time for an appropriate level of receptivity to cooperative enterprise will take hold, requiring exposure to examples of success, awareness‐building, and an overall long‐term generational shift.
Tax Code: A more immediate issue, constraining any number of would‐be cooperative ventures concerns a tax code that penalizes group initiatives. The issues here are two‐fold: First, property tax is not due for holdings below 5 ha. Second, individuals employed in agriculture are not taxable on earnings below 200,000 GEL per year. However, the law treats both individuals and group enterprises (including cooperatives) equally, with no additional income thresholds. This means that a ten member cooperative is accountable to the same 200,000 GEL limitation as would be an individual. Supply of primary production, if carried‐out by the producer, is exempt from VAT without any threshold. However, resale of primary production is subject to VAT, creating additional liabilities for producer groups. Without reform, this serves as a major disincentive to the formation of cooperatives or other group‐based initiatives.
31 | P a g e
D. Farm Typologies
Current farm typologies in Georgia are strongly linked to the redistribution of land after the break‐up of the Soviet Union. A discussion of the land distribution process that unfolded after the break‐up is set out in section VI‐C of this document. This discussion explains in greater detail the typology descriptions set forth, enabling analysis on the basis of these differing groups. It is understood that upon completion of the two stages of privatization, 1,090,942 hectares in total had been privatized. This transfer of land to the rural population has created farms of varying size and character, categorized into three typologies for which different strategies can be suggested. These include: Type 1 ‐ Subsistence; Type 2 – Semi Commercial; and, Type 3 ‐ Commercial. Each typology is discussed in the remainder of this section.
i. Subsistence Farms During the first land privatization, the largest number of families impacted received less than one hectare of land. In many cases, this land was divided into more than one plot – a plot that is normal arable land, a plot that has a perennial crop on it, and potentially an irrigated crop. In the Subsistence Farms typology there are reported to be 521,240 families that control 219,451 hectares of land, with an average size of .42 hectare. The result of this division of land renders it nearly impossible for these subsistence farmers to be commercially viable. They often consume or barter the food that they do produce, selling surpluses on local markets in good years. These farmers are typically unorganized, making it virtually impossible to achieve scale. Operating non‐commercially, these farmers represent the majority of the rural population, requiring different strategies from commercial farmers if they are to realize maximum gain from their small land holdings, and break‐out of poverty.
ii. Semi‐commercial Farms The first land privatization process also produced many households that were allocated 1‐5 hectares of land. Size of plots increasing, the second wave of privatization further produced many more such farms and households. These farmers generally received some arable land, in addition to hay and grazing land. In this typology there are reported to be 164,589 households that control 280,604 hectares of land, on average 1.7 hectares in size. While still relatively small, as the average of 1.7 hectares generally provides sufficient scale for self‐sufficiency. For these farmers, consistent income from farming is a possibility, assuming that they are equipped to with requisite knowledge and financial resources to make proper choices of crops (high value fruits, vegetables, herbs) and utilize efficient production practices. A pivotal group for growth of the sector, deliberate efforts are required for their engagement and expansion into commercial agricultural practices.
iii. Commercial Farms and Agribusiness During the first land privatization process very few households received more than five hectares of land. The second wave of privatization increased sizes dramatically, with plots rising substantially larger. Many of these farmers had been leasing the land, given first privatization rights, resulting in privatization of lands significantly larger than in the past. In this typology there are reported to be 17,303 households that control 590,887 hectares of land, averaging 34.1 hectares in size. The result of this division of land renders it possible for many of these larger landowners to be considered farmers – commercial farmers. Many of these farmers have sufficient land on which to make an adequate income, if the proper choice of crops is made, and represent an important base for expanding agricultural production. Many of these famers could produce a wide variety of agricultural products, employ a significant labor force, and realize an adequate income. Again, these farmers are in a class that requires specific strategies that are supportive to commercial agriculture, several of which will be defined in this report.
32 | P a g e
V. “THE PLAY” – STRATEGIC ANALYSIS AND RECOMMENDATIONS
A. Strategic Overview and Summary Recommendations
This section, “The Play,” reviews specific challenges and opportunities to promote overall development of the agricultural sector. It capitalizes on Georgia’s advantages and accommodates the constraints, much of which was presented and analyzed in the preceding “The Hand” section. It will identify and address actionable (non‐fixed) constraints, in:
Agricultural Finance
Knowledge and Training
Land
Agricultural Services
Marketing and Trade
Food Safety Overall, there are several promising conditions within the agricultural sector that can be capitalized upon:
Rapid and recent land consolidation, including 373,000 ha of commercial land privatized in the last 20 years. Given the proper incentives, Georgia is likely on the cusp of a major push toward commercial agriculture;
Reorientation of government policy and priorities to the agricultural sector for the first time in more than a decade, with particular emphasis on meeting food safety and phytosanitary requirements;
Increased financial sector activity and interest in the sector, with MFIs leading the way;
Farm Service Centers (FSC’s) and Farm Machinery Centers (MSC’s) established and providing a broad based service of making agricultural inputs and machinery services available to farmers of all size; as well as, offering a good asset base from which to launch more support (i.e., advisory services, demonstration plots, etc.) mechanisms to farmers;
An educational system that has experienced some change in recent years at the university and vocational technology levels and is becoming better geared to serving the needs of agriculture and agribusiness;
Silo elevator storage and flat dry goods storage has been expanded or recuperated in recent years offering improved support to the grain, oilseeds, and packaged goods businesses within the agricultural sector;
Cold storage facilities have been somewhat expanded in recent years and with improved experience in its management can offer substantial support to the perishable products (fruits, vegetables) sector of the food industry;
Good water availability to support a substantial irrigation system if properly refurbished; and
Increasing food price trends and overall demand for food on global markets attracting outside investment.
Despite this promise, the situation is tempered by a number of concerns:
Widespread fragmentation of land with a preponderance of small‐holders;
Embargo with Russia, a long‐time consumer of Georgia’s high‐value exports;
33 | P a g e
Weak food safety and phytosanitary standards compliance limiting short‐to‐medium term potential for robust EU trade;
Storage and infrastructure while recently improved still lacks sufficient locally located facilities needed to support many small and semi‐commercial farmers where they live;
Vocational educational schools still need substantial strengthening to be more widely available to support adult retraining programs and students from the local areas;
Irrigation systems still require substantial recuperation and regular maintenance if to provide the 25+% productivity impact possible for crops grown in the irrigation zones;
Management of cold storage facilities expressed a need for technical support in running facilities and in preparing product for proper storage to best serve farmer and their needs;
The market information available is very spotty, if at all, as the main focus of information comes via cell phone communication between players in the market;
A lack of focused attention on developing markets for Georgian export products in target countries of interest;
Shortage of capital flow into the sector, which includes direct investments, foreign and domestic and availability of credit recourses; and
Ad‐hoc policymaking. An effective strategy for the development of the agricultural sector will need to include the serious participation of a number of key actors in the sector, including GOG, private sector investors, rural residents, farmers, USAID and other donors supporting the sector. The assessment team recommends a strategy prioritized on the basis of the following themes: commercialization; an import substitution‐export oriented approach; regional specialization; integration of key interventions; improved market information; improved policy; strengthened research and extension; and capitalization on existing farm service centers (FSCs) as “nodes of development.” Each strategic theme is explained in further detail below: Strategic Theme 1 – Commercialization: Increased commercialization of the sector, achieved through sector support initiatives focused on promoting semi‐commercial and commercial farms and agribusinesses. There are a number of important indicators demonstrating that commercial development of Georgia’s agricultural sector has potentially greater potential to foster rapid, equitable growth and reduce poverty than any other. These opportunities need to be capitalized upon.
The viability of Georgia’s current subsistence farms is limited within the larger strategic framework for commercial development of the sector. This group primarily requires livelihood and smallholder‐oriented programming. Nonetheless, whether government or donor‐supported, poverty alleviation programming should be oriented upon, and in‐line with, a future commercial vision for the sector. This not only means small‐holder support for agricultural livelihood projects, but also a re‐tooling and reorientation of the workforce, able to respond to demands in other sectors or obtain work on larger farms and agribusinesses.
Strategic Theme 2 ‐ Prioritization of Sectors for Import Substitution and Export: Strategic prioritization of specific sectors, with care taken to balance import substitution with export opportunities; would include three basic thrusts: First, fruits and vegetables for domestic and export markets to eliminate substantial imports and expand significantly exports to off‐season markets in the EU, and north‐eastern European country markets. Second, grains and oilseeds as primarily import substitution crops to replace some wheat imports and some imports that may be going to feed animals. Thirdly, develop a livestock focus that will provide more meat for domestic and regional markets, particularly sheep for the Middle
34 | P a g e
East; dairy for local consumption of milk and dairy products as well as certain types of cheese that could be exported.
Strategic Theme 3 ‐ Regional Specialization of Productive Capacities: Increased regional specialization, building off of specific assets such as crop‐specific potentials, ports, transportation infrastructure, storage facilities, irrigation systems, workforce, and other factors will have the effect of focusing interventions, investing in areas with greatest potential for growth. The central corridor of the country offers the best potential for agriculture with the areas west of Tbilisi in irrigation zones offering the best potential for perishable fruit and vegetable crops to be exported. The eastern Kakheti valley region is appropriate for wine grapes (already a major crop in the region) and less perishable fruits able to stand the longer hauls to markets. In terms of grains, wheat is a viable crop for import substitution in the eastern areas of the country, especially Kakheti, Kvemo Kartli and Shida Kartli. Corn can be cultivated productively throughout western Georgia. And, finally the range areas common to the foothill regions from West to East, with concentration on the southern slopes would be devoted to the livestock activities, particularly cattle and sheep. All of these commodities and respective geographic areas have high productive potential, which should be utilized in focused fashion.
Strategic Theme 4 ‐ Integrated sector support strategies: The agricultural/agribusiness sector is an integrated business from producer to consumer and all stages of production, wholesale trading, storage, processing, distribution to markets and retailing. In addition, several functional areas support the system – finance, government policy, education and research institutions – to name a few. In Georgia today, many elements of the system are in place, but are weakly integrated/linked and do not provide the full support they could to the sector. The opportunity for doing this presently exists in Georgia. Two specific examples of the current state of weak market integration and associated development opportunities include:
Farmers work independently rather than together. A lack of consolidation of resources and fragmentation at the subsistence and semi‐commercial farming level constrains scale, limits productive efficiencies and integration with markets. Efforts at cooperative development education and tax reform are two long and short‐term interventions that could have great impact on improving the situation.
Storage and post‐harvest handling linkages. As more new grain storage facilities help to integrate grain farmers with elevators, it will be possible to introduce the concept of warehouse receipts to provide an additional means for financing the farmers production activity. Further, if fruit and vegetable farmers can be linked to the cold store network developing in the country and packing facilities it will go a long way toward helping the farmers and traders prepare fruit and vegetables to meet the standards of the export market.
Strategic Theme 5 ‐ Good market information: Market information is essential to good planning and plays a key role in enabling firms to respond to market signals. Market information acts as the glue that keeps producers linked to the markets and the participants between the farmer and the ultimate consumer. Without reliable information about markets, the decisions concerning what to plant may backfire and result in unprofitable operations for farmers. Also, if the groups that process agricultural products do not have good information they may over pay for raw materials. If farmers do not have the proper technical information they will make less than optimum decisions about how to grow their crops or livestock. Reliable, timely information not only helps farmers, it helps the government agencies that are responsible for the results of the environment in which agriculture and agribusiness operates.
35 | P a g e
Strategic Theme 6 ‐ Supportive agricultural policy: The environment in which farmers and agribusiness operate has a significant impact on success of the sector. The Georgian government is responsible for establishing a sound climate for agricultural investment and success of the sector overall. There is a fine balance between government investment and interference in the country, and establishing the right mix of incentives to drive forward investment. Getting this balance right will be a key challenge to the GOG going forward, one that will require ongoing support and assistance from donor agencies. The need for support is particularly evident in regards to irrigation policy, Georgian Agricultural Company (GAC) investments, and establishment of a state agricultural strategy on behalf of the Ministry of Agriculture, to name a few. Examples of policy choices exist that have had direct impact (negative and positive) on the agricultural sector and its performance; and, some include:
The policy decision made to break‐up former collective farms and distribute land to people in private ownership caused a major adjustment which takes farmers and agriculture many years to adjust to; and, even after 20 years land ownership issues still impact on the effective use of land. For more information related to land concerns see section V‐D.
The policy decision made to restructure the MOA has directly impacted agricultural education, research and extension; food safety support for the industry; and, veterinary services provided to the sector. Yes, some of the changes may well be necessary but, in the transitional period of adjusting to the change there will be direct impacts on farmers and the agricultural sectors performance. For more information related to education, research, extension, and food safety impacts see sections V‐C and V‐E‐iii, V‐G, respectively.
The policy decision made to support via the GAC machinery service centers, and storage facility development has had a positive impact on farmers and the agricultural sector it will be a significant budget item in the coming year as additional procurement of more agricultural implements is planned. For more insight into the impacts of the machinery service centers see section V‐E‐ii‐b.
Strategic Theme 7 ‐ Strong educational, research and, extension system: The backbone of any business is well‐educated workers, cutting edge research, and the application of that research to provide for a strong competitive industry. This is what Georgia needs as it moves ahead to gain the maximum contribution from its agricultural sector. Thus, it is necessary to support education related to agriculture and good practices from the early years to all levels of farmers. High schools need to encourage young people to look at agriculture as a positive business; vocational schools need to train young people in advanced agricultural practices as well as older farmers in the new technologies that should be employed; and the universities need to be turning out the leaders that operate at farm, agribusiness, and government level. The well‐trained workforce will carry out cutting edge research, and extend the research to farmers via a properly developed extension system with trained agents.
Strategic Theme 8 ‐ Utilize Farm Service Centers (FSCs) as Nodes of Assistance: FSCs have proven themselves to be highly effective in delivering a number of knowledge, financial, machinery, inputs and other services to farmers. Their expansion has been rapid, services are in‐demand, and viability as going‐concerns already proven in many respects. MFI’s, input suppliers, business service providers and donor‐funded projects have already successfully linked many of their services to FSCs, with impressive results. Success in this realm should be capitalized upon for future assistance efforts.
36 | P a g e
B. Agricultural Finance
Affordable finance for agricultural investments is in short supply in Georgia. The sector is dominated by MFIs. They provide high interest rates, small loan sizes, and low‐turnover clients. To date, Georgia’s banks have not seen strong opportunities for profit in the agricultural sector, and have made only limited overtures to the sector as a result. Prospects for a rapid scaling‐up of leasing activities are strong, with a new leasing law pending passage in the Parliament, a number of recent successes in agricultural mechanization programs, and significant unmet demand for leasing services. A wave of recent land privatization and entry of increasing numbers of commercial actors into the primary production sector introduce opportunities for scale, upon which the banks may capitalize, not before seen in Georgia.
At present there are a number of actionable constraints confronting agricultural sector finance:
High cost of GEL capital, meaning that larger preferred lending clients can best expect to achieve rates of approximately 15%, with MFIs offering rates are much higher (18‐24%);
Weak rural sector presence on the part of the banks due to risk, high operational costs, and knowledge‐related factors;
Weak incentives to invest in the rural sector;
Unclear government policies and commitment to the sector constraining long‐term capital investment;
Poor state of irrigation, drainage, on‐farm road infrastructure and other credit‐security mechanisms.
Lack of established alternative credit products, such as supplier credits and warehouse receipts.
The Challenge: In regards to financing Georgia’s agricultural sector relates to the promotion of larger credits and investments targeted to commercial and semi‐commercial farmers and agribusiness. MFIs have been highly responsive to demand, rolling‐out their products to a number of new, small agricultural clients. The assessment team expects this trend to continue, expand, and gradually become more affordable as increasing levels of capital become available. Larger lenders still need this push, becoming more familiar with and rolling‐out products for rural sector clients. We see potential for a major expansion of agriculture sector lending to be oriented on Georgia’s middle‐market, +typically amounting to average loan sizes between approximately $15,000 ‐ $500,000.
i. Micro‐finance There are more than 50 MFIs registered in Georgia, five or six of which can be characterized as proper MFIs. These are Credo, FINCA Georgia, Crystal, Lazika Capital, FInAgro. Constanta that was a biggest MFI was transferred into the Bank recently. MFI’s total portfolio more than doubled during the last 2 years and share of agro lending went up from 29% up to 48%. Total Agro portfolio is approximately USD 50 million. Major sectors of lending are: livestock, fruits and vegetables, dairy and agro production.
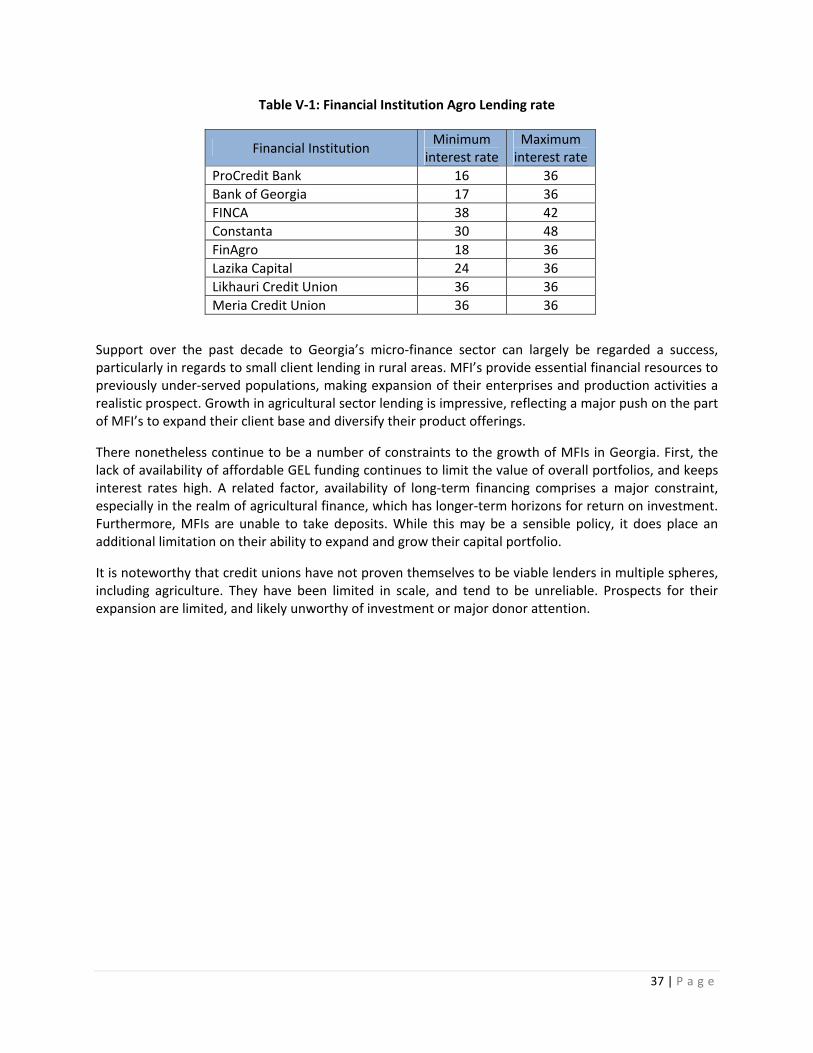
37 | P a g e
Table V‐1: Financial Institution Agro Lending rate
Financial Institution Minimum
interest rate Maximum interest rate
ProCredit Bank 16 36
Bank of Georgia 17 36
FINCA 38 42
Constanta 30 48
FinAgro 18 36
Lazika Capital 24 36
Likhauri Credit Union 36 36
Meria Credit Union 36 36
Support over the past decade to Georgia’s micro‐finance sector can largely be regarded a success, particularly in regards to small client lending in rural areas. MFI’s provide essential financial resources to previously under‐served populations, making expansion of their enterprises and production activities a realistic prospect. Growth in agricultural sector lending is impressive, reflecting a major push on the part of MFI’s to expand their client base and diversify their product offerings.
There nonetheless continue to be a number of constraints to the growth of MFIs in Georgia. First, the lack of availability of affordable GEL funding continues to limit the value of overall portfolios, and keeps interest rates high. A related factor, availability of long‐term financing comprises a major constraint, especially in the realm of agricultural finance, which has longer‐term horizons for return on investment. Furthermore, MFIs are unable to take deposits. While this may be a sensible policy, it does place an additional limitation on their ability to expand and grow their capital portfolio.
It is noteworthy that credit unions have not proven themselves to be viable lenders in multiple spheres, including agriculture. They have been limited in scale, and tend to be unreliable. Prospects for their expansion are limited, and likely unworthy of investment or major donor attention.
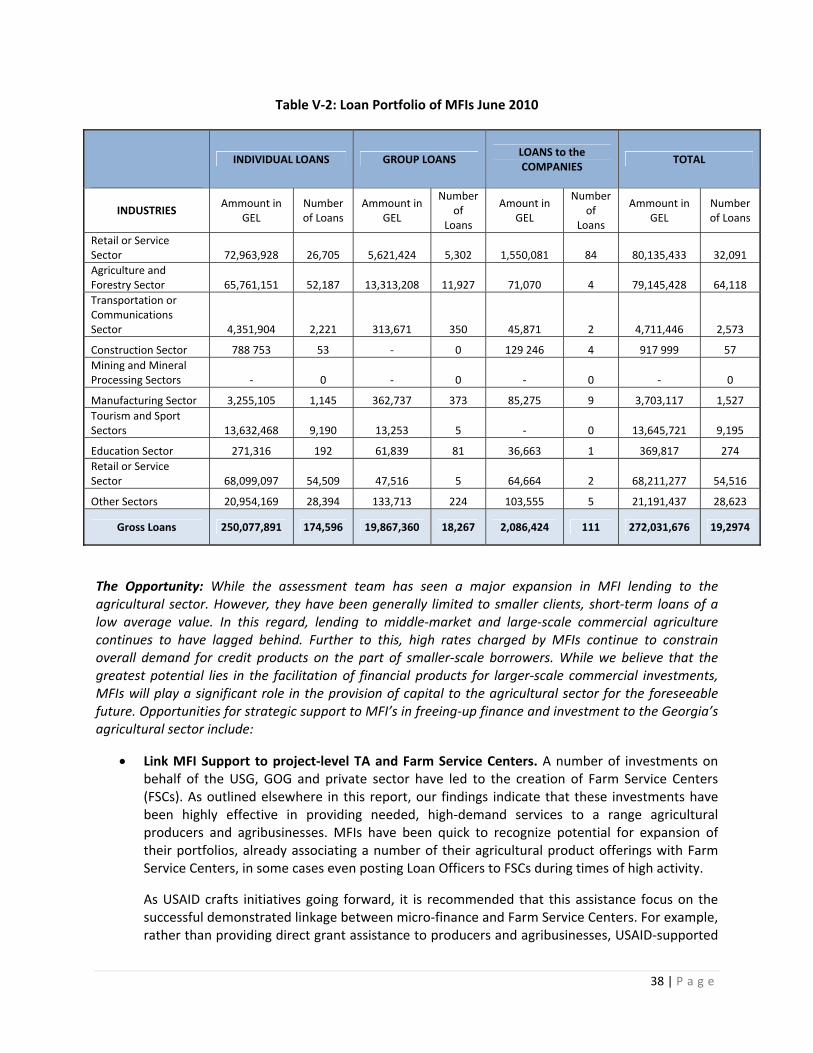
38 | P a g e
Table V‐2: Loan Portfolio of MFIs June 2010
INDIVIDUAL LOANS GROUP LOANS LOANS to the COMPANIES
TOTAL
INDUSTRIES Ammount in
GEL Number of Loans
Ammount in GEL
Number of
Loans
Amount in GEL
Number of
Loans
Ammount in GEL
Number of Loans
Retail or Service Sector 72,963,928 26,705 5,621,424 5,302 1,550,081 84 80,135,433 32,091
Agriculture and Forestry Sector 65,761,151 52,187 13,313,208 11,927 71,070 4 79,145,428 64,118
Transportation or Communications Sector 4,351,904 2,221 313,671 350 45,871 2 4,711,446 2,573
Construction Sector 788 753 53 ‐ 0 129 246 4 917 999 57
Mining and Mineral Processing Sectors ‐ 0 ‐ 0 ‐ 0 ‐ 0
Manufacturing Sector 3,255,105 1,145 362,737 373 85,275 9 3,703,117 1,527
Tourism and Sport Sectors 13,632,468 9,190 13,253 5 ‐ 0 13,645,721 9,195
Education Sector 271,316 192 61,839 81 36,663 1 369,817 274
Retail or Service Sector 68,099,097 54,509 47,516 5 64,664 2 68,211,277 54,516
Other Sectors 20,954,169 28,394 133,713 224 103,555 5 21,191,437 28,623
Gross Loans 250,077,891 174,596 19,867,360 18,267 2,086,424 111 272,031,676 19,2974
The Opportunity: While the assessment team has seen a major expansion in MFI lending to the agricultural sector. However, they have been generally limited to smaller clients, short‐term loans of a low average value. In this regard, lending to middle‐market and large‐scale commercial agriculture continues to have lagged behind. Further to this, high rates charged by MFIs continue to constrain overall demand for credit products on the part of smaller‐scale borrowers. While we believe that the greatest potential lies in the facilitation of financial products for larger‐scale commercial investments, MFIs will play a significant role in the provision of capital to the agricultural sector for the foreseeable future. Opportunities for strategic support to MFI’s in freeing‐up finance and investment to the Georgia’s agricultural sector include:
Link MFI Support to project‐level TA and Farm Service Centers. A number of investments on behalf of the USG, GOG and private sector have led to the creation of Farm Service Centers (FSCs). As outlined elsewhere in this report, our findings indicate that these investments have been highly effective in providing needed, high‐demand services to a range agricultural producers and agribusinesses. MFIs have been quick to recognize potential for expansion of their portfolios, already associating a number of their agricultural product offerings with Farm Service Centers, in some cases even posting Loan Officers to FSCs during times of high activity.
As USAID crafts initiatives going forward, it is recommended that this assistance focus on the successful demonstrated linkage between micro‐finance and Farm Service Centers. For example, rather than providing direct grant assistance to producers and agribusinesses, USAID‐supported
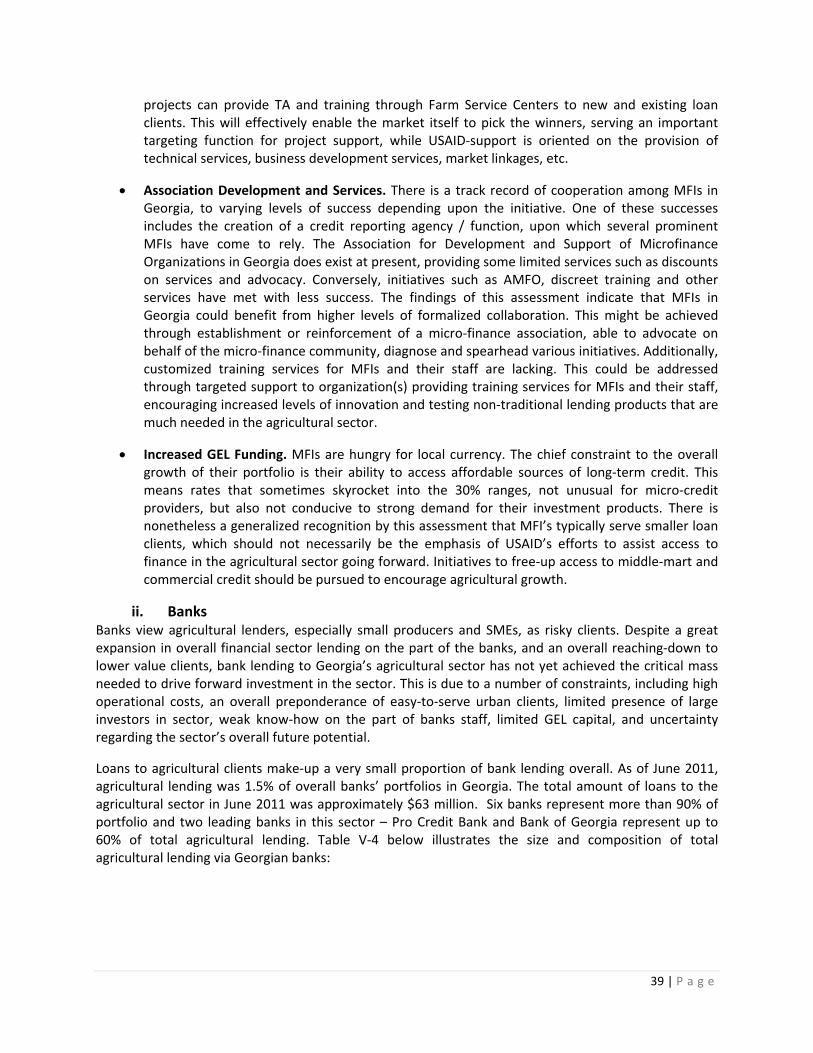
39 | P a g e
projects can provide TA and training through Farm Service Centers to new and existing loan clients. This will effectively enable the market itself to pick the winners, serving an important targeting function for project support, while USAID‐support is oriented on the provision of technical services, business development services, market linkages, etc.
Association Development and Services. There is a track record of cooperation among MFIs in Georgia, to varying levels of success depending upon the initiative. One of these successes includes the creation of a credit reporting agency / function, upon which several prominent MFIs have come to rely. The Association for Development and Support of Microfinance Organizations in Georgia does exist at present, providing some limited services such as discounts on services and advocacy. Conversely, initiatives such as AMFO, discreet training and other services have met with less success. The findings of this assessment indicate that MFIs in Georgia could benefit from higher levels of formalized collaboration. This might be achieved through establishment or reinforcement of a micro‐finance association, able to advocate on behalf of the micro‐finance community, diagnose and spearhead various initiatives. Additionally, customized training services for MFIs and their staff are lacking. This could be addressed through targeted support to organization(s) providing training services for MFIs and their staff, encouraging increased levels of innovation and testing non‐traditional lending products that are much needed in the agricultural sector.
Increased GEL Funding. MFIs are hungry for local currency. The chief constraint to the overall growth of their portfolio is their ability to access affordable sources of long‐term credit. This means rates that sometimes skyrocket into the 30% ranges, not unusual for micro‐credit providers, but also not conducive to strong demand for their investment products. There is nonetheless a generalized recognition by this assessment that MFI’s typically serve smaller loan clients, which should not necessarily be the emphasis of USAID’s efforts to assist access to finance in the agricultural sector going forward. Initiatives to free‐up access to middle‐mart and commercial credit should be pursued to encourage agricultural growth.
ii. Banks Banks view agricultural lenders, especially small producers and SMEs, as risky clients. Despite a great expansion in overall financial sector lending on the part of the banks, and an overall reaching‐down to lower value clients, bank lending to Georgia’s agricultural sector has not yet achieved the critical mass needed to drive forward investment in the sector. This is due to a number of constraints, including high operational costs, an overall preponderance of easy‐to‐serve urban clients, limited presence of large investors in sector, weak know‐how on the part of banks staff, limited GEL capital, and uncertainty regarding the sector’s overall future potential.
Loans to agricultural clients make‐up a very small proportion of bank lending overall. As of June 2011, agricultural lending was 1.5% of overall banks’ portfolios in Georgia. The total amount of loans to the agricultural sector in June 2011 was approximately $63 million. Six banks represent more than 90% of portfolio and two leading banks in this sector – Pro Credit Bank and Bank of Georgia represent up to 60% of total agricultural lending. Table V‐4 below illustrates the size and composition of total agricultural lending via Georgian banks:
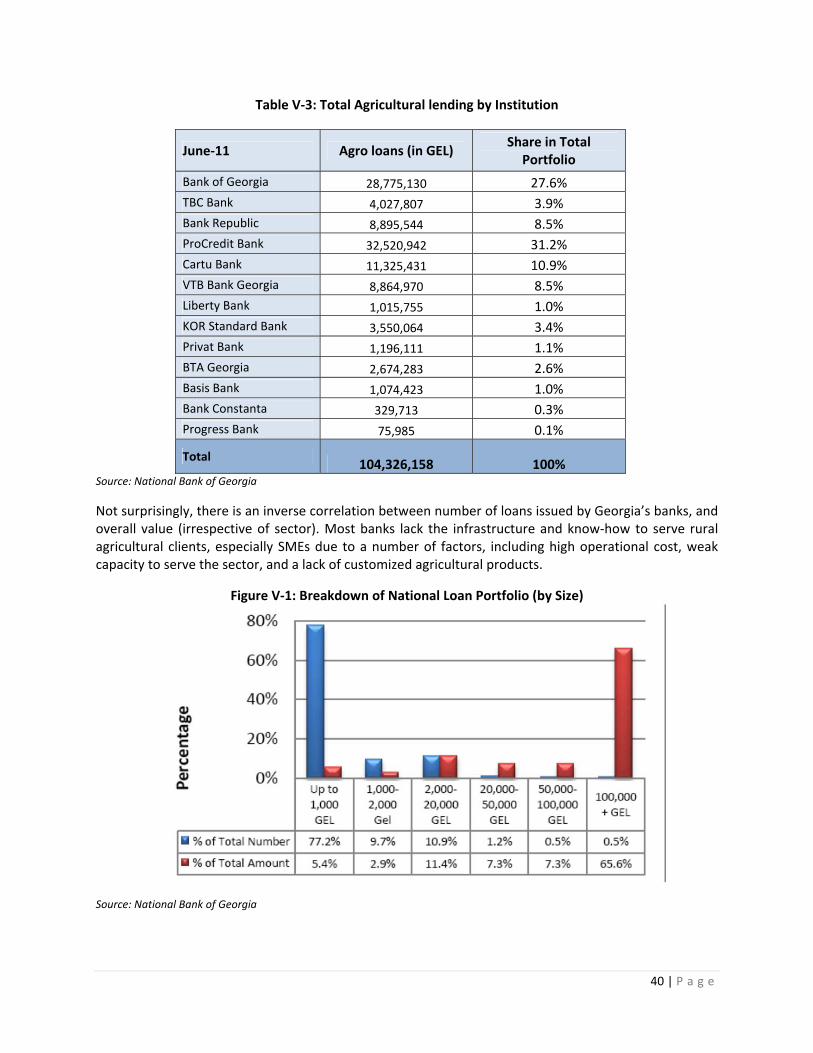
40 | P a g e
Table V‐3: Total Agricultural lending by Institution
June‐11 Agro loans (in GEL) Share in Total
Portfolio
Bank of Georgia 28,775,130 27.6%
TBC Bank 4,027,807 3.9%
Bank Republic 8,895,544 8.5%
ProCredit Bank 32,520,942 31.2%
Cartu Bank 11,325,431 10.9%
VTB Bank Georgia 8,864,970 8.5%
Liberty Bank 1,015,755 1.0%
KOR Standard Bank 3,550,064 3.4%
Privat Bank 1,196,111 1.1%
BTA Georgia 2,674,283 2.6%
Basis Bank 1,074,423 1.0%
Bank Constanta 329,713 0.3%
Progress Bank 75,985 0.1%
Total 104,326,158 100%
Source: National Bank of Georgia
Not surprisingly, there is an inverse correlation between number of loans issued by Georgia’s banks, and overall value (irrespective of sector). Most banks lack the infrastructure and know‐how to serve rural agricultural clients, especially SMEs due to a number of factors, including high operational cost, weak capacity to serve the sector, and a lack of customized agricultural products.
Figure V‐1: Breakdown of National Loan Portfolio (by Size)
Source: National Bank of Georgia
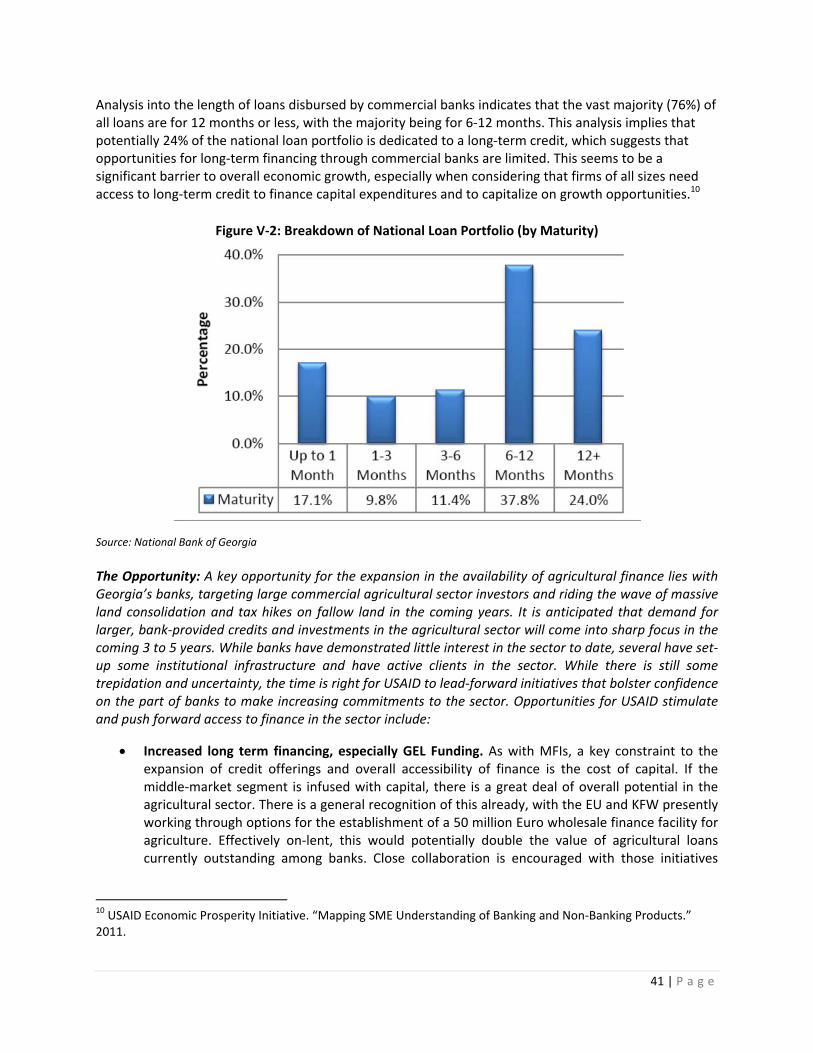
41 | P a g e
Analysis into the length of loans disbursed by commercial banks indicates that the vast majority (76%) of all loans are for 12 months or less, with the majority being for 6‐12 months. This analysis implies that potentially 24% of the national loan portfolio is dedicated to a long‐term credit, which suggests that opportunities for long‐term financing through commercial banks are limited. This seems to be a significant barrier to overall economic growth, especially when considering that firms of all sizes need access to long‐term credit to finance capital expenditures and to capitalize on growth opportunities.10
Figure V‐2: Breakdown of National Loan Portfolio (by Maturity)
Source: National Bank of Georgia
The Opportunity: A key opportunity for the expansion in the availability of agricultural finance lies with Georgia’s banks, targeting large commercial agricultural sector investors and riding the wave of massive land consolidation and tax hikes on fallow land in the coming years. It is anticipated that demand for larger, bank‐provided credits and investments in the agricultural sector will come into sharp focus in the coming 3 to 5 years. While banks have demonstrated little interest in the sector to date, several have set‐up some institutional infrastructure and have active clients in the sector. While there is still some trepidation and uncertainty, the time is right for USAID to lead‐forward initiatives that bolster confidence on the part of banks to make increasing commitments to the sector. Opportunities for USAID stimulate and push forward access to finance in the sector include:
Increased long term financing, especially GEL Funding. As with MFIs, a key constraint to the expansion of credit offerings and overall accessibility of finance is the cost of capital. If the middle‐market segment is infused with capital, there is a great deal of overall potential in the agricultural sector. There is a general recognition of this already, with the EU and KFW presently working through options for the establishment of a 50 million Euro wholesale finance facility for agriculture. Effectively on‐lent, this would potentially double the value of agricultural loans currently outstanding among banks. Close collaboration is encouraged with those initiatives
10 USAID Economic Prosperity Initiative. “Mapping SME Understanding of Banking and Non‐Banking Products.” 2011.
42 | P a g e
being undertaken by other donors, GOG, and potential initiatives to complement / augment this support.
Review of the GDA experience and leveraging potential. So far, USAID’s initiatives to stimulate bank credit to the agricultural sector via the Development Credit Authority (DCA) mechanism has met with limited success. While this may have been an isolated case, the question of why this has not proven to be as effective a mechanism as expected is an important one. Given a motivated bank partner, there may be an opportunity to stimulate a re‐orientation of bank lending portfolios to agricultural clients. Establishment of any such fund should involve extensive consultations with donor partners and GOG, the latter of which has already expressed an interest and tentative plans to establish such a fund to mobilize investments in the sector.
Introduction of non‐traditional agricultural lending products. There is general familiarity within the leadership of Georgian banks of non‐traditional lending products, including factoring and purchase order finance. A recent EPI report11 found that several Georgian banks do offer purchase‐order finance to their best clients, although there is a general lack of awareness (and demand) among the mainstream of clients. Factoring services are virtually non‐existent, piloted and discontinued in 2007 by TBC, just rolled‐out for SMEs by BOG in 2011, and potentially being introduced by ProCredit. While banks clearly see potential in these products, they have not yet been proven. Warehouse receipts products have not yet been undertaken in Georgia by traditional financial institutions. Support interventions in this area should be linked to initiatives bolstering storage infrastructure and enabling legislation.
Technical assistance in loan product development and training. Know‐how in agricultural lending is limited among banks, deserving of deliberate investments marrying opportunities to leverage capital with capacity‐based interventions. Numerous capacity‐building initiatives are required, including training in loan product development, operations, portfolio analysis, etc.
Mobilizing savings. Savings Georgia’s rates of savings are low, especially in comparison to other countries of comparable income and growth rates. This has a number of detrimental effects for the agricultural economy, increasing dependence on foreign investors and boosting current account deficits. According to the World Bank, there is a positive relationship between domestic savings, investment and growth. Georgia’s low rate of savings and increasing dependence on foreign savings increases the risk of capital reversal.
iii. Private Investment Regardless of whether foreign or domestic, there is presently limited private equity or venture capital investment in Georgia’s agricultural sector. The concept is unfamiliar, and investments are perceived to be risky. There have nonetheless been some recent agricultural land acquisitions on the part of foreign investors that have garnered outsized media attention, and some limited foreign investments in wine, dairy, hazelnut and other sectors. The Georgia Rural Development Fund (GRDF) established a fund with MCC support for private equity investments in the agricultural and tourism sectors. The success of these agricultural investments has been limited to date. As well, the Alliance Group’s Agro Capital program makes equity investments in the agricultural sector of up to $50,000.
11 USAID Economic Prosperity Initiative. “Banking Financial Products”. 2011.
43 | P a g e
The Opportunity: As consolidation and commercial investment in Georgia’s agricultural sector takes hold, USAID assistance can increasingly focus on catalyzing large‐scale investments of non‐traditional investors leveraging private equity and other investment mechanisms. Opportunities may include:
Enabling private equity policy and legislation. Moving forward, it will be important for government and donor programming to take steps to enable private equity investment in Georgia’s agricultural sector. A policy framework that promotes and protects these interests is an important step in this direction, and something that donors can work to support.
Supply chain investment and credits. Investors in Georgia’s agriculture sector frequently complain of unreliable quantity and quality of production, creating variables palatable only to those with the highest appetites for risk. One smallholder‐friendly strategy is supply chain investment, including supplier credit, technical assistance on quality standards, consignment sales, etc. Given Georgia’s presently fragmented agricultural landscape and high‐cost of quality inputs for many smallholders, this is a critical strategy for achieving scale. Georgia has seen a number of successes in this area, particularly in dairy and non‐timber forest products.
Consistent treatment of investors. Not necessarily unique to the agricultural sector, there is a generalized aversion throughout Georgia to undertaking major investments, despite the presence of capital and an agricultural sector primed with opportunities. In many cases, this derives from a sometimes‐inconsistent enabling environment for large investors, especially Georgian‐owned and operated ones. Numerous Georgian investors seek‐out international management partners or financiers as a result of this, limiting overall opportunities. USAID can undertake a number of advocacy, legal reform and informational initiatives to help mitigate this occurrence, which has become much more prominent in recent years than anticipated.
Investment promotion initiatives linked to market information systems. An effectively functioning and sustainable market information system reinforces overall investment promotion initiatives, providing the overall glue for a number of market actors, regardless of function. As outlined below, the Georgian agricultural sector is presently constrained by the lack of a functioning market information system, which could make great strides in facilitating overall investment in the sector.
iv. Leasing and Agro‐Insurance The topics of leasing and Agro‐Insurance are covered in detail in the counterpart to this report, entitled “Analytical Foundations Assessment – Financial Sector”. Please reference that report for detailed analysis and recommendations.
C. Knowledge and Training
i. Technical Research and Education / Training Education and research support to agriculture is extremely weak in Georgia at this time. The education system consists of essentially of three types or levels of educational institutions for agricultural and rural youth ‐ secondary (high) schools, vocational education & training schools (VET); and, university education (see Figure V‐4). Most are not effectively funded, staffed, equipped, or oriented to meet the needs of Georgia’s current free market food and agriculture sector.
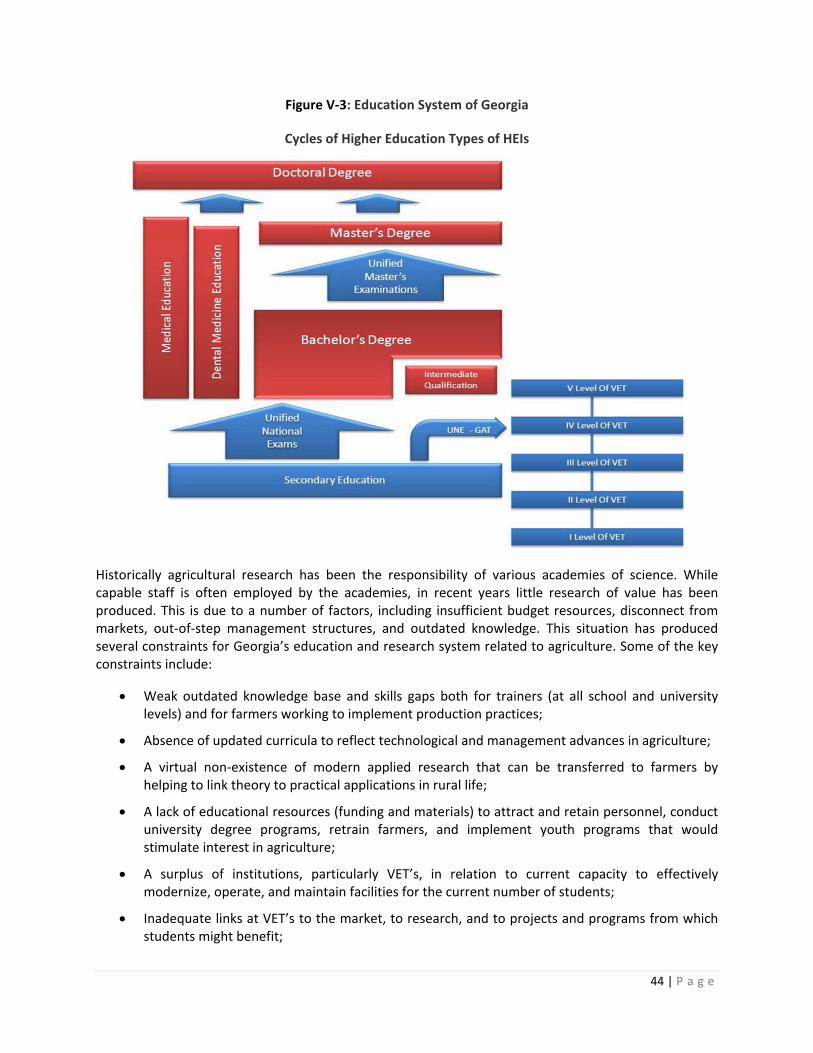
44 | P a g e
Figure V‐3: Education System of Georgia
Cycles of Higher Education Types of HEIs
Historically agricultural research has been the responsibility of various academies of science. While capable staff is often employed by the academies, in recent years little research of value has been produced. This is due to a number of factors, including insufficient budget resources, disconnect from markets, out‐of‐step management structures, and outdated knowledge. This situation has produced several constraints for Georgia’s education and research system related to agriculture. Some of the key constraints include:
Weak outdated knowledge base and skills gaps both for trainers (at all school and university levels) and for farmers working to implement production practices;
Absence of updated curricula to reflect technological and management advances in agriculture;
A virtual non‐existence of modern applied research that can be transferred to farmers by helping to link theory to practical applications in rural life;
A lack of educational resources (funding and materials) to attract and retain personnel, conduct university degree programs, retrain farmers, and implement youth programs that would stimulate interest in agriculture;
A surplus of institutions, particularly VET’s, in relation to current capacity to effectively modernize, operate, and maintain facilities for the current number of students;
Inadequate links at VET’s to the market, to research, and to projects and programs from which students might benefit;
45 | P a g e
At University level there is an absence of effective integration of teaching, education, and research (and eventually extension) activities;
A lack of an appropriate stakeholder driven system for setting educational priorities at the university level;
Too few students (less than 5%) at present are from rural areas, or have an interest in an education or career in agriculture; and
A limited opportunity for university level graduates to gain foreign training and educational opportunities.
The Challenge: Education in Georgia’s agricultural sector centers around the engagement of youth, generating interest in the sector and pushing forward innovation. To help realize this, strengthening the existing educational system of agricultural training at the university level is necessary to developing the country’s agricultural and agribusiness leadership; at the vocational level to provide young people with the practical tools needed to execute production, processing and, marketing at internationally competitive levels; and, to adults that are farming, retraining is required to bring their knowledge to levels that will ensure semi‐commercial and commercial farmers are utilizing viable technologies and practices.
A key challenge at the research level is ensuring those stakeholders’ – subsistence, semi‐commercial and, commercial farmers ‐ voices are being heard when agricultural research activities are being planned for implementation. The activities need to be those that will impact directly on the farmer’s ability to do his/her job of producing at the highest levels of productivity profitably. The research for agriculture and agribusiness support of immediate and near‐term future needs must focus primarily on technology transfer and market development, not basic research. Presently, via the scientific academies, some research is being carried out, but not with sufficient focus on what is best for the farmers’ immediate or near‐term need.
A discussion regarding the situation with respect to agricultural education and research is set out in the sub‐sections that follow.
(a) Agricultural Education
Recent Past Developments. In 2005 there were significant efforts being made towards reform of the Georgian educational system, achieving more focus overall than research or extension. Reforms were oriented on structural change, consolidation, and decentralization. It was found that in addition to the reorganizations and consolidations that had begun at the university and VETs, two positive steps were taking place at the secondary level. First, as part of decentralization, 25% of curricula were to be determined locally. Second, there was an initiative underway to provide computers and link every secondary school to the internet. These actions along with others were hoped to provide for an effective agricultural education system within the coming decade. Also, at the time a collaborative relationship was established between the State Agrarian University and the German Federal Agency of Environmental Protection. In addition to this relationship with Germany, the State Agrarian University developed relationships with the University of Maryland, Gissen University, Dresden Technical University, and Vienna Agrarian University to help develop faculty, publications, and programs. Finally help was being provided by the University of Georgia for curriculum development at
46 | P a g e
the secondary school level. Additionally, the World Bank provided assistance through the ARET (Agriculture, Research, Education, and Training) program. Further, in 2005 it was suggested that the VET’s may well be able to function as an important part of the agricultural education system. The reason being they could provide a pivotal centerpiece for not only the various levels of agricultural education, but also for combining research and extension with education at a single location. Since these schools are (or can be) distributed throughout major production regions of the country, they offer an excellent opportunity to provide a single location at which to conduct research, education, training, and demonstration without this being too concentrated and inaccessible.
Current Situation. Since 2005 the Georgian Agricultural University, with main facility in Tbilisi and its branch agricultural faculty in Kutaisi was purchased by a private investor, and merged them into a larger business school. Many professionals in the agriculture sector believe that this to be a positive development, with substantial improvements on the horizon. For the time being, facilities are under renovation and new curricula are being developed. This university has under its umbrella fourteen associate regional scientific institutes where field demonstration plots can operate throughout the country. Some of these institutes are quite large, including Tserovani and Anaseuli, with some having processing and lab facilities for support of agriculture and training.
Based on interviews, it seems the current demand for Agricultural education in the country is extremely low. Few students are coming to the faculties. For example, in the case of the Agro‐engineering program, that includes three specializations ‐ electrification, mechanization and irrigation – there were openings for 120 students but, only thirteen applied. Veterinary programming had similar rates of interest in last year’s enrollment. Likewise, in the case of the Forestry program there were 60 openings, with only nine applications were received programs.
The situation in relation to VETs has also advanced since 2005. Prior to Georgia’s independence from the Soviet Union, there were some 150 VET Centers nationwide. This number has now been reduced to 39, with the property of the remaining number having been privatized. Of the 39 VET Centers, about twenty are active. Approximately 10‐15 have been renovated and equipped from public funds. The Kachreti VET is regarded as the strongest school in the national system. Interviews and field visits confirmed progress and a strong outlook on the part of this particular VET, though the same cannot be said for the majority of others in Georgia.
Another development that has helped with training of farmers includes the Farm Service Centers and Machinery Service Centers financed, in‐part, by USG and GOG via the Georgian Agricultural Corporation (GAC). These centers have been developed to provide farmers with inputs (fertilizers, pesticides, herbicides, veterinary supplies, etc.) and, services (plowing, planting, cultivation and, harvesting) for agriculture. Through these centers they provide famers advice with respect to improving production practices and this does help to bring some new knowledge and skills to farmers.
(b) Agricultural Research
Historically agricultural research in Georgia has been the responsibility of several academies of science. There are fourteen such scientific institutes in the rural/agricultural sector, with only two or three operating reasonably well at present. These institutions derive their resources from the National Science Fund for different programs. The remainder of these institutes are very weak, have very few staff and, nearly no funds for operation. This has created a situation where there is a virtual non‐existence of
47 | P a g e
modern applied research. This, of course, places severe strain on farmers’ ability to solve the most pressing problems and access resources.
Under the reformed approach, the GOG has taken to carry‐out agricultural research, the number of academies will be reduced/combined or closed, and all have been placed under the Ministry of Education and Science. In addition, a totally new approach for funding and conducting research has been introduced. Through an open bidding process, the academies, the private sector, NGOs, other government entities, and other educational and research institutions, both domestic and foreign, would be able to submit proposals for consideration and possible selection. Thus, government‐funded agricultural research is no longer the exclusive purview of specific government agency. It is understood that the Ministry of Education is implementing this bidding program via the Shota Rustaveli National Science Fund.
While there are merits to the adopted approach, there are also considerable potential downsides and complexities that may emerge, including:
The manner in which priorities will be set and programs and projects determined;
How research will be supervised to ensure its integrity;
How the academies will effectively compete without land;
What happens when certain types of research do not lend themselves to this approach;
How activities and results will be shared between competing research groups, the agriculture education and, extension systems, as well as the food and agricultural private sector;
Whether the necessary or desirable critical mass, scale, and synergies can be achieved with more fragmented research approaches;
How to adjust governmental research capacity and how institutional capacity and memory is to be maintained if research projects shift between different successful bidding institutions every time a project is let.
While all these issues (and others) can be worked through, they have the potential of creating problems that will be difficult to manage. One of the more significant concerns is that even with this new system, those who will be conducting the research will, by default, be the ones establishing what research is undertaken and perhaps with little consideration concerning the needs of stakeholders, the Ministry of Agriculture, or others whose livelihoods and work depends on this research. As is the case with education, however, several steps need to be taken to help ensure that national research for agriculture supports the current and future needs of the sector by focusing primarily on technology transfer, not basic research.
The Opportunity: While there have been several changes in the educational system at the university, VET, and local high school levels, it is still behind where it needs to be if agriculture and agribusiness requirements for trained people are to be met. Further to this, is the fact that many young people do not view agriculture as a good future work path and farmers do not yet understand the benefits that working together as a group. Likewise, the academies of science are weak, under‐funded and not proactive. Opportunities for strategic support include:
Advocacy for public investment in agricultural education, research and extension. The effort here would involve intensifying efforts to identify ways that can be followed in strengthening
48 | P a g e
the universities, VET’s and high school programs. It would involve reviewing curricula, assessing staff training, and the development of degree or certificate granting programs. Platforms can be developed to establish linkage programs with a US land grant university for providing professorial help in Georgia and for training Georgians at the master’s and doctorate levels. As the agricultural sector begins to revive during the next few years, this would be a modest program to help the university meet education and research needs.
Ramping‐up support to FSC’s and MSC’s as training centers. Further association of these centers as “nodes of assistance” with knowledge‐based services and extension would be beneficial. Also, the extension agents associated with the centers should be pro‐active in developing with community leaders demonstration plots where farmers can see the benefits of selected new technological production practices. This is suggested as a pilot program in areas near to VET’s, FSC’s and/or MSC’s to determine the level of need and the potential impact such a program can have. It would be a modest financial commitment.
Expand and continuing the strengthening of the VET’s. To ensure that they have the facilities and materials necessary to provide a pivotal centerpiece for not only practical agricultural education, group dynamics for farmers, but also for combining research and extension – advisory services and demonstration plots ‐ with education at a single location in several regions around the country. Also, VET’s can develop appropriate and convenient continuing education opportunities for people currently engaged in the sector who require retraining ‐ producers, government employees, farmers and agribusiness. This program could be undertaken as a pilot on its own or be combined with the program suggested previously for FSC’s and MSC’s. As a pilot program it would not be a large financial commitment but, it would help determine the benefits of such a program.
Explore and implement, as appropriate, youth farmer organizations or student organizations. These kinds of activities would focus on the need to make youth aware of the opportunities that the agricultural sector can offer them as they grow and consider future careers. Such programs at the high school level for students might be 4H or Future Farmers of Georgia. Again, because such programs do not exist today it is hard to know what the demand will be; thus, on a pilot basis with a few appropriate high schools the concept could be tried to determine the interest and the potential benefits before trying to roll out the concept.
Ensure that the MOA has the capability to manage an effective agricultural research program. That is, the research program can be one that contracts out research to various institutions but, the MOA needs to be able to monitor and control the kinds of work being done by various institutions. The MOA needs to establish a mechanism for gathering information from stakeholders so that their practical needs are well understood and incorporated into research programs. Then an appropriate system for developing RFP’s and reviewing proposals should be developed within the MOA. Further within the MOA there will be a need for an effective process for insuring publicly funded research, both that undertaken by government and that contracted, is appropriately carried out and information shared between research entities that compete for work. Finally, ensure that those engaged in research, whether government or private sector, coordinate with and assist those involved in food and agricultural education and extension to effectively transfer the knowledge. It was suggested by leaders interviewed that the GOG was thinking of implementing a contract type research program; and, if so this program is mainly
49 | P a g e
suggested in an effort to ensure that the MOA under take it with a good monitoring system in place so as to library research results for use by agricultural implementers.
Presently, the demand for education and research is considered weak for several key reasons:
In the last several years, agriculture and agribusiness have gone through a tremendous transition. From large acreage in former collective farms to many small subsistence or semi‐commercial farms. Which caused agriculture to be less attractive as a career and parents stopped encouraging it as a career path to their youth.
The GOG has been breaking down the institutions (universities, VETs, scientific academies, MOA, veterinary services, etc.) that once supported the agricultural and agribusiness sector and, has not replaced them yet. This causes farmers and their youth to believe that if the GOG does not support the sector why should they.
The sector has had weak profitability.
With many small subsistence and semi‐commercial farms agricultural productivity, and consequent incomes, have been extremely low discouraging people from wanting their youth involved in the business.
Finally, until recently the GOG has not provided strong support (financial or otherwise) to the sector and, with many of the support institutions gone, the interest of people working in the sector has waned providing an additional reason for a low demand of education and research in the field. Government support is essential to the support for education and research in the agricultural sector.
Just in the last two years, signs exist to suggest the GOG has changed its direction and are more interested in giving support to the agriculture/agribusiness sector. The GOG has established the Georgian Agricultural Corporation (GAC), providing a number of needed agriculture services. The general impression among stakeholders is that GOG is seeing agriculture as a viable sector in the Georgian economy and as one that can help to increase GDP. Recently the GOG replace the Minister of Agriculture with the former Governor of Samegrelo region. All this, and a number of other overarching policy changes in hopes of providing greater revitalization to the sector indicate renewed interest and support on the part of the government. These activities demonstrate a strong commitment by the GOG to the agricultural/agribusiness sector is fundamental to increasing demand for agricultural education and research.
Assuming that this additional attention and support continues, more financial support will begin to flow into agricultural education and research. Increased or improved integration by farmers into markets and in the use of modern technologies should increase the demand for educational and research services. The additional GOG support does not suggest massive changes but, it does suggest that some increase in demand for agricultural education and research will occur. Anecdotal evidence from farmers further backed the demand for educational services:
A rural farmer asked for help to improve their skills in onion and beet production as there is an increased demand for these crops. The farmer was not able to find advice locally.
A more experienced farmer, planted 14ha of tomatoes after learning that a Gori based canning factory was looking to purchase tomatoes. He invested about $100,000 to use modern
50 | P a g e
technology – drip irrigation, integrated pest management procedures, and other more advanced practices ‐ for production. Even though this farmer was more experienced than others, he still did not have the technical knowledge to produce a quality crop and sought advice from farmers in the USA via skype.
Thus, as the sector grows more demand for education and research will expand. Major investments in education are not needed, but rather modest support to the existing University to strengthen its program. Modest support could include two or three of the more viable VETs to help them upgrade their programs and meet the needs of more students and provide funding to the MOA for use in contracting research support from various entities.
While some of the programs suggested above are supply side oriented it is believed that there will be modest growth of the agricultural sector as the GOG will continue to expand support. GOG support includes: helping to support sector growth by providing financial and technical assistance to the educational and research institutions that can help meet the needs of a reviving agricultural sector. It is believed that if the Government continues to provide support, as it has in the past couple years through GAC, and more for education and research it will create the demand. To create demand the sector needs to gain more support from the GOG and the private sector. Without a commitment by the GOG to the sector education and research demand growth will be slow.
ii. Extension and Skills Development Georgia does not have a comprehensive national agricultural extension capability that provides information on production alternatives, markets, production economics, optimal input utilization, farm management, and other factors critical to a farmer’s success in a market oriented economy. During the Soviet era, when most decisions were made centrally and then conveyed to the managers of the various state farming entities, it was not necessary to have an extension service. Since independence, there have been no sustained efforts to establish such a system nationwide. Over the years donors and the GOG have grappled with the problem of how to address the information needs of small farmers. To date, none of these efforts have led to the development of a nationwide, state supported extension system. This has resulted in a delayed, disjointed, inequitable, and inefficient agricultural development process.
A comparative analysis of extension systems in other countries indicates value to small and medium‐sized producers in the following areas:
Appropriate technologies;
Cropping strategies and marketing;
Accessing seasonal finance for input purchases;
Secure and equitable access to land; and
Supportive infrastructure.
The Challenge: To extension in Georgia’s agricultural sector relates to developing a system that will help transfer advice (technical, post‐harvest, and market) to many small subsistence, semi‐commercial, and commercial farmers. Also, it involves making this happen in sufficient intensity on a cost‐effective basis. Further, to be effective the extension agents providing advice have to have something to share with the farmers; therefore, they need to be educated well enough to offer the farmer confidence in what is being shared based in directly relevant research and practice. Thus, the extension activity should not work in a vacuum, but rather be based on what agents can learn from a good basic education provided by the universities and the VET’s.
51 | P a g e
Subsistence and semi‐commercial farmers require support in obtaining technical knowledge and market information to be sure they are aware of what exists, and understand their alternatives and choices. And, because these small and medium size farmers do not have money to buy adequate production inputs, they will certainly not have money to pay for advisory assistance. Thus, except perhaps for large farmers and producers of certain high value crops, an extension service paid for by farmers will not be sustainable at this stage of Georgia’s development. To assist small and medium size farmers with making change from what they already know it often requires a combination of materials, personal contacts (extension), demonstration, and incentives to affect this change. This has been confirmed in several other countries where similar farm size conditions exist. However, to date, funding a comprehensive extension service from the national budget has not yet become a government priority. The current government philosophy is that extension should be the responsibility of the private sector.
As a consequence of having no national extension service, more than 685,000 households controlling 5 hectares or less operate on the land in ways that result in very low productivity for the agricultural sector overall. These farmers do not have an ability to pay for a service of the type required to upgrade the skill levels of farmers; thus, a less resource intensive but integrated national extension model might be viable, especially one that would eventually be funded by local governments, the farmers, and businesses which sell to or buy from farmers. Such a model could include:
Use of mass media and publications for disseminating more generic information and advice;
A network of extension agents working at the community rather than the individual farmer level dealing with location and problem specific information and advice;
A limited number of commodity or target specific agents concentrating on larger farmers and important commodities; and
Joint relationships with input suppliers, packers, and processors who come in contact with large numbers of farmers.
This model is partially at work in Georgia today and results from initiatives that have been taken by donors and the GOG. For example, the USG supported the establishment of Farm Service Centers (FSC) and Machinery Service Centers (MSC). The GOG is supporting the GAC which has established MSC’s in several locations. These centers are places that farmers go to buy various goods and services for use on their land plots – seeds, fertilizers, agricultural chemicals, field preparation services, etc. As part of their services, several of these centers do have people that provide farmers information about how to improve their production through use of new materials and agricultural practices.
To illustrate the importance of establishing an effective extension system on a national level, a review of work done by the UNDP at Kachreti can be cited. At Kachreti the UNDP set up an Extension Center that provided services to approximately 2,000 farmers. The results of the extension assistance activity are summarized in Table V‐6. It shows that in all cases the advice provided to the farmers increased productivity and farm gross margins over what it was before farmers were provided the extension assistance. Also, it shows that the increase was much greater for the small farmers than for the larger farmers. The bottom line is that extension assistance can potentially increase the productivity of small and medium size farms by over 40%. This kind of result certainly supports the importance of a national extension service, and consequent impacts that can be made on productivity.
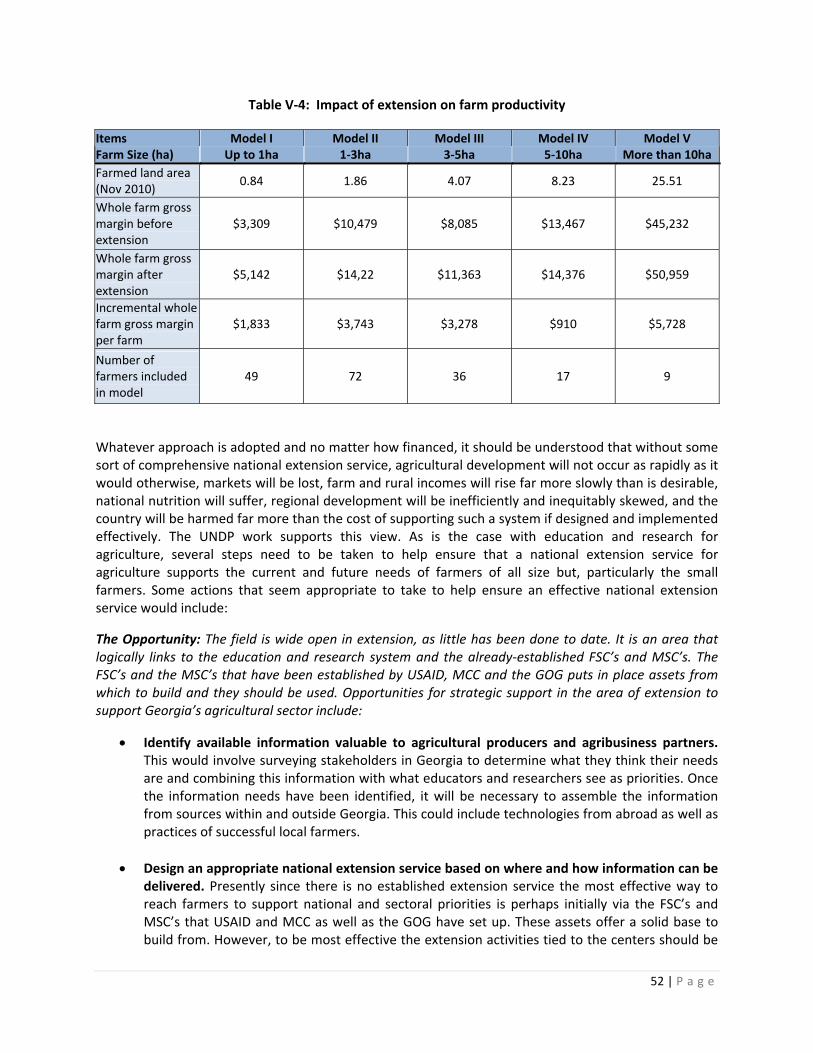
52 | P a g e
Table V‐4: Impact of extension on farm productivity
Items Model I Model II Model III Model IV Model VFarm Size (ha) Up to 1ha 1‐3ha 3‐5ha 5‐10ha More than 10ha
Farmed land area (Nov 2010)
0.84 1.86 4.07 8.23 25.51
Whole farm gross margin before extension
$3,309 $10,479 $8,085 $13,467 $45,232
Whole farm gross margin after extension
$5,142 $14,22 $11,363 $14,376 $50,959
Incremental whole farm gross margin per farm
$1,833 $3,743 $3,278 $910 $5,728
Number of farmers included in model
49 72 36 17 9
Whatever approach is adopted and no matter how financed, it should be understood that without some sort of comprehensive national extension service, agricultural development will not occur as rapidly as it would otherwise, markets will be lost, farm and rural incomes will rise far more slowly than is desirable, national nutrition will suffer, regional development will be inefficiently and inequitably skewed, and the country will be harmed far more than the cost of supporting such a system if designed and implemented effectively. The UNDP work supports this view. As is the case with education and research for agriculture, several steps need to be taken to help ensure that a national extension service for agriculture supports the current and future needs of farmers of all size but, particularly the small farmers. Some actions that seem appropriate to take to help ensure an effective national extension service would include:
The Opportunity: The field is wide open in extension, as little has been done to date. It is an area that logically links to the education and research system and the already‐established FSC’s and MSC’s. The FSC’s and the MSC’s that have been established by USAID, MCC and the GOG puts in place assets from which to build and they should be used. Opportunities for strategic support in the area of extension to support Georgia’s agricultural sector include:
Identify available information valuable to agricultural producers and agribusiness partners. This would involve surveying stakeholders in Georgia to determine what they think their needs are and combining this information with what educators and researchers see as priorities. Once the information needs have been identified, it will be necessary to assemble the information from sources within and outside Georgia. This could include technologies from abroad as well as practices of successful local farmers.
Design an appropriate national extension service based on where and how information can be delivered. Presently since there is no established extension service the most effective way to reach farmers to support national and sectoral priorities is perhaps initially via the FSC’s and MSC’s that USAID and MCC as well as the GOG have set up. These assets offer a solid base to build from. However, to be most effective the extension activities tied to the centers should be
53 | P a g e
paid on a basis that will ensure their objectivity when providing advice to farmers. If the agents are paid for by the FSC’s and/or the MSC’s they lose objectivity because they will tend to push the sale of products that the centers are selling. Also, the agents could go to communities and bring farmers together for discussions catching many people at one time. And, if local farm leaders offer land on which to conduct demonstration plots this would be a positive way to show farmers the benefits of the technologies being introduced.
Support the implemented extension system with several other actions such as:
Extension agent training and continuing education programs;
Establish legal requirements and institutional capabilities for monitoring and ensuring the continued competence of professional extension workers;
Coordinate closely with agricultural researchers to assist in the development of effective extension materials; and
Provide regional extension support capabilities for specialized knowledge areas.
iii. Institutional Strengthening and Policy While progress in structural and institutional reform has been robust in recent years, Georgia continues to face significant transition challenges in many areas; and agriculture and the food sector are not without exception. The GOG was faced with many criteria to satisfy prior to receiving acceptance as a compact country under the MCC program. The country was accepted indicating that the GOG had done many things right to qualify, with one of the most notable actions having been anti‐corruption. The country has made positive strides in this regard, and a number of other policy areas. The Challenge: To institutional strengthening and policy support on behalf of Georgia’s agricultural sector as the country moves forward relates to helping the GOG with restructuring and strengthening of the MOA and related institutions. USAID has actively assisted with work to help assist the MOA in the past, and there are anticipated to be significant new opportunities as the sector gains more traction and government support.
Throughout the Soviet period, and well into the 1990s the Ministry of Agriculture enjoyed great responsibilities, staffing and resources. In 2001, the MOA entered a restructuring program that started when the Minister of Agriculture made a direct request for assistance from USAID. Since that time, the MOA has been under review and restructuring with a new Minister taking over nearly every 8 to 10 months. This has resulted in drastic cuts and the transfer of many former responsibilities of the MOA to the private sector. On October 20, 2001on October 20, Prime Minister Nika Gilauri announced that the GOG would replace Minister of Agriculture Bakur Kvezereli with the Governor of Samegrelo, Zaza Gorozia.; thus, there continues to be instability of management.
Even after ten years of restructuring, the MOA is still not fully organized as required to serve a free market agricultural system. Efforts have been made to identify the activities the GOG should undertake via the MOA to provide support required by a private agriculture and agribusiness sector. For example, the MOA now has been stripped of many of its operational functions and has responsibility for many oversight functions such as food safety and risk analysis, plant protection, veterinary protection, rural development for technological support, regional relationships, agricultural policy, legal regulations and agreement monitoring. However, there are still several functions like research and extension that do not seem to be the responsibility of the MOA, and in fact the present structure for these support areas of activity does not seem well connected with the Ministry. Research is being done on a private bid basis under the auspices of the Ministry of Education via the Shota Rustaveli National Science Fund.
54 | P a g e
Since July 2010, the MOA has been engaged in the design and implementation of a new strategy that was just completed (October 2011) and is at the Prime Minister’s office for internal review. Thus, what is included is still unknown to groups outside the inner circle of the GOG and the MOA. However, one thing we do know is that the GOG established a state owned company – The Georgian Agricultural Corporation, LTD. (GAC) ‐ outside the MOA to take on the task of jump‐starting activities in the agricultural sector. The GAC was formed to carry out operational activities because the MOA cannot be an operating company under the existing laws and the GOG wanted to see things pushed forward in the agricultural sector. It is unknown how long this structure is to stay in place, but it is understood that its purpose is to jump‐start activities and turn them over to the private sector. For example; the GAC has opened five MSC’s, started two grain elevators in Kakheti, and is in the process of developing a consolidation/cold store/market center in Tbilisi. GAC is further involved in multiple blueberry demonstration plots in western Georgia, and irrigation. As these activities the apparent intention is privatization.
There is a demand for high‐level policy research in agriculture, which could support the policymakers in formulation of agriculture development policy and programs, provide expertise and analysis of implemented policy, and identify the development challenges. There is an apparent need for the study and research of various aspects of agriculture development: 1) prospects of developing of vertically integrated farming; 2) analysis of the costs and benefits associated with the creation of farmer associations, in particular segments of the agricultural industry and regions of Georgia; and 3) Identifying the binding constraints for agricultural and rural development in Georgia (human capital, social capital, infrastructure, technology, cost of borrowing, etc.). These matters and related policy questions need to be evaluated by professional agricultural policy analysts and economists.
The Opportunity: The MOA is in need of additional restructuring and policy development assistance as it works to improve the agricultural and agribusiness environment for private development. As the MOA and its associated agencies work to improve their performance and oversight of the agricultural and food industry sector, opportunities for strategic support in the areas of institutional strengthening and policy to support Georgia’s agricultural sector include:
Conducting a third party independent examination of the planned MOA strategy and offer to provide the GOG with a review that helps to suggest whether or not the strategy incorporates the appropriate responsibilities for the MOA if it is to serve the private sector well in its quest to develop agriculture and the food industry sector. This would not be an effort to challenge what has been prepared but simple make suggestions if some seemed appropriate.
Conducting an evaluation of the MOA policy agenda and specific policies in place for the agricultural sector. The aim would be to provide suggestions and guidance for ensuring that the best policies are being put in place to support a private agricultural sector. The intent would be to help ensure policies are appropriate and supportive; and make recommendations for how to strengthen the policy agenda.
iv. Youth and Cooperative Development As outlined in Section I.C.4 above, overall cooperative development and group‐based enterprise has a poor track record in Georgia. Generalized biases throughout Georgian society limit its prospects, in addition to legal / taxation impediments that limit feasibility for serious commercial ventures.
The Opportunity: Youth and cooperative development are linked, especially when visioned within a long‐term framework. Given the generalized bias among citizen/entrepreneurs in Georgia against the
55 | P a g e
formation of cooperatives, associations or other voluntary interest groups, the assessment sees the challenges posed in this arena to require long‐term knowledge and awareness building. As youth are gradually exposed to successful examples, utilization will gradually increase. This will likely require a “generational shift”, especially in the more traditional and conservative agricultural sphere. In addition to this long‐term intervention, one basic, more immediate measure that should be advocated is reform of the tax code concerning coops. Specific opportunities are outlined below:
Reform of taxation on cooperatives: The structure of the Georgian tax code creates a financial disincentive to the formation of cooperatives. Agriculture is as a tax free enterprise for individuals deriving an income below 200,000 GEL. Nonetheless, when multiple individuals form a cooperative, the 200,000 GEL limitation on tax‐free income does not rise in corresponding fashion. Further to this, producer groups can potentially be liable to VAT taxation of primary production. This actually creates a significantly increased tax burden for individuals forming cooperatives, significantly diminishing their viability as business units. Working in concert with the Ministry of Finance, a revisiting of the current taxation policies should be undertaken.
Promotion of farmer groups in educational programming: To help in the process of getting farmers to work together for their benefit the educational institutions should develop courses that help students understand the benefits of working together. One focus is to develop the strategies that ensure the effective working together of farmer groups. At the core of successful farmer groups is strong committed leadership that farmers trust; the group provides clear economic benefits to the members; and, the farmers have an opportunity to participate in what the organization is doing.
“Future Farmers of Georgia”: At the secondary school level the introduction of “Future Farmers of Georgia” curricula could be introduced as a way to help show students the opportunities in the sector, stemming the tide of youth flight from agriculture. Also, youth can be involved in 4H type activities that help to provide them with practical every day exposure to agricultural production technologies and new management practices.
D. Land
After completion of the two‐stage land privatization program that began in 1992, it is estimated that 1,090,942 hectares had been privatized as of 2011. While the land privatization process seems to have been successful in many respects, the process has left some constraints that still hinder the rapid and effective development of agricultural land. Some key constraints identified include:
Fragmentation constrains scale, sales, credit and leasing;
Surveying, mapping and re‐registration associated with clarifying titles is cost prohibitive for smallholders;
Lack of good land statistics hinders good policy‐making;
Informal land trade/lease/use strategies can delay formalization;
Irrigation companies and tax authorities lacking essential information on tenure; and
Insecurity of property rights.
56 | P a g e
Ways by which each of these items represents a constraint is discussed below.
1. Fragmentation constrains scale, sales, credit and leasing because small diverse holdings makes it hard to assemble land, discourages purchase and consolidation, and limits the ability to utilize as collateral against borrowing. Similar constraints apply to leasing.
2. Surveying, mapping and re‐registration associated with clarifying titles is cost prohibitive for smallholders and only 15‐20% of land owned by small farmers is registered. This is primarily because it can cost approximately 200 GEL to complete the surveying and re‐registration. For households with multiple plots, these already high expenses quickly multiply.
3. Lack of good land statistics hinders good policy‐making with a lot of uncertainty at present regarding land holdings, usage, taxation, etc.
4. Informal land trade / lease / use strategies can delay formalization leading many owners make informal arrangements because they do not cost significant money. The downside is that when you want to transfer land officially, the process will be delayed because formalization of ownership and titles is necessary.
5. Irrigation companies and tax authorities lacking essential information on tenure which was quoted as being the number one problem for irrigation companies in some areas. These irrigation companies do not know who their true customers are for the water that they provide, complicating other billing and maintenance issues.
6. Insecurity of property rights results when the documentation held by people is not formalized and properly registered matching the owners with the correct piece or pieces of land.
The Challenge: Related to land relates to providing targeted resources to effectively finish the job of land reform, with particular attention to agricultural lands. Discreet constraints are evident in regards to land registration, with incentives needed for small landholders, especially those with multiple plots, to formalize. Constraints at present are primarily financial. USAID has provided highly successful assistance to promote land reform in the past. These small initiatives would have the benefit of effectively “finishing the job”, with strongest impacts felt for the smallest of farmers and the overall agricultural land market in Georgia.
Of the 6.8 million hectares of land a controlled by the country, approximately 43.7% is considered agricultural when including pasture lands and meadows, totaling just over 3 million hectares (see Table V‐8). About 17.7% of total area is used in more intensive agriculture. According to World Bank reports, this land area is distributed between three key land categories: 1) Arable land, 802,000 ha (11.7%); 2) Perennial crops, 264,000 ha (3.9%); and 3) hay lands, 143,000 ha (2.1%). In addition, natural grazing land accounts for approximately 1,797,000 ha (26%), and forest lands (40%) account for another large part of the total land area. The remaining land area includes alpine slopes, rocky slopes, and lakes. Statistical information is not always consistent among sources for various categories but, most are reasonably close; therefore, the area indicated for agricultural land is assumed to be a reasonable estimation and adequate for strategic analytical purposes. In addition to the plains in the central west and east, the country is unique with many micro‐climatic zones where a wide range of specialty crops can be grown, providing the sector with additional niche opportunities.
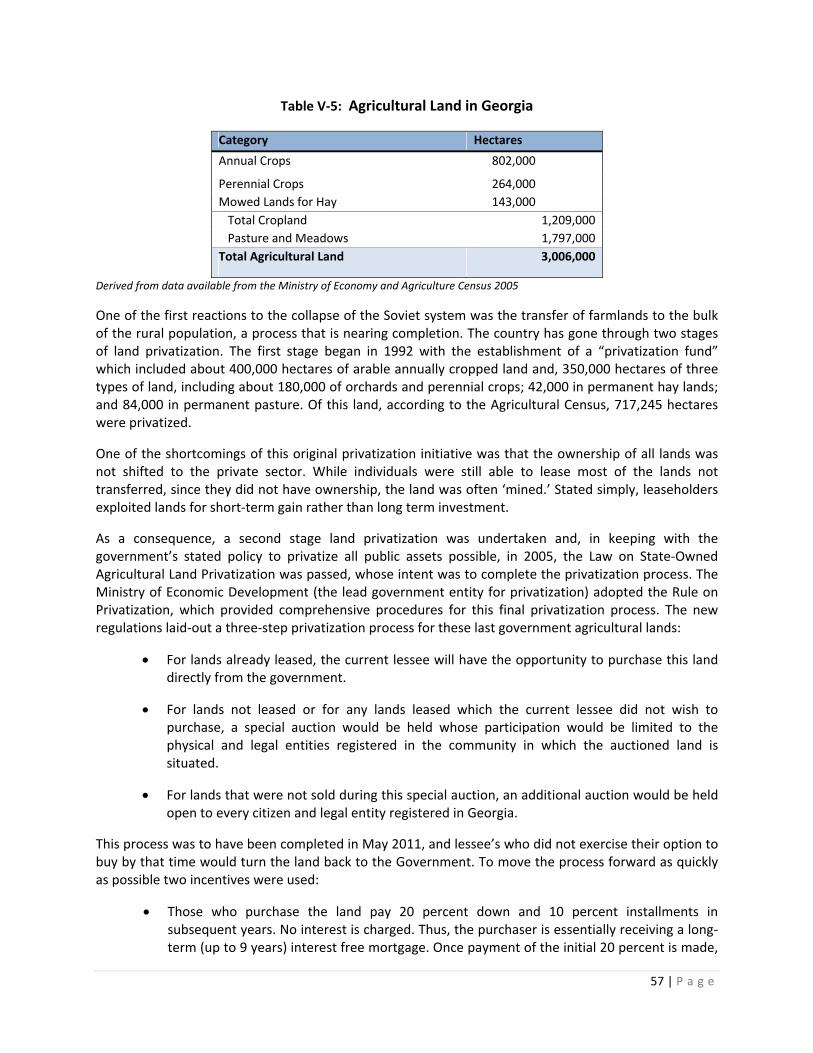
57 | P a g e
Table V‐5: Agricultural Land in Georgia
Category Hectares
Annual Crops 802,000
Perennial Crops 264,000
Mowed Lands for Hay 143,000
Total Cropland 1,209,000
Pasture and Meadows 1,797,000
Total Agricultural Land 3,006,000
Derived from data available from the Ministry of Economy and Agriculture Census 2005
One of the first reactions to the collapse of the Soviet system was the transfer of farmlands to the bulk of the rural population, a process that is nearing completion. The country has gone through two stages of land privatization. The first stage began in 1992 with the establishment of a “privatization fund” which included about 400,000 hectares of arable annually cropped land and, 350,000 hectares of three types of land, including about 180,000 of orchards and perennial crops; 42,000 in permanent hay lands; and 84,000 in permanent pasture. Of this land, according to the Agricultural Census, 717,245 hectares were privatized.
One of the shortcomings of this original privatization initiative was that the ownership of all lands was not shifted to the private sector. While individuals were still able to lease most of the lands not transferred, since they did not have ownership, the land was often ‘mined.’ Stated simply, leaseholders exploited lands for short‐term gain rather than long term investment.
As a consequence, a second stage land privatization was undertaken and, in keeping with the government’s stated policy to privatize all public assets possible, in 2005, the Law on State‐Owned Agricultural Land Privatization was passed, whose intent was to complete the privatization process. The Ministry of Economic Development (the lead government entity for privatization) adopted the Rule on Privatization, which provided comprehensive procedures for this final privatization process. The new regulations laid‐out a three‐step privatization process for these last government agricultural lands:
For lands already leased, the current lessee will have the opportunity to purchase this land directly from the government.
For lands not leased or for any lands leased which the current lessee did not wish to purchase, a special auction would be held whose participation would be limited to the physical and legal entities registered in the community in which the auctioned land is situated.
For lands that were not sold during this special auction, an additional auction would be held open to every citizen and legal entity registered in Georgia.
This process was to have been completed in May 2011, and lessee’s who did not exercise their option to buy by that time would turn the land back to the Government. To move the process forward as quickly as possible two incentives were used:
Those who purchase the land pay 20 percent down and 10 percent installments in subsequent years. No interest is charged. Thus, the purchaser is essentially receiving a long‐term (up to 9 years) interest free mortgage. Once payment of the initial 20 percent is made,

58 | P a g e
the buyer receives full title to the land. The lessee had 10 years in which to decide whether he would buy the land, thus amounting to a nineteen year interest free loan.
In part to incentivize lessees to make a decision sooner and to move this second phase of privatization ahead more quickly, if full payment is made within one year, the price of the land is reduced by 50 percent. With full payment made within three years, the price is reduced by 25 percent.
A positive aspect of moving this remaining government land into private hands is that it may help accelerate the development of the market for farmland. To date, if a farmer or businessman were interested in accumulating a larger portion of land to farm, the simplest approach was to seek to lease land from government. To attempt to do so with private purchases could be quite time consuming, tedious, and uncertain given the small sizes of most parcels. During this process it is understood that 373,697 hectares were privatized.
The Opportunity: While there has been significant progress over the past several years in land privatization and land ownership, a few conditions still exist that tend to cause agricultural land owners concern. These things that cause concern can be reasonably easily resolved with the facilities and tools that the National Agency of Public Registration has to work with. The primary missing link at the moment is the funding support required to complete the re‐registration tasks required to finalize the issuing of clear titles that specify the correct boundaries and locations of each land tract. Opportunities for strategic support to help complete land ownership clarity for Georgia’s agricultural sector include:
Provide assistance to smallholders for re‐registration of lands to ensure all land is under formalized ownership which will facilitate its buying and selling, help banks feel more secure about accepting land as collateral, helping firms (like irrigation water distribution companies) who charge registered owners of land, and, helping the GOG or local governments who charge fees or taxes based on who owns the land. Also, once the titles have all been formalized a transparent private land leasing market can be established.
Clarify the rights and status of remaining leases. By assisting with this clarification it will help everyone understand what land still remains to be privatized and where it is so that when it is made available for privatization the process can move quickly.
Create or re‐establish a unit to keep statistics with respect to land ownership and use because without good statistics policy‐making is hindered.
Promote a robust agricultural land market. Undertake those actions which will promote the development and growth of the agricultural land market, e.g., registration, property surveys, availability of soil types and land quality as a vibrant land market will help determine the competitive nature of the agricultural business.
E. Agricultural Services
Agriculture and its effective performance depends on bringing together many factors of production – water, fertilizers, agricultural chemicals, seeds, machinery services, labor, etc. – in the proper way to realize the highest productivity achievable. This section discusses several key factors that impact on the
59 | P a g e
productivity of agriculture – irrigation, inputs (fertilizers, seeds, agricultural chemicals, machinery services, etc.) and, veterinary supplies and services.
i. Irrigation Irrigation water when needed during the dry periods of the growing season is key to increased productivity of Georgia’s farmers. Adequate water at the right time for the right price can allow Georgian agriculture, particularly fruits, nuts, and vegetables to be competitive on the global economy and achieve the most profitable levels of production possible. To date the proper management of the irrigation network in the country has not been achieved with systems deteriorating and falling into disuse. And while the irrigation/drainage system rehabilitation and reorganization is still not clear, it does leave several unanswered questions and raises several constraints including:
Lack of a fully (even partially) operational irrigation/drainage system reduces productivity 25‐50% (income increases on average could be GEL 600‐700/ha);
Deterioration, inefficiency and prohibitive maintenance cost of old systems;
Existing management systems unsustainable;
Government plans for how to reorganize the irrigation systems is unclear;
Method of assessing user fees not calibrated to actual use;
Prospects for “privatization” not well analyzed;
Irrigation companies have difficulty identifying customer base, especially those owned by small plot holders.
Ways by which each of these items represents a constraint is discussed below.
1. Lack of a fully (even partially) operational irrigation/drainage system causes agricultural productivity on potentially irrigated land to be 25‐50% less than would be the case if the systems were functioning well. It is estimated that this low productivity, if improved, could result in increased income of 600‐700GEL/ha. If the area under irrigation could be increased by 200,000 hectares, this could increase revenues in the agricultural sector by 130 million GEL.
2. Deterioration, inefficiency and prohibitive maintenance cost of old systems costs much more than would be required if the systems were brought to good condition and then properly managed to stay that way.
3. Existing management systems are unsustainable preventing investment and rehabilitation. 4. Government plans for how to reorganize the irrigation systems is unclear and as long as the
situation remains in limbo it will prevent anything meaningful from happening to reorganize the systems management and their eventual rehabilitation.
5. Method of assessing user fees not calibrated to actual use and as such too much water is used and wasted. Also, because water is essentially free it does not encourage the use of more modern irrigation technology that would save vast quantities of water without reducing productivity. Further, if fees were calibrated to usage at sustainable rates, maintenance would be possible.
6. Prospects for “privatization” have not been well analyzed and before making a decision on the final approach for reorganization this should be a must. Before an investor will consider buying into one of the LTD’s that the GOG has established a complete detailed feasibility study examining the cost of rehabilitation, maintenance and, operating costs as well as what the fees for water will need to be to make the operation payoff.
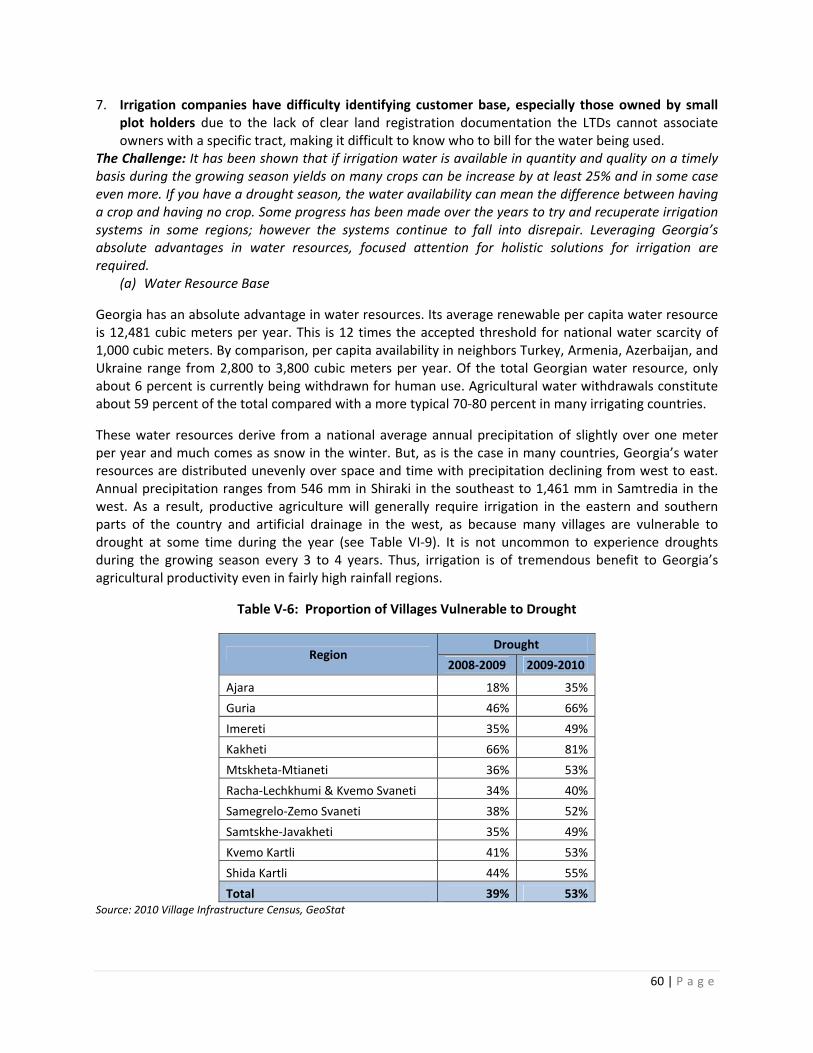
60 | P a g e
7. Irrigation companies have difficulty identifying customer base, especially those owned by small plot holders due to the lack of clear land registration documentation the LTDs cannot associate owners with a specific tract, making it difficult to know who to bill for the water being used.
The Challenge: It has been shown that if irrigation water is available in quantity and quality on a timely basis during the growing season yields on many crops can be increase by at least 25% and in some case even more. If you have a drought season, the water availability can mean the difference between having a crop and having no crop. Some progress has been made over the years to try and recuperate irrigation systems in some regions; however the systems continue to fall into disrepair. Leveraging Georgia’s absolute advantages in water resources, focused attention for holistic solutions for irrigation are required.
(a) Water Resource Base
Georgia has an absolute advantage in water resources. Its average renewable per capita water resource is 12,481 cubic meters per year. This is 12 times the accepted threshold for national water scarcity of 1,000 cubic meters. By comparison, per capita availability in neighbors Turkey, Armenia, Azerbaijan, and Ukraine range from 2,800 to 3,800 cubic meters per year. Of the total Georgian water resource, only about 6 percent is currently being withdrawn for human use. Agricultural water withdrawals constitute about 59 percent of the total compared with a more typical 70‐80 percent in many irrigating countries.
These water resources derive from a national average annual precipitation of slightly over one meter per year and much comes as snow in the winter. But, as is the case in many countries, Georgia’s water resources are distributed unevenly over space and time with precipitation declining from west to east. Annual precipitation ranges from 546 mm in Shiraki in the southeast to 1,461 mm in Samtredia in the west. As a result, productive agriculture will generally require irrigation in the eastern and southern parts of the country and artificial drainage in the west, as because many villages are vulnerable to drought at some time during the year (see Table VI‐9). It is not uncommon to experience droughts during the growing season every 3 to 4 years. Thus, irrigation is of tremendous benefit to Georgia’s agricultural productivity even in fairly high rainfall regions.
Table V‐6: Proportion of Villages Vulnerable to Drought
Region Drought
2008‐2009 2009‐2010
Ajara 18% 35%
Guria 46% 66%
Imereti 35% 49%
Kakheti 66% 81%
Mtskheta‐Mtianeti 36% 53%
Racha‐Lechkhumi & Kvemo Svaneti 34% 40%
Samegrelo‐Zemo Svaneti 38% 52%
Samtskhe‐Javakheti 35% 49%
Kvemo Kartli 41% 53%
Shida Kartli 44% 55%
Total 39% 53% Source: 2010 Village Infrastructure Census, GeoStat
61 | P a g e
In addition to the natural rain and snow fall that fills the streams and rivers draining the country, substantial renewable groundwater reserves exist. Many wells were drilled during the Soviet period, and at depths of 300 meters, found good supplies of water from either artesian or sub‐artesian sources. Discharges vary from 10‐100 liters/second. In addition, shallower water table aquifers exist in some regions adjacent to streams and rivers. Wells of this type can be contributors to an irrigation network particularly when the water is utilized in conjunction with modern advanced technologies that use water efficiently.
(b) Reservoirs
During the Soviet period, 25 reservoirs were constructed for irrigation purposes with designed active storage capacity totaling 790 million cubic meters. The six largest reservoirs account for more than 90 percent of this formerly installed capacity. However, like many things that were improperly maintained after the Soviet break‐up, several dams deteriorated since construction, and there are concerns about the safety of some. Therefore, as a part of the irrigation rehabilitation efforts of the World Bank, some of these dams – Sioni and Algeti ‐ have been rehabilitated. The Tbilisi water reservoir and the Dali Mountain dam have not yet been rehabilitated.
(c) Irrigation and Drainage Network
As one passes through the agricultural regions of the country, it is impossible to not be impressed with the extensively developed irrigation and drainage systems in Georgia. During the Soviet era, at one time there were as much as 469,000 hectares irrigated and 163,000 hectares under improved drainage. According to available information, in 1988 386,000 hectares were still under irrigation with 291,000 of this being with gravity systems and 95,000 relying on 120 pumping stations lifting water from rivers. However, an analysis of the latest data available from 2007, irrigation water could only be supplied to 110‐120,000 thousand hectares. Interviews and anecdotal evidence indicates that this number is probably much lower. Thus, a substantial decline from the height of the system has occurred and much needs to be done if the system is to be even partially rehabilitated. Based on World Bank and Amelioration Department estimates of a few years ago, the potential exists to expand the system back to approximately 300,000 hectares of irrigated land. However, going much beyond this would require in‐depth feasibility assessment.
As referenced earlier, crop lands in western Georgia sometimes require artificial drainage in order to be productive. Some of these lands are actually below sea level and require pumped drainage. Estimates for drained land in 1988 were 84,300 hectares for gravity drainage and 30,000 for pumped drainage. It was estimated as a part of World Bank work that in 2005 the potential existed to drain up to 80,000 hectares. However, in 2005, only 20,000 hectares were under gravity drainage, and there was no functioning pump drainage.
The fundamental causes of the decline in both irrigated and drained land since independence are the disruption of institutional capacity, to include the quality and continuity of management, and drastically reduced levels of funding for system operation and maintenance. In addition, civil strife, war, and vandalism contributed to the disruption. All these eventually led to inoperable head‐works, broken and breached canals, broken gates, blocked pipes, and theft of marketable items. Once an irrigation system becomes inoperable for whatever reason, it can generally not be effectively placed back on‐line without undertaking significant rehabilitation activities. Irrigation systems cannot be “mothballed” and then quickly brought back on‐line with little or no new investment.
62 | P a g e
One basic reason for the shortage of funds is that farmers are charged only a nominal amount for the irrigation water. Yet, based on the financial benefits of irrigation in terms of increased production and quality, the farmers could afford to pay considerably increased amounts, if not actually full cost. One analysis by IFAD showed that for apples, where the water charge based on typical usage was approximately GEL 30‐50 (US$ 17‐28) per hectare, the net profits per hectare (before labor charges) ranged from GEL 600‐1200 (US$ 330‐660) per hectare. This shows that there is clearly room to charge much more for water. And, this past season it was reported by one water company that fee recovery rates had improved during the last year, but were not sufficient to cover more than the on‐going costs associated with the staff salaries, to say nothing of the costs to rehabilitate and maintain the systems. Thus, much higher rates for water are required, and may indeed be affordable for the majority of farmers.
In 2006, the Government abolished the Department of Amelioration and established 4 state owned LTDs ‐ Sioni M, Mtkvari M, Alazani M and Rioni M – they hope to privatize. The first three cover most of the country’s irrigation system and the fourth manages a large area under drainage. It is presumed that if the administration and operation of the system is privatized or modified in some way as is now being contemplated by government, those who manage the system will be allowed to set realistic rates and then use the resulting funds to properly maintain and operate the system. If this is the only way this can occur, then there may be a compelling argument for a change in the systems management. However, this should not be a major justification for “privatization.” The government, just as a private entity, should be able to increase rates, remit funds to the central budget, and then reallocate collected funds to the Government controlled structures responsible for managing the system.
(d) Rehabilitation and reorganization conclusion
Existing irrigation and drainage systems, even if inoperable, represent significant “sunk” costs that can typically reduce the investment required to expand irrigated hectares in Georgia. It is estimated that full rehabilitation of existing systems can be done for US$ 1,200 per hectare for irrigation lands and US$1,000 per hectare for drainage projects. This compares to new construction of 3 to 4 times those amounts. And, fully operational irrigation systems can increase productivity by 25‐50%. With increases in productivity of this magnitude, depending on the crops grown, income per hectare can be increased by on average 600‐700GEL/hectare. This kind of increase will permit farmers to pay substantially more than they pay now for water and it should provide a system that will cover costs of maintenance and rehabilitation if properly managed. Thus, rehabilitation and reorganization seems a must for some of the systems.
To help address the rehabilitation and reorganization question the World Bank financed a twelve year rehabilitation project (IDCDP). The project was to run through 2014 and ultimately rehabilitate 200,000 hectares. However, the program was discontinued in 2008 due to disagreements on overall management of irrigation. The World Bank was reticent about discussions on privatization, raising concerns regarding sustainability. To make privatization work, substantial feasibility work is still required.
The Opportunity: To date the World Bank has provided significant assistance to the rehabilitation of Georgia’s irrigation network. To return Georgia to 75% of its capacity during the Soviet period, major investments are required. This requires realistic feasibility, sustainable management plans, and massive capital lay‐outs on behalf of a multitude of donor and government partners. Given this, Georgia would be well positioned to capitalize upon its absolute advantage in water, greatly raising productivity in the
63 | P a g e
agricultural sector. Several strategies offering opportunity to help improve the effectiveness of the irrigation systems forward include:
Conduct feasibility studies to determine viable management models. Presently the GOG has favored a plan to privatize irrigation management companies but, there is a great deal of doubt as to whether that is the correct approach to managing the water systems. Also, many believe that no investors would be interested in investing in such companies. To date, good feasibility studies that show the costs –capital and operating – against potential realistic revenues do not exist, making it difficult to know whether privatization is a viable strategy.
Promotion of modern, water‐saving irrigation technologies. To date there has been little effort to try and get farmers to use water‐saving technologies because payment is typically not calibrated to use. However, if an investor is to be attracted to the purchase of irrigation systems they would want to know what the returns to the investment would be when the least amount of water is used by each farmer because it can affect the number of customers that the system could serve. Also, farmers need to know how to manage crops when water quantities are limited.
Carry‐out irrigation systems upgrading / infrastructure investment. Representing a major commitment on behalf of the GOG and relevant donors, irrigation infrastructure upgrades have major potential to directly impact on productivity and promote the investment of additional capital into the sector (e.g. loans, insurance). Investments should only be undertaken on the basis of in‐depth feasibility analysis, and clarity around management and policy related to the system.
Focus irrigation system investment in highest productivity areas. To make the best use of water and gain the greatest return for the country it is necessary to determine where to focus rehabilitation efforts on a priority basis. In this way the GOG, with a study that helps identify greatest return zones, will be in a better position to launch its efforts to rehabilitate the system and attract outside investors.
ii. Inputs In order for Georgia’s farmers to be able to compete in the global economy and achieve the most profitable levels of production possible, they must have access to the best, most reliable, and competitively priced inputs available. These production inputs include seed, seedlings, breeding stock, farm chemicals, medicines, feed, machinery, and equipment. Although often not thought of in this same context, professional services, such as those of veterinarians, commercial pesticide applicators, testing laboratories and services, and private extension agents, are also all production inputs which will be increasingly important to the success of Georgia’s agriculture.
Generally, in recent years the situation with respect to the availability of inputs has improved but there are still key constraints registered, including:
The intensity of machinery services is not sufficient because demand is not met in a timely manner.
The type of machinery/implements required for some priority commodities is not available.
Machinery service costs (rental fees) sometimes are often prohibitive to small farmers.
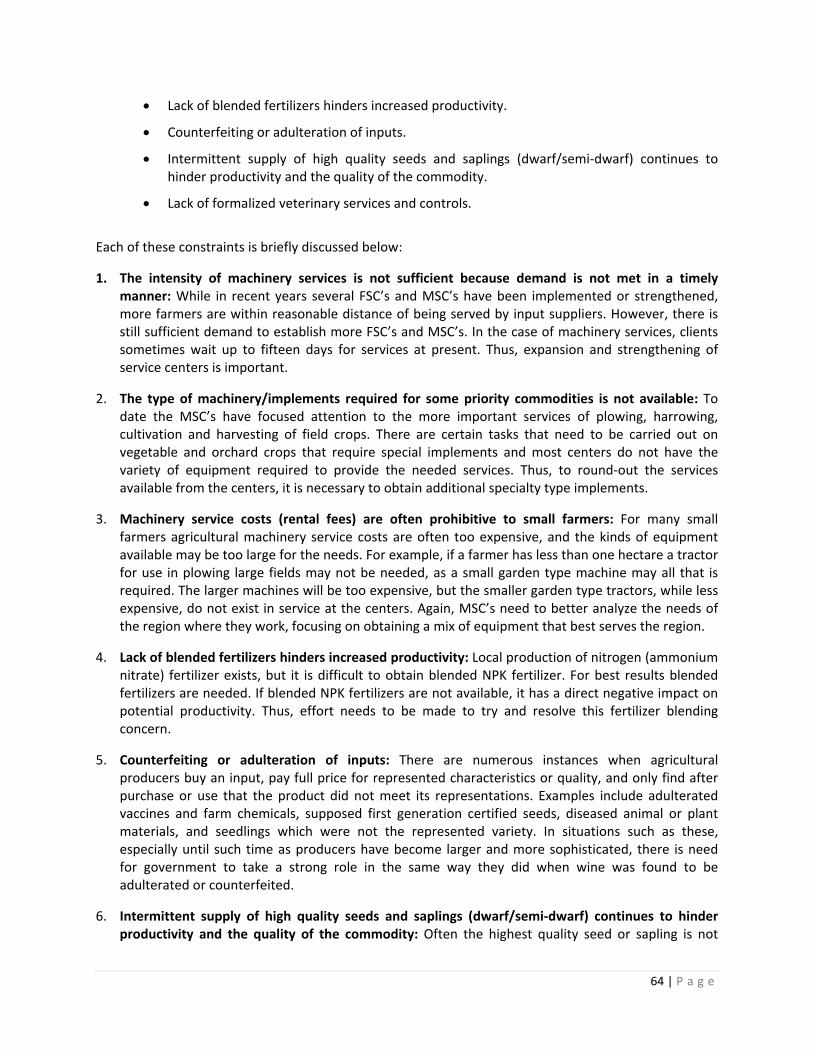
64 | P a g e
Lack of blended fertilizers hinders increased productivity.
Counterfeiting or adulteration of inputs.
Intermittent supply of high quality seeds and saplings (dwarf/semi‐dwarf) continues to hinder productivity and the quality of the commodity.
Lack of formalized veterinary services and controls.
Each of these constraints is briefly discussed below:
1. The intensity of machinery services is not sufficient because demand is not met in a timely manner: While in recent years several FSC’s and MSC’s have been implemented or strengthened, more farmers are within reasonable distance of being served by input suppliers. However, there is still sufficient demand to establish more FSC’s and MSC’s. In the case of machinery services, clients sometimes wait up to fifteen days for services at present. Thus, expansion and strengthening of service centers is important.
2. The type of machinery/implements required for some priority commodities is not available: To date the MSC’s have focused attention to the more important services of plowing, harrowing, cultivation and harvesting of field crops. There are certain tasks that need to be carried out on vegetable and orchard crops that require special implements and most centers do not have the variety of equipment required to provide the needed services. Thus, to round‐out the services available from the centers, it is necessary to obtain additional specialty type implements.
3. Machinery service costs (rental fees) are often prohibitive to small farmers: For many small farmers agricultural machinery service costs are often too expensive, and the kinds of equipment available may be too large for the needs. For example, if a farmer has less than one hectare a tractor for use in plowing large fields may not be needed, as a small garden type machine may all that is required. The larger machines will be too expensive, but the smaller garden type tractors, while less expensive, do not exist in service at the centers. Again, MSC’s need to better analyze the needs of the region where they work, focusing on obtaining a mix of equipment that best serves the region.
4. Lack of blended fertilizers hinders increased productivity: Local production of nitrogen (ammonium nitrate) fertilizer exists, but it is difficult to obtain blended NPK fertilizer. For best results blended fertilizers are needed. If blended NPK fertilizers are not available, it has a direct negative impact on potential productivity. Thus, effort needs to be made to try and resolve this fertilizer blending concern.
5. Counterfeiting or adulteration of inputs: There are numerous instances when agricultural producers buy an input, pay full price for represented characteristics or quality, and only find after purchase or use that the product did not meet its representations. Examples include adulterated vaccines and farm chemicals, supposed first generation certified seeds, diseased animal or plant materials, and seedlings which were not the represented variety. In situations such as these, especially until such time as producers have become larger and more sophisticated, there is need for government to take a strong role in the same way they did when wine was found to be adulterated or counterfeited.
6. Intermittent supply of high quality seeds and saplings (dwarf/semi‐dwarf) continues to hinder productivity and the quality of the commodity: Often the highest quality seed or sapling is not
65 | P a g e
available because persons have bought high quality seeds or saplings once and then reproduced them. This is particularly the case with seeds because for a certain number of subsequent years without having to pay the premium each year for the high quality seed the farmer will save seed from the prior year’s crop. Based on this potential to bypass paying the premium, it will be necessary for seed companies and input service firms to provide information that will convince the farmers of the need to buy the high quality seeds. They will need to show the financial benefits to farmers for using the improved seed annually instead of periodically.
7. Lack of formalized professional services such as veterinary services and controls: Professional services purchased from the private sector will become increasingly important to the Georgian food and agriculture sector, including the government itself. The latter occurred when the decision was made to privatize certain veterinary services previously provided by the Ministry of Agriculture directly. Now private veterinarians are contracted to implement the government funded livestock vaccination program. Such services are still not well utilized by farmers, particularly small farmers who cannot afford to pay for the services. In the coming years, such services will become increasingly important and it is necessary formalize how these services will be carried‐out and controlled.
The Challenge: With respect to inputs for Georgia’s agricultural sector as the country moves forward relates to the availability of fertilizer, pesticides, seeds and, machinery services at costs which are accessible for the various size farmers. Also, it is important to ensure services such as those of veterinarians and laboratories. Further, these inputs and/or services need to be available on a timely basis, particularly for land preparation and harvesting services. In some cases the fertilizer might be available but it may not be the best fertilizer. For example, local ammonium nitrate is available but, it may be better to use a blended NPK fertilizer for higher yields, assuming it is readily available at a reasonable price. Thus, there are needs still to be met in providing inputs and services to farmers.
Set out in Figure V‐6 and Table V‐11 is an overview of the situation in Georgian agriculture with respect to the use of fertilizers and pesticides in recent years.
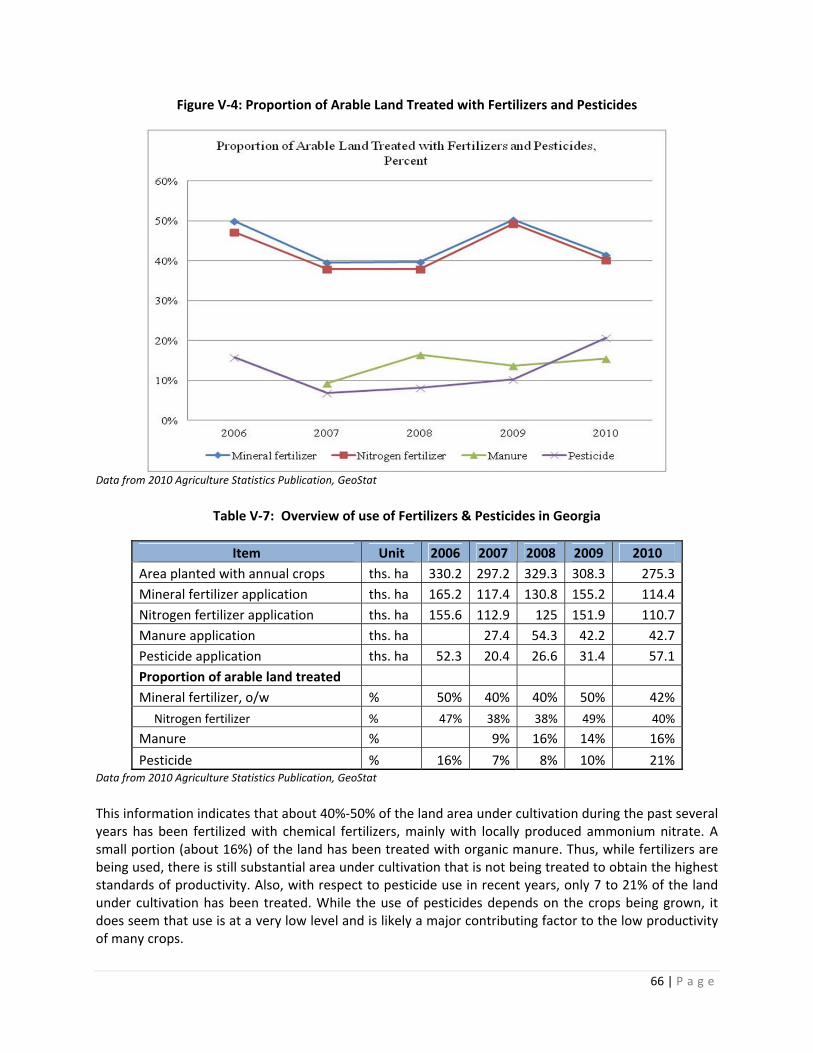
66 | P a g e
Figure V‐4: Proportion of Arable Land Treated with Fertilizers and Pesticides
Data from 2010 Agriculture Statistics Publication, GeoStat
Table V‐7: Overview of use of Fertilizers & Pesticides in Georgia
Item Unit 2006 2007 2008 2009 2010
Area planted with annual crops ths. ha 330.2 297.2 329.3 308.3 275.3
Mineral fertilizer application ths. ha 165.2 117.4 130.8 155.2 114.4
Nitrogen fertilizer application ths. ha 155.6 112.9 125 151.9 110.7
Manure application ths. ha 27.4 54.3 42.2 42.7
Pesticide application ths. ha 52.3 20.4 26.6 31.4 57.1
Proportion of arable land treated
Mineral fertilizer, o/w % 50% 40% 40% 50% 42%
Nitrogen fertilizer % 47% 38% 38% 49% 40%
Manure % 9% 16% 14% 16%
Pesticide % 16% 7% 8% 10% 21%Data from 2010 Agriculture Statistics Publication, GeoStat
This information indicates that about 40%‐50% of the land area under cultivation during the past several years has been fertilized with chemical fertilizers, mainly with locally produced ammonium nitrate. A small portion (about 16%) of the land has been treated with organic manure. Thus, while fertilizers are being used, there is still substantial area under cultivation that is not being treated to obtain the highest standards of productivity. Also, with respect to pesticide use in recent years, only 7 to 21% of the land under cultivation has been treated. While the use of pesticides depends on the crops being grown, it does seem that use is at a very low level and is likely a major contributing factor to the low productivity of many crops.
67 | P a g e
(a) Farm Service Centers
FSC’s were established under the MCC compact between the GOG and USG. The compact made available $295 million to support several different activities that the GOG felt were important to the country’s development, and one of the activities was the Agricultural Development Activity (ADA). The program was basically a grant program that provided, on a 1 to 1 matching basis, funds to local groups that wanted to develop agribusiness ventures. A popular focus for the project was the establishment or strengthening of FSC’s. The activities of the FSC’s is to provide inputs including seed, seedlings, fertilizers, agricultural chemicals, veterinary supplies and medicines, feed, small scale implements; etc., to farmers in the regions where the centers operate. During the course of the ADA project, 32 FSC’s were established with help from ADA and their locations are set out in Table V‐13 and shown on Figure V‐8.
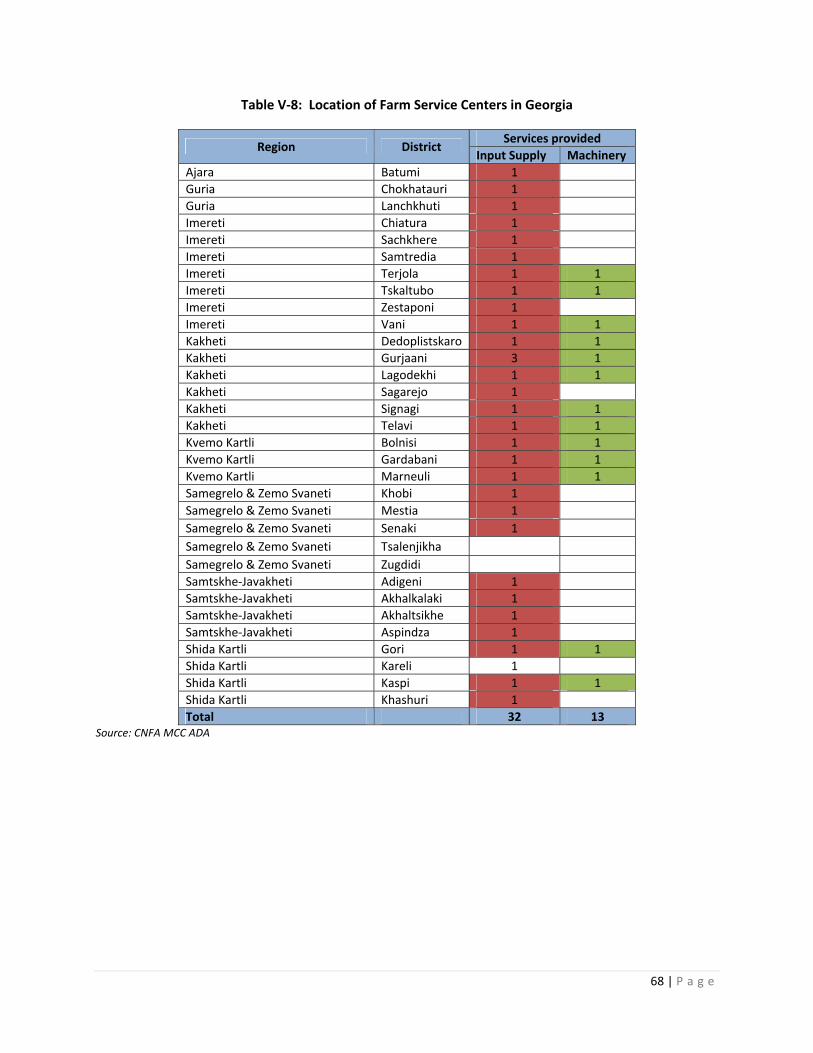
68 | P a g e
Table V‐8: Location of Farm Service Centers in Georgia
Region District Services provided
Input Supply Machinery
Ajara Batumi 1
Guria Chokhatauri 1
Guria Lanchkhuti 1
Imereti Chiatura 1
Imereti Sachkhere 1
Imereti Samtredia 1
Imereti Terjola 1 1
Imereti Tskaltubo 1 1
Imereti Zestaponi 1
Imereti Vani 1 1
Kakheti Dedoplistskaro 1 1
Kakheti Gurjaani 3 1
Kakheti Lagodekhi 1 1
Kakheti Sagarejo 1
Kakheti Signagi 1 1
Kakheti Telavi 1 1
Kvemo Kartli Bolnisi 1 1
Kvemo Kartli Gardabani 1 1
Kvemo Kartli Marneuli 1 1
Samegrelo & Zemo Svaneti Khobi 1
Samegrelo & Zemo Svaneti Mestia 1
Samegrelo & Zemo Svaneti Senaki 1
Samegrelo & Zemo Svaneti Tsalenjikha
Samegrelo & Zemo Svaneti Zugdidi
Samtskhe‐Javakheti Adigeni 1
Samtskhe‐Javakheti Akhalkalaki 1
Samtskhe‐Javakheti Akhaltsikhe 1
Samtskhe‐Javakheti Aspindza 1
Shida Kartli Gori 1 1
Shida Kartli Kareli 1
Shida Kartli Kaspi 1 1
Shida Kartli Khashuri 1
Total 32 13 Source: CNFA MCC ADA
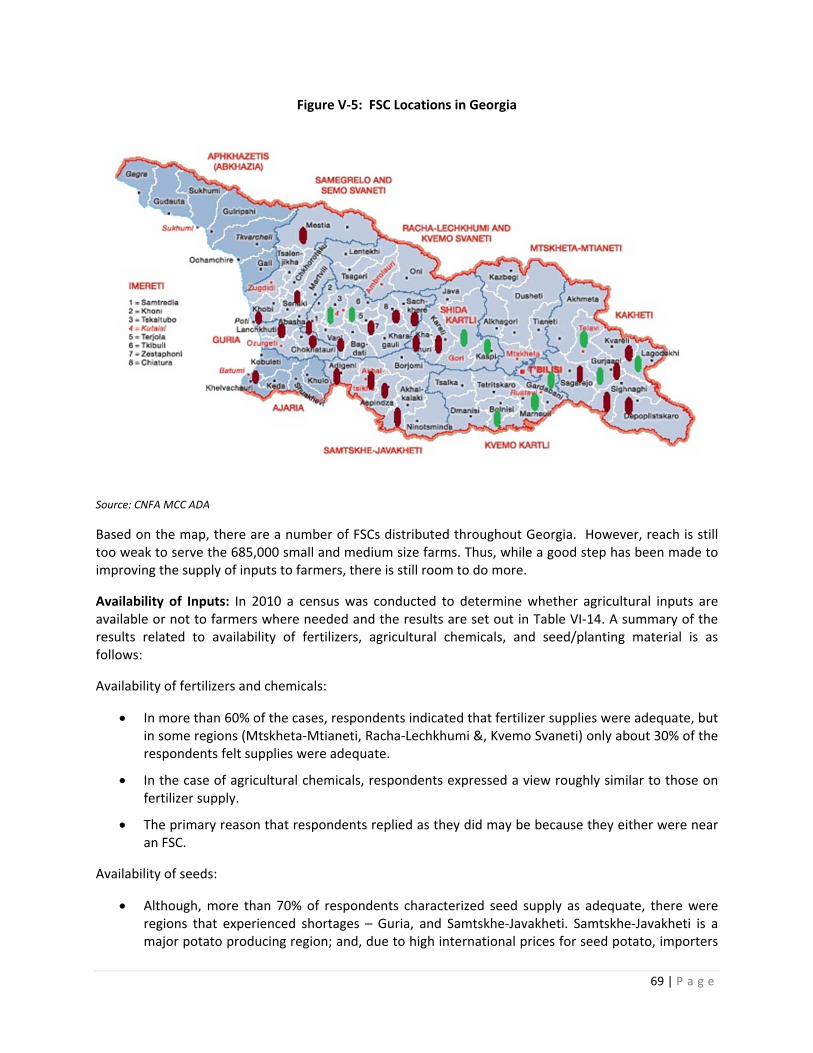
69 | P a g e
Figure V‐5: FSC Locations in Georgia
Source: CNFA MCC ADA
Based on the map, there are a number of FSCs distributed throughout Georgia. However, reach is still too weak to serve the 685,000 small and medium size farms. Thus, while a good step has been made to improving the supply of inputs to farmers, there is still room to do more.
Availability of Inputs: In 2010 a census was conducted to determine whether agricultural inputs are available or not to farmers where needed and the results are set out in Table VI‐14. A summary of the results related to availability of fertilizers, agricultural chemicals, and seed/planting material is as follows:
Availability of fertilizers and chemicals:
In more than 60% of the cases, respondents indicated that fertilizer supplies were adequate, but in some regions (Mtskheta‐Mtianeti, Racha‐Lechkhumi &, Kvemo Svaneti) only about 30% of the respondents felt supplies were adequate.
In the case of agricultural chemicals, respondents expressed a view roughly similar to those on fertilizer supply.
The primary reason that respondents replied as they did may be because they either were near an FSC.
Availability of seeds:
Although, more than 70% of respondents characterized seed supply as adequate, there were regions that experienced shortages – Guria, and Samtskhe‐Javakheti. Samtskhe‐Javakheti is a major potato producing region; and, due to high international prices for seed potato, importers
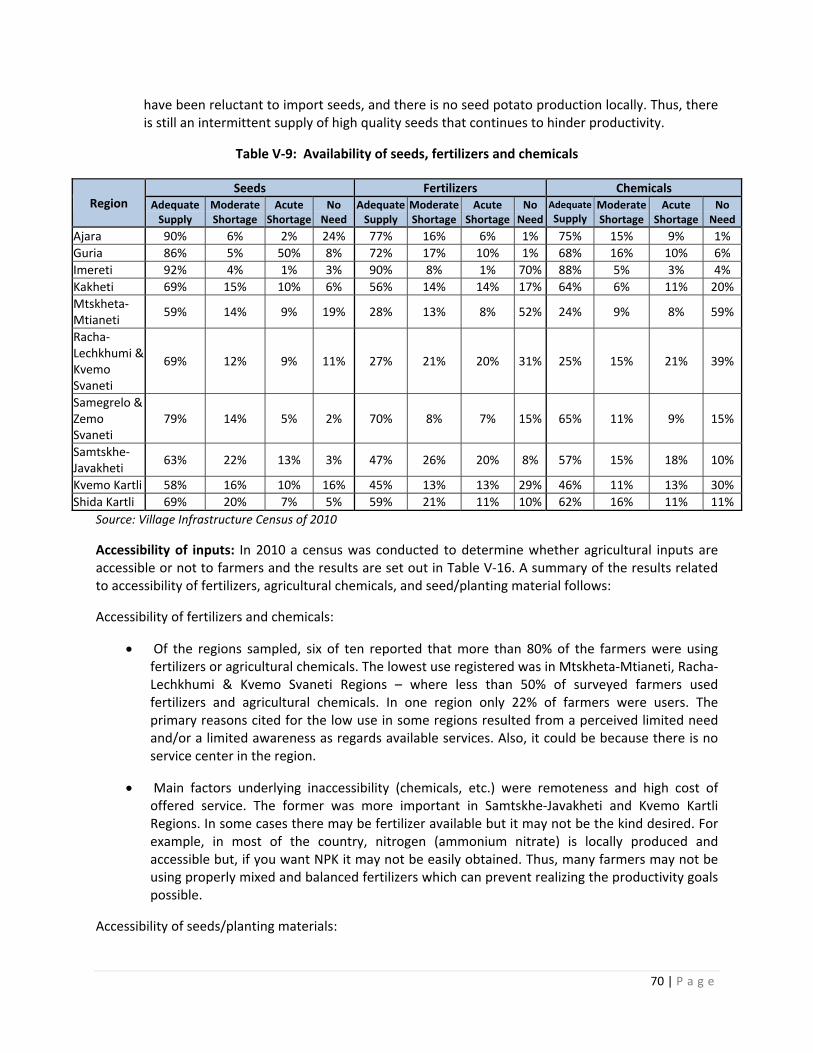
70 | P a g e
have been reluctant to import seeds, and there is no seed potato production locally. Thus, there is still an intermittent supply of high quality seeds that continues to hinder productivity.
Table V‐9: Availability of seeds, fertilizers and chemicals
Region Seeds Fertilizers Chemicals
Adequate Supply
Moderate Shortage
Acute Shortage
No Need
Adequate Supply
ModerateShortage
Acute Shortage
No Need
Adequate
Supply Moderate Shortage
Acute Shortage
No Need
Ajara 90% 6% 2% 24% 77% 16% 6% 1% 75% 15% 9% 1%
Guria 86% 5% 50% 8% 72% 17% 10% 1% 68% 16% 10% 6%
Imereti 92% 4% 1% 3% 90% 8% 1% 70% 88% 5% 3% 4%
Kakheti 69% 15% 10% 6% 56% 14% 14% 17% 64% 6% 11% 20%
Mtskheta‐Mtianeti
59% 14% 9% 19% 28% 13% 8% 52% 24% 9% 8% 59%
Racha‐Lechkhumi & Kvemo Svaneti
69% 12% 9% 11% 27% 21% 20% 31% 25% 15% 21% 39%
Samegrelo & Zemo Svaneti
79% 14% 5% 2% 70% 8% 7% 15% 65% 11% 9% 15%
Samtskhe‐Javakheti
63% 22% 13% 3% 47% 26% 20% 8% 57% 15% 18% 10%
Kvemo Kartli 58% 16% 10% 16% 45% 13% 13% 29% 46% 11% 13% 30%
Shida Kartli 69% 20% 7% 5% 59% 21% 11% 10% 62% 16% 11% 11%
Source: Village Infrastructure Census of 2010
Accessibility of inputs: In 2010 a census was conducted to determine whether agricultural inputs are accessible or not to farmers and the results are set out in Table V‐16. A summary of the results related to accessibility of fertilizers, agricultural chemicals, and seed/planting material follows:
Accessibility of fertilizers and chemicals:
Of the regions sampled, six of ten reported that more than 80% of the farmers were using fertilizers or agricultural chemicals. The lowest use registered was in Mtskheta‐Mtianeti, Racha‐Lechkhumi & Kvemo Svaneti Regions – where less than 50% of surveyed farmers used fertilizers and agricultural chemicals. In one region only 22% of farmers were users. The primary reasons cited for the low use in some regions resulted from a perceived limited need and/or a limited awareness as regards available services. Also, it could be because there is no service center in the region.
Main factors underlying inaccessibility (chemicals, etc.) were remoteness and high cost of offered service. The former was more important in Samtskhe‐Javakheti and Kvemo Kartli Regions. In some cases there may be fertilizer available but it may not be the kind desired. For example, in most of the country, nitrogen (ammonium nitrate) is locally produced and accessible but, if you want NPK it may not be easily obtained. Thus, many farmers may not be using properly mixed and balanced fertilizers which can prevent realizing the productivity goals possible.
Accessibility of seeds/planting materials:
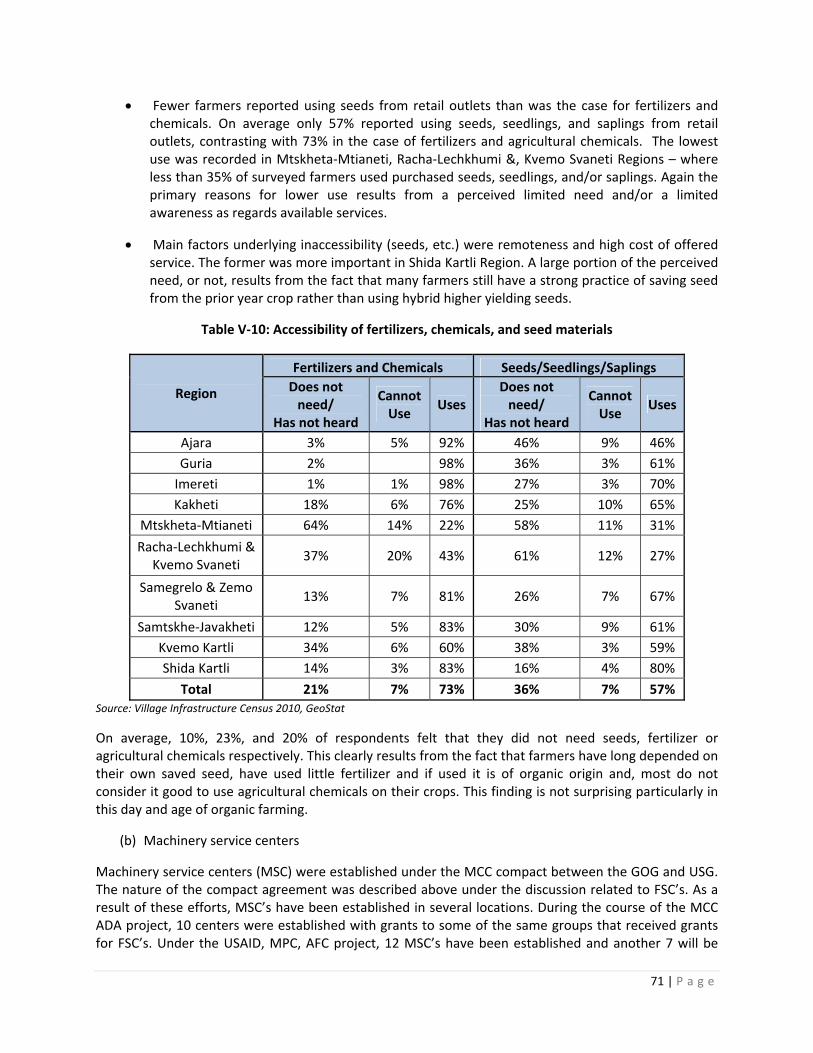
71 | P a g e
Fewer farmers reported using seeds from retail outlets than was the case for fertilizers and chemicals. On average only 57% reported using seeds, seedlings, and saplings from retail outlets, contrasting with 73% in the case of fertilizers and agricultural chemicals. The lowest use was recorded in Mtskheta‐Mtianeti, Racha‐Lechkhumi &, Kvemo Svaneti Regions – where less than 35% of surveyed farmers used purchased seeds, seedlings, and/or saplings. Again the primary reasons for lower use results from a perceived limited need and/or a limited awareness as regards available services.
Main factors underlying inaccessibility (seeds, etc.) were remoteness and high cost of offered service. The former was more important in Shida Kartli Region. A large portion of the perceived need, or not, results from the fact that many farmers still have a strong practice of saving seed from the prior year crop rather than using hybrid higher yielding seeds.
Table V‐10: Accessibility of fertilizers, chemicals, and seed materials
Region
Fertilizers and Chemicals Seeds/Seedlings/Saplings
Does not need/
Has not heard
Cannot Use
UsesDoes not need/
Has not heard
Cannot Use
Uses
Ajara 3% 5% 92% 46% 9% 46%
Guria 2% 98% 36% 3% 61%
Imereti 1% 1% 98% 27% 3% 70%
Kakheti 18% 6% 76% 25% 10% 65%
Mtskheta‐Mtianeti 64% 14% 22% 58% 11% 31%
Racha‐Lechkhumi & Kvemo Svaneti
37% 20% 43% 61% 12% 27%
Samegrelo & Zemo Svaneti
13% 7% 81% 26% 7% 67%
Samtskhe‐Javakheti 12% 5% 83% 30% 9% 61%
Kvemo Kartli 34% 6% 60% 38% 3% 59%
Shida Kartli 14% 3% 83% 16% 4% 80%
Total 21% 7% 73% 36% 7% 57% Source: Village Infrastructure Census 2010, GeoStat
On average, 10%, 23%, and 20% of respondents felt that they did not need seeds, fertilizer or agricultural chemicals respectively. This clearly results from the fact that farmers have long depended on their own saved seed, have used little fertilizer and if used it is of organic origin and, most do not consider it good to use agricultural chemicals on their crops. This finding is not surprising particularly in this day and age of organic farming.
(b) Machinery service centers
Machinery service centers (MSC) were established under the MCC compact between the GOG and USG. The nature of the compact agreement was described above under the discussion related to FSC’s. As a result of these efforts, MSC’s have been established in several locations. During the course of the MCC ADA project, 10 centers were established with grants to some of the same groups that received grants for FSC’s. Under the USAID, MPC, AFC project, 12 MSC’s have been established and another 7 will be
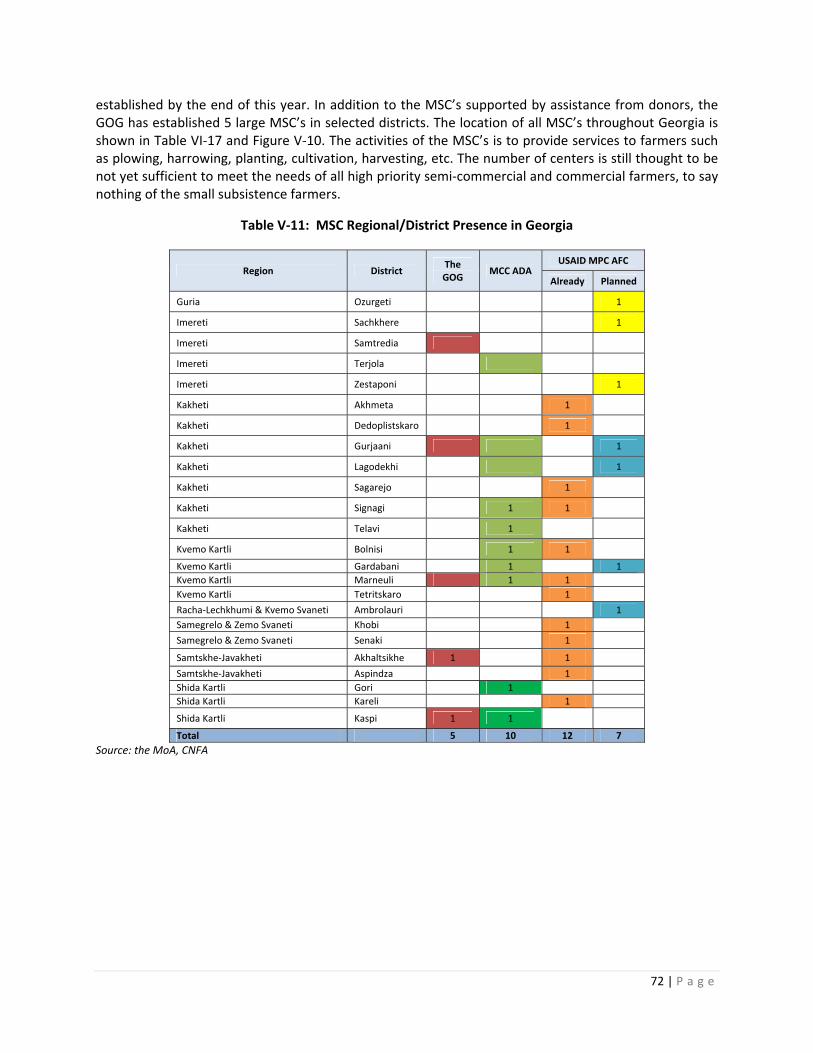
72 | P a g e
established by the end of this year. In addition to the MSC’s supported by assistance from donors, the GOG has established 5 large MSC’s in selected districts. The location of all MSC’s throughout Georgia is shown in Table VI‐17 and Figure V‐10. The activities of the MSC’s is to provide services to farmers such as plowing, harrowing, planting, cultivation, harvesting, etc. The number of centers is still thought to be not yet sufficient to meet the needs of all high priority semi‐commercial and commercial farmers, to say nothing of the small subsistence farmers.
Table V‐11: MSC Regional/District Presence in Georgia
Region District The GOG
MCC ADA USAID MPC AFC
Already Planned
Guria Ozurgeti 1
Imereti Sachkhere 1
Imereti Samtredia 1
Imereti Terjola 1
Imereti Zestaponi 1
Kakheti Akhmeta 1
Kakheti Dedoplistskaro 1
Kakheti Gurjaani 1 1 1
Kakheti Lagodekhi 1 1
Kakheti Sagarejo 1
Kakheti Signagi 1 1
Kakheti Telavi 1
Kvemo Kartli Bolnisi 1 1
Kvemo Kartli Gardabani 1 1
Kvemo Kartli Marneuli 1 1 1
Kvemo Kartli Tetritskaro 1
Racha‐Lechkhumi & Kvemo Svaneti Ambrolauri 1
Samegrelo & Zemo Svaneti Khobi 1
Samegrelo & Zemo Svaneti Senaki 1
Samtskhe‐Javakheti Akhaltsikhe 1 1
Samtskhe‐Javakheti Aspindza 1
Shida Kartli Gori 1
Shida Kartli Kareli 1
Shida Kartli Kaspi 1 1
Total 5 10 12 7
Source: the MoA, CNFA
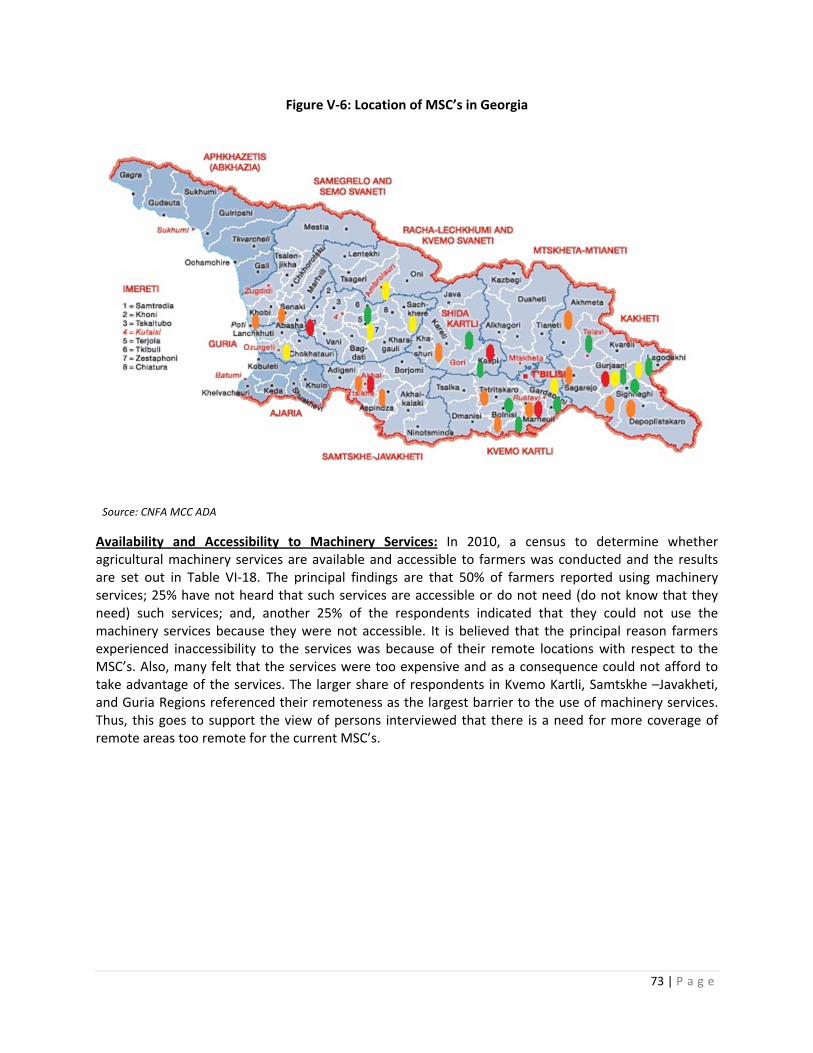
73 | P a g e
Figure V‐6: Location of MSC’s in Georgia
Source: CNFA MCC ADA
Availability and Accessibility to Machinery Services: In 2010, a census to determine whether agricultural machinery services are available and accessible to farmers was conducted and the results are set out in Table VI‐18. The principal findings are that 50% of farmers reported using machinery services; 25% have not heard that such services are accessible or do not need (do not know that they need) such services; and, another 25% of the respondents indicated that they could not use the machinery services because they were not accessible. It is believed that the principal reason farmers experienced inaccessibility to the services was because of their remote locations with respect to the MSC’s. Also, many felt that the services were too expensive and as a consequence could not afford to take advantage of the services. The larger share of respondents in Kvemo Kartli, Samtskhe –Javakheti, and Guria Regions referenced their remoteness as the largest barrier to the use of machinery services. Thus, this goes to support the view of persons interviewed that there is a need for more coverage of remote areas too remote for the current MSC’s.
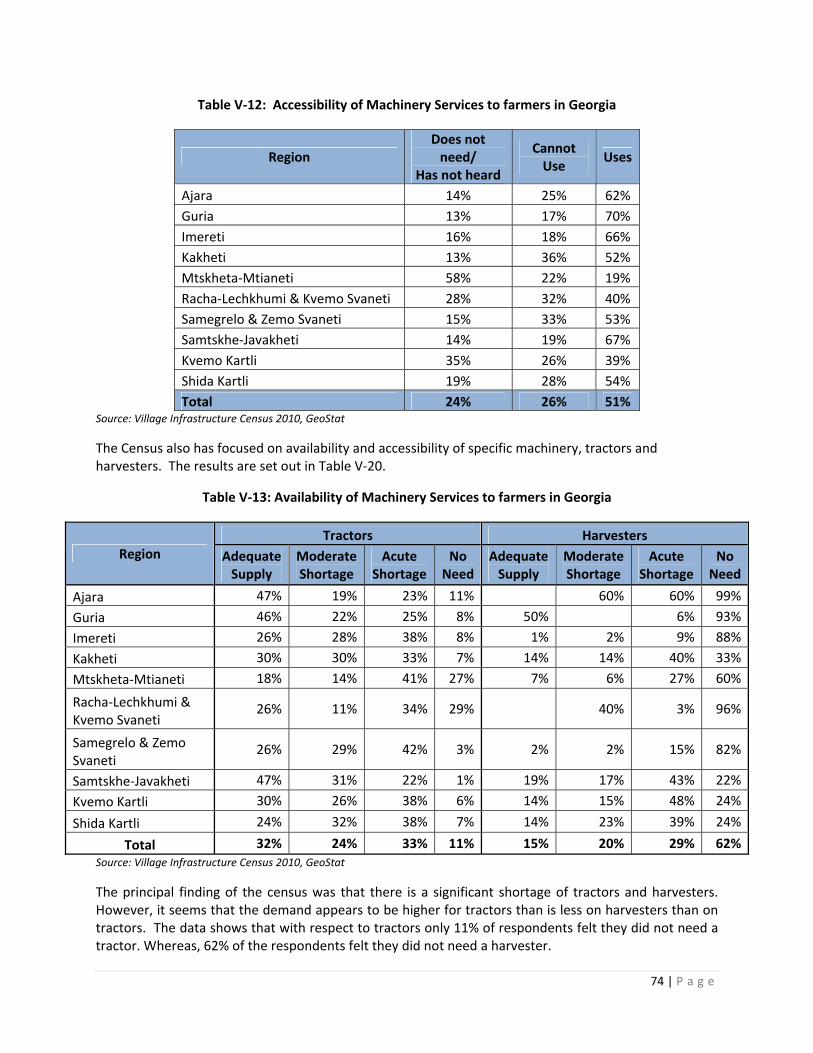
74 | P a g e
Table V‐12: Accessibility of Machinery Services to farmers in Georgia
Region Does not need/
Has not heard
Cannot Use
Uses
Ajara 14% 25% 62%
Guria 13% 17% 70%
Imereti 16% 18% 66%
Kakheti 13% 36% 52%
Mtskheta‐Mtianeti 58% 22% 19%
Racha‐Lechkhumi & Kvemo Svaneti 28% 32% 40%
Samegrelo & Zemo Svaneti 15% 33% 53%
Samtskhe‐Javakheti 14% 19% 67%
Kvemo Kartli 35% 26% 39%
Shida Kartli 19% 28% 54%
Total 24% 26% 51% Source: Village Infrastructure Census 2010, GeoStat
The Census also has focused on availability and accessibility of specific machinery, tractors and harvesters. The results are set out in Table V‐20.
Table V‐13: Availability of Machinery Services to farmers in Georgia
Region
Tractors Harvesters
Adequate Supply
ModerateShortage
Acute Shortage
No Need
Adequate Supply
Moderate Shortage
Acute Shortage
No Need
Ajara 47% 19% 23% 11% 60% 60% 99%
Guria 46% 22% 25% 8% 50% 6% 93%
Imereti 26% 28% 38% 8% 1% 2% 9% 88%
Kakheti 30% 30% 33% 7% 14% 14% 40% 33%
Mtskheta‐Mtianeti 18% 14% 41% 27% 7% 6% 27% 60%
Racha‐Lechkhumi & Kvemo Svaneti
26% 11% 34% 29% 40% 3% 96%
Samegrelo & Zemo Svaneti
26% 29% 42% 3% 2% 2% 15% 82%
Samtskhe‐Javakheti 47% 31% 22% 1% 19% 17% 43% 22%
Kvemo Kartli 30% 26% 38% 6% 14% 15% 48% 24%
Shida Kartli 24% 32% 38% 7% 14% 23% 39% 24%
Total 32% 24% 33% 11% 15% 20% 29% 62%Source: Village Infrastructure Census 2010, GeoStat
The principal finding of the census was that there is a significant shortage of tractors and harvesters. However, it seems that the demand appears to be higher for tractors than is less on harvesters than on tractors. The data shows that with respect to tractors only 11% of respondents felt they did not need a tractor. Whereas, 62% of the respondents felt they did not need a harvester.
75 | P a g e
Findings from interviews with relevant informants confirm results of the census. During those times of the year when demand peaks (planting / land prep and harvest), demand is high. It was reported that at some of the MSC’s it is not uncommon to find farmers waiting 15 days or more before they can have their fields plowed or worked in other ways. This is not acceptable because agriculture is time and season sensitive and if fields are not prepared in a timely way it could have significant impacts on yields and farm profitability. This is a difficult problem to solve because all famers want their lands prepared at the same time, planted at the same time, and harvested at the same time. To build up the capacity of service centers to meet these peak needs requires a substantial investment in equipment, which and this equipment will stand idle for part much of the year. One Thus, one means for getting around part of this problem might be to have equipment that farmers, especially small farmers, can rent and use among themselves. Also, finance programs for larger farmers might be strengthened so that these farmers can buy their own equipment.
Another problem mentioned in relation to availability of equipment is the lack of certain types of specialty equipment used for vegetable production (garlic, onions, beans, etc.) and fruit including vineyard care and management. While this is a problem, it has already been acknowledged and it is expected that the specialized equipment/implements tailored for vegetable production will be included in the equipment purchases of several MSCs in the coming year.
iii. Veterinary Services Professional services purchased from the private sector will become increasingly important to the Georgian food and agriculture sector including the government itself. For example, companies may provide soil testing for a fee. Others may enter the business of charging for the monitoring and treatment of pest conditions in crops (known in the USA as “crop consultants”). In some small way there may be more agriculturalists providing advice as private extension experts. Further, the most advanced farmers – those with adequate funds – will turn increasingly to private veterinarians. Yet in most, if not all, of these areas, there is no way to determine if a person being hired is truly qualified because the certification requirement for private veterinarians was abolished recently, enabling any graduate from university to qualify as a veterinarian.
In the case of veterinarians, a decision was made a few years ago to privatize certain veterinary services previously provided by the Ministry of Agriculture directly. With the decision to provide certain veterinary services privately, there are still services that the relatively newly established National Food Agency monitors. 12 At the present time, NFA is still to clarify public and versus private roles, with a specific eye to EU‐driven food safety standards. For example, the NFA recently implemented regulations that require veterinarians be based in state slaughterhouses in Tbilisi, paid by the business operator. The operators of the slaughterhouses are responsible for ensuring that inspections are carried‐out within their premises but, the NFA reserves the right to carry out inspections. This system started in Tbilisi, but will be expanded to the rest of the country. The NFA started with the new regulations in the meat sector and plan to broaden it to the dairy sector next. Also, NFA carries‐out registration of imported or locally produced veterinary medicine, renewed registration, annulment of registration and/or quality/safety control. The registration of veterinary medicine through the Recognition Regime is used for specific
12 The National Food Agency is the Legal Entity under the Public Law of the Ministry of Agriculture of Georgia that is established on the basis of Georgian Law on Food Safety and Quality. The Agency has been transformed into legal entity under the public law since 3 January of 2011.
76 | P a g e
veterinary medicines allowed on the market by the Regulatory Authority of the other Country or Interstates.
Currently private veterinarians are contracted to implement the government‐funded livestock vaccination programs. Other services that the NFA might use private veterinarian assistance on are presently being investigated. It appears however, that the NFA will need to maintain a staff of veterinarians to carry‐out various monitoring and inspections services. Apparently the NFA will have the sole responsibility for food safety, excluding border control, which was transferred to the Customs Department of the Ministry of Finance for a trial period. Once staffing is completed, appropriate training, adequate funding, facilities, and equipment, effective management, governmental support, and appropriate risk‐based assessments will be required for the new system to be a success. Responsibilities versus those of the in these efforts the USDA has been supporting development of the private veterinary sector in Georgia but, much more needs to be done on this front.
Disease control is another major focus of the NFA. There are currently state veterinary programs that aim to address five major diseases as follows: anthrax, rabies, brucellosis, tuberculosis, and FMD. In case of rabies, NFA administers vaccination programs, and in case of brucellosis tests are carried out. Reportedly, with USDA support, NFA has developed a monitoring plan for brucellosis. In the case of FMD, NFA supports implementation of the EU FMD program that considers establishment of a buffer zone in the south of the country in the framework of the regional program covering Georgia, Azerbaijan, Armenia, and Turkey. The EU has helped NFA to procure vaccines from an OIE recommended facility in Russia. In the case of Anthrax and other remaining diseases, the NFA policy is to work to get farmers to take responsibility for the health condition of their animals – both to prevent disease in the animals but, also in them. Prices of vaccines and pharmaceuticals are generally considered to be affordable in Georgia.
According to a village Infrastructure Census (2010) the majority of the rural population uses locally available veterinary services (see Table VI‐21). The largest percentages of population who either has not heard or does not need veterinary services were recorded in Kakheti (14%), Mtskheta‐Mtianeti (17%), and Kvemo Kartli (10%). In some regions (Kakheti, Racha‐Lechkhumi, Mtskheta‐Mtianeti, Kvemo Kartli and Samegrelo‐Zemo Svaneti) there are a significant proportion of livestock owners who cannot access locally available veterinary services. Two main reasons of inaccessibility are remoteness and high cost of provided services. Of these, the former was identified as a main reason for inaccessibility in all surveyed regions. This provides a picture into the limited presence of veterinary services in particular areas of the country.

77 | P a g e
Table V‐14: Availability and Accessibility to Local Veterinary Service Centers
Region Does not need/ Has not heard
Cannot Use Uses
Ajara 2% 6% 93%
Guria 3% 13% 84%
Imereti 2% 8% 90%
Kakheti 14% 43% 43%
Mtskheta‐Mtianeti 17% 25% 58%
Racha‐Lechkhumi & Kvemo Svaneti 8% 32% 59%
Samegrelo & Zemo Svaneti 4% 16% 80%
Samtskhe‐Javakheti 4% 9% 87%
Kvemo Kartli 10% 24% 66%
Shida Kartli 6% 10% 84%
Total 7% 18% 75%
Source: Village Infrastructure Census (2010), GeoStat
The Opportunity: While improvements can still be made, many have been made and farmers can obtain needed inputs if they really want them and have money. Significant progress has been made to improve the availability and access of agricultural fertilizers, pesticides, herbicides, fungicides, seeds, etc. via the FSC’s and machinery services such as land preparation, cultivation and harvesting via the MSC’s that were established by MCC, USAID and the GOG throughout several key agricultural areas of the country. Also, efforts are underway via USDA assistance to help the GOG establish a reliable veterinary service both via the GOG and via private sector service. To help ensure that the inputs and services for current and future needs of the farmers of all size continue to be strengthened some support strategies to take would offer opportunity.
Continue to implement and strengthen the activities of FSC’s of MSC’s to ensure services reach the farmers that offer the greatest potential for increasing agricultural output in the country and continue to serve the needs of the many smaller farmers. This involves targeting of new centers, and promoting the expansion of services in existing FSCs and MSCs. One additional service that should be provided via the centers is extension advice.
Promote more competition between suppliers of fertilizers, agricultural chemicals and other inputs to encourage lower prices to farmers and help to improve yields and the competitiveness of farmers.
Support EU led veterinary and other food safety service suggested programs. As Georgia aspires to a full trading relationship with the EU, specific food safety and quality standards need to be met. The EU is pushing‐forward a number of initiatives on this front, and could benefit from cooperation and support on behalf of USAID and other donors. One relevant area for support might be training / TA to firms in food safety compliance standards and practices.
78 | P a g e
F. Markets and Trade
The world economy in recent years has experienced turbulent times as a result of an international financial crisis brought about by global financial imbalances, a housing market crash in the United States, high oil prices worldwide; and, several weak economies in the EU. All this has led to a decline in consumer spending in many of the worlds developed economies. On the other hand the newer global economic stars of China, India and, to a lesser degree, Brazil along with recovering Asian tiger countries have shown signs of economic stability and strength. Also, the Middle East, Venezuela, Indonesia, Russia, and some of the Central Asian republics have experienced growth.
In spite of recent weakness, world food consumption is expected to double by the year 2050. This growth will be largely in the developing countries, especially China, India, South Asia, and certain of the more progressive Latin American nations. Demand will be driven by increases in the number of people in these countries and by a return to strong growth in their personal incomes. However, those developing countries without progressive governments or without political stability will not exhibit such increases in demand. In such countries, many of these in Africa and some in Latin America and the Caribbean, increases in demand will be primarily for basic foodstuffs (grains, oils and the like) roughly proportional to population increases. Unfortunately, for some of these countries, where economic growth does not keep pace with population, there may well be a decline in demand.
While basic foodstuffs (grains, vegetable oils, and the like) will experience steady growth, the largest percentage growth in both demand and value will be in higher value products such fruits, vegetables, and nuts. Once again, for these products there will be a higher growth rate among the economically progressive developing countries than in the more stable developed markets. Thus, it is believed that good opportunities, and indeed strong growth, will exist for agriculture in the years ahead.
To support effective marketing and trade as worldwide food demand increases it is necessary to have a functioning post‐harvest handling infrastructure and a market information system that provides farmers, wholesalers, retailers and others along the market chain with technical and market information needed to help them effectively serve market opportunities that exist. To use resources spent on the development of the agricultural sector effectively, it will require timely access to the right information. Presently that access in Georgia does not exist, at least not on a widespread basis. For Georgia to play its part in helping to serve the expected demand for food worldwide, several constraints that impede its ability to serve markets will need to be corrected:
A major shortage of post‐harvest handling facilities (storage, packing, grading, sorting, etc.);
Lack of wholesale market consolidation centers;
Rural farm roads in disrepair;
Lack of functioning market information system (technical, market development, market pricing);
Weak strategic targeting, intelligence gathering and long‐term investment in new markets; and
High distribution costs, associated with poor infrastructure and limited transport sector competition.
Ways by which each of these items represents a constraint are discussed below.
79 | P a g e
1. A major shortage of post‐harvest handling facilities (storage, packing, grading, sorting, etc.) prevents farmers from being able to store their products in facilities where they can be sorted, graded, packed and readied for shipment to markets in the form and according to the standards that markets expect. Presently the infrastructure that existed during Soviet times to serve markets is largely obsolete or destroyed, requiring replacement. Farmers and traders indicated that dry storage facilities do not exist in sufficient quantity to support the grain sector, and that cold storage facilities required are not effectively used by farmers and traders to handle a growing supply of fruits and vegetable for fresh markets. Also, because there are large numbers of small subsistence and semi‐commercial farmers with fewer than five hectares, it is necessary to help groups that manage post‐harvest handling infrastructure assembles the commodities to storage facilities where it can be readied for markets.
2. The lack of wholesale market consolidation centers in appropriate locations throughout the country is a constraint to developing trade. Farmers need a place (wholesale market) where they can bring their products for sale and receive fair prices. Traders need a place (wholesale market) where they can buy products needed at fair prices in quantities large enough to permit efficient sales to domestic or international markets. Without wholesale market consolidation centers where products can be sold and/or bought on a transparent basis a substantial barrier exists and it constrains the industry’s ability to develop markets nationally and internationally.
3. Rural farm roads in disrepair prevent farmers from bringing their products to market centers for sale. Also, poor transportation makes it difficult to bring product (particularly perishables) to market without high levels of damage that diminish product quality. Thus, as long as the roads are poor they will impede the delivery of high quality product to markets.
4. The lack of a functioning market information system (technical, market development, market pricing) makes it very difficult for farmers and traders to know what and how to produce and/or market products to their best advantage. And, at present technical and market information useful to Georgian agricultural and agribusiness participants is nearly non‐existent. The correction of this situation would go far to help build both domestic and international trade and increase revenues.
5. Strategic targeting, intelligence gathering and, long‐term investment in new markets is very weak at the moment. To develop the agricultural sector it is necessary to develop markets for products Georgia has to sell and/or identify the products Georgian producers should produce to meet the needs of attractive markets. Some of this kind of work has been done for the wine sector but, there is a lack of this kind of Market Development work for other commodities and it is a constraint to building trade for Georgian products.
6. High distribution costs associated with poor infrastructure and limited transport sector competition results in a situation where the cost of getting the product from the field to the market is high cost and possibly uncompetitive when compared to similar product moving to market from competing countries. In fact, exporting product via container from Georgia via Poti port to Ilyichevsk, Ukraine is estimated to cost $1,950; while from Turkey to Ilyichevsk it cost $800. This puts Georgia at a definite disadvantage.
The Challenge: In regards to marketing and trade related to Georgia’s agricultural sector as the country moves forward relates to the availability of market information and the promotion of new markets. To ensure meeting market demands and support for farmers it is necessary to have an adequate post‐
80 | P a g e
harvest handling system that includes available and adequate dry storage and cold storage to handle grains, fruits, vegetable, and processed products. It includes having a reliable transportation system and a useful market information system that provides technical and market information to farmers and players along the market chain from farmer to consumer. It also includes having promotion mechanisms in place to identify markets where Georgian products can be promoted and sold. The analysis of these marketing and trade function areas spelled‐out several constraints which included those mentioned above and are addressed one‐by‐one in the following sub‐sections:
i. Post‐harvest Handling As worldwide food demand increases, it is necessary to have a functioning post‐harvest handling infrastructure and a market information system that provides farmers, wholesalers, retailers and others along the market chain with technical and market information needed to help them effectively respond to opportunities that exist. A key to improving post‐harvest handling involves three key support structures – storage facilities, packing and handling operations, and effective distribution mechanisms. Each of these structures is discussed in this section.
(a) Storage, Sorting and, Packing facilities
Georgian farmers, wholesalers, exporters and others familiar with the agricultural sector in Georgia frequently complain about the adequacy of storage facilities. The problem is evident for both for dry storage (flat and silo type for grains) and for cold storage. In any event the lack of reliable storage prevents farmers from being able to store their products in facilities where they can be sorted, graded, packed and readied for shipment to markets in the form and according to the standards that markets expect.
(b) Dry Storage
During the Soviet period, flat and silo storage both existed for handling products that were processed and handled in warehouses (canned, bottled, and bagged) dry goods; and, for grains (wheat, corn, sunflower, etc.) that required silo type storage which allowed for effective aeration of the grain during storage. However, since the break‐up of the Soviet Union many of these facilities have been allowed to run down and deteriorate. In some cases the facilities have been pilfered and demolished, some have been refurbished for uses outside of agriculture, and still others have been abandoned and are decaying into conditions that prevent rehabilitation, particularly true for much of the flat storage. Grain silo storage during the Soviet times totaled a capacity of 1.1 million metric tons. Today, of this capacity, about 566,000 tons is being used after having been rehabilitated. During Soviet times nearly every district had an elevator but, much of this capacity, if not destroyed, is in poor condition and not useful as storage, meaning that that only 566,000 MT remains in use. Much of this functioning storage is under the control of millers and, they have been refurbishing it for use in handling imported grains, principally wheat and other food grains. For example, one of the largest grain storage facilities, located in the village of Kachreti, was recently bought by a milling firm that controls 40% of the flour milling business in the country. This facility is old and needs substantial repair but, via the help of this company the facility will likely be, at least partially, brought back on stream and serve the domestic and import needs for grain storage. During the past year the GOG via GAC has initiated and completed construction of grain storage facilities in the Kakheti region at Lagodekhi and Abasha. At each of these locations a 75,000 metric ton facility has been completed and they were brought into operation in October of 2011. As GAC expands its activities more such facilities may be opened.
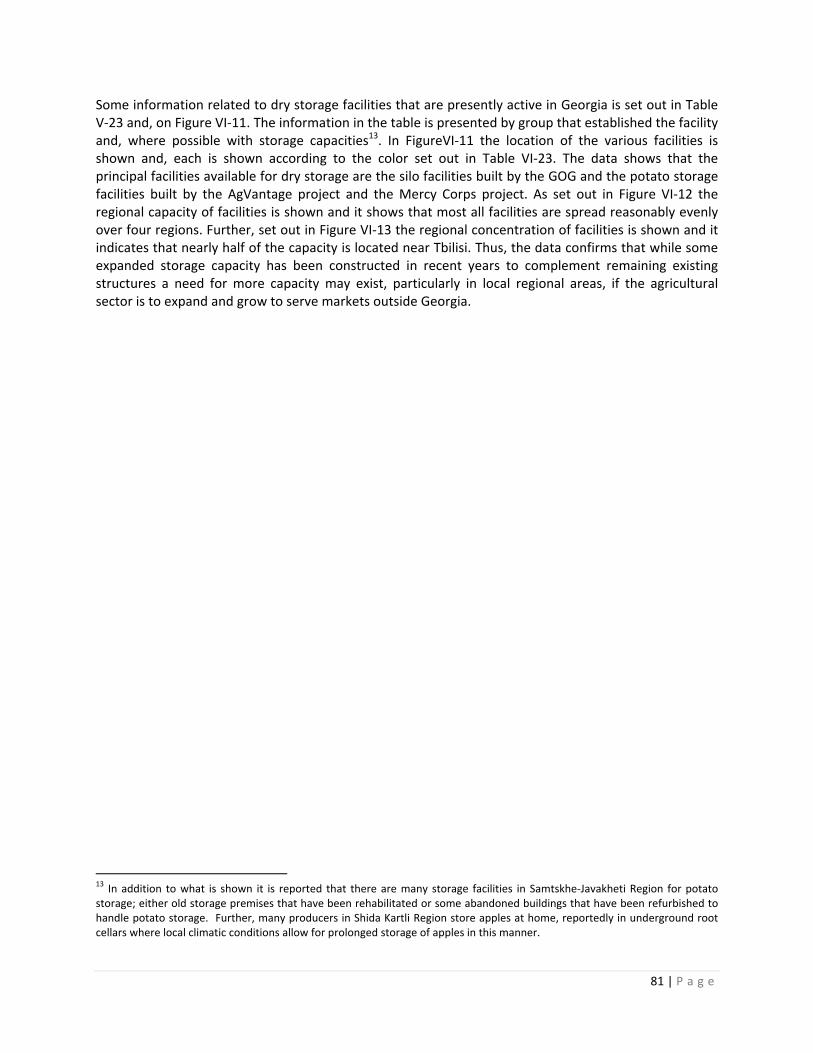
81 | P a g e
Some information related to dry storage facilities that are presently active in Georgia is set out in Table V‐23 and, on Figure VI‐11. The information in the table is presented by group that established the facility and, where possible with storage capacities13. In FigureVI‐11 the location of the various facilities is shown and, each is shown according to the color set out in Table VI‐23. The data shows that the principal facilities available for dry storage are the silo facilities built by the GOG and the potato storage facilities built by the AgVantage project and the Mercy Corps project. As set out in Figure VI‐12 the regional capacity of facilities is shown and it shows that most all facilities are spread reasonably evenly over four regions. Further, set out in Figure VI‐13 the regional concentration of facilities is shown and it indicates that nearly half of the capacity is located near Tbilisi. Thus, the data confirms that while some expanded storage capacity has been constructed in recent years to complement remaining existing structures a need for more capacity may exist, particularly in local regional areas, if the agricultural sector is to expand and grow to serve markets outside Georgia.
13 In addition to what is shown it is reported that there are many storage facilities in Samtskhe‐Javakheti Region for potato storage; either old storage premises that have been rehabilitated or some abandoned buildings that have been refurbished to handle potato storage. Further, many producers in Shida Kartli Region store apples at home, reportedly in underground root cellars where local climatic conditions allow for prolonged storage of apples in this manner.
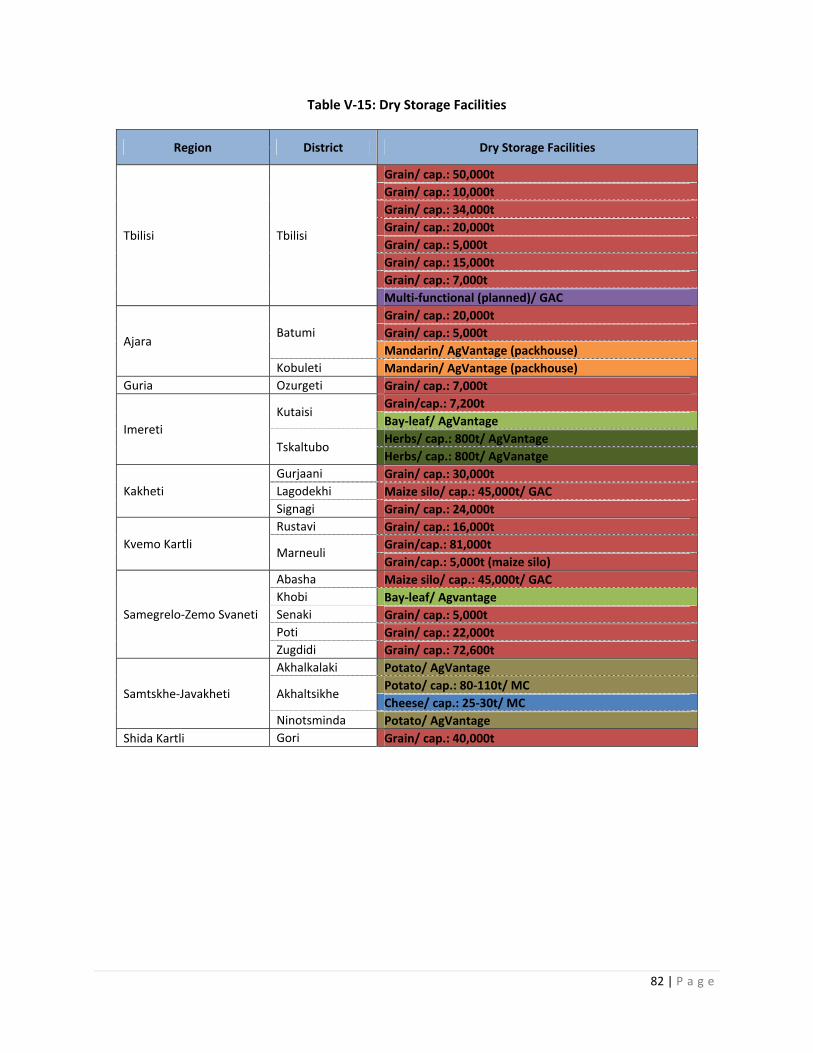
82 | P a g e
Table V‐15: Dry Storage Facilities
Region District Dry Storage Facilities
Tbilisi Tbilisi
Grain/ cap.: 50,000t
Grain/ cap.: 10,000t
Grain/ cap.: 34,000t
Grain/ cap.: 20,000t
Grain/ cap.: 5,000t
Grain/ cap.: 15,000t
Grain/ cap.: 7,000t
Multi‐functional (planned)/ GAC
Ajara Batumi
Grain/ cap.: 20,000t
Grain/ cap.: 5,000t
Mandarin/ AgVantage (packhouse)
Kobuleti Mandarin/ AgVantage (packhouse)
Guria Ozurgeti Grain/ cap.: 7,000t
Imereti
Kutaisi Grain/cap.: 7,200t
Bay‐leaf/ AgVantage
Tskaltubo Herbs/ cap.: 800t/ AgVantage
Herbs/ cap.: 800t/ AgVanatge
Kakheti
Gurjaani Grain/ cap.: 30,000t
Lagodekhi Maize silo/ cap.: 45,000t/ GAC
Signagi Grain/ cap.: 24,000t
Kvemo Kartli
Rustavi Grain/ cap.: 16,000t
Marneuli Grain/cap.: 81,000t
Grain/cap.: 5,000t (maize silo)
Samegrelo‐Zemo Svaneti
Abasha Maize silo/ cap.: 45,000t/ GAC
Khobi Bay‐leaf/ Agvantage
Senaki Grain/ cap.: 5,000t
Poti Grain/ cap.: 22,000t
Zugdidi Grain/ cap.: 72,600t
Samtskhe‐Javakheti
Akhalkalaki Potato/ AgVantage
Akhaltsikhe Potato/ cap.: 80‐110t/ MC
Cheese/ cap.: 25‐30t/ MC
Ninotsminda Potato/ AgVantage
Shida Kartli Gori Grain/ cap.: 40,000t

83 | P a g e
Figure V‐7: Dry Storage Facilities Regional Presence
Figure V‐8: Grain Storage Regional Capacity
Capacity, Tbilisi,
25%, 25%
Capacity, Kvemo Kartli,
18%, 18%
Capacity, Kakheti,
17%, 18%
Capacity, Shida Kartli, 7%, 7%
Capacity, Imereti, 1%,
1%
Capacity, Samegrelo-
Zemo Svaneti, 26%, 26%
Capacity, Guria, 1%, 1%
Capacity, Ajara, 4%, 4%
84 | P a g e
Figure V‐9: Grain Storage Regional Concentration
(c) Cold Storage:
In recent years cold storage capacity has been added in Georgia, and there are questions as to how much carrying capacity Georgia currently has. This is largely based on the fact that you still have many small corner store shops that do not have the facilities to handle cold store or frozen products. Most corner stores only have a root cellar where they can store potatoes, beets, carrots, apples, and similar commodities that do not need modern cold storage facilities. These corner stores do not really have capacity to handle the more perishable fruits and vegetables. Also, there are still many households that do not have capacity to handle cold product, particularly frozen product. Thus, the infrastructure domestically is not a strong support to the development of an efficient cold storage sector.
Further, with the large number of small farmers who do not produce sufficient quantities of product to assemble shipments large enough to be of interest to a cold store operator the cold store operator has to spend an inordinate amount of time working to assemble product from the farmers. Thus, carrying‐out these dealings with many small farmers is a barrier. If the small farmers producing fruits and vegetables could be organized into effective marketing groups (perhaps agricultural cooperatives) it would facilitate both the effective use of cold storage facilities and the development of international markets for their products.
It is evident that cold storage facility owners have been experiencing problems with meeting their capacities, and have not been able to operate as effectively as they should to help the industry meet its cold store needs, particularly for the expansion of exports. Thus, the problem with cold storage is not just a lack of facilities as many believe but, it is being trained in how to manage the cold storage business in the face of the following problems:
Dealing with small farmers that do not have capacity to supply large enough quantities of product;
Series1, Tbilisi, 32%, 32%
Series1, Kvemo Kartli, 14%,
14%
Series1, Kakheti,
14%, 14%
Series1, Shida Kartli, 5%, 4%
Series1, Imereti, 5%, 4%
Series1, Samegrelo-
Zemo Svaneti, 18%, 18%
Series1, Guria, 5%, 5%
Series1, Ajara, 9%, 9%
85 | P a g e
Dealing with a high percentage of low quality product because the small farmers do not select and grade for quality;
Very costly distribution channels from Georgia into neighboring markets;
Very weak, almost non‐existent, technological and managerial support for owners of cold storage facilities in Georgia;
Lack of a banking system that understands the financing needs of cold store facility owners because to operate a cold store successfully one needs a line of credit that provides working capital funds when needed to permit buying and selling product at the opportune times.
Finally, the GOG tax authorities do not understand that when you bring product into a cold store not the entire product is going to be sold as some may spoil or shrink along the way but, because the accounting system does not allow for being able to deduct these losses or shrinkages from tax obligations a substantial tax burden is incurred which has to be covered in the price of the goods sold.
It is estimated that, including cold store facilities from Soviet times and recent times, there is about 15,100 tons of cold storage capacity in place in the country, but perhaps not where it needs to be (see Table V‐26, Figure V‐16 and Figure V‐17) or in as good a condition as it needs to be. Particularly noteworthy is the lack of cold storage facilities in western areas of the country, particularly those at ports exporting significant quantities of fruit and vegetable, including Poti and Batumi. Many of the older cold stores around Tbilisi are said to be used primarily for imported product rather than locally produced product for export. It was reported that the GAC plans to construct a Consolidation Center/Packing House/Cooling facility near Tbilisi in the near future but the size was not shared. However, in spite of present usage, substantial capacity appears to exist and helping people to better manage what exists may be more important than adding more capacity that will not get effectively used. As can be seen from Table V‐26, several of the facilities that have been established in recent times have been supported by the donor community, including USAID‐AgVantage and MCC‐ADA.
86 | P a g e
Table V‐16 Cold Storage Facilities
Region District Cold Store and Specialization
Tbilisi Tbilisi
Different products/ cap.: 1,000t
Fruit, vegetables, meats/ cap.: 1,500t
Fruits, vegetables, banana, kiwi, feijoa/ cap.: 1,000t
Fruits, vegetables/ cap.: 1,000t
Imereti
Bagdati Fruits, vegetables/ cap.: 35t
Tskaltubo
Herbs/ cap.: 70t/ AgVantage
Apples, grapes, persimmon, mandarin, herbs, vegetables/cap.: 150t
Herbs/ cap.: 40t/ ADA
Kakheti Gurjaani Fruits/ cap.: 200t/ADA
Sagarejo Fruits/ cap.: 200‐300t/ADA
Kvemo Kartli Rustavi Different products/ cap.: 2,000t
Bolnisi Potato, onions/ cap.: 1,800t
Mtskheta‐Mtianeti Mtskheta Fruits, vegetables/ cap.: 500t
Fruits, vegetables/ cap.: 3,000t
Samegrelo‐Zemo Svaneti
Zugdidi Kiwi, citrus/ cap.: 1200t
Samtskhe‐Javakheti Akhalkalaki Potatoes/ cap.: 600t
Shida Kartli Gori
Fruits/ cap.: 150t/ ADA
Fruits/ cap.: 300t/ AgVantage
Fruits/ cap.: 80t/ AgVantage
Fruits/ cap.: 250t/ UNHCR
Fruits/ cap.: 250t/ AgVantage
Kareli Fruits/ cap.: 800t
87 | P a g e
Figure V‐10: Cold Storage Facility Regional Presence
Figure V‐11: Cold Storage Facility Regional Capacity
Series1, Shida Kartli, 12%, 12%
Series1, Kakheti, 3%,
3%Series1, Imereti, 2%, 2%
Series1, Samtskhe
-Javakheti, 4%, 4%Series1,
Samegrelo-Zemo Svaneti,
1%, 1%
Series1, Tbilisi, 30%, 30%Series1,
Kvemo Kartli, 25%,
25%
Series1, Mtskheta-
Mtianeti, 23%, 23%
88 | P a g e
Figure V‐12: Cold Storage Facility Regional Presence
(d) Availability & Access to Storage, Sorting, Packing and, Markets
Further insight into storage and/or market system services is set out in Table V‐28. It shows for storage – grain, cold, and other forms of fruit and vegetable storage – that most respondents interviewed claimed they did not need or did not know where to find these kinds of storage facilities. The same seemed to be the case with sorting and packing facilities. Thus, this suggests that more facilities are needed or the owners of existing facilities need to make their facilities better known to farmers and traders. Also, a few respondents interviewed in relation to these storage, sorting and, packing facility questions indicated they could not use such facilities. And, finally a very small number of respondents actually indicated that they used storage, sorting or packing facilities. The primary reasons for the lack of use were reported to be remoteness (too far from the facilities) with respect to the location of facilities, poor road conditions and/or the high cost of services provided.
In the same survey respondents were questioned about their use of wholesale markets where various products are sold – crop goods, fresh milk, other dairy products besides milk and, fresh meat. In the case of wholesale market sales, with exception of fresh milk, nearly 50% of the respondents indicated they did use wholesale markets. In the case of fresh milk most respondents said they did not sell it at wholesale markets ‐ probably because they felt it would not keep. From 38% to 67% of respondents said they did not need or had not heard about the existence of a wholesale market near them. If more people had heard of the existence of wholesale markets, more people would very likely be using them. Thus, more wholesale markets may need to be established, or the existence of present markets needs to be made better known to end users. The reason wholesale markets were not used more widely was said to be because many of the respondents were located too far away from the markets and/or they thought the services of the market were too high cost.
Series1, Shida Kartli, 27%,
27%
Series1, Kakheti, 9%,
9%Series1, Imereti,
18%, 18%Series1, Samtskhe-
Javakheti, 5%, 5%
Series1, Samegrelo-
Zemo Svaneti, 5%,
5%
Series1, Tbilisi, 18%,
18%
Series1, Kvemo Kartli, 9%, 9%
Series1, Mtskheta-
Mtianeti, 9%, 9%
89 | P a g e
Table V‐17: Availability and Access
Upstream Stages Does not need/ Has not heard
Cannot Use
Uses Reasons of inaccessibility
Grain Storage 93.40% 5.50% 1.20% Mainly remoteness and high cost of service
Cold storage 92.20% 7.30% 0.40%Mainly remoteness, bad condition of roads and high cost of service
Packing facility 96.20% 3.40% 0.40% Mainly remoteness and high cost of service
Sorting facility 94.40% 5.20% 0.40% Mainly remoteness and high cost of service
Fruit/vegetable storage 93.70% 6.20% 0.10% Mainly remoteness and high cost of service
Wholesale markets:
Crop products 37.70% 10.10% 52.20% Mainly remoteness and high cost of service
Fresh milk 67% 21.80% 11.20% Mainly remoteness and high cost of service
Dairy products 46.20% 10.30% 43.60% Mainly remoteness and high cost of service
Fresh meat 44.50% 9% 46.40% Mainly remoteness and high cost of service
Retail agriculture market 13% 4.60% 82.40% Mainly remoteness and high cost of service
Respondents were also asked if they used local retail markets and a very high percentage – 82.5% indicated that they did use local retail market outlets. Only a few respondents – 4.6% ‐ indicated they could not use a retail market outlet. And, about 13% said they had no need for or had not heard about retail markets located near them.
Another aspect of being able to serve markets well relates to the kinds of storage facilities at border posts, ports, and airports. Based on interview discussions with customs department specialists it was learned that there is no shortage of facilities at the borders, ports and airports. However, it is observed that there are no storage facilities of significant scale there were identified in Poti or Batumi, two key ports for fruit and vegetable commodity export.
Most shipments do not really need to be stopped at border posts, only checked and if no problems are found they usually let shipments pass through to their destinations.
Shipments that move through the ports will find storage facilities if they are required. The quality and quantity of the facilities is not known but, the person interviewed thought they were adequate.
At the airport it was indicated that they have 3 refrigeration rooms (30 sq. meters each), and presently this has been adequate because no foodstuffs have been imported or exported via air as yet.
Finally, it is indicated that there are several large cold store facilities (some from Soviet times) in the country, 3 or 4 in Tbilisi, which are licensed as customs warehouses and, customs can bring and store cargo in these facilities. A final argument for the fact that there seems to be enough storage at the borders, ports, and airports is the fact that Georgia is importing large quantities of frozen meats –
90 | P a g e
chicken, beef – and, other frozen product and to date there have been no problems at customs, related to its storage.
i. Transportation At independence Georgia inherited a relatively well‐developed transportation network. But, after independence, the demand for freight transport all but collapsed simultaneously with and because of the collapse of the economy. In recent times Georgia has begun to resume its historic role as a transportation and communications hub between East and West. The major plan for this effort focuses heavily on pipeline and rail transport of energy resources. Because of this most transportation networks not related to energy movements lack repair and maintenance, leaving many rural roads in poor repair.
(a) Roads
The road network and its condition in 2005 was described in the AgVantage draft Food and Agricultural Strategy as among the world’s poorest, especially in farming regions. In Soviet times, nearly one‐third of all cars belonged to government officials. The Soviet system was the opposite of what one would expect, the trucks did the long hauls and the railroads did the short hauls. In short, the transportation system developed for the Soviet Union and inherited by Georgia was inadequate for a market‐oriented economy. The country’s four principal highways radiate from Tbilisi. Route M27 extends west through the broad valley between the two main mountain ranges and reaches the Black Sea south of Sukhumi. Route A305 branches off M27 and carries traffic to Poti and another secondary road turns south along the Black Sea coast from Poti to Batumi. A 10‐kilometer spur south from this is the only paved highway with Turkey. Route A301, the Georgian Military Highway, runs north from Tbilisi for almost 200 kilometers across the Greater Caucasus range to Russia. This route is open for traffic but, mainly from Armenia. Route A310 runs south from Tbilisi to Yerevan, Armenia, and Route A304 extends east across the lower portion of the Greater Caucuses range to Azerbaijan. In 1990, Georgia had 35,100 kilometers of road. Of this 31,200 kilometers was paved but not in the best repair. The current condition of the road network reflects a severe reduction in the resources allocated to maintenance since that time. The World Bank has carried out three major project initiatives related to repair of roads and the institutional system associated therewith. And since the 2005 AgVantage report, at least two of these projects were carried out. In addition, the MCC together with the GOG has been involved in helping to carry out road projects. These projects have improved some of the major roads but, many rural roads still require repair. Nonetheless, even though the state of the road network is not good, most major agricultural production areas of the country do have road access. It is only more isolated villages and farmlands, generally in the mountains, that do not have at least some access by vehicle. From an agricultural perspective, the issue is generally (not always) less one of access than of transport time and the higher cost of vehicle maintenance because of poor road conditions. So, while work has been going on it still has not solved all the distribution network problems associated with the moving product from interior areas to markets by road and the GOG will need to continue support to rural road maintenance in priority production zones.
(b) Rail
Georgia’s fully electric rail network has 1,583 kilometers of track, an actual increase of approximately 150 kilometers since 1993 excluding several small industrial lines. The main route runs across the country. It starts in Baku in Azerbaijan on the Caspian Sea, runs through Tbilisi, and on west to the Black
91 | P a g e
Sea to the ports of Poti and Batumi as well as north to Russia through Sukhumi. In addition to this primary route, others extend from this main east‐west line into Russia with two lines running south from Tbilisi — one to Armenia and one to Azerbaijan; and, from these major lines spurs link many smaller towns of Georgia’ broad central valley to the network. Recently it was said in interviews with organizations using the rail facilities that the railroad company does provide a cost effective reliable service but, nothing was said about the time it would take to move perishable products via rail to export market facilities at the ports. Thus, the rail system could be of service to agriculture but, the performance of the system for different product categories will need to be established on a case by case basis.
(c) Air
Georgia’s principal airport is about 18 kilometers northeast of downtown Tbilisi. With a runway approximately 2,500 meters long, it can accommodate direct connections to a large number of European, Russian, Ukrainian, and Middle Eastern cities. Tbilisi airport has been rehabilitated with EBRD financing which has substantially increased passenger‐handling capabilities. Even though the airport has received major upgrades the runways do need to be repaired as they are in poor condition. The airport is said to have cold store facilities so it could be a place from which selected high value fruits, vegetables and/or, flowers might be exported. There is some freight transport through the Tbilisi airport but, it is still relatively limited and will be until proper products in sufficient quantity and quality can be delivered to the airport for economic air‐shipments.
(d) Sea
Georgia’s Black Sea ports provide access to Russia and the Ukraine and then to the Mediterranean and the rest of the world through the Bosporus. The country’s two principal ports are at Poti and Batumi. Poti’s man‐made harbor carries more cargo than Batumi because of its direct rail links to Tbilisi. With nine berths, it can handle ships having up to ten meters draught weighing up to 30,000 tons and can handle as much as 100,000 tons of general cargo, 4 million tons of bulk cargo, and 1 million tons of grain per year. Connected with Poti four miles south is the Supsa oil terminal, which handles a substantial portion of oil exports. Batumi’s natural port is located on a bay just northeast of the city. Eight alongside berths have a total capacity of 100,000 tons of general cargo, 800,000 tons of bulk cargo, and 6 million tons of petroleum products. The port lies at the end of the Transcaucasia pipeline from Baku and is used primarily for the export of petroleum and petroleum products.
ii. Market Information The lack of access to market information is a major constraint to Georgia’s agricultural producers, processors and exporters. Compiling and analyzing market information is a key requirement for identifying market opportunities and formulating strategies to successfully compete in both domestic and export markets. Importantly, the continued use of market information is critical to maintaining and growing these markets. The challenge is to conceptualize, design and implement a practical and effective system which improves access to market information up and down the market chain. This system needs to provide timely information to all participants – farmers, wholesalers, exporters, retailers, and processors – operating in the market chain. The system should provide access to basic timely technical production information for farmers; market information such as prices in the domestic and export markets; as well as, information supportive of effective decision making of participants in the
92 | P a g e
market chain. To assist with this, basic tools such as weekly or biweekly market price, and news bulletins can be effective. At present a reliable updated set of technical and market facts that can be provided via a market information system to the agricultural sector in Georgia does not exist. A system was started in 2005/2006 by AgVantage that did provide useful technical and market information to players along the market chain of the agricultural sector but, at the time the AgVantage project closed in late 2009 it was hoped that the system would continue on a self‐sustaining private basis. Thus, at the time the system was transferred to GIPA for continued development, implementation, and distribution to clients. But, at the time of the transfer the system was not in a position to be self‐sustaining so ultimately GIPA discontinued the activity. It was probably not a good choice to transfer the system to GIPA at the time it was because it is very difficult to develop a private sector self‐sustaining system in a country the size of Georgia because there are not yet enough private sector and institutional customers able to pay for the service and keep it viable. Also, if there are private sector groups who want the technical and market information, and have the ability to pay, it is the larger groups and this leaves a large number of small Georgian farmers without access to the information and, these people are often the ones who need it most. The effort to develop a responsive market information system was good and the system did provide good information for quite some time and there is a need to revitalize the service. The method for revitalizing the service may eventually be something that could be carried out on a private business basis but, in the near term until the market develops it is a service that should have public support. This is particularly true in Georgia where 685,000 small subsistence and semi‐commercial farmers exist that does not have the capacity yet to support a private market information system. Also, many of the larger more commercial farmers are not large enough to effectively support the system. The system that could be in place might include such things as for the fruit and vegetable sector:
Fruits & Vegetables Georgia Weekly (in Russian or English), FVGWR; (in Georgian), FVGWG; and, include a structure as follows: 1. Report top Georgian (For FVGWR & FVGWG) & Foreign market news (For FVGWG) 2. Wholesale prices
Georgia EXW – farm gate
“Georgia CPT” (Major towns in Russia & Ukraine for FVGWR) and (Prices offered by buyers for FVGWG)
Ukraine (major cities)
Maybe Russian (major cities) eventually
EU (Poland, Germany, Holland, etc. available from Free sources) 3. Retail prices (For the FVGWG only)
Georgia two to three major cities in different regions – retail green markets
Georgia two to three major cities in different regions – retail supermarkets and store outlets
4. Market update on major targeted commodities (what has changed, what are the trends and with a focus on Georgia)
5. Logistics cost update (should be published monthly or more frequently if needed) 6. Weather & crop update (report any threats to crops & major targeted crop progress with
yield expectations)
93 | P a g e
7. Periodically publish analytical articles based on: 1) hot or pressing issues; 2) studies and/or research conducted; 3) official statistical updates that effect markets, and similar. Eventually it would be best to have something to publish in every issue.
8. Investment promotion (periodically investment profile insights related to attractive market niche opportunities should be reported)
9. Technologies of growing, PHH, storage and marketing 10. Offers & bids (Georgia’s exporters, buyers in Ukraine, Middle East and, targeted EU
countries)
A Web‐site for Fruits and Vegetables from Georgia; and,
Additionally, the holding of an annual industry conference & some press‐conferences.
If necessary a system for the grains, oilseeds, dairy products, etc. could be designed and established but, each would depend on the size of the market and the importance of the commodities as import or export items. It is premature to decide a structure at this time; suffice it to say that the system could include whatever commodities are decided to be important for inclusion. Also, rather than being a 100% Georgian system, the market information system could be revitalized on a regional basis via a group that is already self‐sustaining. For example, such a systems is up and running in Ukraine that was developed by USAID in Ukraine. The system from Ukraine could take on the organization of the Georgian system and put it in place. Then the service could be bought into by the MOA so that the information could be distributed to a broader number of recipients than might be the case if only private sector players from Georgia were to buy into the regional system. The system should help to focus on targeting the strategic non‐traditional markets for Georgia – EU and Middle East. It is not suggested to spend a lot of effort on trying to develop the markets in Ukraine or the Baltics, but neither should these markets be ignored as they are important to Georgia. In conclusion a good responsive market information system should be developed/revitalized that serves the entire agricultural and agribusiness sector with technical and market information required to help the industry grow and expand into new attractive markets.
iii. Product Promotion / Market Development Market development targets non‐buying customers in currently targeted segments. It also targets new customers in new segments. When thinking about expanding business opportunities, first think about where you want to cultivate new business because you do have options ‐ other regions within the country or in various other countries. Geographical expansion works well for a country or company that is seeking new markets and it has been indicated that the EU and the Middle East could be good target markets for many products that use to go to Russia provided quality standards can be met. Clearly the ability to expand is subject to the ability to meet new market demands and to finance the expansion. In international reconstruction and development situations like (post‐conflict /developing zones) Georgia finds itself, after having lost major markets (in this case Russia) developing new markets is a must. Market development usually consists of conducting information‐gathering, market analysis and market outreach work to find opportunities for what is available for sale.
To develop the agricultural sector of Georgia it is necessary to develop markets for products Georgia has to sell and/or identify the products Georgian producers should produce to meet the needs of attractive markets. Thus, market development work is critical and it is not foreign to Georgia. For example, market development has been done for the wine sector, and recently the nut sector was represented at the 30th
94 | P a g e
World Nut and Dry Fruit congress in Budapest. This market development work was led by USAID projects, the latest being organized and supported by the USAID project “Economic Prosperity Initiative”.14But, while there is some activity going on in this regard it tends to be a bit sporadic as it is handled under the egis of project funding and it should be a focus of the GOG and on a sustainable long term basis until these industry groups can gain the strength to manage the processes on their own. Thus, market development and promotion of Georgian products is still weak and needs to be strengthened to remove as a constraint to building trade for Georgian products.
The Opportunity: As the analysis pointed out, facilities to store and handle dry product in flat storage are available, but in many places it is not adequate because it needs refurbishing. Silo/elevator storage for grains is much less than during Soviet times and much of the older storage is used for the imported grains so more grain storage, particularly regional storage is needed to support the expansion in grain and oilseed production. From the transport point of view, there is a need to improve the rural road system particularly in areas where substantial perishable crop production occurs as high losses can occur during the transport of these crops. Market information is nearly non‐existent on an openly available basis and this hinders farmers and traders as they work to meet market demands. And, finally there is a substantial opportunity to promote more of Georgia’s quality products to target markets. To help ensure that the deficiencies of marketing and trade continue to be strengthened some support strategies suggested include:
Continue support efforts to expand and strengthen post‐harvest handling facilities. As indicated post‐harvest handling facilities are insufficient, inadequate, or improperly managed. While some efforts have been made to expand facilities (primarily storage) under AgVantage, ADA and some GOG efforts there is still a lack of facilities, particularly packing, grading, and sorting. Thus, an opportunity exists to provide more support in this area.
Provide support that helps cold store owners make more effective use of facilities. Many newer owners of cold store facilities require technical assistance to learn how to properly manage the facilities and support the farmers and traders with ways to better meet market demands. This involves both technical management of the facilities, and product management within the facilities.
Wholesale market feasibility studies and associated investment promotion. This be carried out in an effort to determine where and what kind of consolidation centers need to be established at the national and regional level. Presently it is understood that the GAC will construct a consolidation center near Tbilisi, but there will be a need to establish consolidation centers regionally and probably with storage, and handling facilities at each. Thus, studies to determine the types of facilities and their feasibility will be required.
Develop or re‐establish a Market Information System. A market information system was developed and provided useful information. Sustainability was not accommodated, and it went defunct. Therefore, it is necessary to revisit this activity and determine the best way to revive the system. Perhaps it needs to be revised on a public/private regional basis to include technical and market information necessary to help farmers and agribusinesses make their fullest contribution to the economy. It can be developed as a system that the MOA could buy‐into so as
14 USAID Economic Prosperity Initiative
95 | P a g e
to provide market information to all farmers and not just those that can afford to pay. It might be that an SMS based system operated in conjunction with a cell phone provider could make available a low cost platform for this MIS.
Continue to provide support to rural road development. The GOG with help from the MCC has been carrying out road rehabilitation work, but more needs to be done at the rural road level. Thus, this is an area that offers opportunity for more support by the GOG and donors.
Establish an agency that will be responsible for market development and promotion work. It is necessary for Georgia to promote its products in target markets, particularly since the Russian embargo. This has been done ad‐hoc via some of the USAID projects, most recently the EPI project with promotion of nuts in Budapest. But, this should not be done on an ad‐hoc basis it should become the responsibility of an agency that promotes a broad range of Georgian products. Such an agency would help agricultural and agribusiness firms build new markets for products that Georgia has to sell and identify products that the industry ought to produce.
G. Food Safety
The lack of proper controls for food safety at the plant, animal, and handling levels throughout the food chain is still a constraint to Georgia’s agricultural producers, processors and exporters. Unless there are clear rules and policies related to food safety, animal disease control, and plant protection practices, many countries will not allow Georgian exports to them. Georgia in recent years has been working hard to improve their food safety situation, and important motivating factor being a trade agreement on the horizon with the EU. In this section an overview discussion of actions that have taking place since the breakup of the Soviet Union and those currently being developed to improve Georgia’s access to the EU are discussed. The discussion covers some historical background, and the current situation with respect to food safety, veterinary situation, phytosanitary issues, SPS border controls, and the laboratory / testing facilities. The challenge is to conceptualize, design and implement a practical and effective system which meets the requirements of the EU with key current constraints being:
Delays in the implementation of the Law on Food Safety and Quality;
Partial adoption of rules with respect to food safety that go a long way toward meeting the requirements of the EU but, do not fully meet the needs;
Legislation related to veterinary’s that is not being fully enforced leaving uncertainties in place that cause ineffective veterinary practices to still be in place;
A weak private veterinary sector, and ambiguity concerning the role of private veterinarians in the veterinary control system;
Absence of a veterinary certification regime;
Gaining proper control of harmful diseases and pests that can spread throughout Georgia;
Improving infrastructure and equipment at several border points so as to improve further the inspection procedures;
Working to get laboratories accredited at various locations throughout the country.
96 | P a g e
The Challenge: The food safety, veterinary, and phytosanitary area is an important area for improvement, led by the EU. The EU has been working closely with the GOG on the implementation of systems to better control food safety veterinary, and phytosanitary concerns and progress is being made. This is nonetheless a long‐term effort, one with multiple actors can contribute to. One significant concern is the willingness on the part of the GOG to fully implement priority measures. Thus, the challenge for USAID in this area is to determine what it can do to help the EU and the GOG come together to meet the needs that will help the trade climate for Georgian agriculture and agribusiness.
Background: In December 2005 the Government adopted the Law on Food Safety and Quality with strong support from the EU, WB, USAID, and other donors. The new law addressed several important principles set out in international standards (EU legislation, Codex Alimentarius), and placed the focus of inspection on the process, established responsibilities for food safety, and conditions for internal controls and traceability. Adoption of the law required and necessitated institutional reform and development of secondary legislation. Consequently, as a follow‐up support measure, international technical assistance to the Ministry of Agriculture (MOA) targeted all relevant aspects of legislative and institutional arrangements related to the management and control of food safety, and animal and plant health necessary for implementation of the new Law.15 As follow‐up the MOA established and staffed a Food Security Department with food safety, veterinary and phytosanitary sections responsible for policy and legislation development, and prepared secondary legal instruments necessary for implementation of the Food Safety Law. In December 2005 responsibility on SPS controls at the territorial borders and ports was transferred to the Customs Department of the Ministry of Finance, while controls at the inland terminals remained under the responsibility of the MOA. Early in 2007, the GOG adopted a new Law on Customs that eliminated the two tier system of controls; and, since that time all controls have been performed only at the borders and only by the customs department. Although abolishment of the two tier system and bringing controls under unified management is in line with EU recommendations, the only checks in place have been documentary checks and this is not sufficient. Therefore, in the spring of 2006 the MOA established and staffed a national organization responsible for Food Safety, Veterinary, and Plant Protection (FSVPP) responsible for implementation of inspections and controls. To respect the need for separating inspection and laboratory functions, the MOA established in June 2006 separate laboratories with staff that has the responsibility of testing, and analysis.
Adoption of the Law coincided with the shift in the GOG economic policy to a more liberal approach. The decision to amend the Food Law and defer requirements for inspections and controls from the proposed date January 1, 2007 to July 1, 2008 was for the following:
lack of a food enterprise registry;
reported limited capacity of both the newly establish FSVPP to carry out inspections and controls;
15 Main legislation governing Food Safety, Veterinary, Sanitary and Phytosanitary Controls: (1) Food safety - The Law on Food Safety and Quality (2005); (2) Veterinary - The Law on Veterinary Control (1995); (3) Phytosanitary - The Law on Protection of Plants from Harmful Organisms (1994), The Law on Pesticides and Agriculture Chemicals (1998). The Prime Minister’s office has started work on the new Codex to replace existing primary legislation related to food safety, veterinary, and phytosanitary matters.
97 | P a g e
food and feed enterprises not having the ability to meet originally proposed HACCP system deadlines.
In the spring of 2007, the GOG initiated a second round of reforms. These reforms further deferred food safety, veterinary and phytosanitary inspections and controls until December 31, 2009. In parallel, the MOA restructured and substantially downsized the Food Security Department and the FSVPP. And, again in December 2009, enforcement of the Law was further delayed and the GOG adopted a 7‐year transition plan.
Establishment of an effective food safety, veterinary and, phytosanitary control system is one of the obligations of Georgia under the European Neighborhood Policy (ENP) Action Plan (AP) and, Georgia is committed to its implementation. Within the environment of policy uncertainty and conflicting approaches, the GOG made attempts to meet ENP AP obligations; specifically, in the 2006 secondary legislation it reflected an effort to adopt, more or less EU SPS principles; in 2007 Georgia joined International Plant Protection Convention (IPPC); and, in 2008 Georgia established interconnections with the EU Rapid Alert System for Food and Feed (RASFF). During this period, the EU placed emphasis on the importance of enactment of suspended articles on food safety control, however without a success until 2010.
The Current Situation: The prospects for being able to engage in Deep and Comprehensive Free Trade Area (DCFTA) negotiations with the EU and, to accelerate the process seems to have given a fresh impetus to reforms in the sphere of SPS control. Some discussion of actions being under taken related to food safety, veterinary, phytosanitary, and laboratory control, currently are discussed.
Food Safety: Enactment of suspended articles on food safety controls in the Law on Food Safety and Quality was the major pre‐condition to start DCFTA negotiations. Thus, the GOG Commission on European Integration has established inter‐governmental working group with the responsibility to develop the food safety system. The group was headed by the Prime Minister’s team. Substantial work was carried‐out by the working group: existing legislation was analyzed, comparative analysis of Georgia’s and EU legislation was carried out, institutional shortcomings and gaps were identified, the situation in the business sector was analyzed, and readiness of the business sector to adopt new food safety realities to be imposed was assessed. Based on these findings a comprehensive Food Safety Strategy was elaborated and the Program for legislative approximation was adopted. The strategy and program were approved by the GOG at the end of 2010.
The strategy addresses all‐important aspects of food safety including institutional set‐up and capacity, and laboratory infrastructure. The Strategy is complemented by the legislative approximation Program for the 2010‐2014 timeframe. The program considers legislative approximation in harmony with horizontal legislation of the EU. The program established defines regulations to be adopted and implementation plans, and assigns responsibilities for implementation that are reviewed on a quarterly basis. According to the strategy, the program for approximation in harmony with EU vertical legislation will be prepared and adopted in 2011. At the first stage, only those products will be covered which have the greatest potential to be exported to EU.
Beginning from July 2010, state inspections were partially reinstated, targeting only export enterprises, implemented six months earlier than planned. Along with inspections, target enterprises were required to have in‐place traceability and HACCP systems. Amendments were made to the Law on Entrepreneurs, concerning the requirement to register food enterprises. There are some shortcomings in legislation
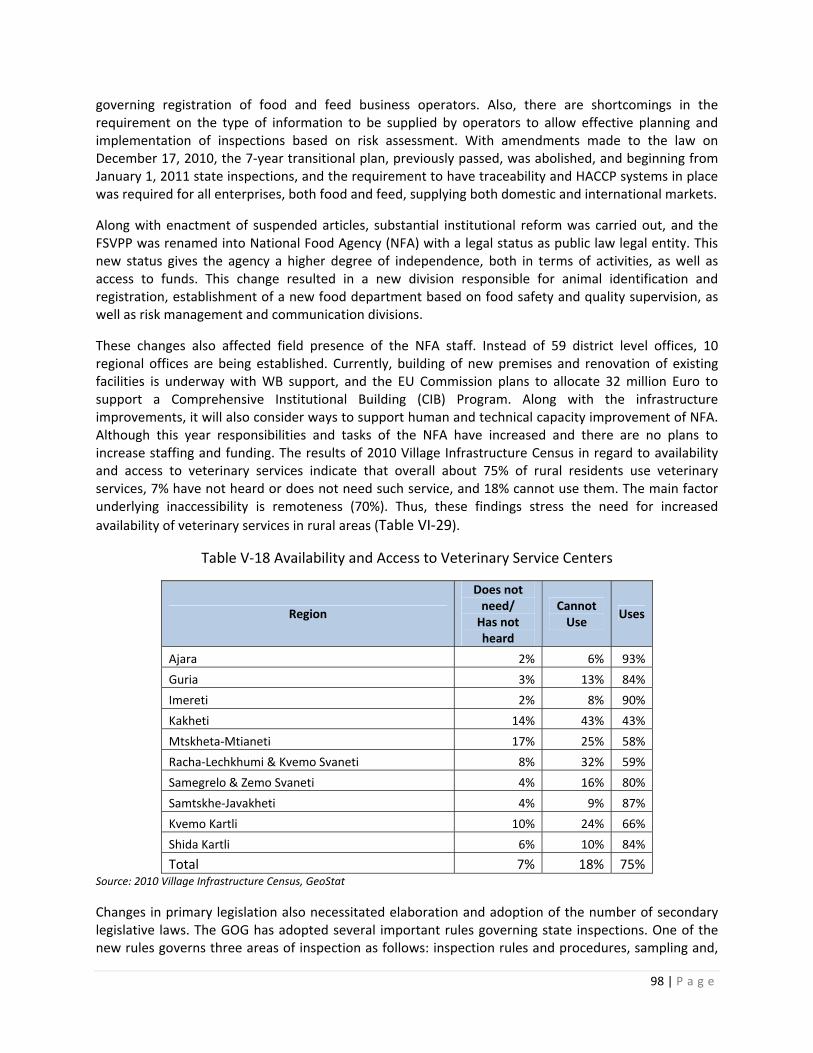
98 | P a g e
governing registration of food and feed business operators. Also, there are shortcomings in the requirement on the type of information to be supplied by operators to allow effective planning and implementation of inspections based on risk assessment. With amendments made to the law on December 17, 2010, the 7‐year transitional plan, previously passed, was abolished, and beginning from January 1, 2011 state inspections, and the requirement to have traceability and HACCP systems in place was required for all enterprises, both food and feed, supplying both domestic and international markets.
Along with enactment of suspended articles, substantial institutional reform was carried out, and the FSVPP was renamed into National Food Agency (NFA) with a legal status as public law legal entity. This new status gives the agency a higher degree of independence, both in terms of activities, as well as access to funds. This change resulted in a new division responsible for animal identification and registration, establishment of a new food department based on food safety and quality supervision, as well as risk management and communication divisions.
These changes also affected field presence of the NFA staff. Instead of 59 district level offices, 10 regional offices are being established. Currently, building of new premises and renovation of existing facilities is underway with WB support, and the EU Commission plans to allocate 32 million Euro to support a Comprehensive Institutional Building (CIB) Program. Along with the infrastructure improvements, it will also consider ways to support human and technical capacity improvement of NFA. Although this year responsibilities and tasks of the NFA have increased and there are no plans to increase staffing and funding. The results of 2010 Village Infrastructure Census in regard to availability and access to veterinary services indicate that overall about 75% of rural residents use veterinary services, 7% have not heard or does not need such service, and 18% cannot use them. The main factor underlying inaccessibility is remoteness (70%). Thus, these findings stress the need for increased
availability of veterinary services in rural areas (Table VI‐29).
Table V‐18 Availability and Access to Veterinary Service Centers
Region
Does not need/ Has not heard
Cannot Use
Uses
Ajara 2% 6% 93%
Guria 3% 13% 84%
Imereti 2% 8% 90%
Kakheti 14% 43% 43%
Mtskheta‐Mtianeti 17% 25% 58%
Racha‐Lechkhumi & Kvemo Svaneti 8% 32% 59%
Samegrelo & Zemo Svaneti 4% 16% 80%
Samtskhe‐Javakheti 4% 9% 87%
Kvemo Kartli 10% 24% 66%
Shida Kartli 6% 10% 84%
Total 7% 18% 75% Source: 2010 Village Infrastructure Census, GeoStat
Changes in primary legislation also necessitated elaboration and adoption of the number of secondary legislative laws. The GOG has adopted several important rules governing state inspections. One of the new rules governs three areas of inspection as follows: inspection rules and procedures, sampling and,
99 | P a g e
responsibilities and duties of state employees. This new rule is partially in‐line with relevant EU regulations. The major shortcomings are considered the following: the requirement to have a court order for inspection, and a week’s advanced notification to businesses concerning planned inspections. According to some business leaders, a one week advanced notice to enterprises about planned inspections might have a negative impact on the effectiveness of inspections, since this period is sufficient time to cover gaps and shortcomings prior to the anticipated inspection. Another important rule adopted by the GOG relates to the requirements on hygiene along the food supply chain. It targets all enterprises involved in production, processing and distribution of food and feed.
In 2011 the GOG plans further legislative work in this direction (including products of animal origin) to ensure complete compliance with EU requirements during 2011. In September 2010, the GOG adopted simplified compliance rules for small and medium enterprises that meet the criteria as follows: 1) directly supplies produce to consumers or local retail outlets; 2) uses traditional methods of production; and 3) the enterprise is located in mountainous area. The reason for adoption of a simplified rule is to ensure sustainability and competitiveness of small operators and preserve traditional methods of production as a part of cultural and historical heritage. The difference between Georgian simplified rules and those found in relevant EU regulations is that the EU does not differentiate between the size of operators, but differentiates based on the volume of supply. In addition the exception is only applicable to primary produce. One more important piece of legislation adopted in December of 2009 relates to labeling. In short, new regulations are envisioned to be fully in‐line with EU requirements.
Veterinary: The law related to veterinary support has been heavily amended several times, however it is still considered outdated. Activities to improve the situation have been carried out in the framework of preparatory work for facilitating the start of DCFTA negotiations. As reported, the law will be abolished and will be replaced with the new Codex addressing veterinary issues along with food safety and phytosanitary aspects. The relevant working group has already been established.
Enactment of suspended articles on food safety inspections at the end of 2010 has resulted in enforcement of the veterinary law. Certification requirements for private veterinarians were abolished, and according to passed amendments, only the proof of relevant higher education is sufficient to be eligible to provide veterinary services. This has led to the abolishment of the Law on Certification of State Veterinarians.
In 2010 new rules governing the registration of pharmaceuticals were adopted. One of the reasons for this action from the state was its limited capacity to provide livestock owners with free vaccination services. As a result, both imports and retail sales of vaccines and other pharmaceuticals have increased. Retail prices on vaccines are relatively affordable, and a livestock owner after purchase can utilize the services of any skilled person to vaccinate his/her cattle. The NFA considers this measure to have
significant positive impact on animal health. And, as set out in Table V‐31, data shows the proportion of villages that have reported outbreaks of different animal diseases in the past couple years. Thus, it is important to ensure that animals are being vaccinated, even if not all done by veterinarians.
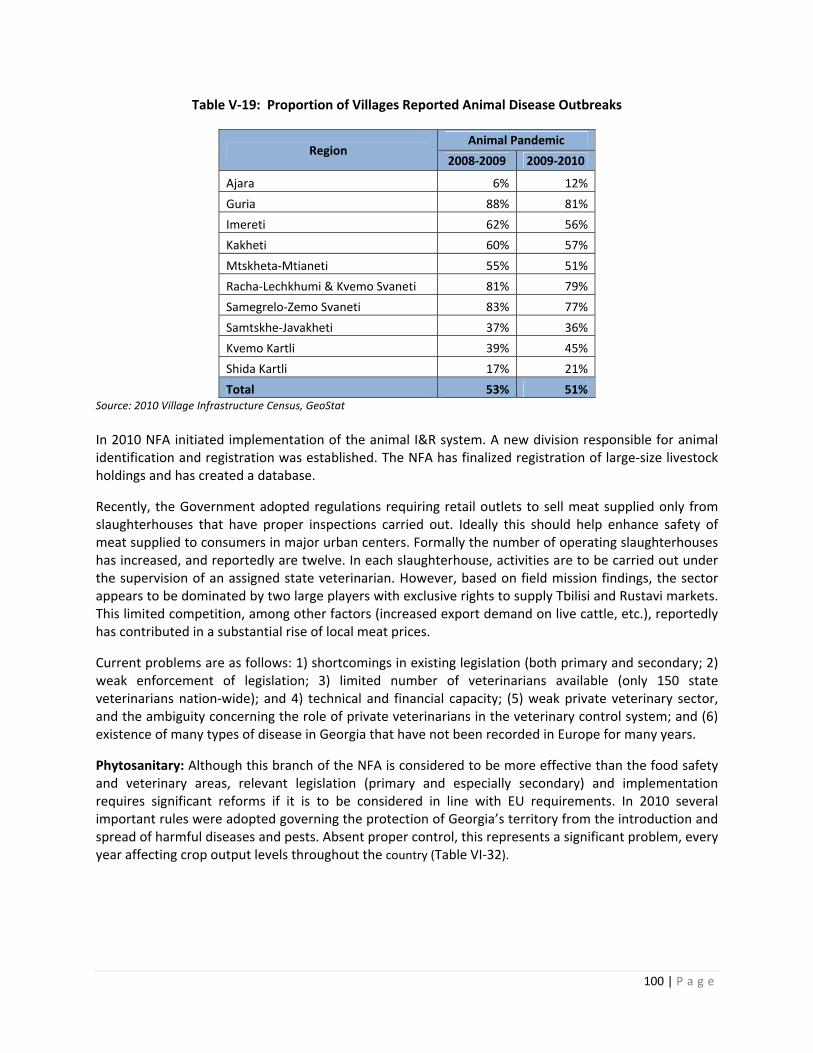
100 | P a g e
Table V‐19: Proportion of Villages Reported Animal Disease Outbreaks
Region Animal Pandemic
2008‐2009 2009‐2010
Ajara 6% 12%
Guria 88% 81%
Imereti 62% 56%
Kakheti 60% 57%
Mtskheta‐Mtianeti 55% 51%
Racha‐Lechkhumi & Kvemo Svaneti 81% 79%
Samegrelo‐Zemo Svaneti 83% 77%
Samtskhe‐Javakheti 37% 36%
Kvemo Kartli 39% 45%
Shida Kartli 17% 21%
Total 53% 51% Source: 2010 Village Infrastructure Census, GeoStat
In 2010 NFA initiated implementation of the animal I&R system. A new division responsible for animal identification and registration was established. The NFA has finalized registration of large‐size livestock holdings and has created a database.
Recently, the Government adopted regulations requiring retail outlets to sell meat supplied only from slaughterhouses that have proper inspections carried out. Ideally this should help enhance safety of meat supplied to consumers in major urban centers. Formally the number of operating slaughterhouses has increased, and reportedly are twelve. In each slaughterhouse, activities are to be carried out under the supervision of an assigned state veterinarian. However, based on field mission findings, the sector appears to be dominated by two large players with exclusive rights to supply Tbilisi and Rustavi markets. This limited competition, among other factors (increased export demand on live cattle, etc.), reportedly has contributed in a substantial rise of local meat prices.
Current problems are as follows: 1) shortcomings in existing legislation (both primary and secondary; 2) weak enforcement of legislation; 3) limited number of veterinarians available (only 150 state veterinarians nation‐wide); and 4) technical and financial capacity; (5) weak private veterinary sector, and the ambiguity concerning the role of private veterinarians in the veterinary control system; and (6) existence of many types of disease in Georgia that have not been recorded in Europe for many years.
Phytosanitary: Although this branch of the NFA is considered to be more effective than the food safety and veterinary areas, relevant legislation (primary and especially secondary) and implementation requires significant reforms if it is to be considered in line with EU requirements. In 2010 several important rules were adopted governing the protection of Georgia’s territory from the introduction and spread of harmful diseases and pests. Absent proper control, this represents a significant problem, every year affecting crop output levels throughout the country (Table VI‐32).
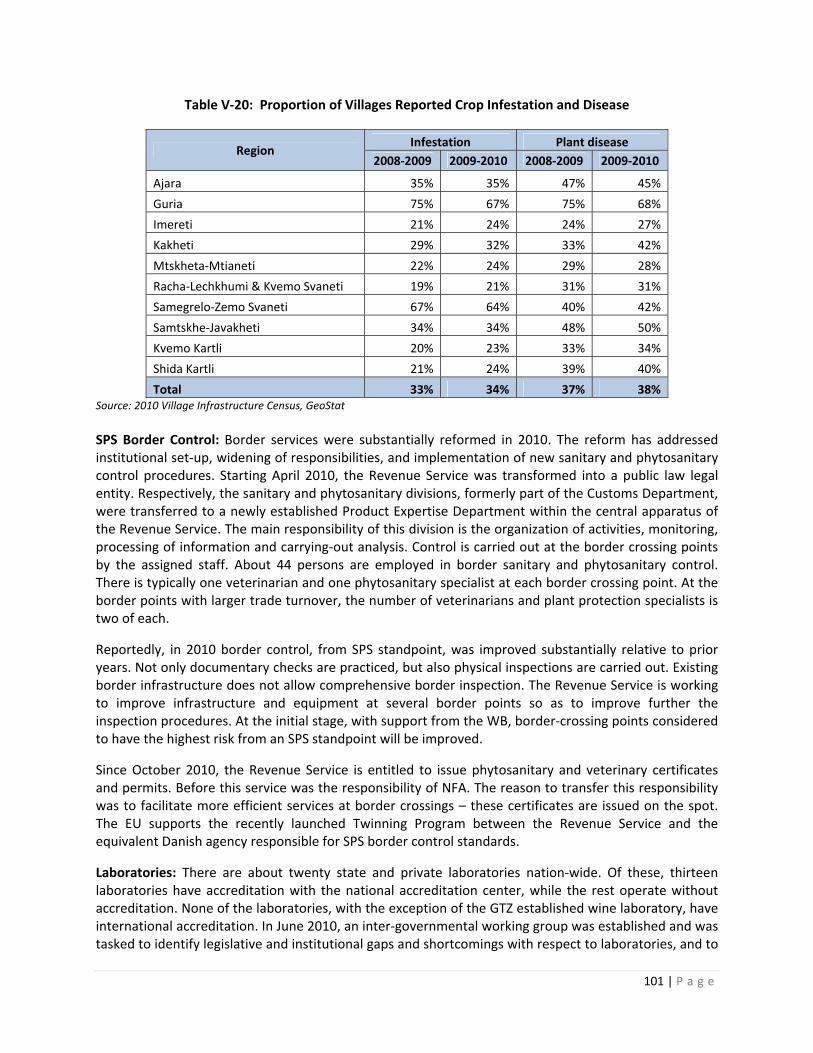
101 | P a g e
Table V‐20: Proportion of Villages Reported Crop Infestation and Disease
Region Infestation Plant disease
2008‐2009 2009‐2010 2008‐2009 2009‐2010
Ajara 35% 35% 47% 45%
Guria 75% 67% 75% 68%
Imereti 21% 24% 24% 27%
Kakheti 29% 32% 33% 42%
Mtskheta‐Mtianeti 22% 24% 29% 28%
Racha‐Lechkhumi & Kvemo Svaneti 19% 21% 31% 31%
Samegrelo‐Zemo Svaneti 67% 64% 40% 42%
Samtskhe‐Javakheti 34% 34% 48% 50%
Kvemo Kartli 20% 23% 33% 34%
Shida Kartli 21% 24% 39% 40%
Total 33% 34% 37% 38% Source: 2010 Village Infrastructure Census, GeoStat
SPS Border Control: Border services were substantially reformed in 2010. The reform has addressed institutional set‐up, widening of responsibilities, and implementation of new sanitary and phytosanitary control procedures. Starting April 2010, the Revenue Service was transformed into a public law legal entity. Respectively, the sanitary and phytosanitary divisions, formerly part of the Customs Department, were transferred to a newly established Product Expertise Department within the central apparatus of the Revenue Service. The main responsibility of this division is the organization of activities, monitoring, processing of information and carrying‐out analysis. Control is carried out at the border crossing points by the assigned staff. About 44 persons are employed in border sanitary and phytosanitary control. There is typically one veterinarian and one phytosanitary specialist at each border crossing point. At the border points with larger trade turnover, the number of veterinarians and plant protection specialists is two of each.
Reportedly, in 2010 border control, from SPS standpoint, was improved substantially relative to prior years. Not only documentary checks are practiced, but also physical inspections are carried out. Existing border infrastructure does not allow comprehensive border inspection. The Revenue Service is working to improve infrastructure and equipment at several border points so as to improve further the inspection procedures. At the initial stage, with support from the WB, border‐crossing points considered to have the highest risk from an SPS standpoint will be improved.
Since October 2010, the Revenue Service is entitled to issue phytosanitary and veterinary certificates and permits. Before this service was the responsibility of NFA. The reason to transfer this responsibility was to facilitate more efficient services at border crossings – these certificates are issued on the spot. The EU supports the recently launched Twinning Program between the Revenue Service and the equivalent Danish agency responsible for SPS border control standards.
Laboratories: There are about twenty state and private laboratories nation‐wide. Of these, thirteen laboratories have accreditation with the national accreditation center, while the rest operate without accreditation. None of the laboratories, with the exception of the GTZ established wine laboratory, have international accreditation. In June 2010, an inter‐governmental working group was established and was tasked to identify legislative and institutional gaps and shortcomings with respect to laboratories, and to
102 | P a g e
elaborate measures for their improvement. Based on the results of the analysis of institutional gaps (carried out by an Estonian technical expert according to the EU framework) different Donors will be addressing gaps and shortcomings in the laboratory sphere.
USAID Opportunities: As Georgia makes progress toward trade integration with the EU, food safety, veterinary and phytosanitary priorities have come into sharp focus. Complementing the EU’s leadership, there are a number of areas where development can be assisted. In the veterinary area, the USDA has been working to assist in the improvement of the veterinary service and, it is hoped that this assistance will continue. There are a number of other opportunities to push forward development in this area, including the following:
Conduct information campaigns to raise awareness of food business operators (producers, processors, traders) and consumers about new legislation and new compliance requirements. It is often the case that businesses believe they are compliant, but are not. Also, consumers very often do not understand what their role is to ensure the safety of the food they eat. Therefore, business and consumers alike require more help in understanding the requirements of food safety concerns.
Support producers/processors to comply with new food safety requirements by providing them with improved access to relevant technical advice provided by private sector professionals that each day implement practices to meet new requirements. To help the producers and processors meet the requirements helps them to improve their prospects for exporting to new markets, and it is certainly an area where USAID can leverage its expertise.
Help GOG officials with technical assistance necessary for determining the best way to organize to meet requirements demanded by the EU. If the GOG can get the regulations in place and the message out to industry it will not only help to improve exports to EU markets, but to other markets with similar or less stringent regulations. Also, if the products can meet the international EU standards, they will certainly meet most domestic requirements.
Provide help in getting laboratories accredited at various locations throughout the country. Assist the GOG improve its ability to carry‐out work at laboratories by providing staff training, facilities upgrading, and progress toward accreditation.
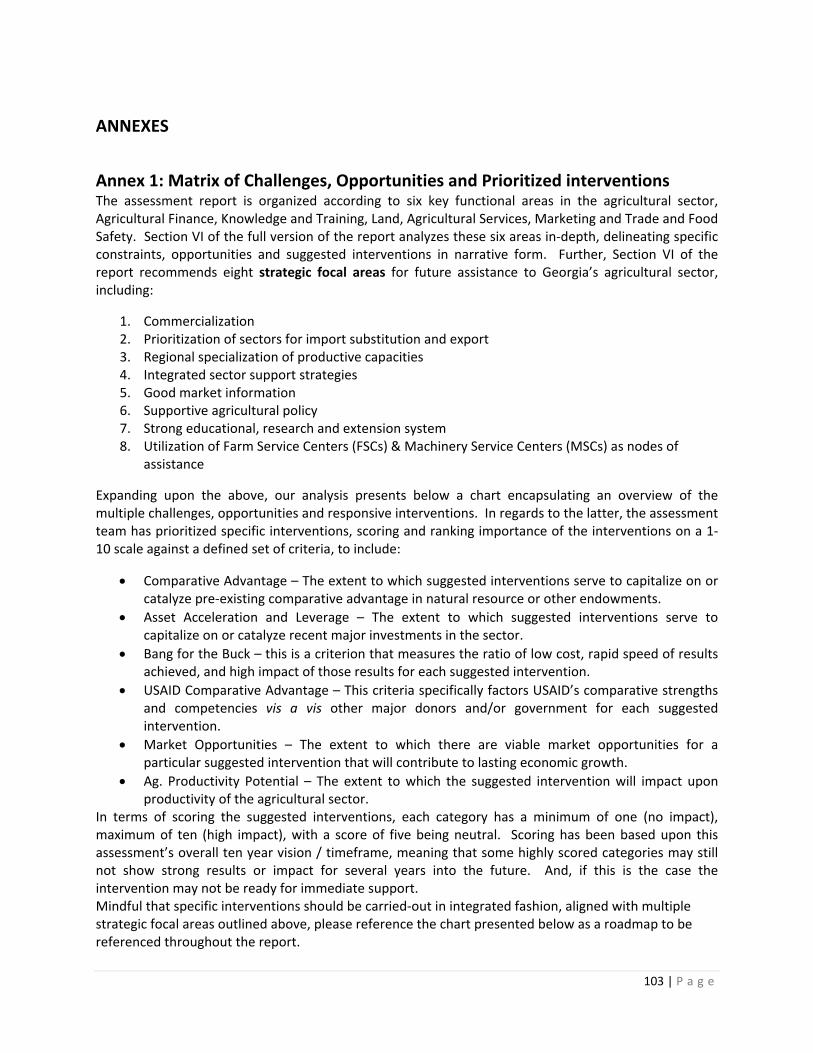
103 | P a g e
ANNEXES
Annex 1: Matrix of Challenges, Opportunities and Prioritized interventions The assessment report is organized according to six key functional areas in the agricultural sector, Agricultural Finance, Knowledge and Training, Land, Agricultural Services, Marketing and Trade and Food Safety. Section VI of the full version of the report analyzes these six areas in‐depth, delineating specific constraints, opportunities and suggested interventions in narrative form. Further, Section VI of the report recommends eight strategic focal areas for future assistance to Georgia’s agricultural sector, including:
1. Commercialization 2. Prioritization of sectors for import substitution and export 3. Regional specialization of productive capacities 4. Integrated sector support strategies 5. Good market information 6. Supportive agricultural policy 7. Strong educational, research and extension system 8. Utilization of Farm Service Centers (FSCs) & Machinery Service Centers (MSCs) as nodes of
assistance
Expanding upon the above, our analysis presents below a chart encapsulating an overview of the multiple challenges, opportunities and responsive interventions. In regards to the latter, the assessment team has prioritized specific interventions, scoring and ranking importance of the interventions on a 1‐10 scale against a defined set of criteria, to include:
Comparative Advantage – The extent to which suggested interventions serve to capitalize on or catalyze pre‐existing comparative advantage in natural resource or other endowments.
Asset Acceleration and Leverage – The extent to which suggested interventions serve to capitalize on or catalyze recent major investments in the sector.
Bang for the Buck – this is a criterion that measures the ratio of low cost, rapid speed of results achieved, and high impact of those results for each suggested intervention.
USAID Comparative Advantage – This criteria specifically factors USAID’s comparative strengths and competencies vis a vis other major donors and/or government for each suggested intervention.
Market Opportunities – The extent to which there are viable market opportunities for a particular suggested intervention that will contribute to lasting economic growth.
Ag. Productivity Potential – The extent to which the suggested intervention will impact upon productivity of the agricultural sector.
In terms of scoring the suggested interventions, each category has a minimum of one (no impact), maximum of ten (high impact), with a score of five being neutral. Scoring has been based upon this assessment’s overall ten year vision / timeframe, meaning that some highly scored categories may still not show strong results or impact for several years into the future. And, if this is the case the intervention may not be ready for immediate support. Mindful that specific interventions should be carried‐out in integrated fashion, aligned with multiple strategic focal areas outlined above, please reference the chart presented below as a roadmap to be referenced throughout the report.
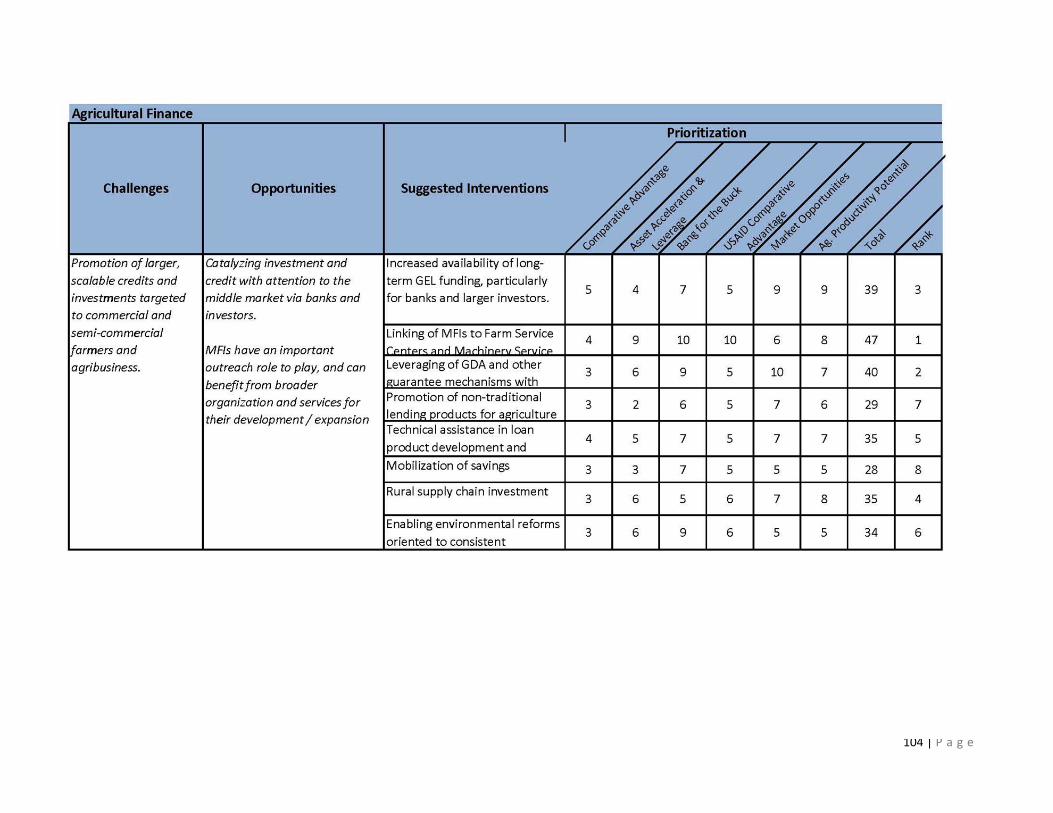
104 | P a g e

105 | P a g e
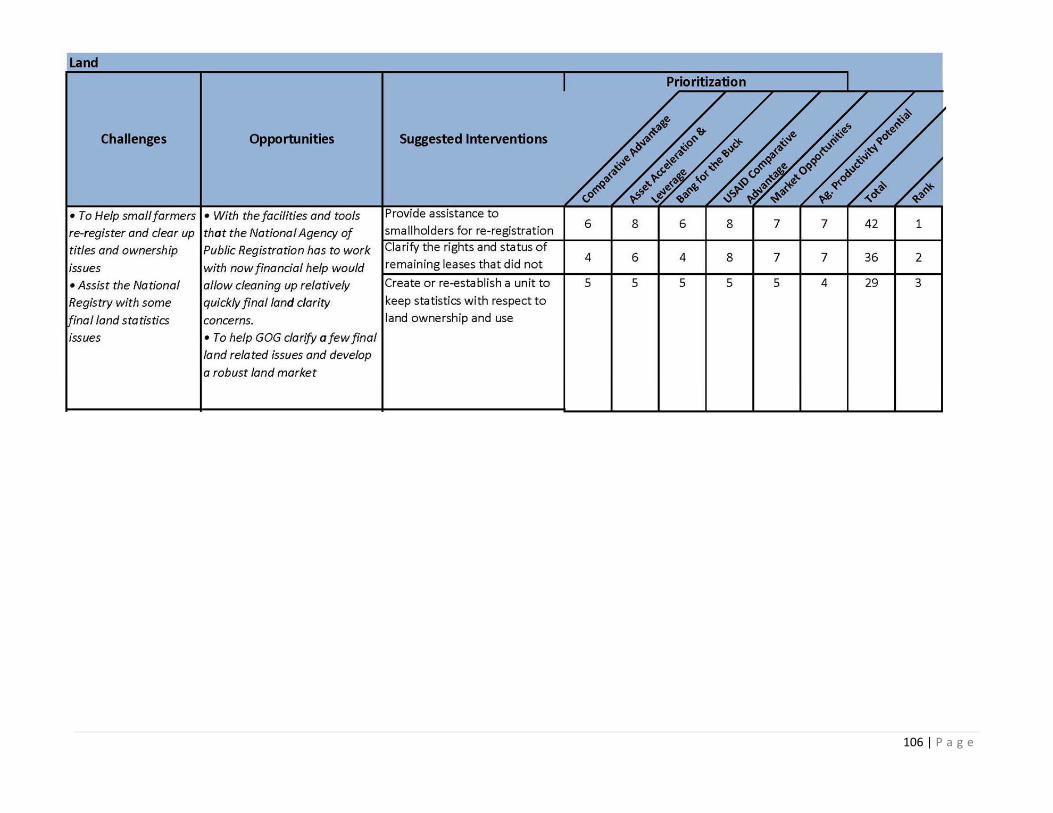
106 | P a g e
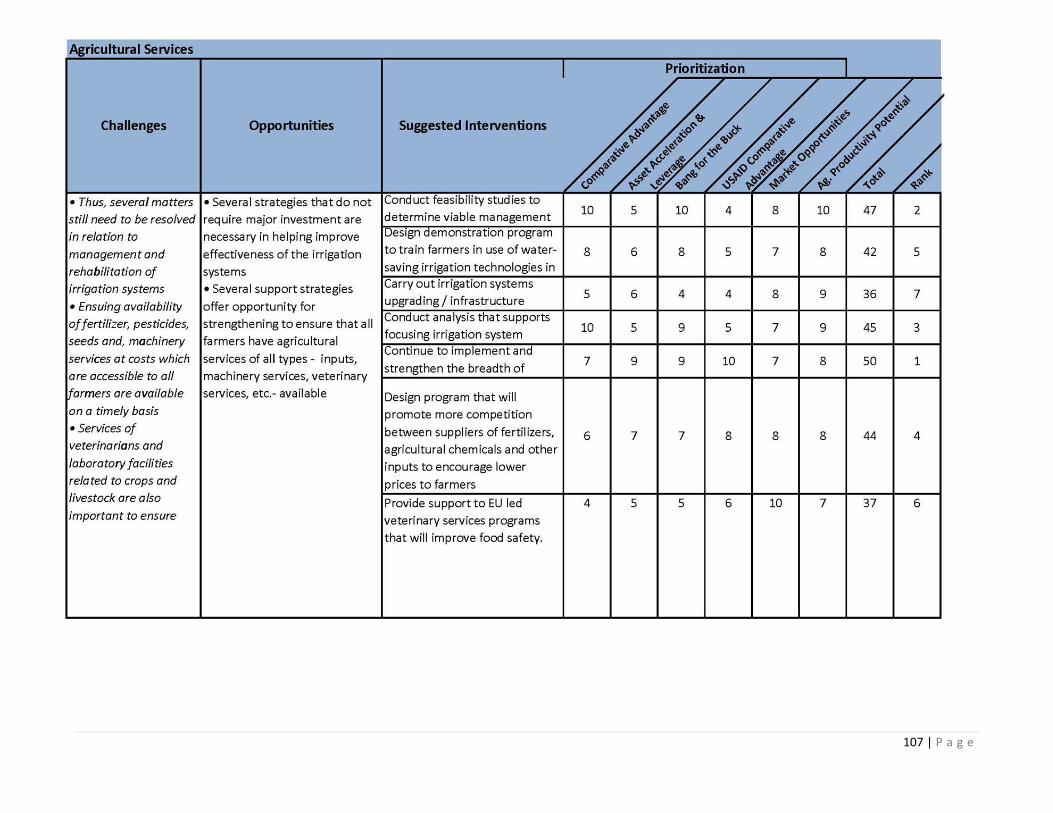
107 | P a g e
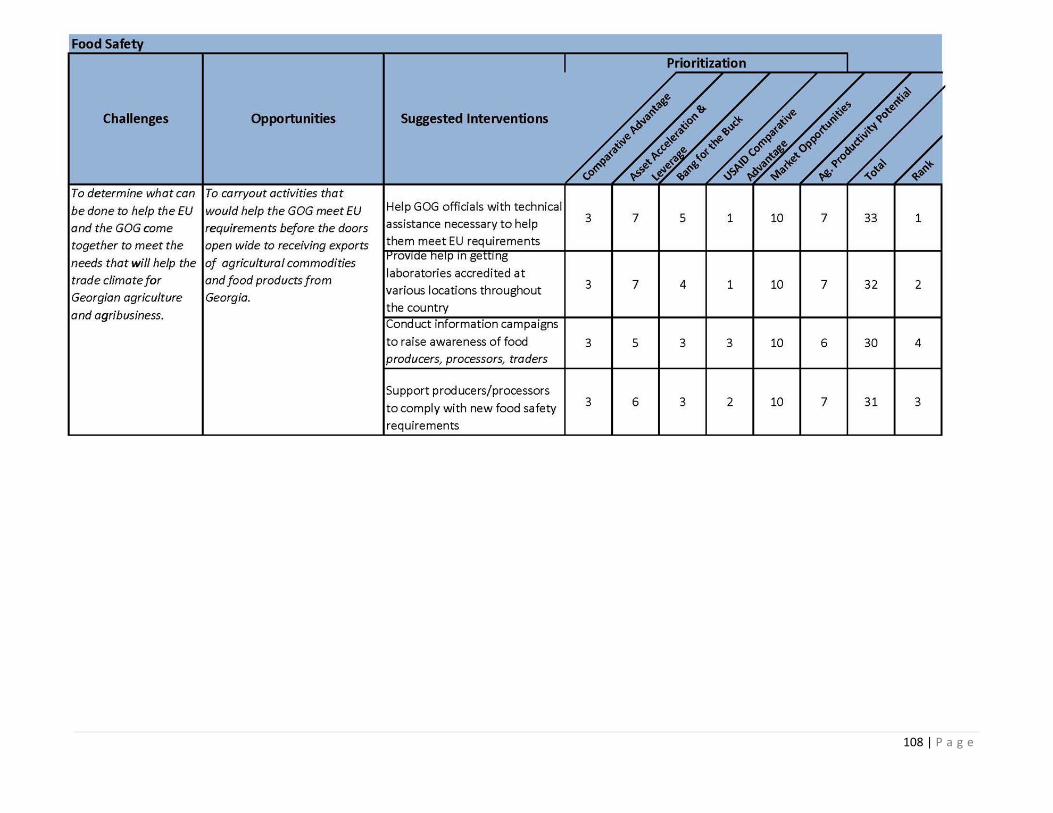
108 | P a g e
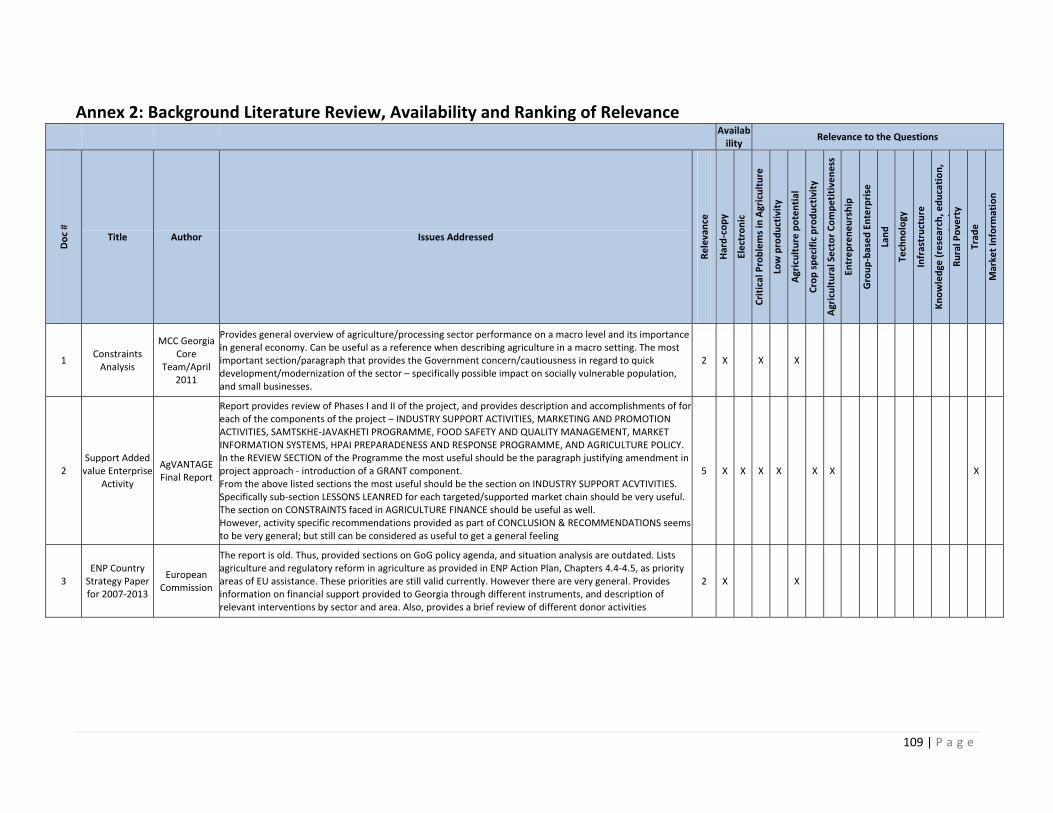
109 | P a g e
Annex 2: Background Literature Review, Availability and Ranking of Relevance
Availability
Relevance to the Questions
Doc #
Title Author Issues Addressed
Relevance
Hard‐copy
Electronic
Critical Problems in Agriculture
Low productivity
Agriculture potential
Crop specific productivity
Agricultural Sector Competitiveness
Entrepreneurship
Group‐based Enterprise
Land
Technology
Infrastructure
Knowledge
(research, education,
i)
Rural Poverty
Trad
e
Market Inform
ation
1 Constraints Analysis
MCC Georgia Core
Team/April 2011
Provides general overview of agriculture/processing sector performance on a macro level and its importance in general economy. Can be useful as a reference when describing agriculture in a macro setting. The most important section/paragraph that provides the Government concern/cautiousness in regard to quick development/modernization of the sector – specifically possible impact on socially vulnerable population, and small businesses.
2 X
X
X
2 Support Added value Enterprise
Activity
AgVANTAGE Final Report
Report provides review of Phases I and II of the project, and provides description and accomplishments of for each of the components of the project – INDUSTRY SUPPORT ACTIVITIES, MARKETING AND PROMOTION ACTIVITIES, SAMTSKHE‐JAVAKHETI PROGRAMME, FOOD SAFETY AND QUALITY MANAGEMENT, MARKET INFORMATION SYSTEMS, HPAI PREPARADENESS AND RESPONSE PROGRAMME, AND AGRICULTURE POLICY. In the REVIEW SECTION of the Programme the most useful should be the paragraph justifying amendment in project approach ‐ introduction of a GRANT component. From the above listed sections the most useful should be the section on INDUSTRY SUPPORT ACVTIVITIES. Specifically sub‐section LESSONS LEANRED for each targeted/supported market chain should be very useful. The section on CONSTRAINTS faced in AGRICULTURE FINANCE should be useful as well. However, activity specific recommendations provided as part of CONCLUSION & RECOMMENDATIONS seems to be very general; but still can be considered as useful to get a general feeling
5 X X X X
X X
X
3 ENP Country Strategy Paper for 2007‐2013
European Commission
The report is old. Thus, provided sections on GoG policy agenda, and situation analysis are outdated. Lists agriculture and regulatory reform in agriculture as provided in ENP Action Plan, Chapters 4.4‐4.5, as priority areas of EU assistance. These priorities are still valid currently. However there are very general. Provides information on financial support provided to Georgia through different instruments, and description of relevant interventions by sector and area. Also, provides a brief review of different donor activities
2 X
X
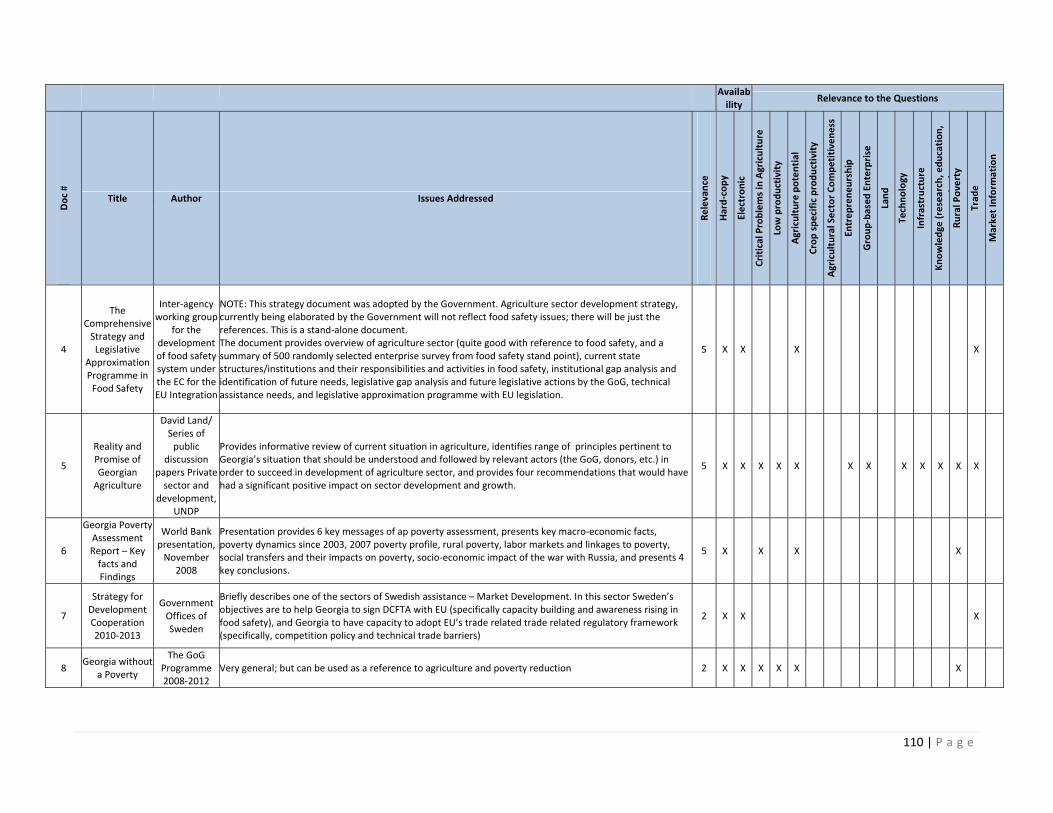
110 | P a g e
Availability
Relevance to the Questions
Doc #
Title Author Issues Addressed
Relevance
Hard‐copy
Electronic
Critical Problems in Agriculture
Low productivity
Agriculture potential
Crop specific productivity
Agricultural Sector Competitiveness
Entrepreneurship
Group‐based Enterprise
Land
Technology
Infrastructure
Knowledge
(research, education,
i)
Rural Poverty
Trad
e
Market Inform
ation
4
The Comprehensive Strategy and Legislative
Approximation Programme in Food Safety
Inter‐agency working group
for the development of food safety system under the EC for the EU Integration
NOTE: This strategy document was adopted by the Government. Agriculture sector development strategy, currently being elaborated by the Government will not reflect food safety issues; there will be just the references. This is a stand‐alone document. The document provides overview of agriculture sector (quite good with reference to food safety, and a summary of 500 randomly selected enterprise survey from food safety stand point), current state structures/institutions and their responsibilities and activities in food safety, institutional gap analysis and identification of future needs, legislative gap analysis and future legislative actions by the GoG, technical assistance needs, and legislative approximation programme with EU legislation.
5 X X
X
X
5
Reality and Promise of Georgian Agriculture
David Land/ Series of public
discussion papers Private sector and
development, UNDP
Provides informative review of current situation in agriculture, identifies range of principles pertinent to Georgia’s situation that should be understood and followed by relevant actors (the GoG, donors, etc.) in order to succeed in development of agriculture sector, and provides four recommendations that would have had a significant positive impact on sector development and growth.
5 X X X X X
X X
X X X X X
6
Georgia Poverty Assessment Report – Key facts and Findings
World Bank presentation, November
2008
Presentation provides 6 key messages of ap poverty assessment, presents key macro‐economic facts, poverty dynamics since 2003, 2007 poverty profile, rural poverty, labor markets and linkages to poverty, social transfers and their impacts on poverty, socio‐economic impact of the war with Russia, and presents 4 key conclusions.
5 X
X
X
X
7
Strategy for Development Cooperation 2010‐2013
Government Offices of Sweden
Briefly describes one of the sectors of Swedish assistance – Market Development. In this sector Sweden’s objectives are to help Georgia to sign DCFTA with EU (specifically capacity building and awareness rising in food safety), and Georgia to have capacity to adopt EU’s trade related trade related regulatory framework (specifically, competition policy and technical trade barriers)
2 X X
X
8 Georgia without
a Poverty
The GoG Programme 2008‐2012
Very general; but can be used as a reference to agriculture and poverty reduction 2 X X X X X
X
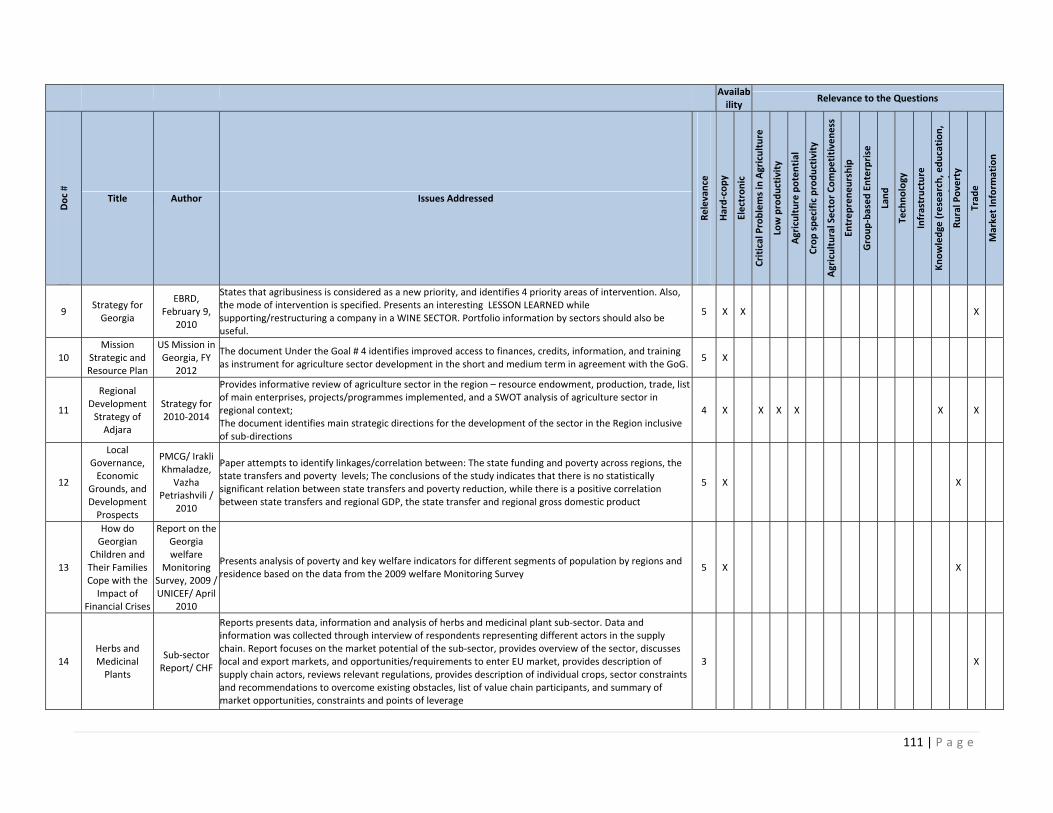
111 | P a g e
Availability
Relevance to the Questions
Doc #
Title Author Issues Addressed
Relevance
Hard‐copy
Electronic
Critical Problems in Agriculture
Low productivity
Agriculture potential
Crop specific productivity
Agricultural Sector Competitiveness
Entrepreneurship
Group‐based Enterprise
Land
Technology
Infrastructure
Knowledge
(research, education,
i)
Rural Poverty
Trad
e
Market Inform
ation
9 Strategy for Georgia
EBRD, February 9,
2010
States that agribusiness is considered as a new priority, and identifies 4 priority areas of intervention. Also, the mode of intervention is specified. Presents an interesting LESSON LEARNED while supporting/restructuring a company in a WINE SECTOR. Portfolio information by sectors should also be useful.
5 X X
X
10 Mission
Strategic and Resource Plan
US Mission in Georgia, FY
2012
The document Under the Goal # 4 identifies improved access to finances, credits, information, and training as instrument for agriculture sector development in the short and medium term in agreement with the GoG.
5 X
11
Regional Development Strategy of Adjara
Strategy for 2010‐2014
Provides informative review of agriculture sector in the region – resource endowment, production, trade, list of main enterprises, projects/programmes implemented, and a SWOT analysis of agriculture sector in regional context; The document identifies main strategic directions for the development of the sector in the Region inclusive of sub‐directions
4 X
X X X
X
X
12
Local Governance, Economic
Grounds, and Development Prospects
PMCG/ Irakli Khmaladze,
Vazha Petriashvili /
2010
Paper attempts to identify linkages/correlation between: The state funding and poverty across regions, the state transfers and poverty levels; The conclusions of the study indicates that there is no statistically significant relation between state transfers and poverty reduction, while there is a positive correlation between state transfers and regional GDP, the state transfer and regional gross domestic product
5 X
X
13
How do Georgian
Children and Their Families Cope with the Impact of
Financial Crises
Report on the Georgia welfare
Monitoring Survey, 2009 / UNICEF/ April
2010
Presents analysis of poverty and key welfare indicators for different segments of population by regions and residence based on the data from the 2009 welfare Monitoring Survey
5 X
X
14 Herbs and Medicinal Plants
Sub‐sector Report/ CHF
Reports presents data, information and analysis of herbs and medicinal plant sub‐sector. Data and information was collected through interview of respondents representing different actors in the supply chain. Report focuses on the market potential of the sub‐sector, provides overview of the sector, discusses local and export markets, and opportunities/requirements to enter EU market, provides description of supply chain actors, reviews relevant regulations, provides description of individual crops, sector constraints and recommendations to overcome existing obstacles, list of value chain participants, and summary of market opportunities, constraints and points of leverage
3
X
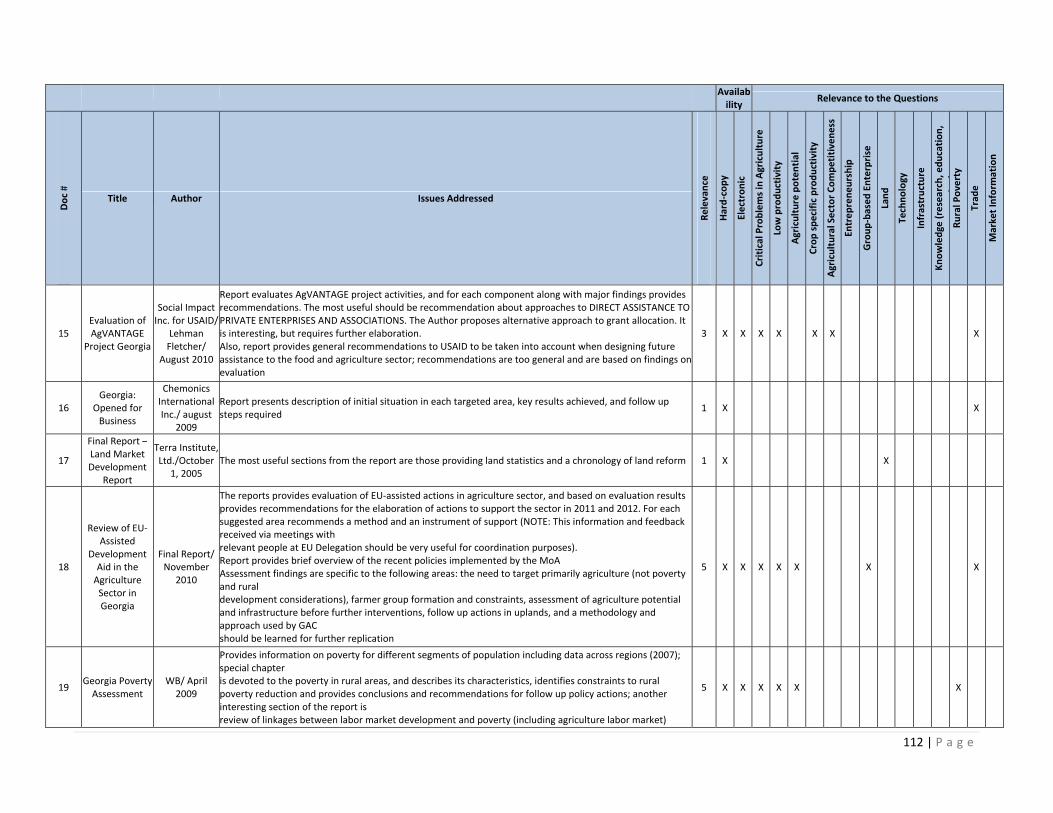
112 | P a g e
Availability
Relevance to the Questions
Doc #
Title Author Issues Addressed
Relevance
Hard‐copy
Electronic
Critical Problems in Agriculture
Low productivity
Agriculture potential
Crop specific productivity
Agricultural Sector Competitiveness
Entrepreneurship
Group‐based Enterprise
Land
Technology
Infrastructure
Knowledge
(research, education,
i)
Rural Poverty
Trad
e
Market Inform
ation
15 Evaluation of AgVANTAGE
Project Georgia
Social Impact Inc. for USAID/
Lehman Fletcher/
August 2010
Report evaluates AgVANTAGE project activities, and for each component along with major findings provides recommendations. The most useful should be recommendation about approaches to DIRECT ASSISTANCE TO PRIVATE ENTERPRISES AND ASSOCIATIONS. The Author proposes alternative approach to grant allocation. It is interesting, but requires further elaboration. Also, report provides general recommendations to USAID to be taken into account when designing future assistance to the food and agriculture sector; recommendations are too general and are based on findings on evaluation
3 X X X X
X X
X
16 Georgia:
Opened for Business
Chemonics International Inc./ august
2009
Report presents description of initial situation in each targeted area, key results achieved, and follow up steps required
1 X
X
17
Final Report – Land Market Development
Report
Terra Institute, Ltd./October
1, 2005 The most useful sections from the report are those providing land statistics and a chronology of land reform 1 X
X
18
Review of EU‐Assisted
Development Aid in the Agriculture Sector in Georgia
Final Report/ November
2010
The reports provides evaluation of EU‐assisted actions in agriculture sector, and based on evaluation results provides recommendations for the elaboration of actions to support the sector in 2011 and 2012. For each suggested area recommends a method and an instrument of support (NOTE: This information and feedback received via meetings with relevant people at EU Delegation should be very useful for coordination purposes). Report provides brief overview of the recent policies implemented by the MoA Assessment findings are specific to the following areas: the need to target primarily agriculture (not poverty and rural development considerations), farmer group formation and constraints, assessment of agriculture potential and infrastructure before further interventions, follow up actions in uplands, and a methodology and approach used by GAC should be learned for further replication
5 X X X X X
X
X
19 Georgia Poverty Assessment
WB/ April 2009
Provides information on poverty for different segments of population including data across regions (2007); special chapter is devoted to the poverty in rural areas, and describes its characteristics, identifies constraints to rural poverty reduction and provides conclusions and recommendations for follow up policy actions; another interesting section of the report is review of linkages between labor market development and poverty (including agriculture labor market)
5 X X X X X
X
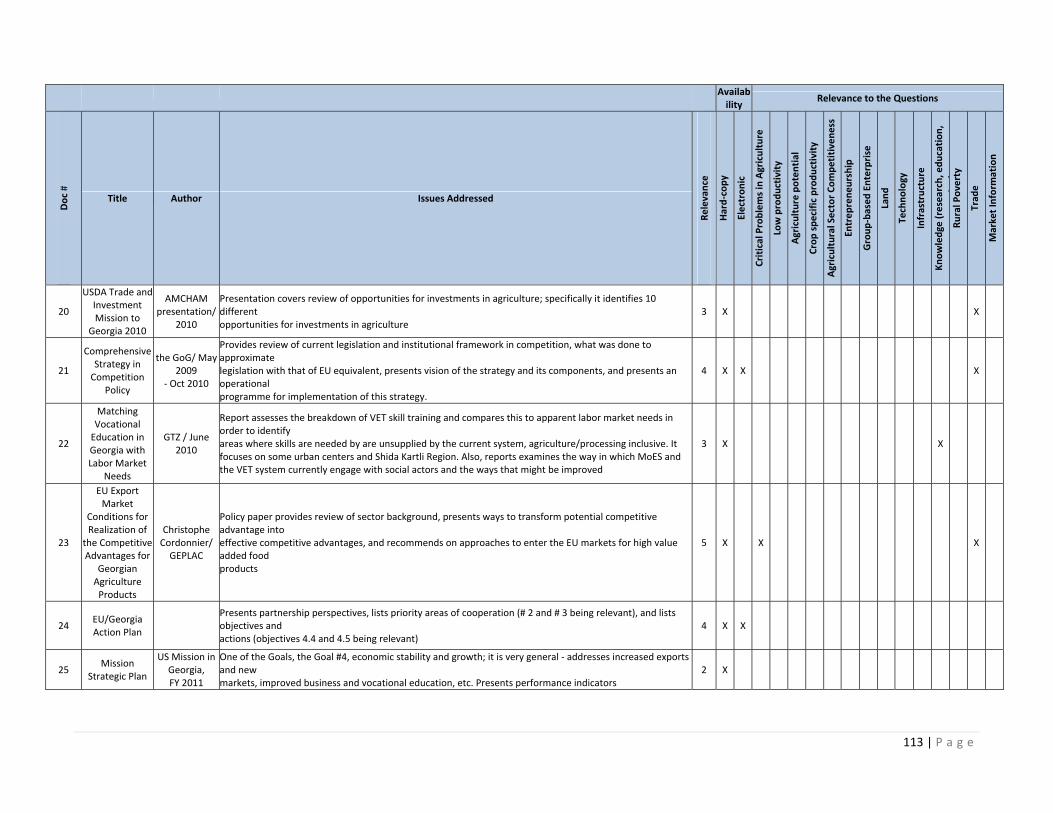
113 | P a g e
Availability
Relevance to the Questions
Doc #
Title Author Issues Addressed
Relevance
Hard‐copy
Electronic
Critical Problems in Agriculture
Low productivity
Agriculture potential
Crop specific productivity
Agricultural Sector Competitiveness
Entrepreneurship
Group‐based Enterprise
Land
Technology
Infrastructure
Knowledge
(research, education,
i)
Rural Poverty
Trad
e
Market Inform
ation
20
USDA Trade and Investment Mission to
Georgia 2010
AMCHAM presentation/
2010
Presentation covers review of opportunities for investments in agriculture; specifically it identifies 10 different opportunities for investments in agriculture
3 X
X
21
Comprehensive Strategy in Competition
Policy
the GoG/ May 2009
‐ Oct 2010
Provides review of current legislation and institutional framework in competition, what was done to approximate legislation with that of EU equivalent, presents vision of the strategy and its components, and presents an operational programme for implementation of this strategy.
4 X X
X
22
Matching Vocational Education in Georgia with Labor Market
Needs
GTZ / June 2010
Report assesses the breakdown of VET skill training and compares this to apparent labor market needs in order to identify areas where skills are needed by are unsupplied by the current system, agriculture/processing inclusive. It focuses on some urban centers and Shida Kartli Region. Also, reports examines the way in which MoES and the VET system currently engage with social actors and the ways that might be improved
3 X
X
23
EU Export Market
Conditions for Realization of
the Competitive Advantages for
Georgian Agriculture Products
Christophe Cordonnier/ GEPLAC
Policy paper provides review of sector background, presents ways to transform potential competitive advantage into effective competitive advantages, and recommends on approaches to enter the EU markets for high value added food products
5 X
X
X
24 EU/Georgia Action Plan
Presents partnership perspectives, lists priority areas of cooperation (# 2 and # 3 being relevant), and lists objectives and actions (objectives 4.4 and 4.5 being relevant)
4 X X
25 Mission
Strategic Plan
US Mission in Georgia, FY 2011
One of the Goals, the Goal #4, economic stability and growth; it is very general ‐ addresses increased exports and new markets, improved business and vocational education, etc. Presents performance indicators
2 X
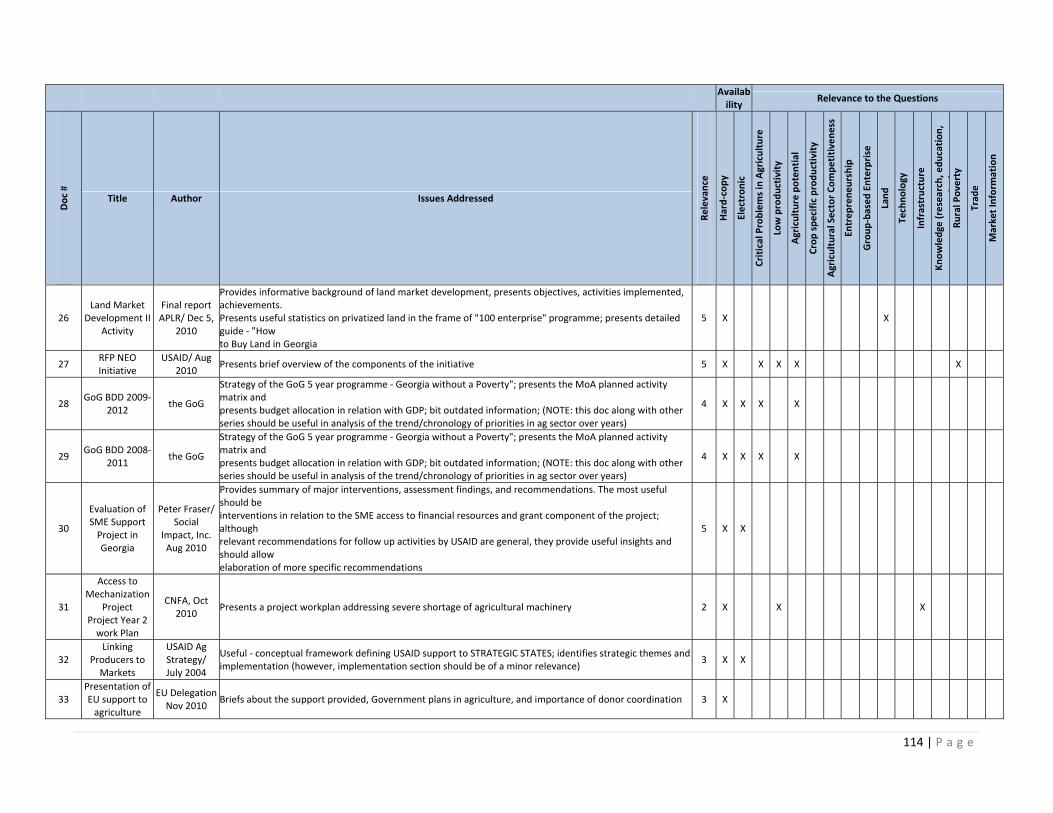
114 | P a g e
Availability
Relevance to the Questions
Doc #
Title Author Issues Addressed
Relevance
Hard‐copy
Electronic
Critical Problems in Agriculture
Low productivity
Agriculture potential
Crop specific productivity
Agricultural Sector Competitiveness
Entrepreneurship
Group‐based Enterprise
Land
Technology
Infrastructure
Knowledge
(research, education,
i)
Rural Poverty
Trad
e
Market Inform
ation
26 Land Market
Development II Activity
Final report APLR/ Dec 5,
2010
Provides informative background of land market development, presents objectives, activities implemented, achievements. Presents useful statistics on privatized land in the frame of "100 enterprise" programme; presents detailed guide ‐ "How to Buy Land in Georgia
5 X
X
27 RFP NEO Initiative
USAID/ Aug 2010
Presents brief overview of the components of the initiative 5 X
X X X
X
28 GoG BDD 2009‐
2012 the GoG
Strategy of the GoG 5 year programme ‐ Georgia without a Poverty"; presents the MoA planned activity matrix and presents budget allocation in relation with GDP; bit outdated information; (NOTE: this doc along with other series should be useful in analysis of the trend/chronology of priorities in ag sector over years)
4 X X X
X
29 GoG BDD 2008‐
2011 the GoG
Strategy of the GoG 5 year programme ‐ Georgia without a Poverty"; presents the MoA planned activity matrix and presents budget allocation in relation with GDP; bit outdated information; (NOTE: this doc along with other series should be useful in analysis of the trend/chronology of priorities in ag sector over years)
4 X X X
X
30
Evaluation of SME Support Project in Georgia
Peter Fraser/ Social
Impact, Inc. Aug 2010
Provides summary of major interventions, assessment findings, and recommendations. The most useful should be interventions in relation to the SME access to financial resources and grant component of the project; although relevant recommendations for follow up activities by USAID are general, they provide useful insights and should allow elaboration of more specific recommendations
5 X X
31
Access to Mechanization
Project Project Year 2 work Plan
CNFA, Oct 2010
Presents a project workplan addressing severe shortage of agricultural machinery 2 X
X
X
32 Linking
Producers to Markets
USAID Ag Strategy/ July 2004
Useful ‐ conceptual framework defining USAID support to STRATEGIC STATES; identifies strategic themes andimplementation (however, implementation section should be of a minor relevance)
3 X X
33 Presentation of EU support to agriculture
EU Delegation Nov 2010
Briefs about the support provided, Government plans in agriculture, and importance of donor coordination 3 X
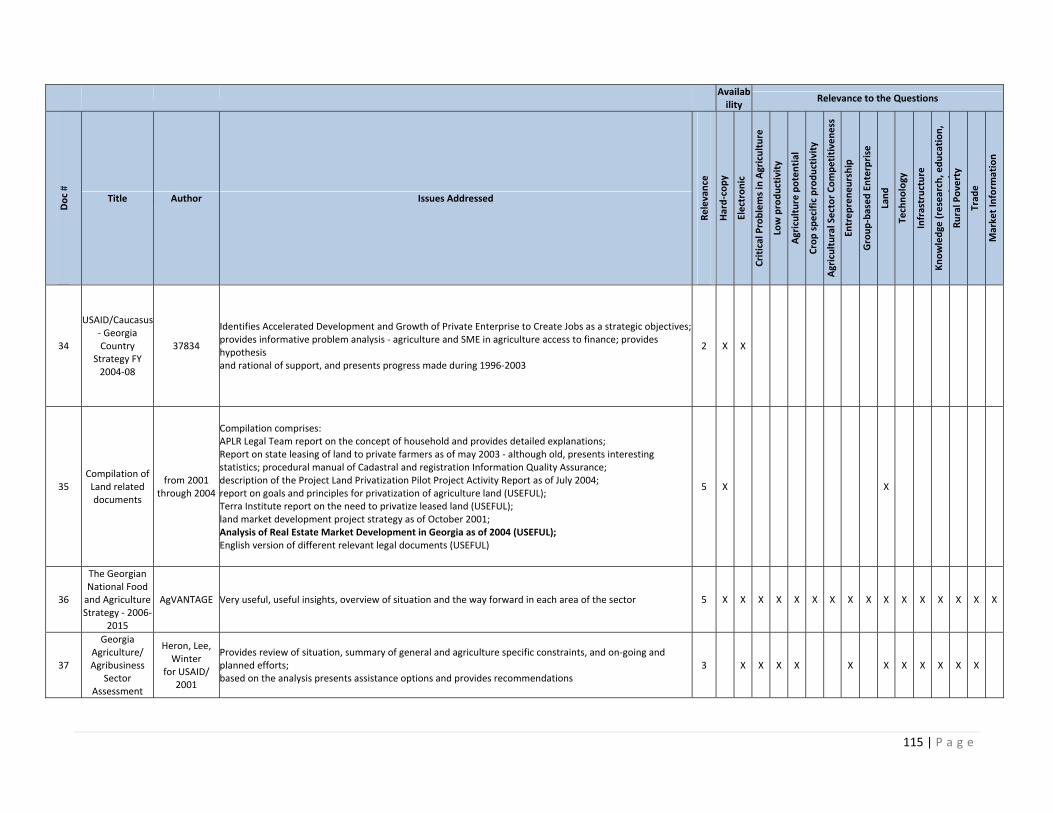
115 | P a g e
Availability
Relevance to the Questions
Doc #
Title Author Issues Addressed
Relevance
Hard‐copy
Electronic
Critical Problems in Agriculture
Low productivity
Agriculture potential
Crop specific productivity
Agricultural Sector Competitiveness
Entrepreneurship
Group‐based Enterprise
Land
Technology
Infrastructure
Knowledge
(research, education,
i)
Rural Poverty
Trad
e
Market Inform
ation
34
USAID/Caucasus ‐ Georgia Country
Strategy FY 2004‐08
37834
Identifies Accelerated Development and Growth of Private Enterprise to Create Jobs as a strategic objectives; provides informative problem analysis ‐ agriculture and SME in agriculture access to finance; provides hypothesis and rational of support, and presents progress made during 1996‐2003
2 X X
35 Compilation of Land related documents
from 2001 through 2004
Compilation comprises: APLR Legal Team report on the concept of household and provides detailed explanations; Report on state leasing of land to private farmers as of may 2003 ‐ although old, presents interesting statistics; procedural manual of Cadastral and registration Information Quality Assurance; description of the Project Land Privatization Pilot Project Activity Report as of July 2004; report on goals and principles for privatization of agriculture land (USEFUL); Terra Institute report on the need to privatize leased land (USEFUL); land market development project strategy as of October 2001; Analysis of Real Estate Market Development in Georgia as of 2004 (USEFUL); English version of different relevant legal documents (USEFUL)
5 X
X
36
The Georgian National Food and Agriculture Strategy ‐ 2006‐
2015
AgVANTAGE Very useful, useful insights, overview of situation and the way forward in each area of the sector 5 X X X X X X X X X X X X X X X X
37
Georgia Agriculture/ Agribusiness
Sector Assessment
Heron, Lee, Winter
for USAID/ 2001
Provides review of situation, summary of general and agriculture specific constraints, and on‐going and planned efforts; based on the analysis presents assistance options and provides recommendations
3
X X X X
X
X X X X X X
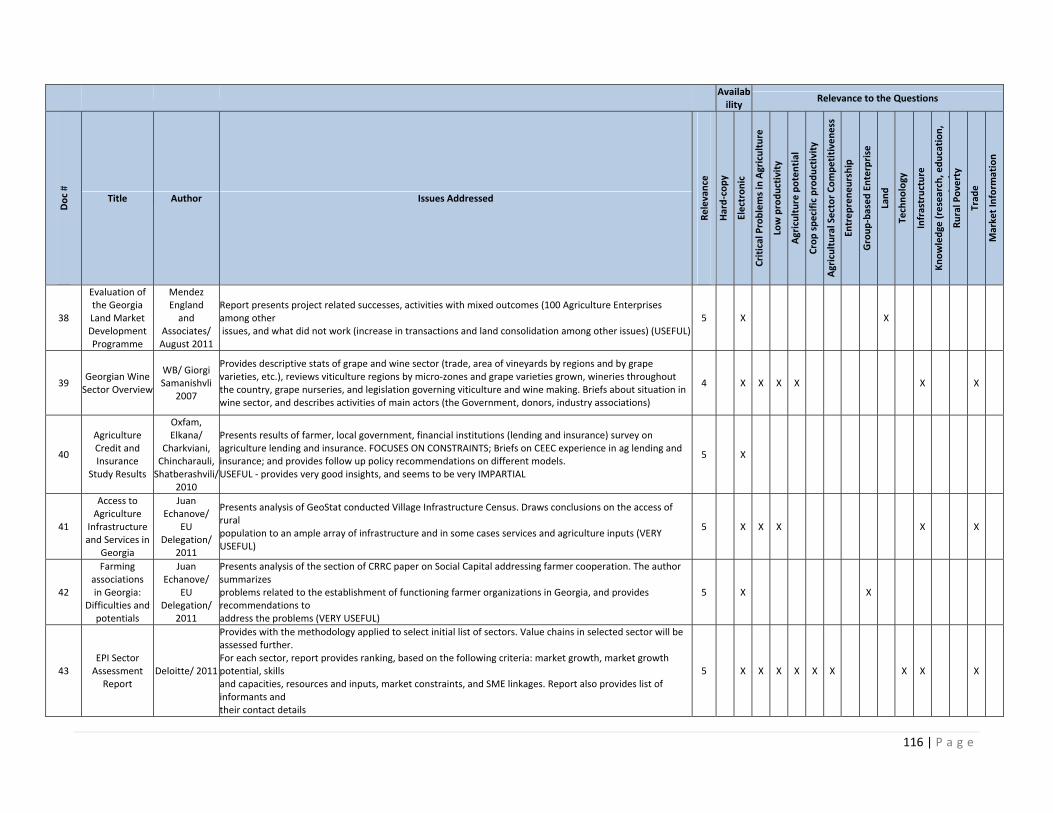
116 | P a g e
Availability
Relevance to the Questions
Doc #
Title Author Issues Addressed
Relevance
Hard‐copy
Electronic
Critical Problems in Agriculture
Low productivity
Agriculture potential
Crop specific productivity
Agricultural Sector Competitiveness
Entrepreneurship
Group‐based Enterprise
Land
Technology
Infrastructure
Knowledge
(research, education,
i)
Rural Poverty
Trad
e
Market Inform
ation
38
Evaluation of the Georgia Land Market Development Programme
Mendez England and
Associates/ August 2011
Report presents project related successes, activities with mixed outcomes (100 Agriculture Enterprises among other issues, and what did not work (increase in transactions and land consolidation among other issues) (USEFUL)
5
X
X
39 Georgian Wine Sector Overview
WB/ Giorgi Samanishvli
2007
Provides descriptive stats of grape and wine sector (trade, area of vineyards by regions and by grape varieties, etc.), reviews viticulture regions by micro‐zones and grape varieties grown, wineries throughout the country, grape nurseries, and legislation governing viticulture and wine making. Briefs about situation in wine sector, and describes activities of main actors (the Government, donors, industry associations)
4
X X X X
X
X
40
Agriculture Credit and Insurance
Study Results
Oxfam, Elkana/
Charkviani, Chincharauli, Shatberashvili/
2010
Presents results of farmer, local government, financial institutions (lending and insurance) survey on agriculture lending and insurance. FOCUSES ON CONSTRAINTS; Briefs on CEEC experience in ag lending and insurance; and provides follow up policy recommendations on different models. USEFUL ‐ provides very good insights, and seems to be very IMPARTIAL
5
X
41
Access to Agriculture
Infrastructure and Services in
Georgia
Juan Echanove/
EU Delegation/
2011
Presents analysis of GeoStat conducted Village Infrastructure Census. Draws conclusions on the access of rural population to an ample array of infrastructure and in some cases services and agriculture inputs (VERY USEFUL)
5
X X X
X
X
42
Farming associations in Georgia:
Difficulties and potentials
Juan Echanove/
EU Delegation/
2011
Presents analysis of the section of CRRC paper on Social Capital addressing farmer cooperation. The author summarizes problems related to the establishment of functioning farmer organizations in Georgia, and provides recommendations to address the problems (VERY USEFUL)
5
X
X
43 EPI Sector Assessment
Report Deloitte/ 2011
Provides with the methodology applied to select initial list of sectors. Value chains in selected sector will be assessed further. For each sector, report provides ranking, based on the following criteria: market growth, market growth potential, skills and capacities, resources and inputs, market constraints, and SME linkages. Report also provides list of informants and their contact details
5
X X X X X X
X X
X
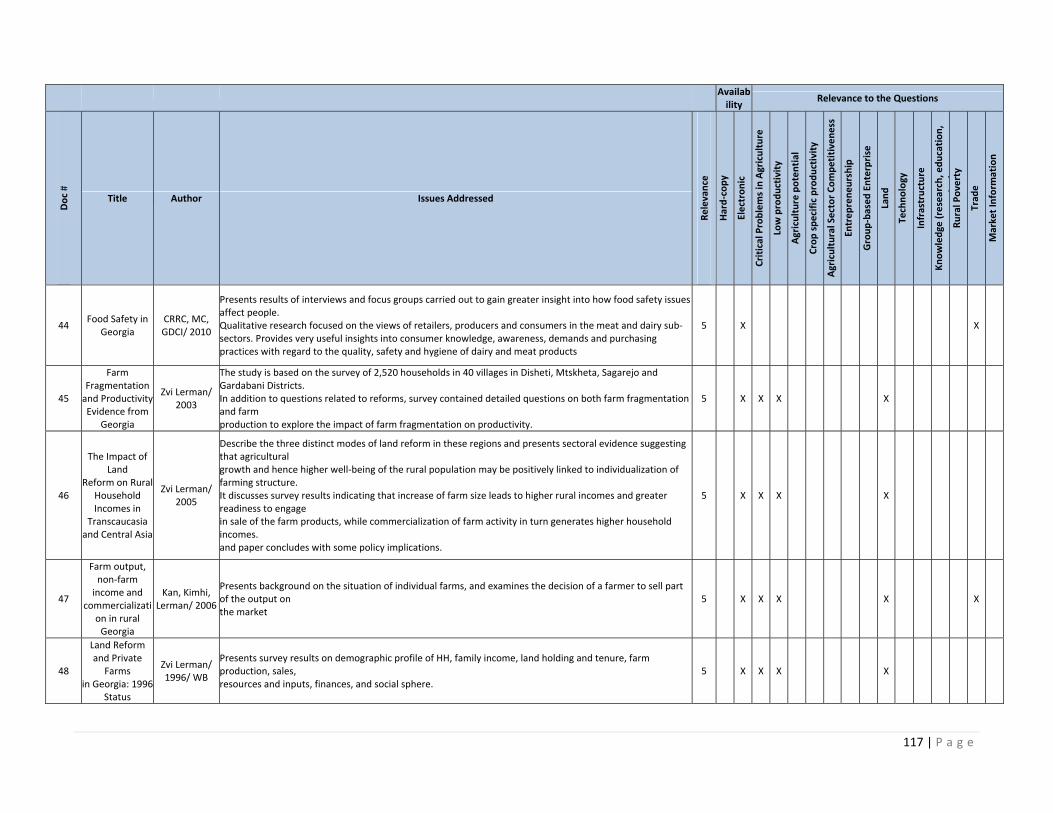
117 | P a g e
Availability
Relevance to the Questions
Doc #
Title Author Issues Addressed
Relevance
Hard‐copy
Electronic
Critical Problems in Agriculture
Low productivity
Agriculture potential
Crop specific productivity
Agricultural Sector Competitiveness
Entrepreneurship
Group‐based Enterprise
Land
Technology
Infrastructure
Knowledge
(research, education,
i)
Rural Poverty
Trad
e
Market Inform
ation
44 Food Safety in
Georgia CRRC, MC, GDCI/ 2010
Presents results of interviews and focus groups carried out to gain greater insight into how food safety issues affect people. Qualitative research focused on the views of retailers, producers and consumers in the meat and dairy sub‐sectors. Provides very useful insights into consumer knowledge, awareness, demands and purchasing practices with regard to the quality, safety and hygiene of dairy and meat products
5
X
X
45
Farm Fragmentation and Productivity Evidence from
Georgia
Zvi Lerman/ 2003
The study is based on the survey of 2,520 households in 40 villages in Disheti, Mtskheta, Sagarejo and Gardabani Districts. In addition to questions related to reforms, survey contained detailed questions on both farm fragmentation and farm production to explore the impact of farm fragmentation on productivity.
5
X X X
X
46
The Impact of Land
Reform on Rural Household Incomes in
Transcaucasia and Central Asia
Zvi Lerman/ 2005
Describe the three distinct modes of land reform in these regions and presents sectoral evidence suggesting that agricultural growth and hence higher well‐being of the rural population may be positively linked to individualization of farming structure. It discusses survey results indicating that increase of farm size leads to higher rural incomes and greater readiness to engage in sale of the farm products, while commercialization of farm activity in turn generates higher household incomes. and paper concludes with some policy implications.
5
X X X
X
47
Farm output, non‐farm income and
commercialization in rural Georgia
Kan, Kimhi, Lerman/ 2006
Presents background on the situation of individual farms, and examines the decision of a farmer to sell part of the output on the market
5
X X X
X
X
48
Land Reform and Private
Farms in Georgia: 1996
Status
Zvi Lerman/ 1996/ WB
Presents survey results on demographic profile of HH, family income, land holding and tenure, farm production, sales, resources and inputs, finances, and social sphere.
5
X X X
X
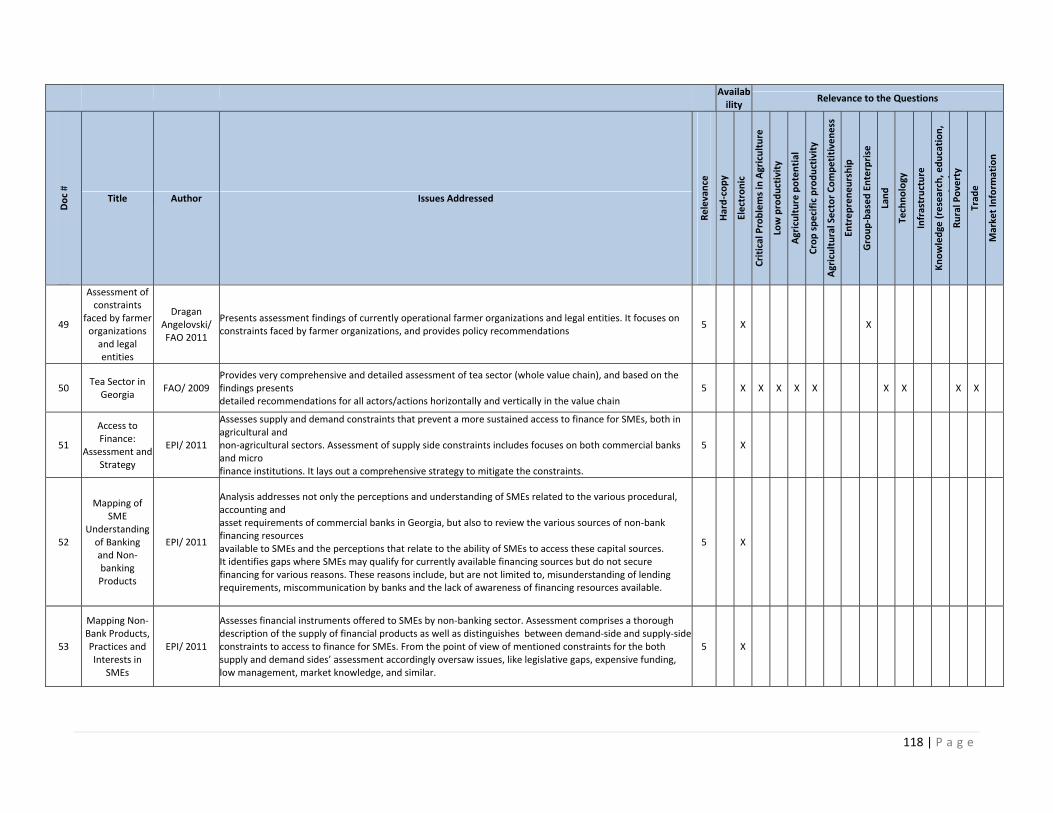
118 | P a g e
Availability
Relevance to the Questions
Doc #
Title Author Issues Addressed
Relevance
Hard‐copy
Electronic
Critical Problems in Agriculture
Low productivity
Agriculture potential
Crop specific productivity
Agricultural Sector Competitiveness
Entrepreneurship
Group‐based Enterprise
Land
Technology
Infrastructure
Knowledge
(research, education,
i)
Rural Poverty
Trad
e
Market Inform
ation
49
Assessment of constraints
faced by farmer organizations and legal entities
Dragan Angelovski/ FAO 2011
Presents assessment findings of currently operational farmer organizations and legal entities. It focuses on constraints faced by farmer organizations, and provides policy recommendations
5
X
X
50 Tea Sector in
Georgia FAO/ 2009
Provides very comprehensive and detailed assessment of tea sector (whole value chain), and based on the findings presents detailed recommendations for all actors/actions horizontally and vertically in the value chain
5
X X X X X
X X
X X
51
Access to Finance:
Assessment and Strategy
EPI/ 2011
Assesses supply and demand constraints that prevent a more sustained access to finance for SMEs, both in agricultural and non‐agricultural sectors. Assessment of supply side constraints includes focuses on both commercial banks and micro finance institutions. It lays out a comprehensive strategy to mitigate the constraints.
5
X
52
Mapping of SME
Understanding of Banking and Non‐banking Products
EPI/ 2011
Analysis addresses not only the perceptions and understanding of SMEs related to the various procedural, accounting and asset requirements of commercial banks in Georgia, but also to review the various sources of non‐bank financing resources available to SMEs and the perceptions that relate to the ability of SMEs to access these capital sources. It identifies gaps where SMEs may qualify for currently available financing sources but do not secure financing for various reasons. These reasons include, but are not limited to, misunderstanding of lending requirements, miscommunication by banks and the lack of awareness of financing resources available.
5
X
53
Mapping Non‐Bank Products, Practices and Interests in
SMEs
EPI/ 2011
Assesses financial instruments offered to SMEs by non‐banking sector. Assessment comprises a thorough description of the supply of financial products as well as distinguishes between demand‐side and supply‐side constraints to access to finance for SMEs. From the point of view of mentioned constraints for the both supply and demand sides’ assessment accordingly oversaw issues, like legislative gaps, expensive funding, low management, market knowledge, and similar.
5
X
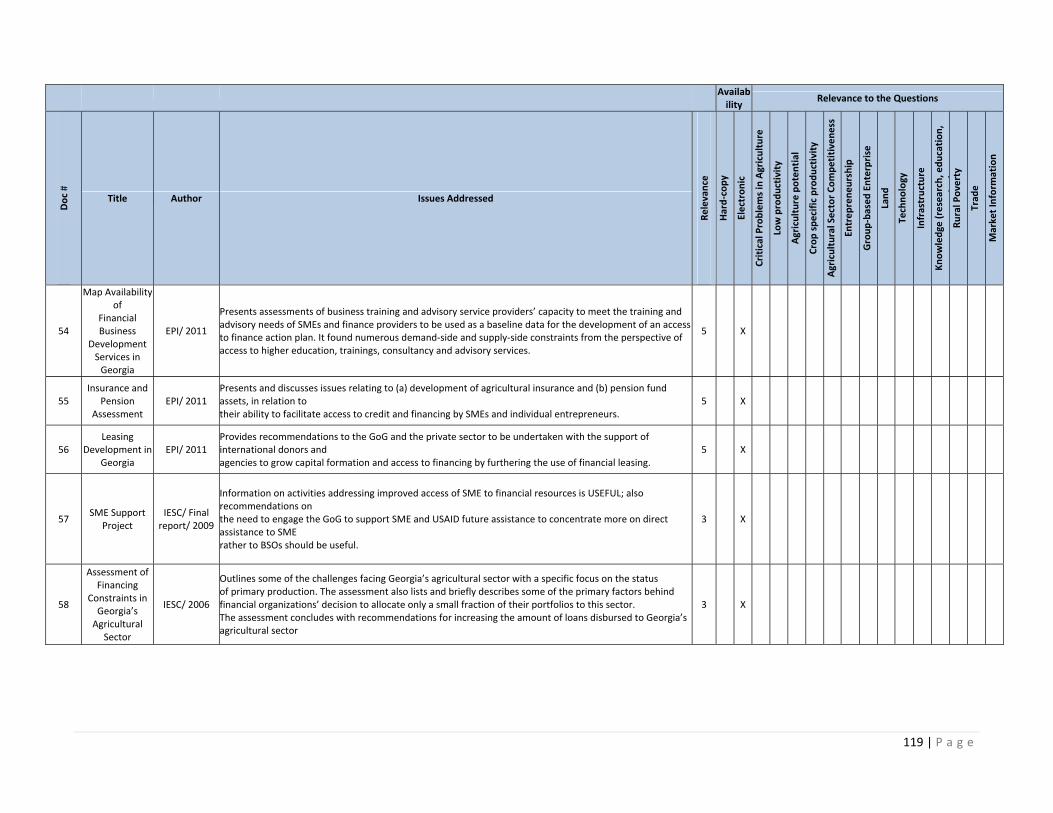
119 | P a g e
Availability
Relevance to the Questions
Doc #
Title Author Issues Addressed
Relevance
Hard‐copy
Electronic
Critical Problems in Agriculture
Low productivity
Agriculture potential
Crop specific productivity
Agricultural Sector Competitiveness
Entrepreneurship
Group‐based Enterprise
Land
Technology
Infrastructure
Knowledge
(research, education,
i)
Rural Poverty
Trad
e
Market Inform
ation
54
Map Availability of
Financial Business
Development Services in Georgia
EPI/ 2011
Presents assessments of business training and advisory service providers’ capacity to meet the training and advisory needs of SMEs and finance providers to be used as a baseline data for the development of an access to finance action plan. It found numerous demand‐side and supply‐side constraints from the perspective of access to higher education, trainings, consultancy and advisory services.
5
X
55 Insurance and
Pension Assessment
EPI/ 2011 Presents and discusses issues relating to (a) development of agricultural insurance and (b) pension fund assets, in relation to their ability to facilitate access to credit and financing by SMEs and individual entrepreneurs.
5
X
56 Leasing
Development in Georgia
EPI/ 2011 Provides recommendations to the GoG and the private sector to be undertaken with the support of international donors and agencies to grow capital formation and access to financing by furthering the use of financial leasing.
5
X
57 SME Support
Project IESC/ Final report/ 2009
Information on activities addressing improved access of SME to financial resources is USEFUL; also recommendations on the need to engage the GoG to support SME and USAID future assistance to concentrate more on direct assistance to SME rather to BSOs should be useful.
3
X
58
Assessment of Financing
Constraints in Georgia’s Agricultural
Sector
IESC/ 2006
Outlines some of the challenges facing Georgia’s agricultural sector with a specific focus on the status of primary production. The assessment also lists and briefly describes some of the primary factors behind financial organizations’ decision to allocate only a small fraction of their portfolios to this sector. The assessment concludes with recommendations for increasing the amount of loans disbursed to Georgia’s agricultural sector
3
X
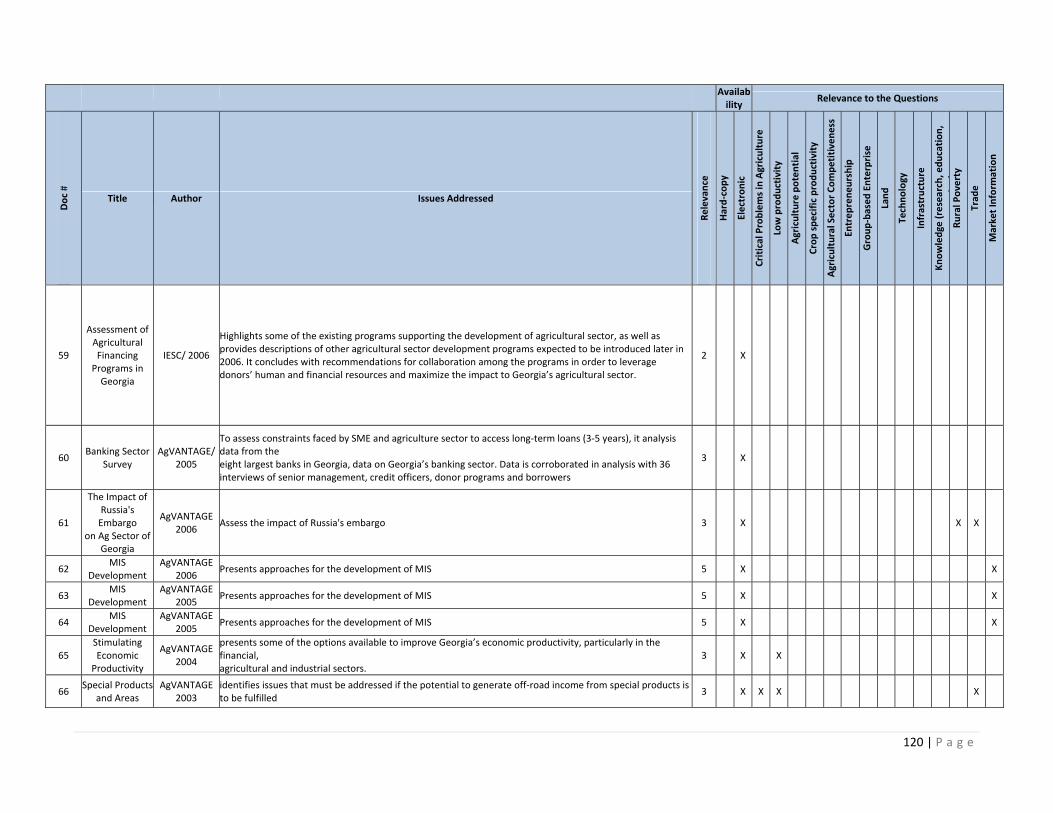
120 | P a g e
Availability
Relevance to the Questions
Doc #
Title Author Issues Addressed
Relevance
Hard‐copy
Electronic
Critical Problems in Agriculture
Low productivity
Agriculture potential
Crop specific productivity
Agricultural Sector Competitiveness
Entrepreneurship
Group‐based Enterprise
Land
Technology
Infrastructure
Knowledge
(research, education,
i)
Rural Poverty
Trad
e
Market Inform
ation
59
Assessment of Agricultural Financing Programs in Georgia
IESC/ 2006
Highlights some of the existing programs supporting the development of agricultural sector, as well as provides descriptions of other agricultural sector development programs expected to be introduced later in 2006. It concludes with recommendations for collaboration among the programs in order to leverage donors’ human and financial resources and maximize the impact to Georgia’s agricultural sector.
2
X
60 Banking Sector
Survey AgVANTAGE/
2005
To assess constraints faced by SME and agriculture sector to access long‐term loans (3‐5 years), it analysis data from the eight largest banks in Georgia, data on Georgia’s banking sector. Data is corroborated in analysis with 36 interviews of senior management, credit officers, donor programs and borrowers
3
X
61
The Impact of Russia's Embargo
on Ag Sector of Georgia
AgVANTAGE 2006
Assess the impact of Russia's embargo 3
X
X X
62 MIS
Development AgVANTAGE
2006 Presents approaches for the development of MIS 5
X
X
63 MIS
Development AgVANTAGE
2005 Presents approaches for the development of MIS 5
X
X
64 MIS
Development AgVANTAGE
2005 Presents approaches for the development of MIS 5
X
X
65 Stimulating Economic Productivity
AgVANTAGE 2004
presents some of the options available to improve Georgia’s economic productivity, particularly in the financial, agricultural and industrial sectors.
3
X
X
66 Special Products
and Areas AgVANTAGE
2003 identifies issues that must be addressed if the potential to generate off‐road income from special products is to be fulfilled
3
X X X
X
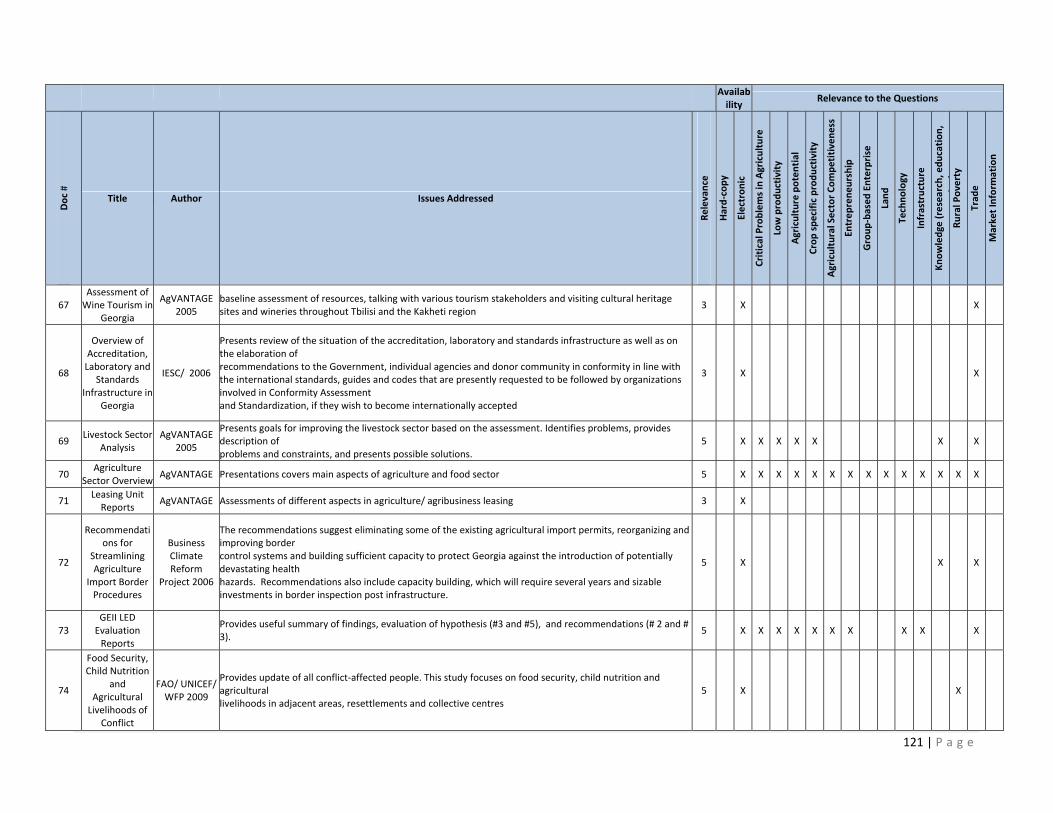
121 | P a g e
Availability
Relevance to the Questions
Doc #
Title Author Issues Addressed
Relevance
Hard‐copy
Electronic
Critical Problems in Agriculture
Low productivity
Agriculture potential
Crop specific productivity
Agricultural Sector Competitiveness
Entrepreneurship
Group‐based Enterprise
Land
Technology
Infrastructure
Knowledge
(research, education,
i)
Rural Poverty
Trad
e
Market Inform
ation
67 Assessment of Wine Tourism in
Georgia
AgVANTAGE 2005
baseline assessment of resources, talking with various tourism stakeholders and visiting cultural heritage sites and wineries throughout Tbilisi and the Kakheti region
3
X
X
68
Overview of Accreditation, Laboratory and
Standards Infrastructure in
Georgia
IESC/ 2006
Presents review of the situation of the accreditation, laboratory and standards infrastructure as well as on the elaboration of recommendations to the Government, individual agencies and donor community in conformity in line with the international standards, guides and codes that are presently requested to be followed by organizations involved in Conformity Assessment and Standardization, if they wish to become internationally accepted
3
X
X
69 Livestock Sector
Analysis AgVANTAGE
2005
Presents goals for improving the livestock sector based on the assessment. Identifies problems, provides description of problems and constraints, and presents possible solutions.
5
X X X X X
X
X
70 Agriculture
Sector Overview AgVANTAGE Presentations covers main aspects of agriculture and food sector 5
X X X X X X X X X X X X X X
71 Leasing Unit Reports
AgVANTAGE Assessments of different aspects in agriculture/ agribusiness leasing 3
X
72
Recommendations for
Streamlining Agriculture
Import Border Procedures
Business Climate Reform
Project 2006
The recommendations suggest eliminating some of the existing agricultural import permits, reorganizing and improving border control systems and building sufficient capacity to protect Georgia against the introduction of potentially devastating health hazards. Recommendations also include capacity building, which will require several years and sizable investments in border inspection post infrastructure.
5
X
X
X
73 GEII LED Evaluation Reports
Provides useful summary of findings, evaluation of hypothesis (#3 and #5), and recommendations (# 2 and # 3).
5
X X X X X X X
X X
X
74
Food Security, Child Nutrition
and Agricultural Livelihoods of
Conflict
FAO/ UNICEF/ WFP 2009
Provides update of all conflict‐affected people. This study focuses on food security, child nutrition and agricultural livelihoods in adjacent areas, resettlements and collective centres
5
X
X
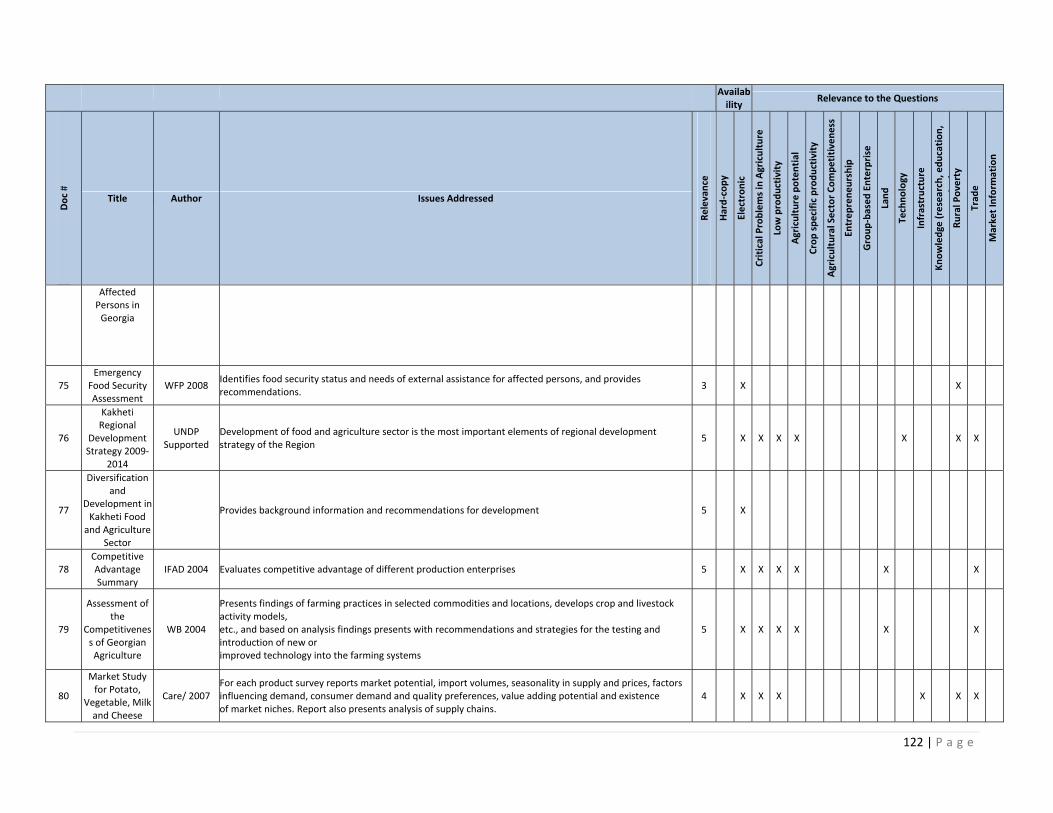
122 | P a g e
Availability
Relevance to the Questions
Doc #
Title Author Issues Addressed
Relevance
Hard‐copy
Electronic
Critical Problems in Agriculture
Low productivity
Agriculture potential
Crop specific productivity
Agricultural Sector Competitiveness
Entrepreneurship
Group‐based Enterprise
Land
Technology
Infrastructure
Knowledge
(research, education,
i)
Rural Poverty
Trad
e
Market Inform
ation
Affected Persons in Georgia
75 Emergency
Food Security Assessment
WFP 2008 Identifies food security status and needs of external assistance for affected persons, and provides recommendations.
3
X
X
76
Kakheti Regional
Development Strategy 2009‐
2014
UNDP Supported
Development of food and agriculture sector is the most important elements of regional development strategy of the Region
5
X X X X
X
X X
77
Diversification and
Development in Kakheti Food and Agriculture
Sector
Provides background information and recommendations for development 5
X
78 Competitive Advantage Summary
IFAD 2004 Evaluates competitive advantage of different production enterprises 5
X X X X
X
X
79
Assessment of the
Competitiveness of Georgian Agriculture
WB 2004
Presents findings of farming practices in selected commodities and locations, develops crop and livestock activity models, etc., and based on analysis findings presents with recommendations and strategies for the testing and introduction of new or improved technology into the farming systems
5
X X X X
X
X
80
Market Study for Potato,
Vegetable, Milk and Cheese
Care/ 2007 For each product survey reports market potential, import volumes, seasonality in supply and prices, factors influencing demand, consumer demand and quality preferences, value adding potential and existence of market niches. Report also presents analysis of supply chains.
4
X X X
X
X X
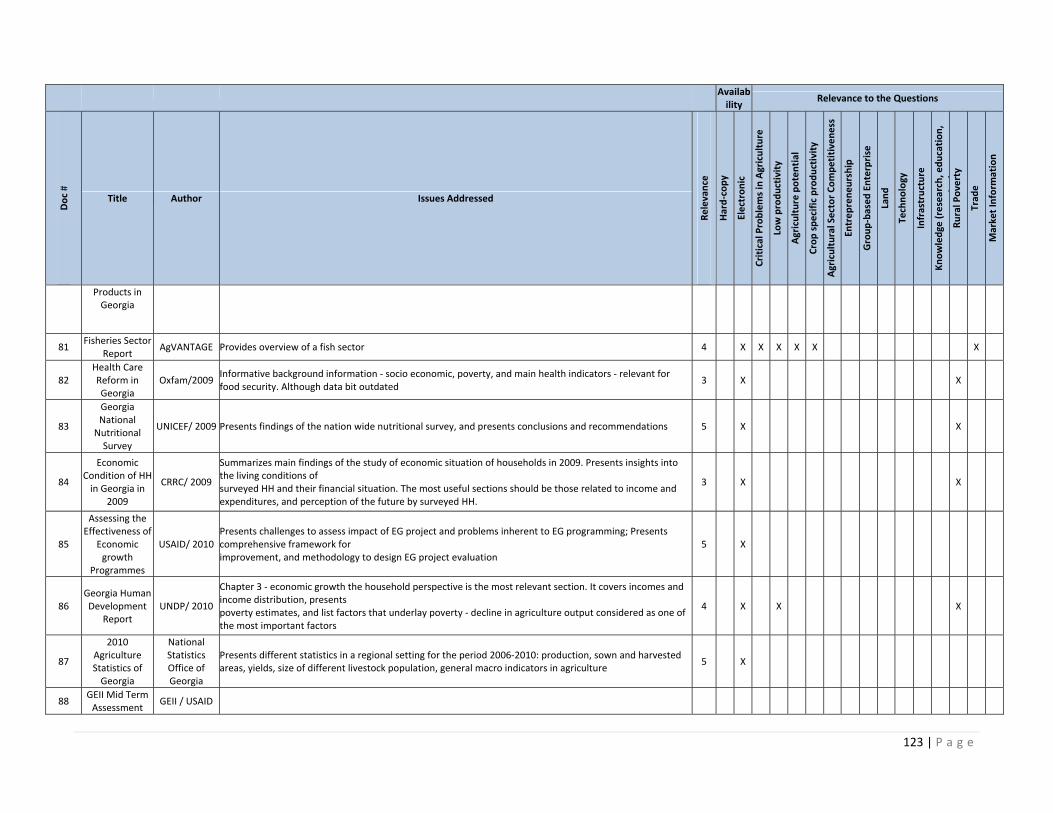
123 | P a g e
Availability
Relevance to the Questions
Doc #
Title Author Issues Addressed
Relevance
Hard‐copy
Electronic
Critical Problems in Agriculture
Low productivity
Agriculture potential
Crop specific productivity
Agricultural Sector Competitiveness
Entrepreneurship
Group‐based Enterprise
Land
Technology
Infrastructure
Knowledge
(research, education,
i)
Rural Poverty
Trad
e
Market Inform
ation
Products in Georgia
81 Fisheries Sector
Report AgVANTAGE Provides overview of a fish sector 4
X X X X X
X
82 Health Care Reform in Georgia
Oxfam/2009 Informative background information ‐ socio economic, poverty, and main health indicators ‐ relevant for food security. Although data bit outdated
3
X
X
83
Georgia National Nutritional Survey
UNICEF/ 2009 Presents findings of the nation wide nutritional survey, and presents conclusions and recommendations 5
X
X
84
Economic Condition of HH in Georgia in
2009
CRRC/ 2009
Summarizes main findings of the study of economic situation of households in 2009. Presents insights into the living conditions of surveyed HH and their financial situation. The most useful sections should be those related to income and expenditures, and perception of the future by surveyed HH.
3
X
X
85
Assessing the Effectiveness of
Economic growth
Programmes
USAID/ 2010 Presents challenges to assess impact of EG project and problems inherent to EG programming; Presents comprehensive framework for improvement, and methodology to design EG project evaluation
5
X
86 Georgia Human Development
Report UNDP/ 2010
Chapter 3 ‐ economic growth the household perspective is the most relevant section. It covers incomes and income distribution, presents poverty estimates, and list factors that underlay poverty ‐ decline in agriculture output considered as one of the most important factors
4
X
X
X
87
2010 Agriculture Statistics of Georgia
National Statistics Office of Georgia
Presents different statistics in a regional setting for the period 2006‐2010: production, sown and harvested areas, yields, size of different livestock population, general macro indicators in agriculture
5
X
88 GEII Mid Term Assessment
GEII / USAID
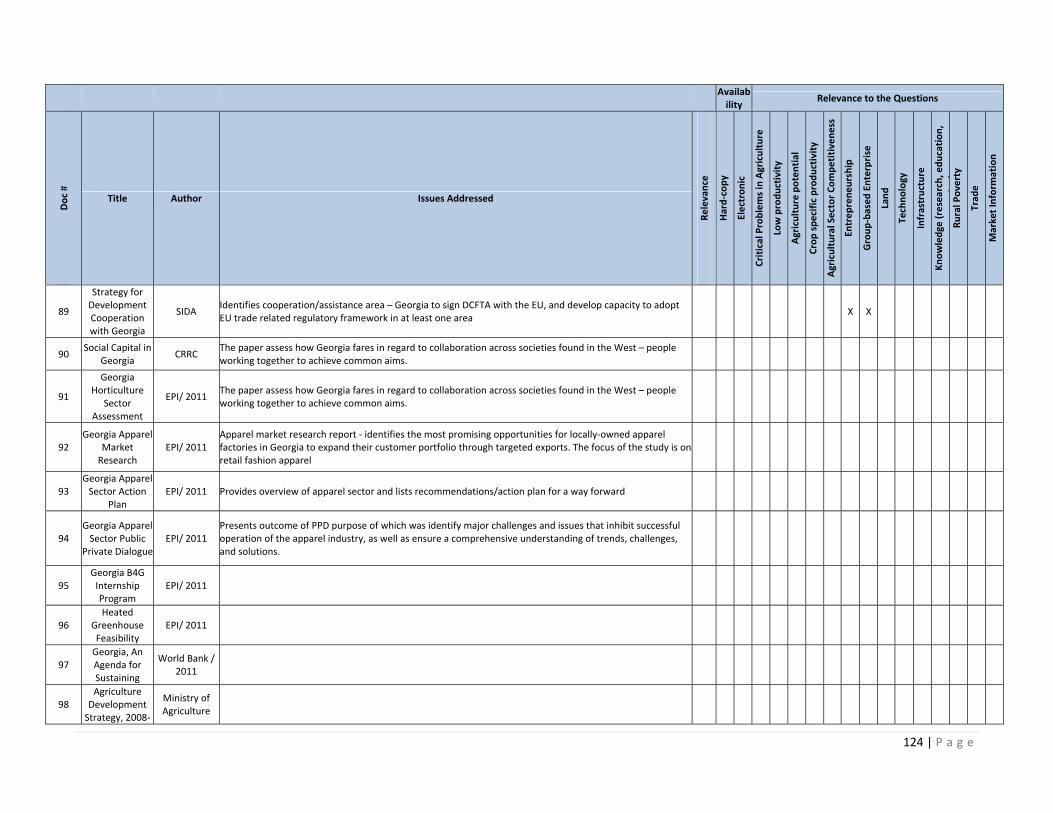
124 | P a g e
Availability
Relevance to the Questions
Doc #
Title Author Issues Addressed
Relevance
Hard‐copy
Electronic
Critical Problems in Agriculture
Low productivity
Agriculture potential
Crop specific productivity
Agricultural Sector Competitiveness
Entrepreneurship
Group‐based Enterprise
Land
Technology
Infrastructure
Knowledge
(research, education,
i)
Rural Poverty
Trad
e
Market Inform
ation
89
Strategy for Development Cooperation with Georgia
SIDA Identifies cooperation/assistance area – Georgia to sign DCFTA with the EU, and develop capacity to adopt EU trade related regulatory framework in at least one area
X X
90 Social Capital in
Georgia CRRC
The paper assess how Georgia fares in regard to collaboration across societies found in the West – people working together to achieve common aims.
91
Georgia Horticulture
Sector Assessment
EPI/ 2011 The paper assess how Georgia fares in regard to collaboration across societies found in the West – people working together to achieve common aims.
92 Georgia Apparel
Market Research
EPI/ 2011 Apparel market research report ‐ identifies the most promising opportunities for locally‐owned apparel factories in Georgia to expand their customer portfolio through targeted exports. The focus of the study is on retail fashion apparel
93 Georgia Apparel Sector Action
Plan EPI/ 2011 Provides overview of apparel sector and lists recommendations/action plan for a way forward
94 Georgia Apparel Sector Public
Private Dialogue EPI/ 2011
Presents outcome of PPD purpose of which was identify major challenges and issues that inhibit successful operation of the apparel industry, as well as ensure a comprehensive understanding of trends, challenges, and solutions.
95 Georgia B4G Internship Program
EPI/ 2011
96 Heated
Greenhouse Feasibility
EPI/ 2011
97 Georgia, An Agenda for Sustaining
World Bank / 2011
98 Agriculture Development Strategy, 2008‐
Ministry of Agriculture
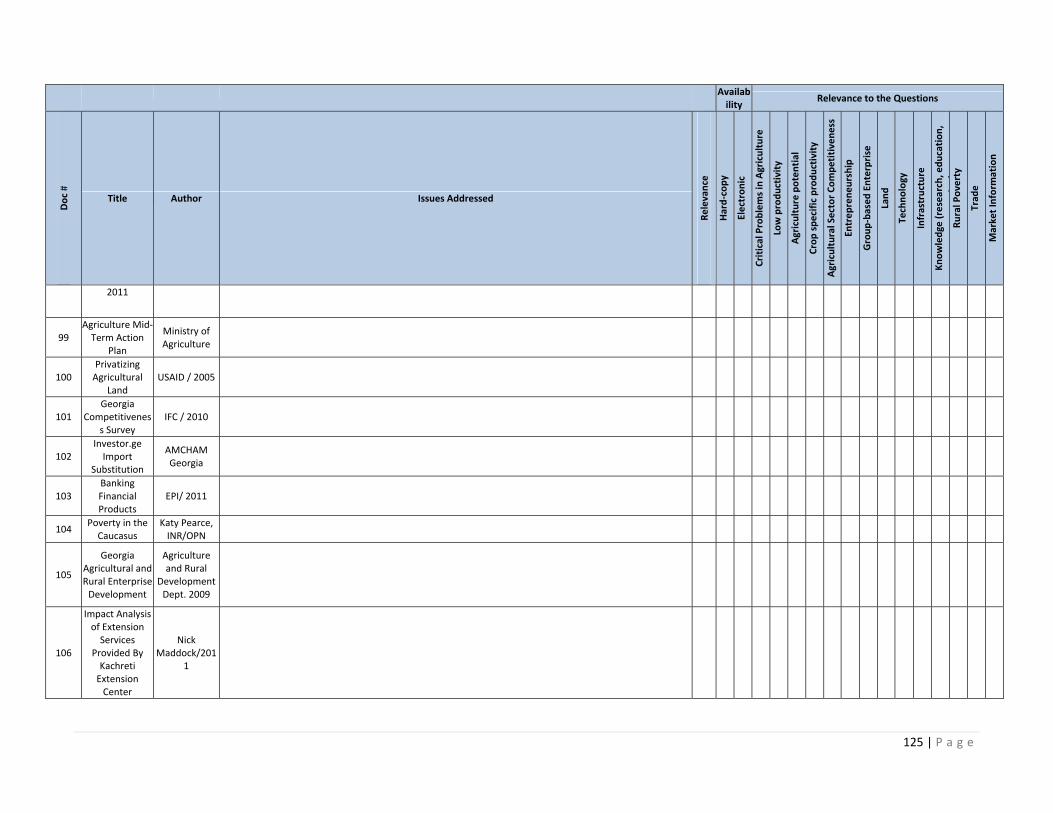
125 | P a g e
Availability
Relevance to the Questions
Doc #
Title Author Issues Addressed
Relevance
Hard‐copy
Electronic
Critical Problems in Agriculture
Low productivity
Agriculture potential
Crop specific productivity
Agricultural Sector Competitiveness
Entrepreneurship
Group‐based Enterprise
Land
Technology
Infrastructure
Knowledge
(research, education,
i)
Rural Poverty
Trad
e
Market Inform
ation
2011
99 Agriculture Mid‐Term Action
Plan
Ministry of Agriculture
100 Privatizing Agricultural
Land USAID / 2005
101 Georgia
Competitiveness Survey
IFC / 2010
102 Investor.ge Import
Substitution
AMCHAM Georgia
103 Banking Financial Products
EPI/ 2011
104 Poverty in the Caucasus
Katy Pearce, INR/OPN
105
Georgia Agricultural and Rural Enterprise Development
Agriculture and Rural
Development Dept. 2009
106
Impact Analysis of Extension Services
Provided By Kachreti Extension Center
Nick Maddock/201
1
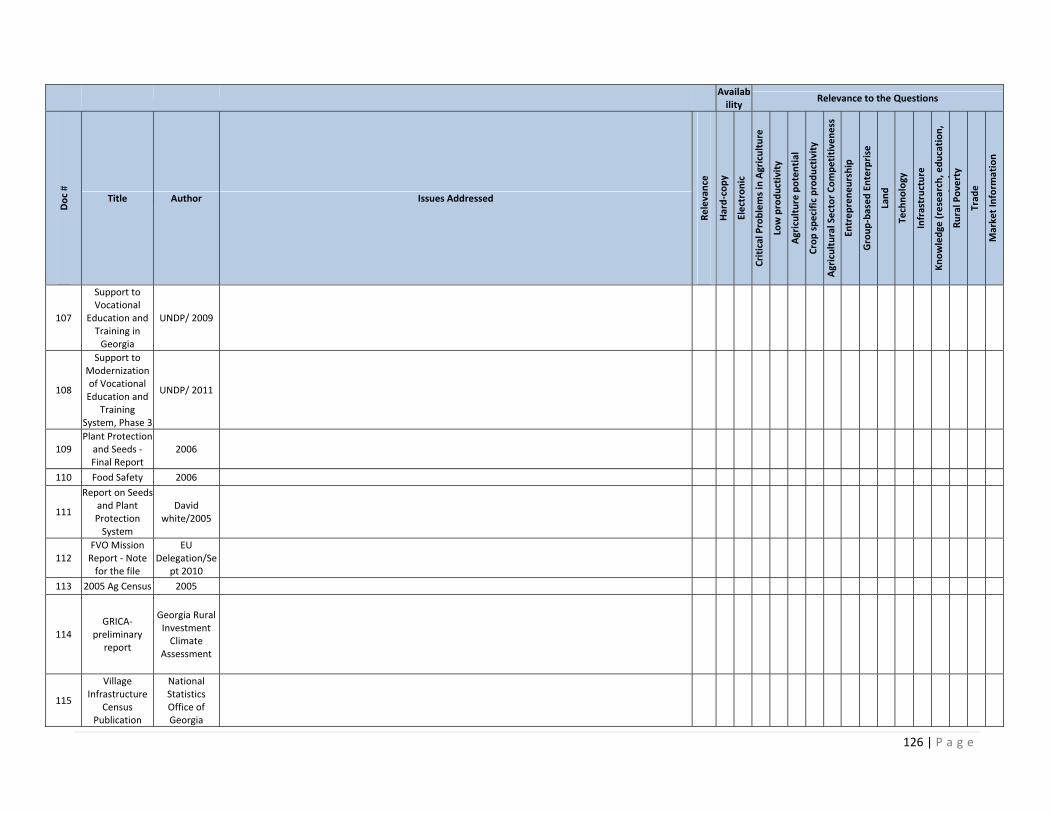
126 | P a g e
Availability
Relevance to the Questions
Doc #
Title Author Issues Addressed
Relevance
Hard‐copy
Electronic
Critical Problems in Agriculture
Low productivity
Agriculture potential
Crop specific productivity
Agricultural Sector Competitiveness
Entrepreneurship
Group‐based Enterprise
Land
Technology
Infrastructure
Knowledge
(research, education,
i)
Rural Poverty
Trad
e
Market Inform
ation
107
Support to Vocational
Education and Training in Georgia
UNDP/ 2009
108
Support to Modernization of Vocational Education and
Training System, Phase 3
UNDP/ 2011
109 Plant Protection and Seeds ‐ Final Report
2006
110 Food Safety 2006
111
Report on Seeds and Plant Protection System
David white/2005
112 FVO Mission Report ‐ Note for the file
EU Delegation/Se
pt 2010
113 2005 Ag Census 2005
114 GRICA‐
preliminary report
Georgia Rural Investment Climate
Assessment
115
Village Infrastructure
Census Publication
National Statistics Office of Georgia
127 | P a g e
Availability
Relevance to the Questions
Doc #
Title Author Issues Addressed
Relevance
Hard‐copy
Electronic
Critical Problems in Agriculture
Low productivity
Agriculture potential
Crop specific productivity
Agricultural Sector Competitiveness
Entrepreneurship
Group‐based Enterprise
Land
Technology
Infrastructure
Knowledge
(research, education,
i)
Rural Poverty
Trad
e
Market Inform
ation
116 07‐June‐20 Agricultural
Sector Overview Ag Vantage
117 EPI _
Ag_Strategy.ppt_8.25
EPI/ 2011
128 | P a g e
Annex 3: Discussion of Commodities Offering Potential for Import substitution or Exports
The information presented in this annex is supplementary to the full report, as it contains valuable commodity‐specific information helpful to analysts charged with making strategic determinations regarding support to specific commodities or value chains in Georgia.
Vegetables/Potato/Pepper
Introduction: Vegetable crops is one of the value chains that has positive potential for Georgia, both to serve local markets to reduce imports; and, to serve export markets of Northern Europe (EU & FSU) during selected portions of the winter season. An overview discussion related to several key vegetable commodities is set out in this document to provide information on production history as well as key regional locations for the production of each commodity. It is hoped that this discussion will provide further insight on where to focus attention on the production of each commodity because farmers in the regions have good knowledge related to production of each commodity. Tomato: Tomato output was characterized by a declining pattern during the 2006‐2010 period; but, a slight recovery in output was observed in 2010 (Figure 1.1). The major tomato production regions are Kvemo Kartli (65%), Shida Kartli (25%), Imereti (3‐5%), and Kakheti (3‐5%) ‐ (Table 1). In recent years Georgia has been a net importer of tomatoes. On average, during the 2008‐2010 period, imported tomato value and volume were about 8K tons and, slightly over $US 4 million, respectively. During the same period, the average quantity and value of exported tomatoes was around 2.7K tons and $US 450K. Domestic tomatoes are available on markets from the end of June through the end of September‐early October. Tomato supplies from Kakheti, Imereti, and Kvemo Kartli Regions start near the end of June. Shida Kartli produce is available on the market beginning near the end of August and continues through September to early October. During early fall, about 80% of domestic tomato production comes from Shida Kartli. Domestic supplies are also available during the off‐season, but this comes mainly from greenhouse production and it is negligible. Tomatoes are imported throughout the year with the exception of August. Import supplies are at the lowest level during the period July to September. Increases in tomato imports start in October and peak in May, just before the availability of domestic produce (Table 2, Figure 2.1). There is a potential to quintuple current yield levels. This coupled with expansion in production area and development of proper assembly points should provide opportunities for both import substitution and export expansion during regular marketing seasons. And, the off‐season import substitution strategy should consider the increased production of greenhouse tomatoes (Table 3), possibly to levels that would permit exports. Onion: Onion production, after a steady decline during the 2006‐2009 period, experienced a significant up‐surge in 2010 (Figure 1.2.) to the highest level in the past five years. Production is concentrated in Kvemo Kartli (70%), Shida Kartli and Kakheti contributing 15% and 10%, respectively (Table 1).
129 | P a g e
Georgia is a net importer of onions. During the period 2008‐2010 average import volume and value were about 26.7K tons and $US 6.5 million respectively; and, exports during the same period approximated 375 tons and $US 76K respectively. Domestic onions are available on the market beginning near the end of June and continue available until the end of October. All domestic production regions mentioned start supplying the market near the end of June and, supplies reach their peak during July‐August. Small, insignificant volumes are stored for marketing later in the year; and, these are mostly red onions from Shida Kartli. Imports are supplied to the market throughout the year. The peak and trough of imports are May and August, respectively (Table 2, Figure 2.2). Onion average yield per hectare can be tripled through improved access to adequate quality and variety of onion sets and seed, and improved irrigation techniques. This coupled with increased production areas and adequate development of quality assembly points and storage infrastructure should provide opportunity to both increase import substitution and export expansion (Table 3). Garlic: Garlic output was relatively flat for the period 2006 to 2009 but, in 2010 production jumped substantially (Figure 1.3.). Reportedly, area planted to garlic has further increased in 2011, and a larger output is expected in 2012.16 The principal garlic production regions are Kakheti (30%), Shida Kartli (25%), and Samtskhe‐Javakheti (25%) ‐ (Table 1). Georgia is a net importer of garlic. The average import volume and value during the 2008‐2010 period was 1K ton and $US 900K, respectively. Exports were negligible during the same period – average quantity was near 17 tons and its value was around $US 5K. Domestic market supplies of garlic start in June‐July and dominate the market until the end of September. Small quantities are also stored for supplies domestically through December. Supplies from Kakheti start in June‐July; from Shida Kartli in August and from Samtskhe‐Javakheti during the late August‐September period. Import supply peaks and troughs occur in February and July, respectively, opposite to when domestic produce reaches the market (Table 2, Figure 2.3). Garlic productivity can be easily doubled through improved production practices and availability of machinery implements (especially planters). This coupled with expansion in production area, and increased area under adequate quality assembly points and storage infrastructure should provide opportunity for import substitution and export expansion (Table 3). Cabbage: Cabbage output was down during 2006 to 2007; up during the 2008 to 2009 period; and, then substantially down in 2010 (Figure 1.4). About 80% of total output comes from Shida Kartli; another large producer is Kakheti, with nearly 15% of the total harvest (Table 1). Although imports are also available at the local market, Georgia is a net exporter of cabbage. The average value and volume of exports during 2008‐2010 period were $US 490K and 3.5K tons, respectively; while average import value and volume amounted $US 39K and 330 tons, respectively. Markets are generally supplied with domestically produced cabbage starting in early May from Kakheti and near the end of May from Kvemo Kartli; the bulk of locally produced cabbage reaches the market beginning from the
16 As reported, wholesalers/traders have integrated backward, and made considerable investment in garlic production in 2011. The underlying factor is high and increasing retail prices during recent years.
130 | P a g e
end of August, by Shida Kartli. Recently domestic producers have extended their marketing season substantially through planting of cabbage hybrids suitable for storage. This has allowed producers to store their harvest in home cellar storage and extend marketing season through February. Imports are supplied throughout the year in different volumes. Import supplies peak and trough in May and July respectively (Table 2, Figure 2.4). Current yield levels can be tripled through improved irrigation and introduction of highly productive varieties suitable for storage. This in concert with increases in the production area and the development of assembly points and storage infrastructure should contribute to both import substitution and export expansion (Table 3).17 Carrots: Carrot output over the period 2006 to 2010 has been characterized with increasing production (Figure 1.5). This production is concentrated in Samtskhe‐Javakheti (70%) and Kvemo Kartli (20%) ‐ (Table 1). However, even with these recent increases in production Georgia continues to be a net importer of carrots. Average import volume and value during the 2008‐2010 period amounted to about 1.9K tons and $US 438K, respectively; whereas, average export value and volume approximated $US 44K and 357 tons. Domestic carrots supply markets starting in mid‐July from Kvemo Kartli; it is followed by produce from low‐land Samstkhe‐Javakheti in early September and, from the high‐land ‐ Samtskhe‐Javakheti ‐ beginning in mid‐September; and, local carrots are available on the market through February. It is estimated that the importation of carrots peaks and troughs in December and July, respectively (Table 2, Figure 2.5). Current productivity levels can be quintupled through increased availability of adequate machinery/implements (planters, harvesters, sprayers, etc.) and the application of improved production methods. This coupled with increased production area and the development of adequate quality assembly points and storage infrastructure should result in import substitution and export expansion (Table 3). Cucumber: Over the period 2006‐2010 cucumber output rose consistently (Figure 1.6). The main production regions are Kakheti (40%), Kvemo Kartli (40%), and Imereti (10%) ‐ (Table 1). Georgia is a net importer of cucumbers. During the period 2008‐2010 average import volumes and values were near 3.5K tons and $US 1.5 million, respectively. No exports were recorded during the same period. Domestic cucumber supplies start in mid‐May from Kakheti Region. Cucumbers from Kvemo Kartli are available beginning near the end of May; and, from Imereti near mid‐June. Local cucumbers can be found on the market through the end of August. Small quantities of local cucumber supplies also are available in April and September. Imports are supplied throughout the year with the exception of the July‐August period, when local produce dominates the market. Import supplies peak and trough in April and June, respectively (Table 2, Figure 2.6). Current productivity of open‐field production can be tripled through improved disease management and the application of improved production practices. This in conjunction with increased production area, improved post‐harvest handling, and the development of adequate quality assembly should allow import substitution and initiation of exports during regular marketing seasons. The strategy for import substitution during off‐season and
17 Cauliflower is not produced in Georgia; and, on average during 2008-2010, about 307 tons of cauliflower valued at $US 143K was imported. This situation provides a good import substitution opportunity as the crop grows under conditions very similar to those of cabbage.
131 | P a g e
possibly exports should include increased area under greenhouse production and the development of proper assembly points (Table 3) Eggplant: Eggplant output over the period 2006‐2010 showed substantial instability as production was up and down from one year to the next (Figure 1.7). Roughly 80% of total output is supplied by Kvemo Kartli, and Kakheti’s share in total harvest is about 10% (Table 1). Georgia is a net importer of eggplant. The average import values and volumes during the 2008‐2010 period was $US 2.3 million and 4.4K tons, respectively. No exports of eggplant were recorded during the same period. The market is generally supplied with local eggplant starting in July, and supplies last through the end of October. Import supply peaks and troughs are June and September, respectively. Imports are obtained throughout the year with the exception of August, when local produce availability is at its peak (Table 2, Figure 2.7). Eggplant yields per hectare can be tripled through the introduction of improved production practices. This together with increased production area, and the development of proper assembly points should allow import substitution and initiation of exports during the regular marketing season.18 The strategy for import substitution during the off‐season and, possibly exports is the development of eggplant production under greenhouses (Table 3). Beans: Bean production over the 2006‐2010 period showed increases through 2008 and then declines in the past two years (Figure 1.8). Nearly all regions grow beans and contribute to total output; however, the largest contributors are Imereti (22%), Kakheti (20%), Kvemo Kartli (18%), and Shida Kartli (14%) ‐ (Table 1). Georgia is a net importer of beans. During the period 2008‐2010, average import volumes and values were 340 tons and $US 230K, respectively. Markets are generally supplied with local bean starting in August, and these supplies dominate the market through the October‐November period. With the exception of November and January the Georgian market is generally supplied with imported beans. Peaks and troughs in import supplies are May and February, respectively (Table 2, Figure 2.8). It is expected that beans productivity can be easily doubled through improved access to irrigation and availability of and adequate supply of proper machinery/implements. This in concert with increased production area and the development of adequate assembly points should lead to import substitution and initiation of exports (Table 3). Potatoes: Over the 2006‐2010 time horizon annual potato output has trended upwards. In 2008 production did decline but, in the past couple years it has clawed its way back (Figure 1.9). Production is mainly concentrated in Samtskhe‐Javakheti (66%) and Kvemo Kartli (16%); about 8‐10% of total output comes from Ajara. It is reported that recently growers in Kakheti (Lagodekhi District) started to increase the production of early potatoes (Table 1).
18 Storage infrastructure is not applicable, since eggplant is not suitable for storage for extended periods of time – maximum it can be stored is two weeks
132 | P a g e
Georgia is a net importer of potatoes. During the period 2008‐2010 average imported volumes and values of potatoes was about 17.5K tons and $US 3 million. And, during the same period average export values and volumes approximated $US 455K, and 2.7K, respectively. Domestic markets are generally supplied with local early potatoes starting in mid‐May from Kvemo Kartli. Shortly later, early potatoes are supplied from Kakheti. Local normal potatoes are available on the market beginning in mid‐September; first from low‐land areas in Samtskhe‐Javakheti; then from the high‐lands within the same region. Domestically produced potatoes are generally present on the market until the February‐March period. Potatoes are imported throughout the year to meet needs during the off season. The import volumes decline during the summer period and, peaks and troughs are generally in December and July, respectively (Table 2, Figure 2.9). It is expected that potato yields can be easily tripled through improvement in irrigation, and availability of proper types of machinery/implements when required. This in concert with increased production area and the development of adequate quality assembly points and storage infrastructure should allow import substitution and expansion of exports (Table 3). Pepper: Georgia is a net importer of peppers. Average volumes and values of pepper imports during the 2008‐2010 period amounted 400 tons and $US 920K, respectively. Pepper is imported throughout the year with peaks and troughs in June and August, respectively (Table 2, Figure 2.10) In order to substitute imports and to save outflow of significant foreign exchange resources, adequate production methods should be introduced/implemented and value adding activities should be facilitated (Table 3).
Cereals/Oil Crops
Introduction: Cereal and oilseed crops are value chains that have substantial opportunity to improve and reduce significantly Georgia’s dependence on imports. These are not crops that offer substantial opportunity for export but, more could be done to promote their production domestically. An overview discussion related to wheat, corn, and sunflower is set out in this document to provide information on production history as well as key regional locations for the production of each commodity. It is hoped that this discussion will provide further insight on where to focus attention on the production of each commodity. Wheat: During the 2006‐2010 period wheat output was started up prior to 2008 but, after that time it has declined (Figure 1.10). Wheat production is concentrated in Kakheti (41%), Shida Kartli (35%), and Kvemo Kartli (16%) ‐ (Table 1). Georgia is a net importer of wheat; and, it is the largest import commodity. The average import values and volumes during 2008‐2010 period were about $US 128 million and 522K tons, respectively. Wheat productivity is very low at present but, it should be possible to triple yields from current levels. The use of high quality seed alone would provide a substantial increase in yields. For instance, due to the availability of quality seeds during the 2000 fall planting season average yields nationwide reached almost 3 tons per ha; a similar development is expected this year after final productivity estimates are released by GeoStat. Preliminary estimates suggest that the 2011 harvest will average about 3‐3.5 tons/ha (Figure 1.10.1).
133 | P a g e
Domestic wheat is available on the market in July. By the end of July the wheat harvest is finished in Kakheti and Kvemo Kartli Regions; but, in Shida Kartli and Samtskhe‐Javakheti regions harvest ends in August. Locally produced wheat disappears quickly from the market due to a combination of factors including: low output, farmer cash flow needs, increased low priced imports shortly after domestic harvest, and the lack of storage infrastructure on acceptable terms to grower. Peaks and troughs in import supplies generally occur in October and July, respectively (Table 2, Figure 2.11). An import substitution strategy for wheat should consider increased availability and accessibility to quality seeds, grower managed storage infrastructure developments, and financing instruments that will allow growers to cope with cash flow requirements on a rational basis (Table 3). Corn: Corn annual output during 2006‐2010 held a declining trend (Figure 1.11). Production is concentrated in Imereti (33%), Samegrelo – Zemo Svaneti (32%), Kakheti (11%), Guria (10%), and Kvemo Kartli (4%) (Table 1). Georgia is a net importer of maize. During 2008‐1010 average import value and volume were about $US 4.7 million and 20K tons, respectively. Corn is imported throughout the year. Import peaks and troughs generally occur in June and September, respectively (Table 2, Figure 2.12). Import peaks correspond to the period when domestic stocks are at the lowest level, and world prices are down in anticipation of the new crop harvest; and, import troughs correspond to the period when local corn is harvested and is abundantly available on the local market. Current corn yields can be tripled through planting quality seeds and, the proper application of adequate and appropriate production practices. This in concert with an increased production area, storage infrastructure development, improved irrigation, and the availability of affordable financing instruments should allow for import substitution as corn exports from Georgia is not really recommended ‐ (Table 3).19 Sunflower: The reporting of sunflower production related statistics was terminated in 2008 and has been kept that way since. Sunflower is used in crop rotation with wheat, and its production, more than 90%, is concentrated in Kakheti. Georgia is net importer of sunflower. During the 2008‐2010 period, average import values and volumes were about $US 2 million and 5.5K tons, respectively. Imports are obtained throughout the year, peaking in March and reaching lows in September ‐ Table 2, Figure 2.13) Current productivity is very low, and can be quintupled through application of advanced production technologies. This should provide an opportunity for import substitution (Table 3).
Fruits/Melons Introduction:
19 In 2011 the GOG implemented a corn seed Program. As reported, growers who have applied adequate production practices and had access to water for irrigation more than tripled their productivity. The GOG has also established two grain silos in Kakheti and Samegrelo that are supposed to provide storage services to corn growers.
134 | P a g e
Fruit and melon crops constitute value chains that offer positive potential for Georgia, both to serve local markets to reduce imports; and, to serve export markets of Northern Europe (EU & FSU) during selected portions of the winter season. An overview discussion related to several key fruits and melons is set out in this document to provide information on production history as well as key regional locations for the production of each commodity. It is hoped that this discussion will provide further insight on where to focus attention on the production of each commodity because farmers in the regions have good knowledge related to production of each commodity. Apples: During the 2006‐2010 time frame apple output was up and down in response to seasonal conditions but, overall production was reasonably steady (Figure 1.12). Apple production is concentrated in Shida Kartli (65%) and Samtskhe‐Javakheti (18%) (Table 1). Although Georgia is a net exporter of apples, it imports substantial volumes of apples (various varieties not produced in Georgia) on an annual basis. Average import volumes and values during the 2008‐2010 period was about 1K tons and $US 755K, respectively; during the same period average export volumes and values amounted 8K tons and $US 1.5 million, respectively. Markets are supplied with local apples starting in September; however, local summer varieties, in small quantities, are available earlier. Local apples are present on the market through February‐March. Imports are supplied throughout the year, and the peak and trough periods are December and August, respectively (Table 2, Figure 2.14). Presently apple productivity is extremely low, and it is estimated that it can be tripled easily through improved production methods, irrigation and introduction of dwarf/semi‐dwarf varieties. This together with increased orchard area and the development of assembly points and storage infrastructure should further lead to import substitution and export expansion (Table 3). Melons: Melon output climbed from 2006 to 2007 and after the conflict in 2008 production declined and continued to decline in 2009 and 2010 (Figure 1.13). Contributions of Kakheti, Imereti, and Kvemo Kartli to total harvest are 52%, 29%, and 9 % respectively (Table 1). Georgia is a net importer of melons. The average import values and volumes during the 2008‐2010 period were $US 447K and 1.3K tons respectively; and, average export volumes and values were negligible during the same period. Local produce is available on the market from the end of July through September. Imports are supplied throughout the year, peaking in June and hitting lows in January (Table 2, Figure 2.15). Melon productivity can be doubled from its current level through application of improved production methods. This coupled with increased production areas, should allow import substitution during the regular marketing season (Table 3). Walnuts: Walnut production, although showing an increasing trend, exhibited a noticeable fluctuation during the 2006 to 2010 period (Figure 1.14). Walnuts are produced in all regions; the largest contributors to total output are Imereti (26%), Shida Kartli (13%) and Kakheti (12%). Production is dominated by old varieties, and most of the production comes from standalone trees, not plantations.
135 | P a g e
Georgia is a net importer of walnuts. Average import values and volumes of shelled walnuts during the 2008‐2010 period was around 259 tons and $US 493K, respectively. Current production levels can be tripled through introduction of early fruit bearing varieties and application of adequate production and management practices. This coupled with the development of proper assembly points should result in import substitution and export expansion (Table 3). Hazelnuts: After a decline in output during the 2006 to 2008 period, production levels exhibited an increasing trend through 2010 (Figure 1.15). Production is concentrated in Samegrelo (72%), Guria (13%), and Imereti (8%) regions (Table 1). Hazelnut is a traditional Georgian perennial culture and is grown on areas in regions below 1000 meters where the average annual rainfall reaches 1500‐1900 mm, and the relative air humidity is 70‐75%. The nuts are valued in Europe, many used by German buyers. Although Georgia is net exporter of hazelnuts and is one of the major producers in the world, the average values and volumes of imports of shelled hazelnuts during the 2008‐2010 period were about $US 348K and 114 tons. There is substantial opportunity to increase exports by doubling yields and carrying out proper post‐harvest management practices.20 Increased production along with value adding activities should also contribute to substitution of shelled hazelnut imports. Persimmons: Georgia is a net exporter of persimmons. Despite the fact that this crop represents a significant generator of foreign exchange, formal production statistics are not available. Average export volumes and values during the 2008‐2010 period was 5.2K tons and $US 1.7 million, respectively; and, average import volumes and values during the same period amounted 83 tons and $US8K, respectively. Standalone trees contribute most to the total output. Persimmon has significant export expansion potential, especially in the countries located in the northern hemisphere. This potential can be realized through introduction of improved varieties and establishment of commercial persimmon orchards (Table 3). Pomegranate: This is a possible candidate fruit and, in recent years some has been exported but, statistics for this crop is not available at this time. Kiwi: There is no formal production related statistics available for kiwi. Its production is mainly concentrated in west Georgia – Guria, Imereti, and Samegrelo. Reportedly, area under kiwi has significantly increased during recent years; however, Georgia is still a net importer of kiwi. During the 2008‐2010 period import volumes and values averaged to be 594 tons and $US 351K, respectively. Increased competition is reported early and late during the regular marketing season. An import substitution policy should consider introduction of improved varieties (more productive early and late varieties) and development of post‐harvest handling infrastructure (Table 3). Pears, Plums, Quinces, Cherries:
20 During the last years several shipments of Georgian hazelnuts to EU were rejected due to afflation.
136 | P a g e
Annual production outputs of pears, plums, quince, and cherries have been shown to be flat or declining over the period 2006‐2010 (Figure 1.16). Production of these crops is mainly concentrated in Kakheti, Kvemo Kartli, Shida Kartli and Imereti (Table 2). Domestically produced pears, plums, quince, and cherries are available on the market during October‐January, August‐September, September‐October, and May‐July, respectively (Table 2). Georgia is net importer of these commodities except for cherries. Current productivity levels are very low for these commodities as most production comes mainly from standalone trees rather than established orchards. Pear, plum, quince, and cherry productivity is estimated to be doubled, tripled, doubled, and tripled, respectively. This requires the introduction of semi‐dwarf/dwarf varieties, improved irrigation, and the development of proper assembly points and storage infrastructure. If done it should lead to import substitution and export expansion (Table 3) of these commodities. Apricots: Reporting of apricot production statistics was terminated in 2008. Both the productivity and volume of production of apricots is very low in Georgia. One of the reasons is that all available apricot varieties are either early blooming or ordinary‐period blooming varieties. These varieties are susceptible to frequently occurring frost during early spring. Georgia’s climatic conditions require the introduction of late blooming varieties to cope with frost stress. Georgia is net importer of apricots. During the 2008‐2010 period average volumes and values of imports were 700 tons and $US 182K, respectively. The market is supplied with local apricot production only in July; while imports are available from April through July. Import peaks and troughs were estimated in April and July, respectively (Table 2, Figure 2.16). Current yield levels can be tripled through improved production practices, irrigation, and the introduction of later blooming semi‐dwarf/dwarf varieties. This coupled with the expansion of orchards and the development of proper assembly points should result in import substitution and export expansion (Table 3) Peaches: Peach output overall during the 2006‐2010 period was characterized as increasing but, in 2010 it declined due to seasonal problems (Figure 1.17). Peach production is concentrated in Kakheti (68%) and Shida Kartli (27%) ‐ (Table 1). Georgia is a net exporter of peach. The average export volumes and values during the 2008‐2010 period were 956 tons and $US 333K, respectively; and, average import volumes and values, during the same period, approximated 38 tons and $US 25K, respectively. The market is supplied with local peaches from June ‐ September (Table 2). Current per ha yield can be easily tripled through the introduction of modern varieties (focus on later blooming varieties), dwarf/semi‐dwarf varieties, irrigation, and application of improved farming practices. This coupled with increased production area and the development of proper assembly points and storage infrastructure should lead to import substitution and export expansion (Table 3).
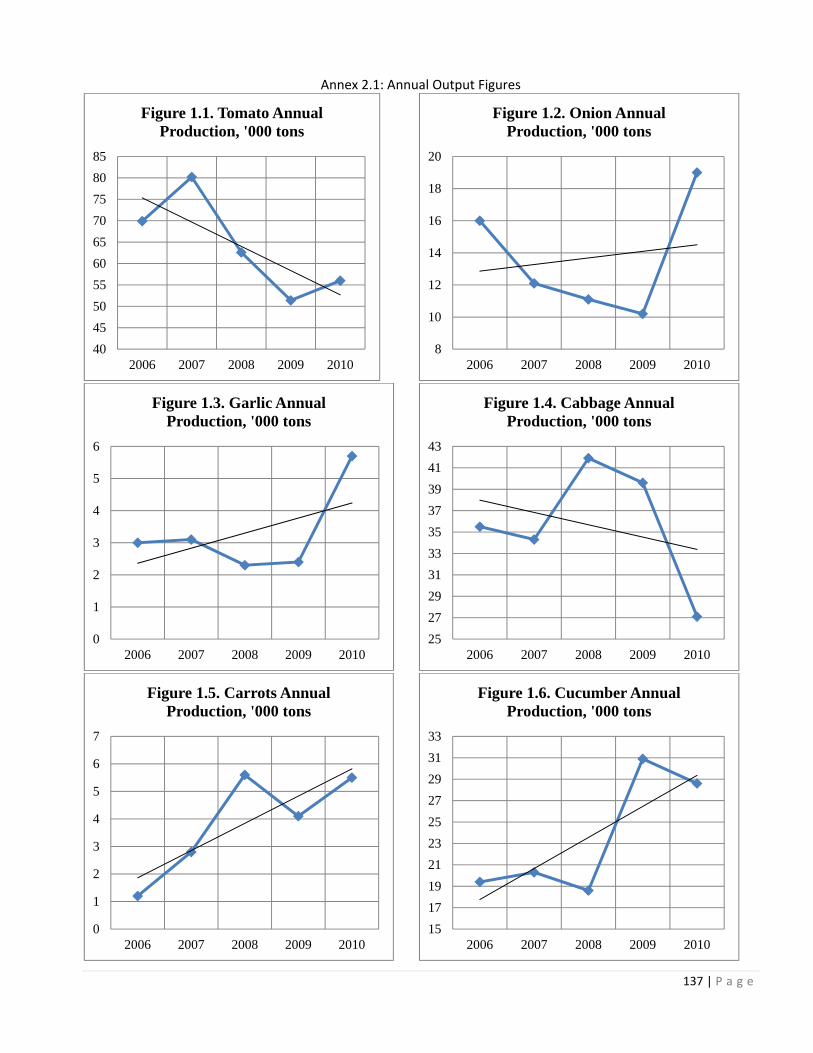
137 | P a g e
Annex 2.1: Annual Output Figures
40
45
50
55
60
65
70
75
80
85
2006 2007 2008 2009 2010
Figure 1.1. Tomato Annual Production, '000 tons
8
10
12
14
16
18
20
2006 2007 2008 2009 2010
Figure 1.2. Onion Annual Production, '000 tons
0
1
2
3
4
5
6
2006 2007 2008 2009 2010
Figure 1.3. Garlic Annual Production, '000 tons
25
27
29
31
33
35
37
39
41
43
2006 2007 2008 2009 2010
Figure 1.4. Cabbage Annual Production, '000 tons
0
1
2
3
4
5
6
7
2006 2007 2008 2009 2010
Figure 1.5. Carrots Annual Production, '000 tons
15
17
19
21
23
25
27
29
31
33
2006 2007 2008 2009 2010
Figure 1.6. Cucumber Annual Production, '000 tons
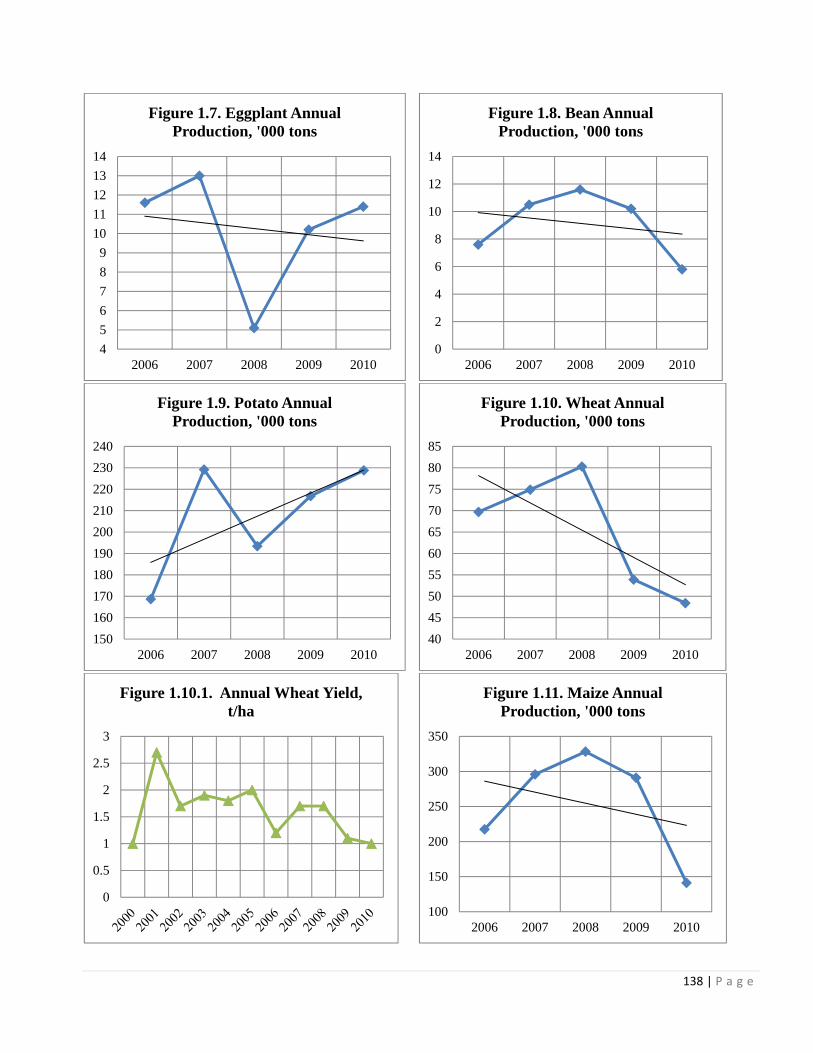
138 | P a g e
4
5
6
7
8
9
10
11
12
13
14
2006 2007 2008 2009 2010
Figure 1.7. Eggplant Annual Production, '000 tons
0
2
4
6
8
10
12
14
2006 2007 2008 2009 2010
Figure 1.8. Bean Annual Production, '000 tons
150
160
170
180
190
200
210
220
230
240
2006 2007 2008 2009 2010
Figure 1.9. Potato Annual Production, '000 tons
40
45
50
55
60
65
70
75
80
85
2006 2007 2008 2009 2010
Figure 1.10. Wheat Annual Production, '000 tons
0
0.5
1
1.5
2
2.5
3
Figure 1.10.1. Annual Wheat Yield, t/ha
100
150
200
250
300
350
2006 2007 2008 2009 2010
Figure 1.11. Maize Annual Production, '000 tons
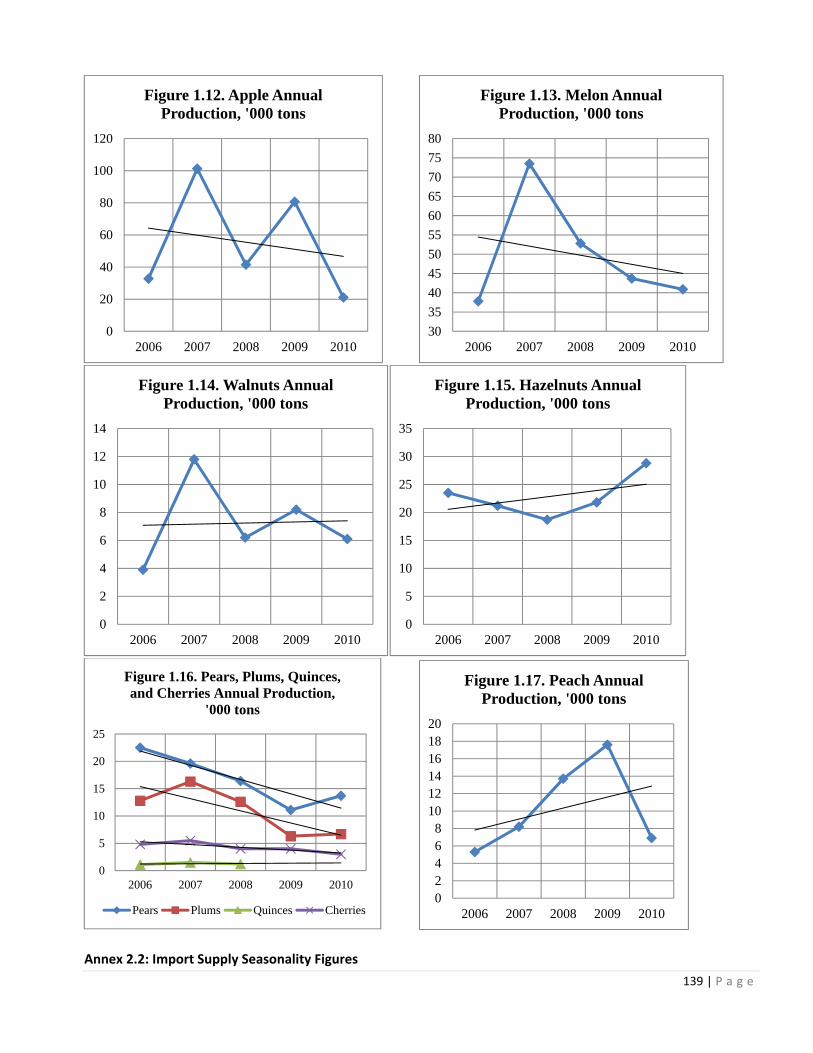
139 | P a g e
Annex 2.2: Import Supply Seasonality Figures
0
20
40
60
80
100
120
2006 2007 2008 2009 2010
Figure 1.12. Apple Annual Production, '000 tons
30
35
40
45
50
55
60
65
70
75
80
2006 2007 2008 2009 2010
Figure 1.13. Melon Annual Production, '000 tons
0
2
4
6
8
10
12
14
2006 2007 2008 2009 2010
Figure 1.14. Walnuts Annual Production, '000 tons
0
5
10
15
20
25
30
35
2006 2007 2008 2009 2010
Figure 1.15. Hazelnuts Annual Production, '000 tons
0
5
10
15
20
25
2006 2007 2008 2009 2010
Figure 1.16. Pears, Plums, Quinces, and Cherries Annual Production,
'000 tons
Pears Plums Quinces Cherries02468
101214161820
2006 2007 2008 2009 2010
Figure 1.17. Peach Annual Production, '000 tons
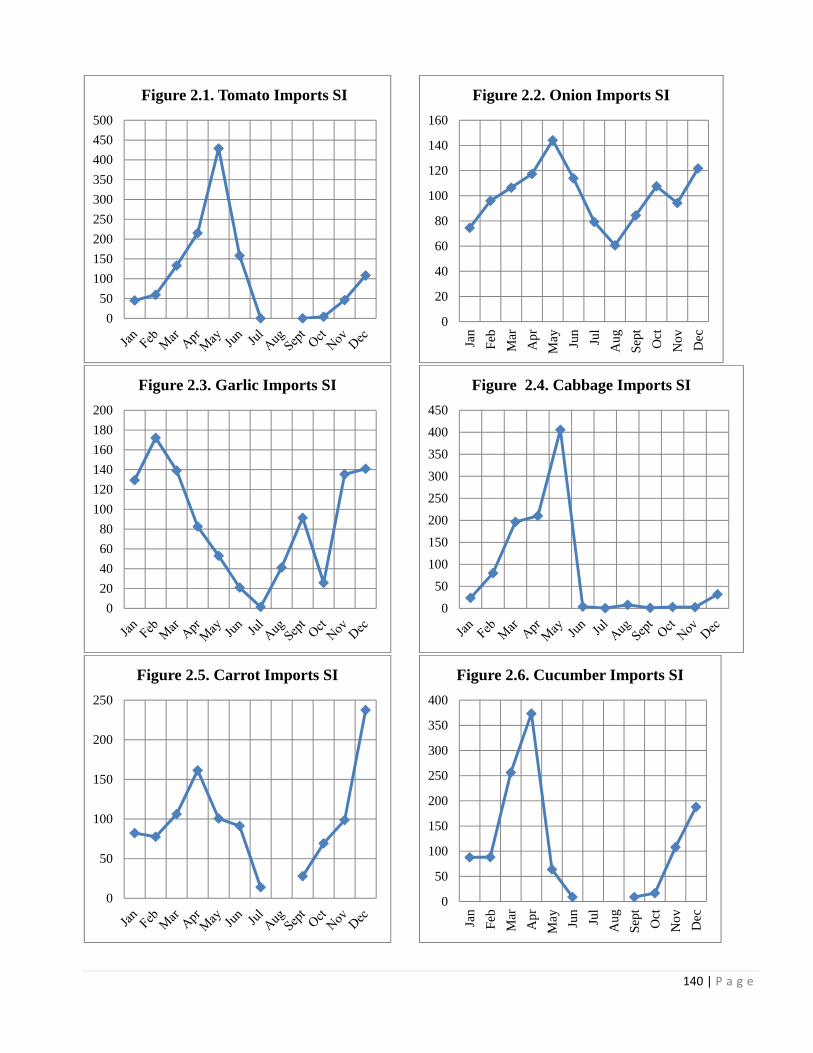
140 | P a g e
0
50
100
150
200
250
300
350
400
450
500
Figure 2.1. Tomato Imports SI
0
20
40
60
80
100
120
140
160
Jan
Feb
Mar
Apr
May Jun
Jul
Aug
Sep
t
Oct
Nov
Dec
Figure 2.2. Onion Imports SI
0
20
40
60
80
100
120
140
160
180
200
Figure 2.3. Garlic Imports SI
0
50
100
150
200
250
300
350
400
450
Figure 2.4. Cabbage Imports SI
0
50
100
150
200
250
Figure 2.5. Carrot Imports SI
0
50
100
150
200
250
300
350
400
Jan
Feb
Mar
Apr
May Jun
Jul
Aug
Sep
t
Oct
Nov
Dec
Figure 2.6. Cucumber Imports SI
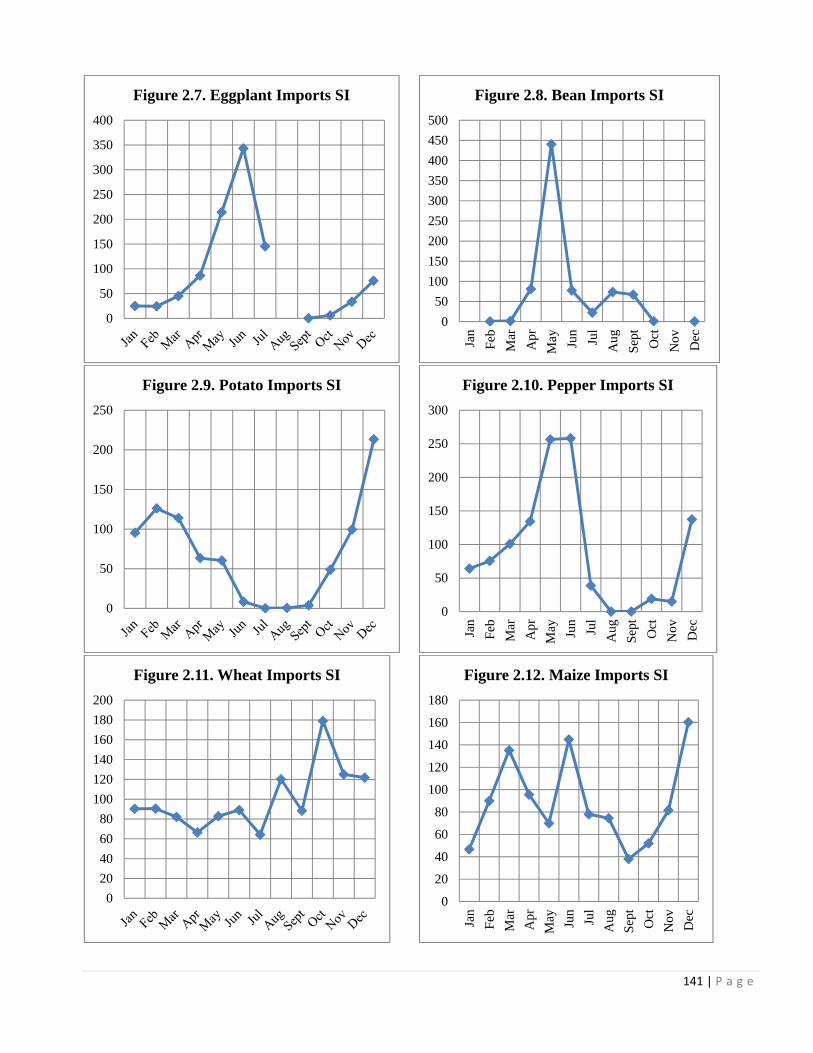
141 | P a g e
0
50
100
150
200
250
300
350
400
Figure 2.7. Eggplant Imports SI
0
50
100
150
200
250
300
350
400
450
500
Jan
Feb
Mar
Apr
May Jun
Jul
Aug
Sep
t
Oct
Nov
Dec
Figure 2.8. Bean Imports SI
0
50
100
150
200
250
Figure 2.9. Potato Imports SI
0
50
100
150
200
250
300
Jan
Feb
Mar
Apr
May Jun
Jul
Aug
Sep
t
Oct
Nov
Dec
Figure 2.10. Pepper Imports SI
0
20
40
60
80
100
120
140
160
180
200
Figure 2.11. Wheat Imports SI
0
20
40
60
80
100
120
140
160
180
Jan
Feb
Mar
Apr
May Jun
Jul
Aug
Sep
t
Oct
Nov
Dec
Figure 2.12. Maize Imports SI
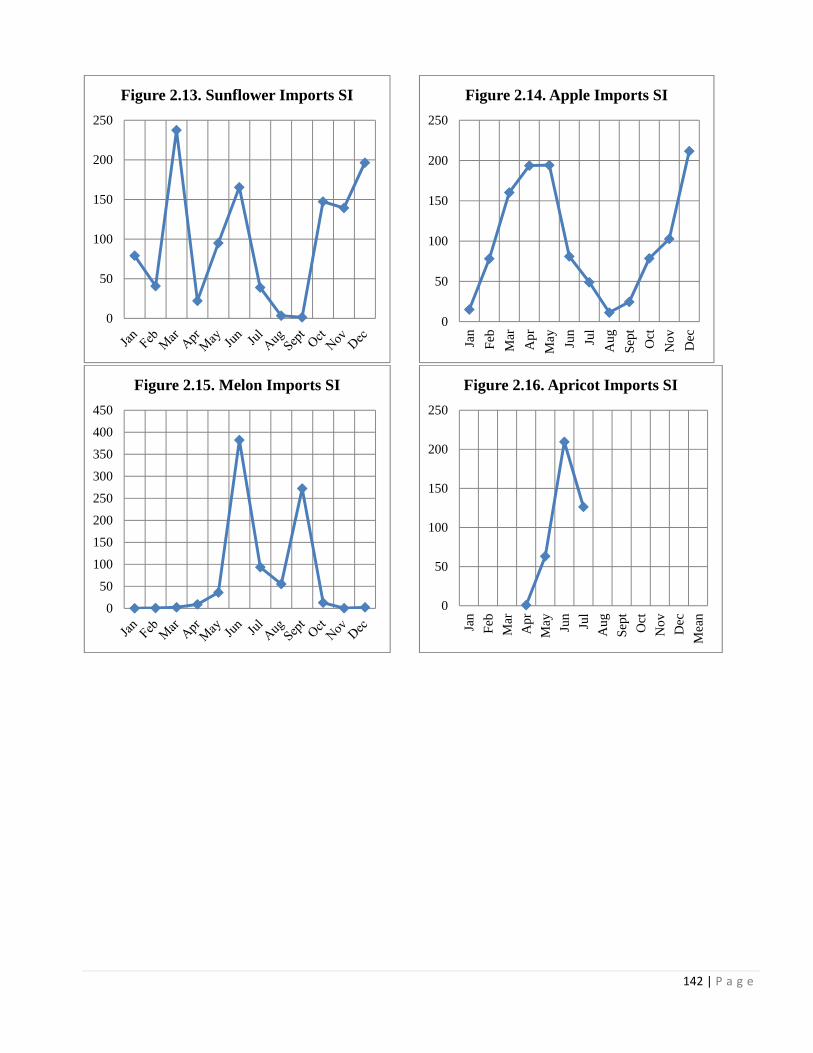
142 | P a g e
0
50
100
150
200
250
Figure 2.13. Sunflower Imports SI
0
50
100
150
200
250
Jan
Feb
Mar
Apr
May Jun
Jul
Aug
Sep
t
Oct
Nov
Dec
Figure 2.14. Apple Imports SI
0
50
100
150
200
250
300
350
400
450
Figure 2.15. Melon Imports SI
0
50
100
150
200
250
Jan
Feb
Mar
Apr
May Jun
Jul
Aug
Sep
t
Oct
Nov
Dec
Mea
n
Figure 2.16. Apricot Imports SI
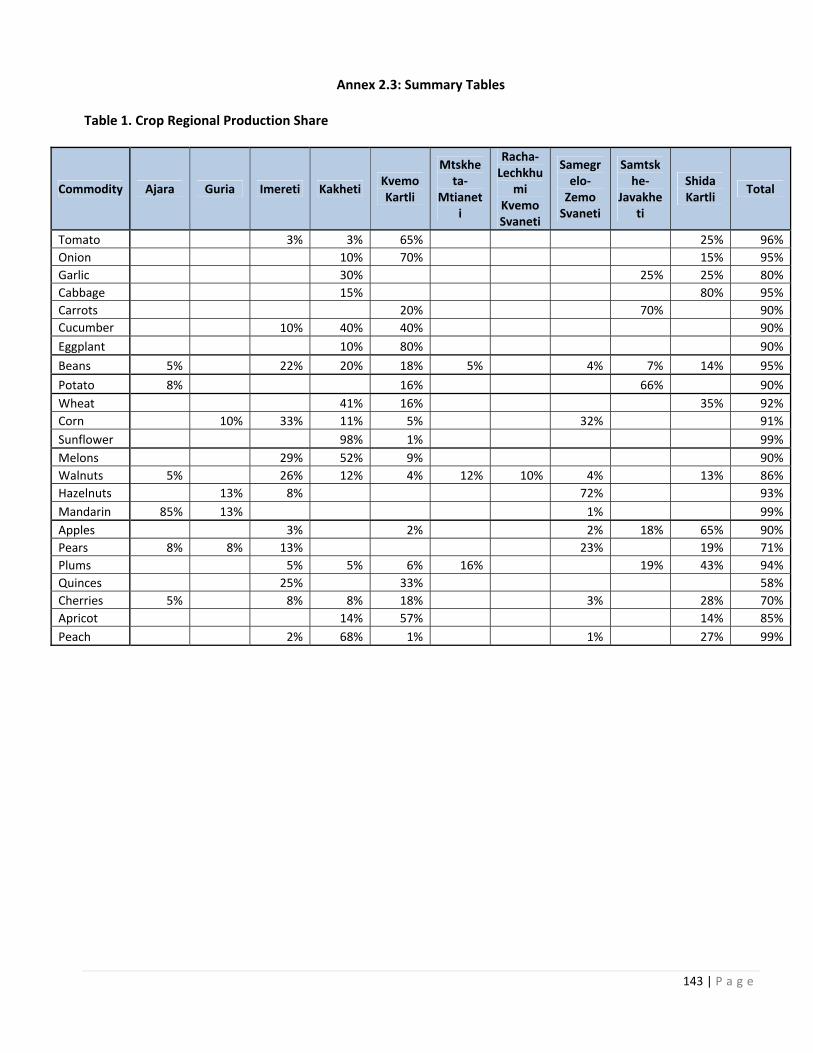
143 | P a g e
Annex 2.3: Summary Tables Table 1. Crop Regional Production Share
Commodity Ajara Guria Imereti Kakheti Kvemo Kartli
Mtskheta‐
Mtianeti
Racha‐Lechkhu
mi Kvemo Svaneti
Samegrelo‐ Zemo Svaneti
Samtskhe‐
Javakheti
Shida Kartli
Total
Tomato 3% 3% 65% 25% 96%
Onion 10% 70% 15% 95%
Garlic 30% 25% 25% 80%
Cabbage 15% 80% 95%
Carrots 20% 70% 90%
Cucumber 10% 40% 40% 90%
Eggplant 10% 80% 90%
Beans 5% 22% 20% 18% 5% 4% 7% 14% 95%
Potato 8% 16% 66% 90%
Wheat 41% 16% 35% 92%
Corn 10% 33% 11% 5% 32% 91%
Sunflower 98% 1% 99%
Melons 29% 52% 9% 90%
Walnuts 5% 26% 12% 4% 12% 10% 4% 13% 86%
Hazelnuts 13% 8% 72% 93%
Mandarin 85% 13% 1% 99%
Apples 3% 2% 2% 18% 65% 90%
Pears 8% 8% 13% 23% 19% 71%
Plums 5% 5% 6% 16% 19% 43% 94%
Quinces 25% 33% 58%
Cherries 5% 8% 8% 18% 3% 28% 70%
Apricot 14% 57% 14% 85%
Peach 2% 68% 1% 1% 27% 99%
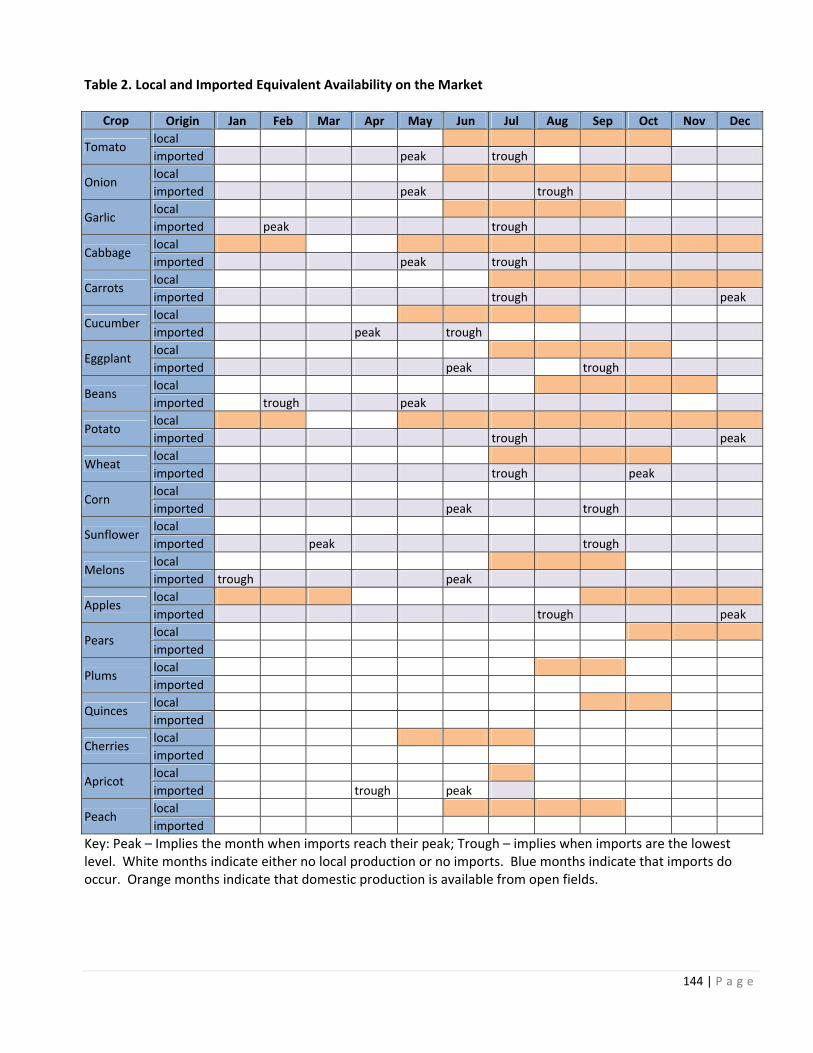
144 | P a g e
Table 2. Local and Imported Equivalent Availability on the Market
Crop Origin Jan Feb Mar Apr May Jun Jul Aug Sep Oct Nov Dec
Tomato local
imported peak trough
Onion local
imported peak trough
Garlic local
imported peak trough
Cabbage local
imported peak trough
Carrots local
imported trough peak
Cucumber local
imported peak trough
Eggplant local
imported peak trough
Beans local
imported trough peak
Potato local
imported trough peak
Wheat local
imported trough peak
Corn local
imported peak trough
Sunflower local
imported peak trough
Melons local
imported trough peak
Apples local
imported trough peak
Pears local
imported
Plums local
imported
Quinces local
imported
Cherries local
imported
Apricot local
imported trough peak
Peach local
imported
Key: Peak – Implies the month when imports reach their peak; Trough – implies when imports are the lowest level. White months indicate either no local production or no imports. Blue months indicate that imports do occur. Orange months indicate that domestic production is available from open fields.
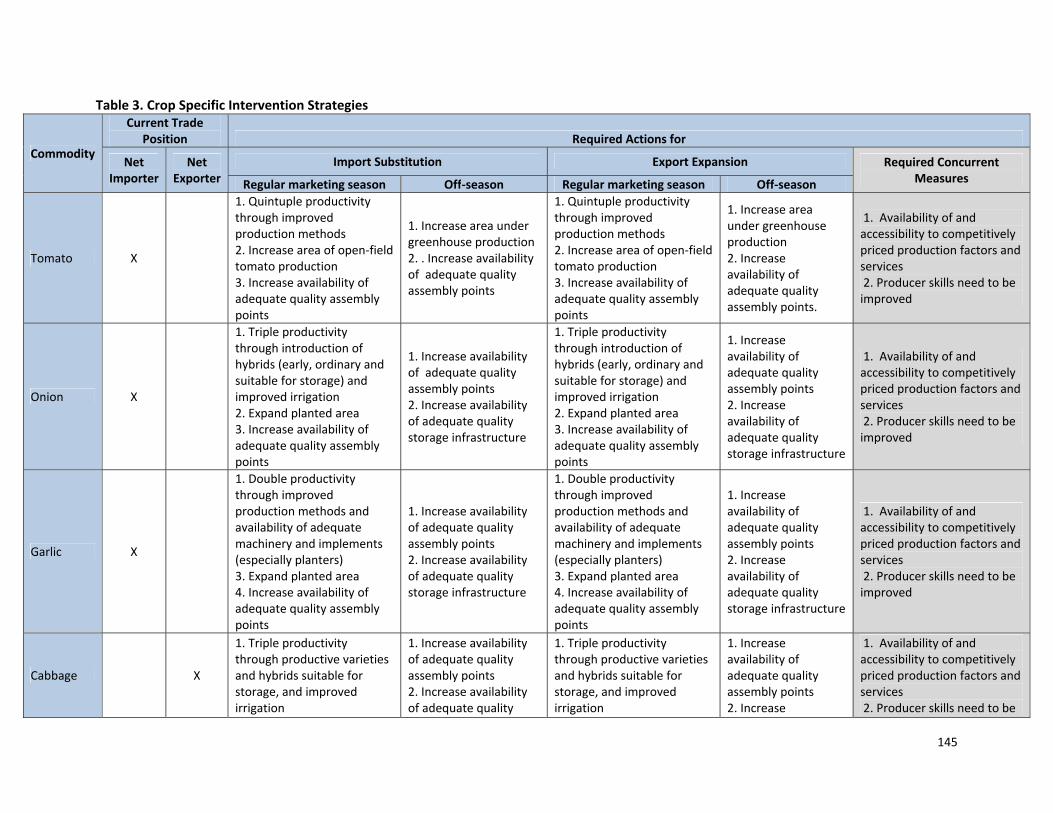
145
Table 3. Crop Specific Intervention Strategies
Commodity
Current Trade Position Required Actions for
Net Importer
Net Exporter
Import Substitution Export Expansion Required Concurrent Measures Regular marketing season Off‐season Regular marketing season Off‐season
Tomato X
1. Quintuple productivity through improved production methods 2. Increase area of open‐field tomato production 3. Increase availability of adequate quality assembly points
1. Increase area under greenhouse production 2. . Increase availability of adequate quality assembly points
1. Quintuple productivity through improved production methods 2. Increase area of open‐field tomato production 3. Increase availability of adequate quality assembly points
1. Increase area under greenhouse production 2. Increase availability of adequate quality assembly points.
1. Availability of and accessibility to competitively priced production factors and services 2. Producer skills need to be improved
Onion X
1. Triple productivity through introduction of hybrids (early, ordinary and suitable for storage) and improved irrigation 2. Expand planted area 3. Increase availability of adequate quality assembly points
1. Increase availability of adequate quality assembly points 2. Increase availability of adequate quality storage infrastructure
1. Availability of and accessibility to competitively priced production factors and services 2. Producer skills need to be improved
Garlic X
1. Double productivity through improved production methods and availability of adequate machinery and implements (especially planters) 3. Expand planted area 4. Increase availability of adequate quality assembly points
1. Increase availability of adequate quality assembly points 2. Increase availability of adequate quality storage infrastructure
1. Availability of and accessibility to competitively priced production factors and services 2. Producer skills need to be improved
Cabbage X
1. Triple productivity through productive varieties and hybrids suitable for storage, and improved irrigation
1. Increase availability of adequate quality assembly points 2. Increase availability of adequate quality
1. Triple productivity through productive varieties and hybrids suitable for storage, and improved irrigation
1. Increase availability of adequate quality assembly points 2. Increase
1. Availability of and accessibility to competitively priced production factors and services 2. Producer skills need to be
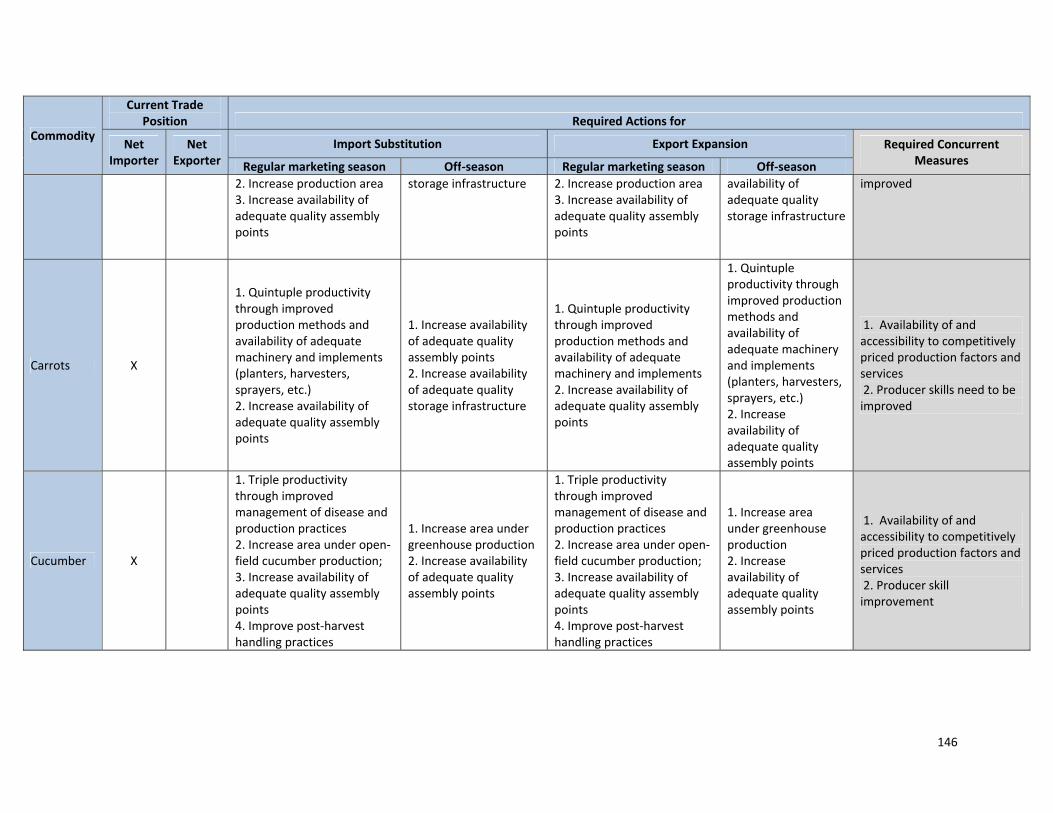
146
Commodity
Current Trade Position Required Actions for
Net Importer
Net Exporter
Import Substitution Export Expansion Required Concurrent Measures Regular marketing season Off‐season Regular marketing season Off‐season
2. Increase production area3. Increase availability of adequate quality assembly points
storage infrastructure 2. Increase production area3. Increase availability of adequate quality assembly points
availability of adequate quality storage infrastructure
improved
Carrots X
1. Quintuple productivity through improved production methods and availability of adequate machinery and implements (planters, harvesters, sprayers, etc.) 2. Increase availability of adequate quality assembly points
1. Increase availability of adequate quality assembly points 2. Increase availability of adequate quality storage infrastructure
1. Quintuple productivity through improved production methods and availability of adequate machinery and implements 2. Increase availability of adequate quality assembly points
1. Quintuple productivity through improved production methods and availability of adequate machinery and implements (planters, harvesters, sprayers, etc.) 2. Increase availability of adequate quality assembly points
1. Availability of and accessibility to competitively priced production factors and services 2. Producer skills need to be improved
Cucumber X
1. Triple productivity through improved management of disease and production practices 2. Increase area under open‐field cucumber production; 3. Increase availability of adequate quality assembly points 4. Improve post‐harvest handling practices
1. Increase area under greenhouse production 2. Increase availability of adequate quality assembly points
1. Availability of and accessibility to competitively priced production factors and services 2. Producer skill improvement
147
Commodity
Current Trade Position Required Actions for
Net Importer
Net Exporter
Import Substitution Export Expansion Required Concurrent Measures Regular marketing season Off‐season Regular marketing season Off‐season
Eggplant X
1. Triple productivity through improved production methods 2. Increase area under open‐field eggplant production; 3. Increase availability of adequate quality assembly points
1. Start greenhouse production 2. Increase availability of adequate quality assembly points
1. Triple productivity through improved production methods 2. Increase area under open‐field eggplant production; 3. Increase availability of adequate quality assembly points
1. Availability of and accessibility to competitively priced production factors and services 2. Producer skill improvement
Beans X
1. Double productivity through improved irrigation and machinery services 2. Increase production area 3. Increase availability of adequate quality assembly points
Increase availability of adequate quality assembly points
1. Double productivity through improved irrigation and machinery services 2. Increase production area 3. Increase availability of adequate quality assembly points
Increase availability of adequate quality assembly points
1. Availability of and accessibility to competitively priced production factors and services 2. Producer skills need to be improved
Potato X
1. Triple productivity through improved irrigation and production methods 2.Increase production area 3. Increase availability of adequate quality assembly points and storage infrastructure
1. Increase availability of adequate quality assembly points 2. Increase availability of adequate quality storage infrastructure
1. Availability of and accessibility to competitively priced production factors and services 2. Producer skills need to be improved
Pepper X Improve production practices and facilitate value added
activities
1. Availability of and accessibility to competitively priced production factors and services 2. Producer skills need to be improved
Wheat X
1. Triple productivity through improved seeds and other inputs 2. Grower managed storage
Grower managed storage infrastructure
N/A
N/A
1. Availability of and accessibility to competitively priced production factors and services
148
Commodity
Current Trade Position Required Actions for
Net Importer
Net Exporter
Import Substitution Export Expansion Required Concurrent Measures Regular marketing season Off‐season Regular marketing season Off‐season
infrastructure 3. Improved financing instruments
2. Producer skills need to be improved
Corn X
1. Quintuple productivity through improved seeds and other inputs 2. Storage infrastructure 3. Financing instruments
Storage infrastructure
1. Triple productivity through improved seeds and other inputs 2. Storage infrastructure 3. Financing instruments
Storage infrastructure
1. Availability of and accessibility to competitively priced production factors and services 2. Producer skills need to be improved
Sunflower X Quintuple productivity through improved seeds and other inputs
Storage infrastructure needs to be expanded
1. Availability of and accessibility to competitively priced production factors and services 2. Producer skills need to be improved
Melons X 1. Double productivity 2. Expand production area
N/A N/A
1. Availability of and accessibility to competitively priced production factors and services 2. Producer skills need to be improved
Walnuts X
1. Double productivity through introduction of early fruit bearing saplings, improved irrigation and production methods 2. Development of proper post‐harvest handling assembly and packing points3. Increase production area
1. Increase availability of adequate quality assembly points 2. Increase availability of adequate quality storage infrastructure
1. Availability of and accessibility to early fruit bearing varieties, irrigation water and plant protection materials 2. Producer skills need to be improved
149
Commodity
Current Trade Position Required Actions for
Net Importer
Net Exporter
Import Substitution Export Expansion Required Concurrent Measures Regular marketing season Off‐season Regular marketing season Off‐season
Hazelnuts X
1. Double productivity through introduction of more productive varieties and improved production practices
2. Increase production area
1. Increase availability of proper post‐harvest handling facilities 2. Facilitate value adding activities
1. Double productivity through introduction of more productive varieties and improved production practices 2. Increase production area
1. Double productivity through introduction of more productive varieties and improved production practices 2. Facilitate value adding activities
1. Availability of and accessibility to competitively priced production factors and services 2. Producer skills need to be improved
Persimmon X
1. Introduce modern varieties on a plantation basis 2. Improved production and post‐harvest handling practices should be introduced 3. Development of proper assembly points for post‐harvest handling is necessary4. Improve irrigation
1. Increase availability of adequate quality assembly points 2. Increase availability of adequate quality storage infrastructure
1. Availability of and accessibility to modern varieties, irrigation water and plant protection materials 2. Producer skills need to be improved
Apples X
1. Triple productivity through improved irrigation, introduction of dwarf/semi‐dwarf varieties 2. Increase orchard area 3. Increase availability of adequate quality assembly points
1. Increase availability of adequate quality assembly points 2. Increase availability of adequate quality storage infrastructure
1. Triple productivity through improved irrigation, introduction of dwarf/semi‐dwarf sapling 2. Increase orchard area 3. . Increase availability of adequate quality assembly points
1. Increase availability of adequate quality assembly points 2. Increase availability of adequate quality storage infrastructure
1. Availability of and accessibility to competitively priced production factors and services 2. Producer skills need to be improved with respect pruning and grafting practices
Pears X
1. Double productivity through improved irrigation, and introduction of dwarf/semi‐dwarf varieties 2. Increase production area 3. Increase availability of
1. Increase availability of adequate quality assembly points 2. Increase availability of adequate storage infrastructure
1. Double productivity through improved irrigation, introduction of dwarf/semi‐dwarf varieties 2. Increase production area 3. . Increase availability of
1. Increase availability of adequate quality assembly points 2. Increase availability of
1. Availability of and accessibility to early fruit bearing varieties, irrigation water and plant protection materials 2. Producer skills need to be
150
Commodity
Current Trade Position Required Actions for
Net Importer
Net Exporter
Import Substitution Export Expansion Required Concurrent Measures Regular marketing season Off‐season Regular marketing season Off‐season
adequate quality assembly points
adequate quality assembly points
adequate storage infrastructure
improved
Plums X
1. Triple productivity through improved irrigation, introduction of dwarf/semi‐dwarf varieties 2. Increase production area 3. Increase availability of adequate quality assembly points
1. Increase availability of adequate quality assembly points 2. Increase availability of adequate storage infrastructure
1. Availability of and accessibility to early fruit bearing varieties, irrigation water and plant protection materials 2. Producer skills need to be improved
Quince X
1. Double productivity through improved irrigation, and introduction of dwarf/semi‐dwarf varieties 2. Increase production area 3. Increase availability of adequate quality assembly points
1. Increase availability of adequate quality assembly points 2. Increase availability of adequate storage infrastructure
1. Availability of and accessibility to early fruit bearing varieties, irrigation water and plant protection materials 2. Producer skills need to be improved
Cherries X
1. Triple productivity through improved irrigation, introduction of dwarf/semi‐dwarf varieties 2. Increase production area 3. Increase availability of adequate quality assembly points
1. Increase availability of adequate quality assembly points 2. Increase availability of adequate storage infrastructure
1. Availability of and accessibility to early fruit bearing varieties, irrigation water and plant protection materials 2. Producer skills need to be improved
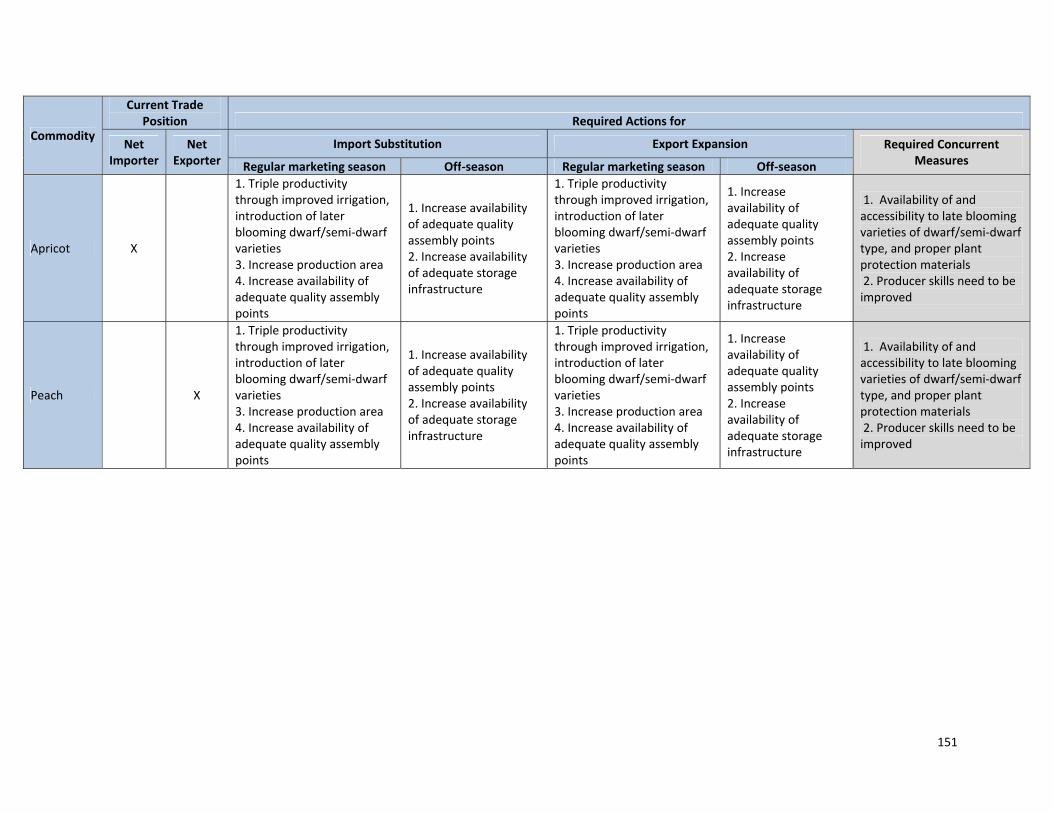
151
Commodity
Current Trade Position Required Actions for
Net Importer
Net Exporter
Import Substitution Export Expansion Required Concurrent Measures Regular marketing season Off‐season Regular marketing season Off‐season
Apricot X
1. Triple productivity through improved irrigation, introduction of later blooming dwarf/semi‐dwarf varieties 3. Increase production area 4. Increase availability of adequate quality assembly points
1. Increase availability of adequate quality assembly points 2. Increase availability of adequate storage infrastructure
1. Availability of and accessibility to late blooming varieties of dwarf/semi‐dwarf type, and proper plant protection materials 2. Producer skills need to be improved
Peach X
1. Triple productivity through improved irrigation, introduction of later blooming dwarf/semi‐dwarf varieties 3. Increase production area 4. Increase availability of adequate quality assembly points
1. Increase availability of adequate quality assembly points 2. Increase availability of adequate storage infrastructure
1. Availability of and accessibility to late blooming varieties of dwarf/semi‐dwarf type, and proper plant protection materials 2. Producer skills need to be improved