analytical and experimental evaluation of elastic properties of vacuum assisted resin infusion...
TRANSCRIPT

Analytical and Experimental Evaluation of ElasticProperties of Vacuum Assisted Resin InfusionMolded Polymer Composites with Eight-HarnessWoven Fiber Mats
Ahmed Khattab,1 A. Sherif El-Gizawy21Department of Industrial Technology, College of Engineering, University of Louisiana-Lafayette,Lafayette, Louisiana 70504
2Industrial and Technological Development Center, Mechanical and Aerospace Engineering,University of Missouri-Columbia, Columbia, Missouri 65211
An analytical and experimental evaluation of elasticproperties of composite materials under tensile load ispresented in this paper. The analysis focuses on com-posite materials molded by vacuum assisted resin infu-sion molding (VARIM). The molded composite structureconsists of AS4-8 harness carbon fiber mats and ahigh-temperature polymer (5250-4-RTM). The analyticalmodel presented is adapted and formulated using opti-cal microscopy observations of cross sections of sam-ples molded by VARIM. Effects of resin degree of cure,fiber undulation, and resin rich areas between fiber bun-dles are addressed in the model. An experimental casestudy is presented to evaluate the accuracy of theadapted analytical model. The evaluation shows a rea-sonable agreement between the experimental and ana-lytical results. POLYM. COMPOS., 29:63–71, 2008. ª 2007Society of Plastics Engineers
INTRODUCTION
Vacuum assisted resin infusion molding (VARIM) pro-
cess was recently found to be a viable process for fabrica-
tion of high-temperature polymer composites [1]. In this
process, the reinforcement, which is usually composed of
several layers of fiber mats, is placed in an open mold and
a plastic vacuum bag is placed on the top of the mold. The
mold is connected with a resin source and a vacuum pump.
As the vacuum is drawn through the mold, the liquid resin
infuses into the reinforcing fiber mats. Curing and de-
molding steps are followed to finish the product. VARIM
has been used primarily with resin systems that cure at
room temperature. Some important issues, such as elastic
properties prediction, remain to be explored before high-
temperature VARIM can be widely used for variety of
high performance applications. The analytical and experi-
mental evaluation in this study will highlight many of the
issues that need to be understood.
In an effort to simulate the entire VARIM process, a
three-dimensional model was developed by Loos et al. [2].
It constitutes modules for describing the resin flow, heat
transfer, preform compaction, cure kinetics, and residual
stresses during infiltration and cure. They addressed
VARIM process for resin that cures at room temperature
(vinyl ester). Tim et al. [3] performed an analysis on
shrinkage and warpage of compression-molded fiber-rein-
forced composite parts. Their research concentrated on nu-
merical simulation and experimental investigation of
shrinkage and warpage in thin compression molded parts.
Their numerical model incorporated cure-dependent me-
chanical properties of the composite. They considered the
composite at a macroscopic scale and did not differentiate
between the fiber- and resin-rich regions.
Chou and Ishikawa [4] presented three models for wo-
ven fiber composite analysis. These models are the Mosaic
model, the Crimp model, and the bridge model. The sim-
plest model is the mosaic model in which fiber continuity
and undulation have been excluded. Ito and Chou [5]) pre-
sented an analytical and experimental study to analyze the
strength and failure behavior of plain weave composites.
They developed a three-dimensional model to investigate
the geometrical characteristics of yarn shape, laminate
staking configuration, fiber volume fraction, and yarn pack-
ing fraction. The model predicts elastic properties, stress
distributions, and strengths under tensile loading. The
mathematical model was evaluated and also verified exper-
imentally using a composite material molded by resin
transfer molding (RTM) of a vinyl ester resin and plain
weave graphite fabrics.
Correspondence to: Ahmed Khattab; e-mail: [email protected]
DOI 10.1002/pc.20356
Published online in Wiley InterScience (www.interscience.wiley.com).
VVC 2007 Society of Plastics Engineers
POLYMER COMPOSITES—-2008

An analysis on modeling the effect of cure on mechani-
cal properties in laminate composites was performed by
Golestanian and El-Gizawy [6]. They presented results on
cure-dependent properties of resin transfer molded thin
composites with woven fiber mats. In this study, resin
properties were assumed to change from viscoelastic liquid
to properties of the solid, as the part cures. This work was
aimed at modeling the cure-dependent mechanical proper-
ties of molded composites with woven fiber mats produced
by RTM. Chen and Chou [7] proposed a three-dimensional
model of the unit cell for multilayer fabrics to predict the
compressive behavior of yarns. Their analytical study pre-
sented results for the nesting and elastic deformation dur-
ing the compaction of multilayer woven fabric preforms.
The authors did not however experimentally verify their
analytical model.
Kwon and Altekin [8] developed an approach to analyze
woven-fabric composite structure based on microlevel
properties of fiber and matrix materials. This approach can
predict the stiffness, strength, and progressive failure of
woven-fabric composites. The predicted properties by this
approach were in good agreement with some other pub-
lished data. Recently, also Naik and Kuchibhotla [9] pre-
sented a two-dimensional analytical model for the failure
behavior of plain weave fabric composites made of
twisted yarns under tensile loading. The model was used
to predict mechanical properties as functions of yarn angle
of twist. The model however again was not confirmed
experimentally.
A literature review shows that a large portion of the pub-
lished work on modeling for woven fiber/high-temperature
polymer composites deals primarily with the conventional
RTM process. Nevertheless, these findings and results could
also help in the development of the science-base for
VARIM processes using high-temperature polymers.
The present paper introduces an analytical-experimental
evaluation of elastic properties of molded polymer compo-
sites with eight-harness woven fiber mats produced by
VARIM. The analytical study aims at modeling the elastic
properties of vacuum assisted resin infusion molded
composites. The adapted model for VARIM composites is
based on a previous model presented by one of the authors
[6] for resin transfer molded composites. This investigation
provides the capability for prediction and characterization
of elastic properties of high-temperature polymer compo-
sites produced by VARIM. The effect of resin degree of
cure on the properties is also addressed in the adapted
model.
ANALYTICAL INVESTIGATION
The current analytical model assumes the applicability
of the Classical Laminate Theory (CLT) to the infinitesi-
mal regions of the composite unit cell. Cure-dependent me-
chanical properties of composite parts with eight-harness
fiber are determined. Resin properties are assumed to
change from that of a liquid to properties of a solid, as the
part cures. The shape function used in the mathematical
model is formulated based on the observation of cross sec-
tions of samples molded by VARIM under an optical
microscope. This model takes into account the fiber conti-
nuity and undulation. Resin degree of cure, resin-rich areas
between fiber bundles, and the fraction of resin within the
fiber bundles are also taken into account.
FIG. 1. Schematic of a top view of eight-harness carbon fiber mat.
FIG. 2. Geometry of a cross section of eight-harness carbon fiber mat.
(a) a CAD drawing and (b) a picture obtained by an optical microscope, at
70�, for a sample produced by VARIM.
FIG. 3. Geometry of eight-harness carbon fiber mat; each section repre-
sents a cross section of the mat along the y-direction.
64 POLYMER COMPOSITES—-2008 DOI 10.1002/pc

FIBER MAT STRUCTURE
To model mechanical properties of carbon fiber mat
composites, the geometry of the mat was first analyzed on
the microscopic level. Figure 1 shows a schematic of a top
view of eight-harness (8H) weave. This number (8H) refers
to the number of yarns that are passed over by one yarn. In
an eight-harness satin weave, yarns are weaved by passing
over seven and under one yarn before the pattern repeats
itself. The fiber yarns which run in x-direction are called
the fill yarns, and those running in the y-direction are
called the warp yarns, with the same fibers count in both
directions.
The cross section of some samples produced by VARIM
were prepared, polished, and analyzed under an optical
microscope. Figure 2b shows the shape of a cross section
through the thickness of the molded sample. All the dimen-
sions of the fill and warp yarn were obtained from the ob-
servation under the microscope and then the cross section
was redrawn in CAD system as shown in Fig. 2a. These
observations showed that the warp yarn, which crosses
over the fill yarn, resemble an ellipse. Because of the high
compression in VARIM process, the following seven
yarns, which cross under the fill yarn, regroup together to
act as one bundle. Measurements were made (under the
microscope) of the wavelength of a yarn, yarn thickness,
elliptical shape of the warp yarn, and some other necessary
dimensions to draw the cross section in CAD system. The
area of the elliptical shape of the warp yarn and the total
fiber bundle cross section area were used to calculate the
bundle fiber volume fraction.
The analysis is performed on a unit cell which repre-
sents the building block of the entire mat. The geometry of
eight-harness mat repeats itself every eight yarns in both
x- and y-directions. The unit cell chosen for the analysis
should contain all the patterns present in the mat. So, the
complete unit cell for eight-harness mat consists of eight
rows. Figure 3 shows the geometry of eight-harness carbon
fiber mat as was seen under the microscope. Each section
represents a cross section of the mat along the y-direction,as shown in Fig. 1. The section length (L) in Fig. 3 repre-
sents the length of a unit cell.
SHAPE FUNCTION FORMULATION
The shape function is formulated using optical micros-
copy observations of samples cross sections. On the basis
of these observations, the fill yarn is modeled as a sinusoi-
dal wave. Figure 4 shows the CAD drawing for a cross
section of an eight-harness fiber mat. The figure shows
also a picture obtained by an optical microscope for a sam-
ple produced by VARIM. The geometrical relation be-
tween the fill yarn and the warp yarn of eight-harness fiber
mat, as shown in Fig. 5, is used to define the shape func-
tion based on the shape characterization performed by Ito
and Chou [5] and Golestanian and El-Gizawy [6].
The center line of the fill yarn z0 is defined as:
z0ðxÞ ¼ � hz2sin
2pax
� �where � a
4� x � 3a
4
� �(1)
The fill yarn thickness hz is assumed to be constant. The
upper boundary of the fill yarn is defined as:
zuðxÞ ¼ z0ðxÞ þ hz2
(2)
And the lower boundary of the fill yarn is defined as:
ztðxÞ ¼ z0ðxÞ � hz2
(3)
FIG. 4. Geometry of a cross section of eight-harness carbon fiber mat.
(a) CAD drawing and (b) a picture obtained by an optical microscope, at
40�, for a sample produced by VARIM.
FIG. 5. Geometrical relation between the fill yarn and the warp yarn of
8H fiber mat.
FIG. 6. Variation of resin elastic modulus and Poisson’s ratio with
cure [6].
TABLE 1. Elastic properties of the carbon fiber AS4 and 5250-4-RTM
resin.
Materials
EL
(GPa)
ET
(GPa)
GLT
(GPa)
GTT
(GPa) nLT
Carbon fiber (AS4) 228 40 24 14.3 0.26
Resin 5250-4-RTM 4.6 4.6 1.7 1.7 0.36
DOI 10.1002/pc POLYMER COMPOSITES—-2008 65

The shape of the warp yarn cross section, based on the
observation under the microscope, is assumed to be ellipti-
cal and given as:
ztðxÞ ¼ 2h2a� 4xg
ffiffiffiffiffiffiffiffiffiffiffiffiffiffiffiffiffiffiffiffiffiffiffiffiffiffiffiffiffiffiffiffiffiffiffiffiffiffiffiffiffiffiffiffiffiffiffiffiffiffiffið2x� 2xgÞða� 2xg � 2xÞ
qþ hz � h0 where xg � x � a
2� xg
� �� �ð4Þ
Based on the geometrical shape the variable, hc in the
previous equation is defined as:
h0 ¼ hz2
sin2xgpa
þ 1
� �� �(5)
The local angle between fiber direction and x-axis is:
yðxÞ ¼ tan�1 dz0ðxÞdx
� �(6)
where, in the previous equations z0 is the center line of fill
yarn, zu is the upper boundary of the fill yarn, zl is the
lower boundary of the fill yarn, hz is the yarn thickness, ais the wavelength of a yarn, zt is the boundary of elliptical
shape of warp yarn, xg is the offset distance of the warp
yarn from zero coordinate, and y is the angle between fiber
direction and x-axis.
MODELING OF COMPOSITEMECHANICAL PROPERTIES
As mentioned earlier, the CLT is assumed to be applica-
ble to the infinitesimal regions of the composite unit cell.
FIG. 7. Distribution of Young’s modulus for section A-A at the end of
cure cycle.
FIG. 8. Distribution of Young’s modulus at an area with fiber undulation.
FIG. 9. Average of Young’s modulus through the thickness and along
the length for one section.
FIG. 10. Average of Young’s modulus through the thickness and along
the length for 8 sections.
66 POLYMER COMPOSITES—-2008 DOI 10.1002/pc

The stiffness of the fill, warp, and the matrix are evaluated
based on the properties of each constituent. The fiber vol-
ume fraction of the fill and warp was calculated based on
the dimension obtained under the microscope for the shape
of the yarn and the total cross section area of the fiber in
the bundle. The bundle fiber volume fraction was found to
be 62%. The properties of the fill and warp yarn are deter-
mined based on the rule of mixtures as follows:
The longitudinal Young’s modulus of the yarn is given
by:
E1 ¼ VfEf þ ð1� VfÞEm (7)
The transverse Young’s modulus of the yarn, using
Halpin and Tsai semi-empirical models [10], is given by:
E2 ¼ Em
1þ xZVf
1� ZVf
� �(8)
Z ¼ ðEf=EmÞ � 1
ðEf=EmÞ þ x(9)
The reinforcing factor, x, is given by the empirical for-
mula [11]:
x ¼ 1þ 40V10f (10)
The shear modulus is given by:
G12 ¼ Gm
1þ xZVf
1� ZVf
� �(11)
Z ¼ ðGf=GmÞ � 1
ðGf=GmÞ þ x(12)
G23 ¼ Gm=ð1� V1=2f ð1� Gm=G23fÞÞ (13)
The Poisson’s ratios are given by:
u12 ¼ u13 ¼ Vfnf þ ð1� VfÞnm (14)
u21 ¼ n12E2=E11 (15)
u23 ¼ Vfu23f þ Vmð2nm � n21Þ (16)
where Em and Ef are the tensile moduli for the matrix and
the fiber respectively. Vf is the fiber volume fraction. Gm
and Gf are the shear moduli for the matrix and the fiber
respectively. nm and nf are the Poisson’s ratios for the ma-
trix and the fiber respectively. The changes in fiber orienta-
tion due to yarn undulation must be taken into account.
The effective elastic constants for the fill and warp yarns
are given as follows:
1
Ex¼cos4 y
E1
þ sin4 yE1
þ 1
G12
� 2n12E1
� �sin2 y cos2 y (17)
Ey ¼ E2 (18)
nxy ¼ Ex
"n12E1
ðsin4 yþ cos4 yÞ � 1
E1
þ 1
E2
� 1
G12
� �
� sin2 y cos2 y
#ð19Þ
1
Gxy¼ 2
2
E1
þ 2
E2
þ 4n12E1
� 1
G12
� �sin2 y cos2 y
þ 1
G12
ðsin4 yþ cos4 yÞ ð20Þ
CURE-DEPENDANT MECHANICAL PROPERTIES
While the molded composite material is considered to
be orthotropic, the matrix, i.e., the resin, is considered to
be isotropic. At the early stages of curing, before gelation,
resin acts as a liquid. As the degree of cure increases, more
cross linking occurs, and the resin acts as a solid media.
The mechanical properties of resin change as a function of
degree of cure. Figure 6 shows a linear relation between
the degree of cure and the mechanical properties of the
resin. This relation was presented in the early 90s and used
after that successfully in different studies [6]. In this paper,
FIG. 11. Average of Young’s modulus through the thickness and along
the length for the eight sections of the unit cell of a one-layer laminate.
FIG. 12. A laminate with six layers of carbon fiber randomly distributed.
DOI 10.1002/pc POLYMER COMPOSITES—-2008 67

the relation is used to determine resin mechanical proper-
ties as functions of degree of cure.
The modulus, Ex, for each section of the fiber mat unit
cell is determined by integration of the modulus of each
constituent through the thickness for each infinitesimal
length (dx). Thus in the region where (0 � x � xg), shownin Fig. 5, for section A-A, shown in Fig. 3, is given as
follows:
ExðxÞ ¼ 1
H
"Z h1
0
Emx dzþ
Z h2
h1
Ewx dz
þZ h3
h2
Efxdzþ
Z h4
h3
Emx dz
#ð21Þ
where Emx , E
wx , and Ef
x are the moduli in x-direction for the
matrix, the warp, and the fill yarn respectively. H is the
total thickness of the laminate. From 0 to h1 is the thick-
ness of the matrix bottom layer, from h1 to h2 is warp yarn
thickness, from h2 to h3 is the thickness of the fill yarn,
and from h3 to h4 is the thickness of the matrix top layer.
Similar relations apply to other region within section A-A
of the unit cell. Then the effective modulus for this section
is obtained by integration of Ex(x) along the length of the
section.
Ex ¼ 1
Lx
Z Lx
0
ExðxÞdx (22)
Similar steps apply to the other sections, from section
B-B to section H-H, to find the Ex(x) along the length of
each section. The effective Young’s modulus, Ex, for the
whole laminate is obtained by taking the average of Ex for
all of the sections.
All other properties (e.g., nxy and Gxy) are obtained in a
similar manner.
MODELING RESULTS
The elastic properties were determined for every 5% of
resin cure and up to the end of the cure cycle. A series of
MATLAB codes were written for this model using Eqs. 1–22.The elastic properties of the fill and warp yarn are calcu-
lated based on the fiber bundle volume fraction and the
elastic properties of fiber and matrix using mechanical
properties of each constituent. Table 1 shows the elastic
mechanical properties of the materials used in this study,
which are eight-harness carbon fiber mats weaved by AS4
and 5250-4-RTM BMI resin. The properties of AS4 carbon
fiber were obtained from Ref. [12], while the properties for
5250-4-RTM were obtained from Ref. [13].
The first step in the model was to determine the elastic
properties in each infinitesimal region for each section, of
the eight sections, of the unit cell, shown in Fig. 3. The
fiber bundle volume fraction was calculated, based on the
dimensions obtained under the microscope for several
cross sections of the molded composite, and was found to
be 62%. The cure-dependant properties were determined
for the resin in the fiber bundle and resin-rich regions. The
composite tensile moduli were determined for every 5% of
resin degree of cure from zero and up to the end of curing
cycle, 100% for every section of the eight sections using
Eqs. 17 and 18. Figure 7 shows the distribution of Young’s
modulus for section A-A at the end of cure cycle. Figure 8
shows the change in the modulus due to fiber undulation
for the same section. Then, the average of the modulus
through the thickness and along the section length was
determined by Eq. 21 for each section of the unit cell. A
curve that represents this average is shown in Fig. 9.
Figure 10 shows the average for every section of the eight
sections, of the unit cell, along x-direction.The distribution of the effective modulus of the unit
cell, as shown in Fig. 11, was determined by taking the av-
erage for the eight sections along the y-direction for a one-
layer laminate of carbon fiber mat. A laminate with several
layers of carbon fiber randomly distributed, as shown in
Fig. 12, reduced the wavy distribution of the effective
modulus. Figure 13 shows this distribution for a six-layer
laminate.
FIG. 13. Average of Young’s modulus through the thickness and along
the length for the eight sections of the unit cell of a six-layer laminate.
FIG. 14. Variation of Young’s modulus with resin degree of cure.
TABLE 2. Cure-dependent properties for carbon fiber/5250-4-RTM
resin.
Degree of Cure (%) Ex (GPa) Ey (GPa) Gxy (GPa) nxy
20 61.5 61.5 1.4 0.215
40 66.9 66.9 2.7 0.207
60 70.7 70.7 3.8 0.201
80 73.9 73.9 5.0 0.195
100 74.0 74.0 5.1 0.194
68 POLYMER COMPOSITES—-2008 DOI 10.1002/pc

The previous steps were repeated to determine the mod-
ulus of the laminate at every 5% of resin degree of cure.
The rest of the elastic properties were determined in a sim-
ilar manner. Figure 14 shows the variation of Young’s
modulus with resin degree of cure. The modulus showed
an exponential increase with resin degree of cure till it
reaches 80%, and then it levels off. All other properties
(e.g., vxy and Gxy) are obtained in a similar manner. Table 2
shows cure-dependant mechanical properties at every 20%
of resin degree of cure.
CASE STUDY
A case study was investigated analytically, using the
presented model, to determine the tensile modulus, Ex, for
a laminate of two layers of carbon fiber mats. Figure 15
shows a schematic of a laminate with two layers of fiber
mats randomly distributed. The distance (S) in the figure
represents an offset distance in x-direction between the two
layers. The average distribution of Young’s modulus
through the thickness and along the length for the eight
sections of the unit cell of a two-layer laminate with an
offset distance (S) of 2.54 mm (0.1 in.) is shown in Fig. 16.
Since the distribution is wavy, the minimum value within
the unit cell is considered as the laminate Young’s modulus
of elasticity.
A parametric study of the effect the offset distance (S)shows that the lowest modulus can be obtained at no offset
between the two layers. As the offset distance increases the
modulus increases till it reaches a maximum point and
then decreases once again. So the modulus changes up and
down between these two points as a function of the offset
distance. Figure 17 shows the effect of the offset distance
(S) on the modulus of the two-layer laminate of eight-har-
ness carbon fiber mats. The figure shows that the maxi-
mum, minimum, and average values for the modulus are
73.4, 70.9, and 71.8 GPa. As mentioned before the mini-
mum value of 70.9 GPa is used as the effective value
for Young’s modulus of elasticity for the two-layer
laminate.
The presented analytical case study of a laminate with
two-layer mats was also investigated experimentally to
determine the tensile modulus, Ex. The two-layer laminate
was molded by VARIM process. The materials used are
AS4-8H carbon fiber mats and a high-temperature polymer
called 5250-4RTM. Molding process parameters were set
at a maximum cure temperature of 1888C (3708F) and a
heating rate of 1.678C/min (38F/min). Full description of
the experimental setup was reported in a previous publica-
tion by the authors [14].
Room temperature tension tests were performed using
ASTM (D3039/D3039M-00) standard test method for ten-
sile properties of polymer matrix composite materials.
Specimens used in the test are 200 mm (8.0 in.) long, 25
mm (1.0 in.) wide, and on average 0.79 mm (0.031 in.)
thick. The machine which was used in the evaluation is Se-
ries 812 Materials Test System from MTS Systems Corpo-
ration. Hydraulic grips were used with a gripping pressure
of 10 MPa. The tension test was performed using a con-
stant head speed of 1.27 mm/min (0.05 in/min).
A data acquisition system based on LABVEIW software
was used to collect the test data. The tensile modulus was
calculated using chord modulus calculation as recommended
by ASTM standards, Fig. 18 shows a typical stress–strain
curve obtained from one of the test. The two strain points
used in the calculations are 1000 micro-strain and 3000
micro-strain. If the data was not available at the exact
strain end points, the closest available data was used. The
data collected was load in pounds, ram displacement in
inches, and strain. According to ASTM standards the per-
FIG. 15. A laminate with two layers of carbon fiber randomly distributed.
FIG. 17. Effect of the offset distance (S) on the modulus of the two-layer
laminate of eight-harness carbon fiber mats.
FIG. 16. Average of Young’s modulus through the thickness and along
the length for the eight sections of the unit cell of a one-layer laminate.
DOI 10.1002/pc POLYMER COMPOSITES—-2008 69
centage of coefficient of variation of the tensile modulus is
calculated as follows:
x ¼Xni¼1
xi
!=n (23)
Sn�1 ¼ffiffiffiffiffiffiffiffiffiffiffiffiffiffiffiffiffiffiffiffiffiffiffiffiffiffiffiffiffiffiffiffiffiffiffiffiffiffiffiffiffiffiffiffiffiffiffiffiffiffiXn
i¼1
x2i � nx2
!=ðn� 1Þ
vuut (24)
CV ¼ 100Sn�1=x (25)
where x is the sample mean (average), Sn�1 is the sample
standard deviation, CV is the sample coefficient of varia-
tion, in percentage, n is the number of specimens, and xi isthe measured property.
The results of the test for tensile modulus are shown in
Table 3. The test was repeated several times to count for
error and mistakes. The tensile test was performed for 13
samples from six different batches of the molded compo-
sites. The statistical analysis of the results shows an aver-
age tensile modulus of 66.9 GPa, a standard deviation of 3,
and a coefficient of variation of 5.7%, as shown in Table 4.
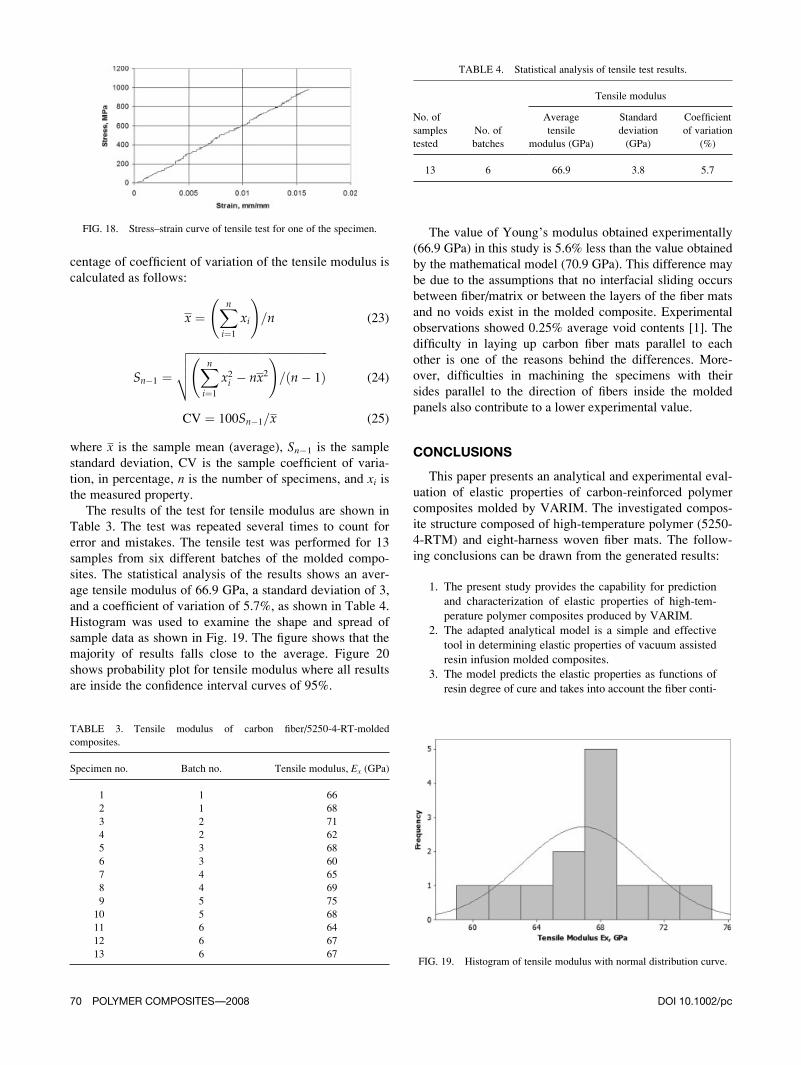
Histogram was used to examine the shape and spread of
sample data as shown in Fig. 19. The figure shows that the
majority of results falls close to the average. Figure 20
shows probability plot for tensile modulus where all results
are inside the confidence interval curves of 95%.
The value of Young’s modulus obtained experimentally
(66.9 GPa) in this study is 5.6% less than the value obtained
by the mathematical model (70.9 GPa). This difference may
be due to the assumptions that no interfacial sliding occurs
between fiber/matrix or between the layers of the fiber mats
and no voids exist in the molded composite. Experimental
observations showed 0.25% average void contents [1]. The
difficulty in laying up carbon fiber mats parallel to each
other is one of the reasons behind the differences. More-
over, difficulties in machining the specimens with their
sides parallel to the direction of fibers inside the molded
panels also contribute to a lower experimental value.
CONCLUSIONS
This paper presents an analytical and experimental eval-
uation of elastic properties of carbon-reinforced polymer
composites molded by VARIM. The investigated compos-
ite structure composed of high-temperature polymer (5250-
4-RTM) and eight-harness woven fiber mats. The follow-
ing conclusions can be drawn from the generated results:
1. The present study provides the capability for prediction
and characterization of elastic properties of high-tem-
perature polymer composites produced by VARIM.
2. The adapted analytical model is a simple and effective
tool in determining elastic properties of vacuum assisted
resin infusion molded composites.
3. The model predicts the elastic properties as functions of
resin degree of cure and takes into account the fiber conti-
FIG. 18. Stress–strain curve of tensile test for one of the specimen.
TABLE 3. Tensile modulus of carbon fiber/5250-4-RT-molded
composites.
Specimen no. Batch no. Tensile modulus, Ex (GPa)
1 1 66
2 1 68
3 2 71
4 2 62
5 3 68
6 3 60
7 4 65
8 4 69
9 5 75
10 5 68
11 6 64
12 6 67
13 6 67FIG. 19. Histogram of tensile modulus with normal distribution curve.
TABLE 4. Statistical analysis of tensile test results.
No. of
samples
tested
No. of
batches
Tensile modulus
Average
tensile
modulus (GPa)
Standard
deviation
(GPa)
Coefficient
of variation
(%)
13 6 66.9 3.8 5.7
70 POLYMER COMPOSITES—-2008 DOI 10.1002/pc

nuity and undulation, resin-rich areas between fiber bun-
dles, and the fraction of resin within the fiber bundles.
4. The investigated case studies in the present work reveal
very small differences (average 5%) between experi-
mental and analytical results.
ACKNOWLEDGMENTS
The authors acknowledge the support of the Boeing
Company and Cytec Engineered Materials for the present
research. They also acknowledge Mr. Barton Moenster,
Director Advanced Manufacturing R&D, Mr. Gregg Bogucki,
and Mr. John Griffith of the Boeing Company for their valu-
able discussions and encouragements.
REFERENCES
1. A. Khattab, PhD Dissertation, University of Missouri-Co-
lumbia (2005).
2. A.C. Loos, J. Sayer, R. McGrane, and B. Grimsley, Int.SAMPE Symp., 461 (2001).
3. T.A. Osswald, M. Esther, and S.-C. Tseng, Polym. Polym.Compos., 2, 3 (1994).
4. T.-W. Chou and T. Ishikawa, Textile Structural Composites,Elsevier, New York (1989).
5. M. Ito and T.-W. Chou, J. Compos. Mater., 32, 1 (1998).
6. H. Golestanian and A.S. El-Gizawy, J. Compos. Mater., 31,23 (1997).
7. B. Chen and T.-W. Chou, Compos. Sci. Technol., 60, 2223(2000).
8. Y.W. Kwon and A. Altekin, J. Compos. Mater., 36, 8 (2002).
9. N.K. Naik and R. Kuchibhotla, Compos. A, 33, 697 (2002).
10. R.M. Jones, Mechanics of Composite Materials, Taylor &
Francis, Philadelphia, PA (1999).
11. K. Kaw, Mechanics of Composite Materials, CRC Press,
New York (1997).
12. Product Data Sheet of Magnamite AS4 Carbon Fiber, Hexcel
Schwebel Company Website, www.Hexcel.com (2005).
13. C. Li, PhD Dissertation, Texas A&M University (2001).
14. A. Khattab and A.S. El-Gizawy, Transactions of the NAMRI/SME, Vol. 34, NAMRI/SME. The North American Manufac-
turing Research Institute (2006).
FIG. 20. Probability plot of tensile modulus with 95% confidence
interval.
DOI 10.1002/pc POLYMER COMPOSITES—-2008 71