analytical - abechem.comabechem.com/no. 11-2018/2018, 10(11), 1506-1524.pdf · anal. bioanal....
TRANSCRIPT

Anal. Bioanal. Electrochem., Vol. 10, No. 11, 2018,1506-1524
Full Paper
Inhibition of Mild Steel Corrosion in 1.0 M HCl by Water, Hexane and Ethanol Extracts of Pimpinella Anisum Plant
Zahra Akounach,1 Ahmaed Al Maofari,1,2 Adil El Yadini,1 Siham Douche,1 Mohamed Benmessaoud,3 Benaceur Ouaki,4 Mohamed Damej3,5 and Souad EL Hajjaji1,*
1Laboratory of Spectroscopy, Molecular Modelling Materials, Nanomaterials Water and Environment –CERNE2D, Faculty of Sciences, Mohammed V University, Morocco 2Laboratory of Physical Chemistry, Faculty of Education, Art and Sciences, Amran University, Yemen 3Environment, Materials and Sustainable Development Team –CERNE2D, High School of Technology, Mohammed V University, Morocco 4Engineering Material Department, National School of Mineral Industry, Rabat-Morocco 5Sevichim Society SARL Productions of Corrosion Inhibitors, 101 Maamoura Street, N° 10, Morocco
*Corresponding Author, Tel.: +212(0)66130310; Fax: +212 (0) 537775440
E-Mail: [email protected]
Received: 5 June 2018 / Received in revised form: 7 October 2018 / Accepted: 27 October 2018 / Published online: 30 November 2018
Abstract- Corrosion inhibition of mild steel in 1 M hydrochloric acid by water, hexane and ethanol extracts of Pimpinella Anisum plant were study using weight loss and Tafel polarization curves. The effects of temperature on the corrosion behavior of mild steel in 1M hydrochloric acid with addition of extracts were also studied. The inhibition efficiency (IE) increases with increasing concentration of Pimpinella Anisum extracts but decreases with increasing the temperature. The adsorption of the extracts on the surface of metal follows a Langmuir isotherm model. Polarization studies show that the extracts behave as mixed type inhibitors. Scanning Electron Microscopy with Energy Dispersive Spectroscopy (SEM-EDS) study confirmed that the inhibition of corrosion of mild steel is through adsorption of the extracts molecules on the surface of metal. Gas chromatography-mass spectroscopy (GC-MS) results showed that anethole was the major compound of both Yemeni and Moroccan Pimpinella Anisum plant.
Keywords- Anise extracts, Corrosion inhibition, Electrochemical, Weight loss, Mild steel
Analytical & Bioanalytical Electrochemistry
2018 by CEE
www.abechem.com

Anal. Bioanal. Electrochem., Vol. 10, No. 11, 2018, 1506-1524 1507
1. INTRODUCTION
Iron and its alloys have wide spread industrial and constructional applications due to their
availability and low cost but they are one of the most consumed metals. However, they are
highly sensitive to corrosion, particularly in the acid media [1-3].
The most effective method for protecting metals to fight against corrosion is the use of
inhibitors. Different organic compounds have been studied as inhibitors for the protection of
metals against corrosion [4-13]. The majority of corrosion inhibitors that are used in acidic
media are organic compounds containing electronegative atoms such as nitrogen, oxygen,
sulfur etc.., unsaturated bonds and/or aromatic rings. The inhibitory effect of the organic
compounds is due to the adsorption of the molecules, which are characterized by lone
electron pair and/or π electrons on the metal surface [14].
Recently, natural compounds increased in the development and use of low-cost and eco-
friendly products such as extracted compounds from leaves or seeds as corrosion inhibitors
for mild steel [15-34], the most components from plants that have noted as a corrosion
inhibitor are sugars, steroids, aloin, tannic acid, flavonoids, terpenes etc... and the formation
of the protective film on the surface of steel is improved during the presence of the polycyclic
compounds[35].
Pimpinella Anisum L. Umbelliferae is an annual herb and a grassy plant with white
flowers and small green to yellow seeds that grows in India, Egypt, Yemen, Morocco,
Turkey, and many other warm regions of the world. The essential oil from the seeds of P.
anisum contain anethole and it is valuable in perfumery and in medicine domains [36-41]. To
characterize the adsorbed layer and the interaction between adsorbed molecules, the
adsorption isotherms are used. The adsorption isotherms as Langmuir, Tempkin and Frumkin
are the most common models to study the mechanism of corrosion inhibition by determining
the surface coverage (θ) and the adsorption isotherms of inhibitor molecules in the corrosive
media [42-45].
The objective of this work was to study the corrosion inhibition of mild steel in a 1 M
HCl solution in the presence of water, ethanol and hexane extracts of anise as an inhibitor
respectful of the environment by open-circuit potential measurements, potentiodynamic
polarization curves and weight loss measurements. The inhibited metal surface state is
examined by scanning electron microscopy. This study aimed also to investigate the
temperature effects on mild steel corrosion in 1 M hydrochloric acid solution in the presence
and the absence of different concentration of water, hexane and ethanol extracts from Anise
seeds using a potentiodynamic polarisation method.
Anal. Bioanal. Electrochem., Vol. 10, No. 11, 2018, 1506-1524 1508
2. MATERIAL AND METHODS
2.1. Plant material
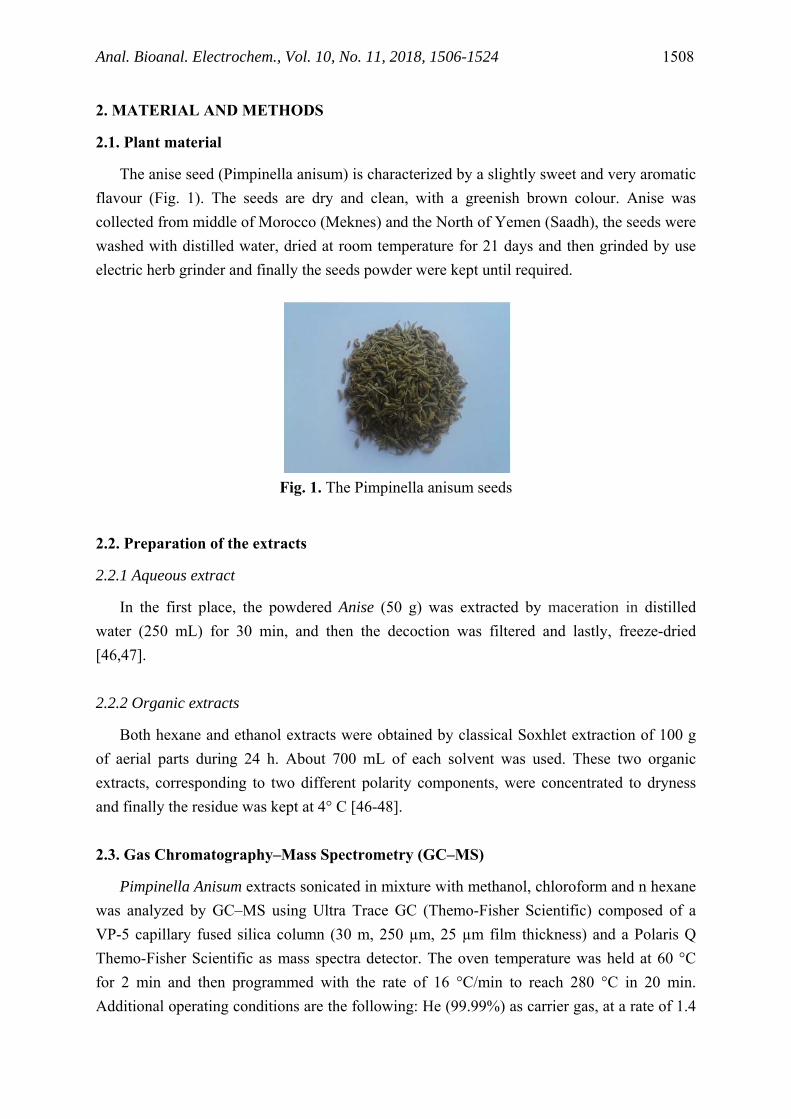
The anise seed (Pimpinella anisum) is characterized by a slightly sweet and very aromatic
flavour (Fig. 1). The seeds are dry and clean, with a greenish brown colour. Anise was
collected from middle of Morocco (Meknes) and the North of Yemen (Saadh), the seeds were
washed with distilled water, dried at room temperature for 21 days and then grinded by use
electric herb grinder and finally the seeds powder were kept until required.
Fig. 1. The Pimpinella anisum seeds
2.2. Preparation of the extracts
2.2.1 Aqueous extract
In the first place, the powdered Anise (50 g) was extracted by maceration in distilled
water (250 mL) for 30 min, and then the decoction was filtered and lastly, freeze-dried
[46,47].
2.2.2 Organic extracts
Both hexane and ethanol extracts were obtained by classical Soxhlet extraction of 100 g
of aerial parts during 24 h. About 700 mL of each solvent was used. These two organic
extracts, corresponding to two different polarity components, were concentrated to dryness
and finally the residue was kept at 4° C [46-48].
2.3. Gas Chromatography–Mass Spectrometry (GC–MS)
Pimpinella Anisum extracts sonicated in mixture with methanol, chloroform and n hexane
was analyzed by GC–MS using Ultra Trace GC (Themo-Fisher Scientific) composed of a
VP-5 capillary fused silica column (30 m, 250 µm, 25 µm film thickness) and a Polaris Q
Themo-Fisher Scientific as mass spectra detector. The oven temperature was held at 60 °C
for 2 min and then programmed with the rate of 16 °C/min to reach 280 °C in 20 min.
Additional operating conditions are the following: He (99.99%) as carrier gas, at a rate of 1.4

Anal. Bioanal. Electrochem., Vol. 10, No. 11, 2018, 1506-1524 1509
ml/min. The detector temperature and the injection temperature were, respectively, 300 °C
and 220 °C. The injection volume was 0,001 L with a split ratio of 1:25. EI/MS were taken at
70 eV IE. GC/MS analysis provides the mass spectra of the various constituents which are
then compared to those of the Wiley and NBS libraries [49] and those described by Adams
[50]. In addition, the relative concentrations of the components were calculated based on GC
peak areas without using correction factors.
2.4. Weight loss measurements
Mild steel specimens with the same composition used in the electrochemical
measurements with dimension of 0.1×1×1 cm were immersed in 100 mL of electrolyte with
and without optimal concentrations of Anise extract. The weights of the specimens before and
after immersion were detected by analytical balance (sensitivity ±0.0001 g). After one week
and everyday exposure, the specimens were taken out rinsed thoroughly with distilled water,
dried for one hour in electrical oven at 70 °C then cooled in desiccator (1 h) and weighted
again as quickly as possible. For each test, three parallel experiments were performed.
Weight loss permits calculation of the inhibition efficiency IE (%) of extracts anise according
to the following equation:
% 100
Where m0 and m are the weight before and after immersion, t is the immersion time, A is
the mild steel specimens Area and Wcorr, Winh are the corrosion rate of mild steel samples
obtained in 1mol/L hydrochloric acid solution without and with inhibitor, respectively.
2.5. Electrochemical measurements
Cylinder specimens from mild steel 0.1 cm in thickness with masses composition (%):
0.18 C, 0.04 P, 0.05 S, 0.30 Mn, trace Si, and the remainder iron (Fe) were prepared as
working electrodes. The electrodes were prepared by embedding steel rods in an epoxy resin
and exposing a surface area of 1 cm2 to the electrolyte. For all the experiments, the surface
pre-treatment was carried out with 400, 600, 1200 and 1500 grade emery paper, then the
metal surface was rinsed with distilled water ultrasonically degreased in absolute ethanol,
dried and finally dipped into the electrolytic cell.
The corrosive medium was 1 M hydrochloric acid prepared by dilution of analytical grade
HCl (37% wt) with bi-distilled water. All electrochemical measurements were conducted in a
thermostat conventional three electrode cylindrical glass cell, containing 100ml of corrosive
medium with a Platinumelectrode Pt (counter electrode) and Saturated Calomel Electrode
Anal. Bioanal. Electrochem., Vol. 10, No. 11, 2018, 1506-1524 1510
SCE (reference electrode). In order to minimize ohmic contribution, the SCE was placed
close to working electrode. In all experiments, the mild steel was allowed to maintain the
stability of the open circuit potential for 1 h. The Potentiodynamic curves of mild steel in 1M
HCl solution in the absence and in the presence of different extracts of Anis were obtained in
the potential range from -1 V to 0 V. For polarization measurements, a potentiostat Voltalab
301 PGZ monitored by a PC computer and Voltamaster 4.0 software were used to run the
tests, collect and evaluate the experimental data. During each experiment, the test solution
was mixed with a magnetic stirrer.
The inhibition efficiency (IE %) depends on the degree of coverage of the mild steel
surface by molecules of the inhibitor and can be calculated with the following equations:
% 100
Where is the surface coverage, and are, respectively, the corrosion current
densities obtained in hydrochloric acid 1M without and with the aqueous extract or the
organic extracts, determined by the intersection of the extrapolated cathodic Tafel lines at the
experimentally measured.
2.6. Scanning electron microscopy connected with Energy dispersive spectroscopy
The surface of mild steel specimens before and after immersion in the absence and the
presence of Anis extracts were studied using a Quanta 200 FEI Company scanning electron
microscope. The energy of the acceleration beam employed was 20 kV. The group is
equipped with a system complete of microanalyses X (detector EDS) and with a detector of
back-scattered electrons. This EDS technique allows to given the chemical composition of
the sample with a very low limit of detection going up to the Boron.
3. RESULTS AND DISCUSSION
3.1. Extracts analysis
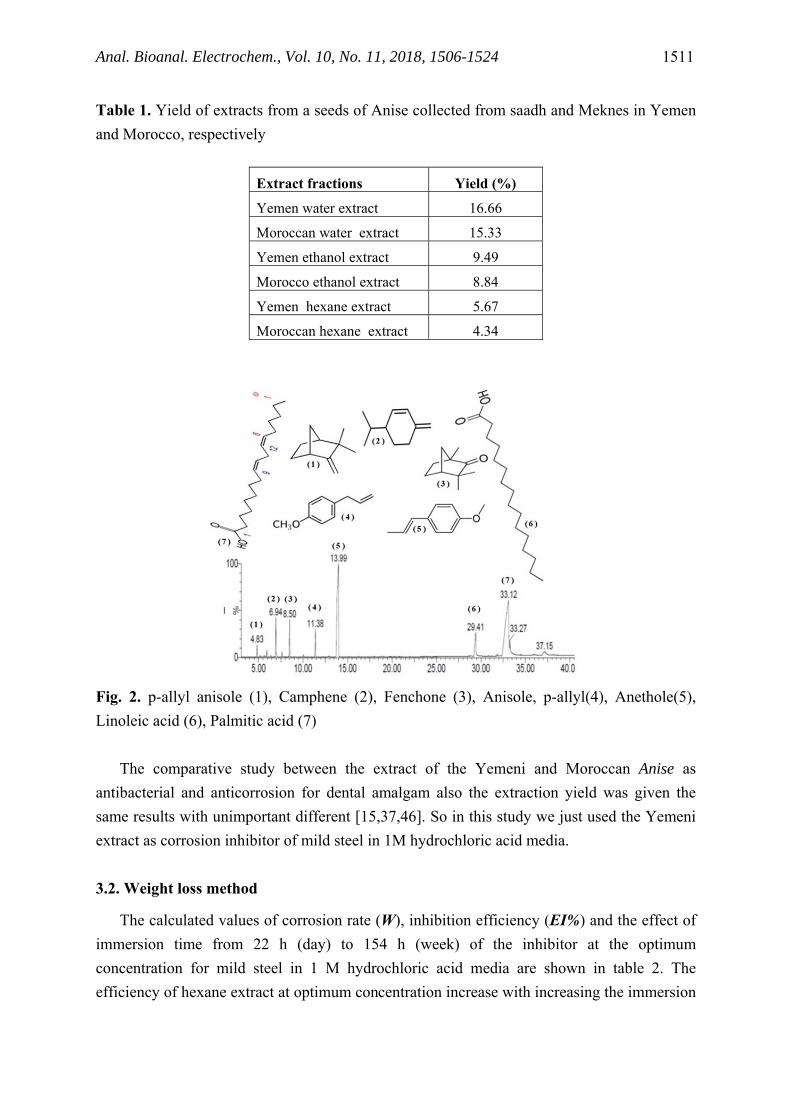
The extracts that obtained by soxlhet from Yemeni and Moroccan Anise seeds are a green
colour at room temperature. The Anise extractions with different solvents have shown that the
best efficiency is with water and then with ethanol. As described in Table 1. GC/MS is used
to determine the different composition of the aqueous extract and the organic extracts. The
structures of the major compounds are shown in the chromatogram Fig. 2.
Anal. Bioanal. Electrochem., Vol. 10, No. 11, 2018, 1506-1524 1511
Table 1. Yield of extracts from a seeds of Anise collected from saadh and Meknes in Yemen
and Morocco, respectively
Fig. 2. p-allyl anisole (1), Camphene (2), Fenchone (3), Anisole, p-allyl(4), Anethole(5),
Linoleic acid (6), Palmitic acid (7)
The comparative study between the extract of the Yemeni and Moroccan Anise as
antibacterial and anticorrosion for dental amalgam also the extraction yield was given the
same results with unimportant different [15,37,46]. So in this study we just used the Yemeni
extract as corrosion inhibitor of mild steel in 1M hydrochloric acid media.
3.2. Weight loss method
The calculated values of corrosion rate (W), inhibition efficiency (EI%) and the effect of
immersion time from 22 h (day) to 154 h (week) of the inhibitor at the optimum
concentration for mild steel in 1 M hydrochloric acid media are shown in table 2. The
efficiency of hexane extract at optimum concentration increase with increasing the immersion
Extract fractions Yield (%)
Yemen water extract 16.66
Moroccan water extract 15.33
Yemen ethanol extract 9.49
Morocco ethanol extract 8.84
Yemen hexane extract 5.67
Moroccan hexane extract 4.34

Anal. Bioanal. Electrochem., Vol. 10, No. 11, 2018, 1506-1524 1512
time indicates the adsorption of the inhibitor molecules on the metal surface. For both water
and ethanol extract the efficiency decrease with increasing the immersion time indicates
desorption of the inhibitor from the metal surface. The maximum inhibition efficiency of
hexane, ethanol and water extract at room temperature was 78.5% after 154 h, 88.9% and
80.2% after 22h respectively.
Table 2. Effect of immersion time on the corrosion of mild steel in 1 M hydrochloric acid
with different extracts of Anise at optimal concentration
Inhibitor t (h) Blank Hexane extract Ethanol extract Water extract
Area (cm²) - 2.80 2.60 2.80 2.80
Wig
ht
loss
(g)
22 0.0243 0.011 0.0027 0.0048
44 0.0368 0.0127 0.0056 0.0094
66 0.045 0.0148 0.0087 0.0124
88 0.0531 0.0161 0.0126 0.0184
110 0.0666 0.017 0.0165 0.0256
132 0.0814 0.0182 0.0207 0.0291
154 0.0989 0.0197 0.0233 0.0329
Cor
rosi
on r
ate(
W)
22 3.94×10⁻⁴ 1.92×10⁻⁴ 4.38×10⁻⁵ 7.79×10⁻⁵
44 2.98×10⁻⁴ 1.11×10⁻⁴ 4.54×10⁻⁵ 7.63×10⁻⁵
66 2.43×10⁻⁴ 8.62×10⁻⁵ 4.70×10⁻⁵ 6.71×10⁻⁵
88 2.15×10⁻⁴ 7.03×10⁻⁵ 5.11×10⁻⁵ 7.46×10⁻⁵
110 2.16×10⁻⁴ 5.94×10⁻⁵ 5.35×10⁻⁵ 8.31×10⁻⁵
132 2.20×10⁻⁴ 5.30×10⁻⁵ 5.60×10⁻⁵ 7.87×10⁻⁵
154 2.29×10⁻⁴ 4.92×10⁻⁵ 5.40×10⁻⁵ 7.63×10⁻⁵
Eff
icie
ncy
(E
I %
)
22 - 51.3 88.9 80.2
44 - 62.8 84.8 74.5
66 - 64.6 80.7 72.4
88 - 67.3 76.3 65.3
110 - 72.5 75.2 61.6
132 - 75.9 74.5 64.3
154 - 78.5 76.4 66.7
3.3. Open circuit potential
Figs. 3, 4 and 5 show the evolution of the open circuit potential E=f (t) of the mild steel in
a 1 M HCl acid medium at room temperature, in the absence and in the presence of different
concentrations of three extracts, during 60 min of immersion. According to obtained results,

Anal. Bioanal. Electrochem., Vol. 10, No. 11, 2018, 1506-1524 1513
potential decrease with increasing inhibitor concentration, the presence of the extracts in the
solution led to shift of the curve to the negative potential direction, indicating that the
cathodic corrosion is affected by the inhibitors and the value of Ecorr varies little over time.
0 10 20 30 40 50 60-0.48
-0.47
-0.46
-0.45
-0.44
-0.43
-0.42
-0.41
-0.40
Water Extract Blank 0.6 g 0.8 g 1 g 1.2 g
E(V
/EC
S)
Time (min)
Fig. 3. Evolution of the open circuit potential (OCP) vs. exposure time for mild steel in 1 M
HCl solution in the absence and in the presence of water extrac
0 10 20 30 40 50 60-0.48
-0.47
-0.46
-0.45
-0.44
-0.43
-0.42
-0.41
Ethanol Extract
Blank 0.6 g 0.8 g 1 g 1.2 g
E(V
/EC
S)
Time (min)
Fig. 4. Evolution of the open circuit potential (OCP) vs. exposure time for mild steel in 1 M
HCl solution in the absence and in the presence of ethanol extract

Anal. Bioanal. Electrochem., Vol. 10, No. 11, 2018, 1506-1524 1514
0 10 20 30 40 50 60-0.46
-0.45
-0.44
-0.43
Hexan Extract
Blank 0.6 g 0.8 g 1 g 1.2 g
E(V
/EC
S)
Time (min)
Fig. 5. Evolution of the open circuit potential (OCP) vs. exposure time for mild steel in 1 M
HCl solution in the absence and in the presence of hexane extract
3.4. Potentiodynamic polarization
Polarization curves of mild steel in 1 M HCl solution without and with different
concentration of water, ethanol and hexane extracts are shown in Fig. 6, 7, and 8 respectively
-1.0 -0.8 -0.6 -0.4 -0.2 0.01E-7
1E-6
1E-5
1E-4
1E-3
0.01
0.1
1
Water Extract
I (A
/cm
2 )
Potential (V/SCE)
Blank 0.6 g 0.8 g 1 g 1.2 g
Fig. 6. Polarization curves of mild steel in 1 M HCl solution without and with various
concentrations of water extract

Anal. Bioanal. Electrochem., Vol. 10, No. 11, 2018, 1506-1524 1515
-1.0 -0.8 -0.6 -0.4 -0.2 0.01E-7
1E-6
1E-5
1E-4
1E-3
0.01
0.1
1
Ethanol Extract
I (A
/cm
2 )
Potential (V/SCE)
Blank 0.6 g 0.8 g 1 g 1.2 g
Fig. 7. Polarization curves of mild steel in 1 M hydrochloric acid with and without different
concentration of ethanol extract
-1.0 -0.8 -0.6 -0.4 -0.2 0.01E-7
1E-6
1E-5
1E-4
1E-3
0.01
0.1
1
Hexan Extract
I (A
/cm
2 )
Potential (V/SCE)
Blank 0.6 g 0.8 g 1 g 1.2 g
Fig. 8. Polarization curves of mild steel in 1 M hydrochloric acid with and without different
concentration of hexane extract
The values of the electrochemical parameters for different concentrations of water,
ethanol and hexane extracts of Anise seeds are given in the Table 3. The data show that the
corrosion current density decreases (Icorr) for all extracts by increasing their concentration
and therefore the inhibition efficiency increases. The presence of different extracts resulted in
a shift of the corrosion potential (Ecorr) toward more negative values between 11-42
mVcathodically compared to the blank and also modification in anodic and cathodic Tafel
slopes were observed. An inhibitor can be categorized as cathodic or anodic type if the
displacement in the Ecorr is exceeds 85 mV with respect to corrosion potential of the blank

Anal. Bioanal. Electrochem., Vol. 10, No. 11, 2018, 1506-1524 1516
[51]. From the obtained results in the present study, it is pertinent to say that different Anise
extracts acts as mixed-type inhibitor with predominant cathodic effectiveness.
Table 3. Electrochemical parameters obtained from the Tafel plots of mild steel in
hydrochloric acid at various concentrations of water, ethanol and hexane extracts
Extracts C (g/L) Ecorr mV (SCE) Icorr (mA cm-2) θ E (%)
Blank -438 3.6 - -
Water extract
0.6 -438 1.1 0.6944 69.44
0.8 -438 0.57 0.8417 84.17
1 -438 0.24 0.9333 93.33
1.2 -470 0.17 0.9528 95.28
Ethanol extract
0.6 -448 0.68 0.8111 81.11
0.8 -448 0.41 0.8861 88.61
1 -448 0.28 0.9222 92.22
1.2 -478 0.19 0.9472 94.72
Hexane extract
0.6 -440 0.64 0.8222 82.22
0.8 -440 0.35 0.900 90.20
1 -440 0.21 0.939 94.16
1.2 -446 0.16 0.954 95.55
3.5. Adsorption isotherm
The interaction information between water, ethanol and hexane extract of Anise and the
mild steel surface can be provided by adsorption isotherm. The values of θ for different
concentrations of the extract obtained from Potentiodynamic polarization were evaluated.
Attempts were made to fit θ values to divers’ isotherms including Temkin, Langmuir and
Frumkin, the correlation coefficient (R2) was used to choose the most suitable isotherm. The
Langmuir isotherm equation is given by:
1
Where, k is the adsorption constant. This suggests that the adsorption of all extract on
mild steel surface followed the Langmuir adsorption isotherm [52-54] (Fig. 9).

Anal. Bioanal. Electrochem., Vol. 10, No. 11, 2018, 1506-1524 1517
Fig. 9. Langmuir adsorption isotherm of water, ethanol and hexane extract on the mild steel
surface in 1M hydrochloric acid
The values of ∆ were calculated using this equation:
K1
55.5e
∆
Where ∆ is the standard free energy of adsorption (kJ.mol-1) and 55.5 is the value of
concentration of water in the solution (mol/L) [55]. Adsorption parameters of green inhibitor
for mild steel corrosion in 1MHCl medium were shown in the table 4. The negative sign of
∆ suggests that the process adsorption of aqueous extract and organic extracts onto the
metal surface is spontaneous. It is well known that values of ∆ on the order of −20
kJ/mol or lower indicate a physical adsorption, while that of −40 kJ/mol or higher involve
charge sharing or a transfer of electrons to from a co-ordinate indicate chemisorption [56-58].
Table 4. The adsorption constant values for the different extracts
The obtained value of ∆ suggests a physical adsorption of water, ethanol and
hexane extract of Anise components onto the mild steel surface in hydrochloric acid media.
This adsorption gives rise to a large covered surface area with a very small amount of
adsorbed molecules. Therefore, high inhibition efficiency could be achieved by low
Extract type R2 K (L/g) ∆ (kj.mol-1)
Water extract 0.9701 2.232 -13.43
Ethanol extract 0.9993 4.878 -11.72
Hexane extract 0.9977 5.025 -12.21

Anal. Bioanal. Electrochem., Vol. 10, No. 11, 2018, 1506-1524 1518
concentrations of the extract. At the same time, the increase of extract concentration above a
certain value has a little effect on the inhibition efficiency. This conclusion is confirmed by
the fact that the inhibition efficiency does not increase linearly with extract concentration, as
shown in Fig. 10.
Fig. 10. The effect of extract concentration on the inhibition efficiency
3.6. Temperature effect
Temperature influence on the corrosion of mild steel with and without optimum
concentration of water, ethanol and hexane extracts of Anise in one molar hydrochloric acid
media was studied at temperature range of 25–55 ◦C using polarization measurement. Results
obtained show that corrosion rate increased with increasingin the temperature with and
without the extracts of Anise while inhibition efficiency decreased with increasing the
temperature The values of activation energies (Ea) of mild steel in 1 mol/l HCl corrosion
were calculated from the equation of Arrhenius[59]:
lnI lnAERT
Where Ea is the activation energy, R is the gas constant, A is the Arrhenius factor, T is the
temperature and Icor the corrosion courant. The plots of (lnIcorr) against 1/T of mild steel in
1M HCl solution without and with the extracts of Anise are shown in Fig. 11.

Anal. Bioanal. Electrochem., Vol. 10, No. 11, 2018, 1506-1524 1519
Fig. 11. Arrhenius plots of (lnIcorr) versus 1/T of mild steel in one molar of hydrochloric
acid media
The values of Ea for mild steel in one molar hydrochloric acid media with and without the
optimum concentration of Anise extracts were calculated from the dependence of corrosion
current logarithm (lnIcorr) on the reciprocal of absolute temperature (1/T) and shown in the
Table 5.
Table 5. Thermodynamic parameters for adsorption optimum concentration of Anise extracts
on mild steel surface in one molar of hydrochloric acid media
The enthalpy activation (∆ ° ) and the entropy activation (∆ ° ) for the mild steel
corrosion in one molar of hydrochloric acid media were obtained by using the following
equation [56]:
lnIT
lnRNh
∆S°
R∆H°
RT
Where h is the Planck’s constant and N is the Avogadro’s number. The dependence of
corrosion current logarithm divided into the temperature according to absolute
Extract types Ea (kJ.mol-1) R² H a0 (kJ.mol-1)∆ Sa0 (J.mol-1)∆ Ea - ∆Ha
0 R²
Blank 22.94 0.967 20.30 -125.19 2.64 0.994
Water extract 62.92 0.929 60.33 -123.17 2.60 0.923
Ethanol
extract
85.69 0.989 83.08 -51.51 2.61 0.988
Hexane
extract
51.33 0.931 48.74 -164.51 2.60 0.924
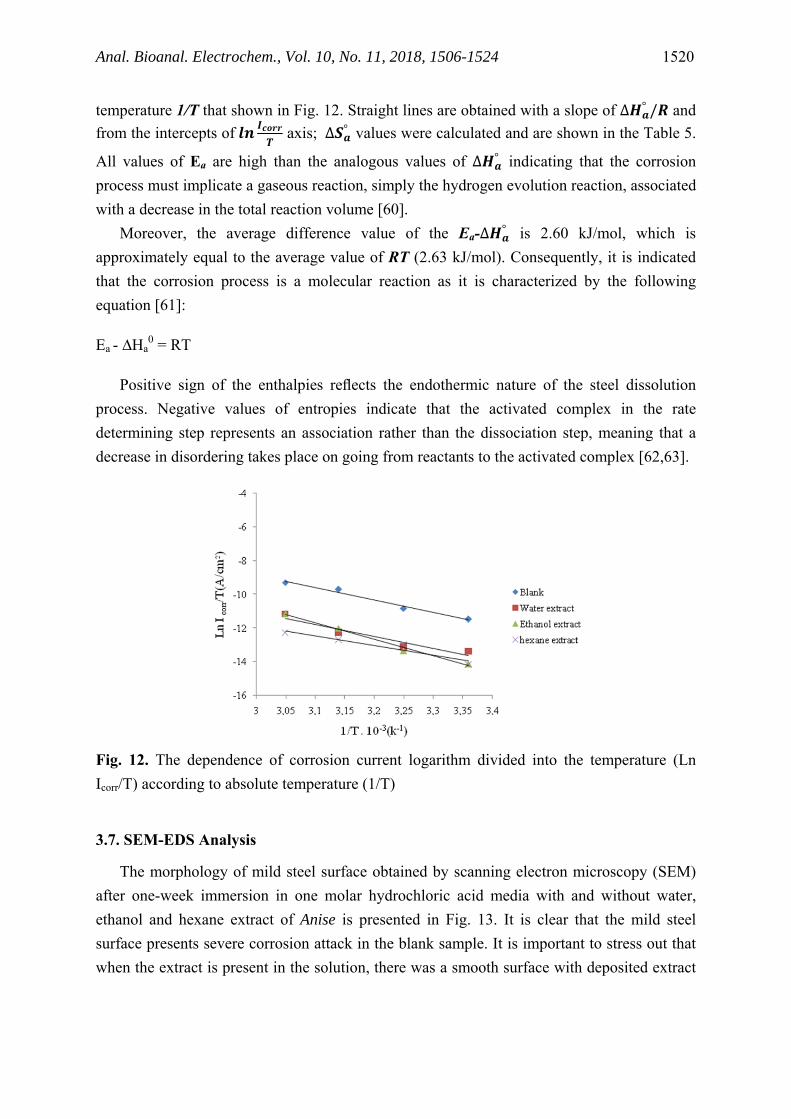
Anal. Bioanal. Electrochem., Vol. 10, No. 11, 2018, 1506-1524 1520
temperature 1/T that shown in Fig. 12. Straight lines are obtained with a slope of ∆ ° / and
from the intercepts of axis; ∆ ° values were calculated and are shown in the Table 5.
All values of Ea are high than the analogous values of ∆ ° indicating that the corrosion
process must implicate a gaseous reaction, simply the hydrogen evolution reaction, associated
with a decrease in the total reaction volume [60].
Moreover, the average difference value of the Ea-∆ ° is 2.60 kJ/mol, which is
approximately equal to the average value of RT (2.63 kJ/mol). Consequently, it is indicated
that the corrosion process is a molecular reaction as it is characterized by the following
equation [61]:
Ea - ∆Ha0 = RT
Positive sign of the enthalpies reflects the endothermic nature of the steel dissolution
process. Negative values of entropies indicate that the activated complex in the rate
determining step represents an association rather than the dissociation step, meaning that a
decrease in disordering takes place on going from reactants to the activated complex [62,63].
Fig. 12. The dependence of corrosion current logarithm divided into the temperature (Ln
Icorr/T) according to absolute temperature (1/T)
3.7. SEM-EDS Analysis
The morphology of mild steel surface obtained by scanning electron microscopy (SEM)
after one-week immersion in one molar hydrochloric acid media with and without water,
ethanol and hexane extract of Anise is presented in Fig. 13. It is clear that the mild steel
surface presents severe corrosion attack in the blank sample. It is important to stress out that
when the extract is present in the solution, there was a smooth surface with deposited extract

Anal. Bioanal. Electrochem., Vol. 10, No. 11, 2018, 1506-1524 1521
on it [64]. This result confirms that the extract of Anise inhibited corrosion of mild steel by
adsorption of the molecules on metal surface.
Fig. 13. The morphology of mild steel in one molar hydrochloric acid media: without
inhibitor (a); with water extract (b) with ethanol extract(c); with hexane extract(d)
4. CONCLUSION
Pimpinella Anisum extracts can be used as a good, effective, naturally derived and
environmentally friendly corrosion inhibitor for mild steel in hydrochloric acid media. The
inhibition efficiency IE increased with increasing the concentration of the extracts but
decreased with the increase of the temperature. The electrochemical study shows that the
Anise extract is a mixed inhibitor. Corrosion inhibition is linked to adsorption of the extracts
components onto mild steel surface, following a Langmuir adsorption isotherm for both Anise
seeds extracts. The values of thermodynamic parameters indicate that the adsorption of Anise
seeds extracts is a physical adsorption. SEM-EDS Analysis confirms that the extract of Anise
(a) (b)
(c) (d)

Anal. Bioanal. Electrochem., Vol. 10, No. 11, 2018, 1506-1524 1522
inhibited corrosion of mild steel through adsorption of the inhibitor molecules on metal
surface.
REFERENCES
[1] G. Ji, S. Anjum, S. Sundaram, and R. Prakash, Corros. Sci. 90 (2015) 107.
[2] S. A. Umoren, I. B. Obot, A. U. Israel, P. O. Asuquo, M. M. Solomon, U. M. Eduok, A.
and P. Udoh, Ind. Eng. Chem. Res. 20 (2014) 3612.
[3] K. Azzaoui, E. Mejdoubi, S. Jodeh, A. Lamhamdi, E. R. Castellón, M. Algarra, A.
Zarrouk, A. Errich, R. Salghi, and H. Lgaz, Corros. Sci. 129 (2017) 70.
[4] F. E. Heakal, A. S. Fouda, and M. S. Radwan, Mater. Chem. Phys. 125 (2011) 26.
[5] N. K. Gupta, M. A. Quraishi, P. Singh, V. Srivastava, K. Srivastava, C. Verma, and A.
K. Mukherjee, Anal. Bioanal. Electrochem. 9 (2017) 245.
[6] F. Suedile, F. Robert, C. Roos, and M. Lebrini, Electrochim. Acta 133 (2014) 631.
[7] A. Al Maofari, G. Ezznaydy, Y. Idouli, F. Guédira, S. Zaydoun, N. Labjar, and S. El
Hajjaji, Mater. Environ. Sci. 5 (2014) 2081.
[8] M. E. Belghiti, Y. Karzazi, A. Dafali, I. B. Obot, E. E. Ebenso, K. M. Emran, I.
Bahadur, B. Hammouti, and F. Bentiss, Mol. Liq. 216 (2016) 874.
[9] A. Lgamri, H. Abou El Makarim, A. Guenbour, A. Ben Bachir, L. Aries, and S. El
Hajjaji, Prog. Org. Coat. 48 (2003) 63.
[10] Y. Ji, B. Xu, W. Gong, X. Zhang, X. Jin, W. Ning, Y. Meng, W. Yang, and Y. Chen,
Taiwan Inst. chem. Eng. 66 (2016) 301.
[11] O. O. Joseph, O. S. I. Fayomi, O. O. Joseph, and O. A. Adenigba, Energy Procedia 119
(2017) 845.
[12] C. M. Reddy, B. D. Sanketi, and S. N. Kumar, Perspectives in Sci. 8 (2016) 603.
[13] P. Parthipan, J. Narenkumar, P. Elumalai, P. S. Preethi, A. U. R. Nanthini, A. Agrawal,
and A. Rajasekar, Mol. Liq. 240 (2017) 121.
[14] D. Bouknana, B. Hammouti, S. Jodeh, M. Sbaa, and H. Lgaz, Anal. Bioanal.
Electrochem. 10 (2018) 751.
[15] H. Saufi, A. Al Maofari, A. El Yadini, L. Eddaif, H. Harhar, S. Gharby, and S. El
Hajjaji, Mater. Environ. Sci. 6 (2015) 1845.
[16] A. Al Maofari, M. Mousaddak, A. Hakiki, Y. Suleiman, S. Gamouh, S. Zaydoun, and S.
El Hajjaji. Chem. Technol.: Indian J. 6 (2011) 73.
[17] O. K. Abiola, and A.O. James, Corros. Sci 52 (2010) 661.
[18] L. Afia, R. Salghi, L. Bammou, E. Bazzi, B. Hammouti, L. Bazzi, and A. Bouyanzer,
Saudi. Chem. Soc. 18 (2014) 19.
[19] M. Faustin, M. Lebrini, F. Robert, and C. Roos, Int. J. Electrochem. Sci. 6 (2011) 4095.
[20] S. A. Umoren, U. M. Eduok, M. M. Solomon, and A. P. Udoh, Arab. J. Chem. 9 (2016)
S209.
Anal. Bioanal. Electrochem., Vol. 10, No. 11, 2018, 1506-1524 1523
[21] G. Aziate, A. El Yadini, H. Saufi, A. Al Maofari, A. Benhmama, H. Harhar, S. Gharby,
and S. El Hajjaji, J. Mater. Environ. Sci. 6 (2015) 1877.
[22] A. Y. El-Etre, Mater. Chem. Phys. 108 (2008) 278.
[23] A. Benabida, M. Galai, M. Cherkaoui, and O. Dagdag , Anal. Bioanal. Electrochem. 8
(2016) 962.
[24] E. A. Noor, Mater. Chem. Phys. 131 (2011) 160.
[25] S. Deng, and X. Li, Corros. Sci. 55 (2012) 407.
[26] S. S. A. A. Pereira, M. M. Pegas, T. L. Fernandez, M. Magalhaes, T. G. Schontag, D. C.
Lago, L. F. Senna, and E. Elia, Corros Sci 65 (2012) 360.
[27] S. A. Umoren, I. B. Obot, A. U. Israel, P. O. Asuquo, M. M. Solomon, U. M. Eduok, A.
and P. Udoh, Ind. Eng. Chem. Res. 20 (2014) 3612.
[28] E. Q. Jasim, M. A. Mohammed-Ali, and A. A. Hussain, Chem. Mater. Res. 7 (2015)
147.
[29] K. K. Anupama, K. Ramya,and A. Joseph, J. Meas. 95 (2017) 297.
[30] A. A. M. Hassan, and H. T. M. Abdel-Fatah, Int. J. Electrochem. Sci. 11 (2016) 6959.
[31] E. Baran, A. Cakir, and B. Yazici. Arabian J. Chem. (2016) (in press).
[32] E. Ituen, A. James, O. Akaranta, and S. Sun, Chin. J. Chem. Eng. 24 (2016) 1442.
[33] Q. Hu, Y. Qiu, G. Zhang, and X. Guo, Chin. J. Chem. Eng 23 (2015) 1408.
[34] D. Bouknana, B. Hammouti, S. Jodeh, M. Sbaa, and H. Lgaz, Anal. Bioanal.
Electrochem. 10 (2018) 751.
[35] A. Fattah-alhosseini, and M. Noori, Anal. Bioanal. Electrochem. 8 (2016) 145.
[36] M. H. Boskabady, and M. Ramazani-Assari, J. Ethnopharmacol. 74 (2001) 83.
[37] A. Shokri, T. Hatami, and M. Khamforoush, J. Supercrit. Fluids. 58 (2011) 49.
[38] H. S. A. A. Mohamed, W. S. Abdelgadir, and A. Z. I. Almagboul, Int. J. Adv. Res. 3
(2015) 359.
[39] A. AL Maofari, S. EL Hajjaji, A. Debbab, S. Zaydoun, B. Ouaki, R. Charof, Z.
Mennane, A. Hakiki, and M. Mosaddak, Food Industry 14 (2013) 11.
[40] R. Hänsel, O. Sticher, and E. Steinegger, Pharmakognoisie-Phytopharmzie, 6th ed,
Springer-Verlag, Berlin (1999) 692.
[41] E. L. Ponte, P. L.Sousa, M. V. Rocha, P. M. Soares, A. N.Coelhode-Souza, J. H. Leal-
Cardoso, and A. M. Assreuy, Pharmacol. Rep. 64 (2012) 984.
[42] A.Y. El-Etre, Mater. Chem. Phys. 108 (2008) 278.
[43] L. Kadiri, M. Galai, M. Ouakki, Y. Essaadaoui, A. Ouass, M. Cherkaoui, E. Rifi, and A.
Lebkiri. Anal. Bioanal. Electrochem. 10 (2018) 249.
[44] M. N. H. Moussa, A. A. El-Far, and A. A. El-Shafei, Mater. Chem. Phys. 105 (2007)
105.
[45] E. E. Oguzie, Corros. Sci. 49 (2007) 1527.

Anal. Bioanal. Electrochem., Vol. 10, No. 11, 2018, 1506-1524 1524
[46] A. AL Maofari, S. EL Hajjaji, S. Zaydoun, B. Ouaki, R. Charof, Z. Mennane, A.
Hakiki, and M. Mosaddak, Int. J. Eng. Technol. 15 (2015) 34.
[47] N. Hayder, A. Abdelwahed, S. Kilani, R. Ben Ammar, A. Mahmoud, K. Ghedira, and
L. C. Ghedira, Mutat. Res. Genet. Toxicol. Environ. Mutagen. 564 (2004) 89.
[48] H. Najjaa, M. Neffati, S. Zouari, and E. Ammar, C. R. Chim. 10 (2007) 820.
[49] E. Guenther, the Essential Oil, Van Nostrand Company Inc, NewYork 3 (1949).
[50] Y. Massada, Analysis of essential oil by gas chromatography and spectrometry, John
Wiley and Sons, NewYork (1976).
[51] W. Li, Q. He, S. Zhang, C. Pei, and B. Hou, Appl. Electrochem. 38 (2008) 289.
[52] O. K. Abiola, and Y. Tobun, Chin. Chem. Lett. 21 (2010) 1449.
[53] A. Ostovari, S. M. Hoseinieh, M. Peikari, S. R. Shadizadeh, and S. J. Hashemi. Corros.
Sci. 51 (2009) 1935.
[54] O. K. Abiola, and J. O. E. Otaigbe, Corros. Sci. 51 (2009) 2790.
[55] S. A. Umoren, I. B. Obot, A. U. Israel, P. O. Asuquo, M. M. Solomon, U. M. Eduok,
A. and P. Udoh, Ind. Eng. Chem. Res. 20 (2014) 3612.
[56] A. Ghazoui, N. Benchat, F. El-Hajjaji, M. Taleb, Z. Rais, R. Saddik, A. Elaatiaoui, B.
Hammout, Alloys. Compd. 693 (2017) 510.
[57] M. H. Hussin, and M. J. Kassim, Mater. Chem. Phys. 125 (2011) 461.
[58] T. K. Chaitra, K. N. Mohana, D. M. Gurudatt, and H. C. Tandon, Taiwan Inst.
Chem. Eng. 67 (2016) 521.
[59] I. N. Putilova, S. A. Balezin, V. P. Barannik, Metallic Corrosion Inhibitors, Pergamon
Press, NewYork (1960) 31.
[60] E. A. Noor, Int. J. Electrochem. Sci. 2 (2007) 996.
[61] K. J. Laidler, Reaction kinetics, first ed. Pergamon Press, NewYork ,vol. 1, (1963).
[62] S. Martinez, and I. Stern, Appl. Surf. Sci. 83 (2002) 199.
[63] J. Marsh, Advanced Organic Chemistry, third ed. Wiley Eastern, New Delhi (1988).
[64] X. Sheng, Y. Ting, and S. O. Pehkaonen, Ind. Eng. Chem. Res. 46 (2007) 7117.
Copyright © 2018 by CEE (Center of Excellence in Electrochemistry)
ANALYTICAL & BIOANALYTICAL ELECTROCHEMISTRY (http://www.abechem.com)
Reproduction is permitted for noncommercial purposes.