analytic framework - commission for environmental cooperation · the framework at a glance .....vii...
TRANSCRIPT

Analytic Frameworkfor Assessing theEnvironmental Effects of theNorth AmericanFree Trade Agreement
Commission forEnvironmental Cooperation

This publication was prepared by the Secretariat of the Commission for Environmental Cooperation(CEC). It is the seventh in the Environment and Trade Series. The other titles in this Series are:
1 NAFTA Effects — A Survey of Recent Attempts to Model the Environmental Effects of Trade:An Overview and Selected Sources
2 NAFTA Effects — Potential NAFTA Environmental Effects: Claims and Arguments, 1991-19943 Dispute Avoidance: Weighing the Values of Trade and the Environment Under the NAFTA and the
NAAEC4 Building a Framework for Assessing NAFTA Environmental Effects: Report of a Workshop held
in La Jolla, California, on April 29 and 30, 19965 NAFTA’s Institutions: The Environmental Potential and Performance of the NAFTA Free Trade
Commission and Related Bodies6 Assessing Environmental Effects of the North American Free Trade (NAFTA): An Analytic
Framework (Phase II) and Issue Studies
The views contained herein do not necessarily reflect the views of the governments of Canada, Mexico orthe United States of America.
Reproduction of this document in whole or in part and in any form for educational or nonprofit purposesmay be made without special permission from the CEC Secretariat, provided acknowledgement of thesource is made. The CEC would appreciate receiving a copy of any publication or material that uses thisdocument as a source.
Published by the Communications Department of the CEC Secretariat.
For more information about this or other publications from the CEC, contact:
Commission for Environmental Cooperation393, rue St-Jacques Ouest, bureau 200Montréal (Québec) Canada H2Y 1N9
Tel: (514) 350-4300 • Fax: (514) 350-4314
http://www.cec.org
© Commission for Environmental Cooperation, 1999
Disponible en français–Disponible en español

Analytic Framework for Assessing the Environmental Effects of NAFTA
i
Table of Contents
Foreword....................................................................................................................................... iii
Acknowledgments ......................................................................................................................... v
The Framework at a Glance ...................................................................................................... vii
Part I: Analytic Framework for Assessing the Environmental Effects of the North AmericanFree Trade Agreement.................................................................................................. 1
I. Introduction to Framework Analysis ............................................................................2
A. Major Hypotheses to Focus the Analysis ...........................................................................................3B. Applying the Framework Analysis ......................................................................................................5
II. The Broader Context...................................................................................................7
III. The NAFTA Connection .............................................................................................7
A. NAFTA Rule Changes............................................................................................................................8B. NAFTA’s Institutions.............................................................................................................................9C. Trade Flows............................................................................................................................................10D. Transborder Investment Flows...........................................................................................................11E. Other Economic Conditioning Factors............................................................................................13
IV. Linkages to the Environment ..................................................................................... 13
A. Production, Management and Technology .....................................................................................13B. Physical Infrastructure ........................................................................................................................14C. Social Organization..............................................................................................................................15D. Government Policy................................................................................................................................16
V. Indicators of Environmental Impacts Stemming from NAFTA .................................... 18
A. Air Indicators.........................................................................................................................................18B. Water Indicators....................................................................................................................................20C. Land Indicators .....................................................................................................................................21D. Biodiversity Indicators .........................................................................................................................21E. Aggregate Indicators............................................................................................................................22
VI. Conclusion ............................................................................................................... 24
Part II: User’s Guide to the Final Analytic Framework ....................................................... 25
I. Methodological Issues .............................................................................................. 27
A. Level of Application in the Analysis..................................................................................................28B. Modeling .................................................................................................................................................30
II. Empirical Background............................................................................................... 37
A. The Broader Context ............................................................................................................................37III. The NAFTA Connection ........................................................................................... 39
A. NAFTA Rule Changes..........................................................................................................................40

Analytic Framework for Assessing the Environmental Effects of NAFTA
ii
B. NAFTA’s Institutions...........................................................................................................................42C. Trade Flows............................................................................................................................................45D. Transborder Investment Flows...........................................................................................................50E. Other Economic Conditioning Factors............................................................................................57
IV. Linkages to the Environment ..................................................................................... 59
A. Production, Management and Technology .....................................................................................59B. Physical Infrastructure ........................................................................................................................65C. Social Organization..............................................................................................................................69D. Government Policy................................................................................................................................73
V. Indicators of Environmental Impacts Stemming from NAFTA .................................... 77
A. Air indicators ........................................................................................................................................79B. Water Indicators....................................................................................................................................88C. Land Indicators .....................................................................................................................................91D. Biodiversity Indicators .........................................................................................................................93E. Aggregate Indicators............................................................................................................................95F. Selection Criteria for Sector-Specific Indicators ........................................................................ 100
Appendix: Foreign Direct Investment Trends under NAFTA......................................... 103
References.................................................................................................................................. 122

Analytic Framework for Assessing the Environmental Effects of NAFTA
iii
Foreword
The North American Agreement on Environmental Cooperation (NAAEC) [Article10(6)(d)],directs the Commission for Environmental Cooperation (CEC), to consider on an ongoing basisthe environmental effects of the North American Free Trade Agreement (NAFTA). A NAFTAEffects Project Team was assembled to assist the CEC in designing a methodology to fulfill thismandate. The following Analytic Framework is the culmination of the collective work of theseNorth American experts over the course of four years.
This Analytic Framework has been developed in three distinct phases. In Phase I (1995–1996),an interdisciplinary group of experts undertook research to explore the trade and investmentregime that NAFTA put in place, and the ways that NAFTA-associated economic change mightrelate to the environment, in order to develop the preliminary analytical approach to fulfill themandate of the CEC under Article 10(6)(d). Before beginning Phase I, the CEC surveyed otherattempts to assess the effects of economic activity and trade on the environment, identified otherorganizations working on these issues, and examined the claims that had been made prior toNAFTA about what the public and interested parties believed might be the Agreement’s majoreffects—both positive and negative (CEC 1996c, 1996d). These background studies helped theCEC set its work in context and identify appropriate stakeholders.
The methodology was subsequently designed to develop an understanding of the connectionsbetween trade and the environment, to assist in anticipating important environmental impacts inthe context of trade liberalization, and to develop policy tools to better mitigate negative impactsand maximize positive ones. The work undertaken in Phase I was subject to public comment at ameeting in La Jolla in April 1996. The proceedings from that workshop were published by theCEC (CEC 1996a). Phase I was further informed by the results of the consultations on trade andenvironment by the Joint Public Advisory Committee (JPAC) in the spring and summer of 1996.
Phase II (1996–1997) of the project built on the basic approach developed in Phase I, as refinedon the basis of review and consultation. Phase II also took into account the work done byinternational organizations, such as the Organization for Economic Cooperation andDevelopment (OECD), and by research and other communities in the NAFTA region andbeyond, on trade-environment linkages. During Phase II, the Framework was further elaboratedusing the analysis of four component studies:
• an examination of the operation of NAFTA’s environmentally-related institutions,• an issue study on maize in Mexico,• an issue study on cattle feedlots in the United States and Canada, and• an issue study on electricity in Canada, the United States and Mexico.
The first study, entitled NAFTA’s Institutions: The Environmental Potential and Performance ofthe NAFTA Free Trade Commission and Related Bodies (CEC 1997b), was designed to address awide range of economic, social and government policy changes through an analysis of the workof the institutions created by NAFTA. The subsequent three issue studies were designed to testand refine the methodology, with a particular emphasis in Phase II on understanding and

Analytic Framework for Assessing the Environmental Effects of NAFTA
iv
developing the linkages between economic activity and the environment. During Phase II, theCEC received feedback from experts and stakeholders through two workshops that consideredthe issue studies and the general framework. The workshops were designed to present theongoing research and analysis to an audience of experts in the specific sectors for their reviewand comment. The issue studies played a vital role in developing the Framework for Analysis(Phase II). At their fourth Regular Session, in June 1998 in Mérida, the CEC Council announcedthat the Framework and Issue Studies representing Phase II of the project would be released tothe public. The document was translated and released in the three NAFTA languages in March1999 (CEC 1999).
Phase III of the project (1998–1999) consisted, in the first instance, of an extensive peer reviewof the work undertaken in Phase II, and the subsequent incorporation into the methodology ofcomments provided. This document reflects the culmination of that process. It also includes apreliminary review of indicators for incorporation into its final section. The Analytic Frameworkconsists of two major components: the first, Part I, is a methodological framework for analysisthat should serve as a guide for individuals or organizations seeking to apply this methodology;the second, Part II, is a background on methodological and empirical issues associated with themethodology. This second component is designed to provide more detail on a number of themain areas covered in the Framework, and includes results of research and analysis undertakenover the course of developing the methodology. The division of the framework into these twocomponents was one of the key recommendations put forward by the peer reviewers.
The central purpose of the NAFTA Effects Project has been to develop a methodology that canbe applied on an ongoing basis to particular issues and sectors of concern in the NAFTAcommunity. To this end, individuals and organizations will be encouraged to undertakeindependent analyses using the Framework, in preparation for a North American Conference onIssues Related to Environment and Trade, that will be sponsored by the CEC in September 2000.It is hoped that the work presented in that forum will further enrich the research and analysiscontained herein, thereby increasing capacity to identify and understand the linkages betweentrade liberalization and the environment, and improving the capacity of governments and othersto use these linkages in ways that promote the goals of both issue areas simultaneously.

Analytic Framework for Assessing the Environmental Effects of NAFTA
v
Acknowledgments
This document is the collective work of a number of individuals representing a broad range ofdifferent sectors, who have been assembled by the Commission for Environmental Cooperation(CEC) at various times in the past four years to help it fulfill its mandate to develop a frameworkto assess the effects of NAFTA on the environment. The CEC is grateful to all of theseindividuals for their important contributions to this project.
First, the CEC would like to thank the members of the NAFTA Effects Project Team who haveincluded, over the past four years, the following individuals: John Kirton, Department ofPolitical Science, University of Toronto; Raúl García Barrios, Professor e Investigador, Centrode Investigación y Docencia Económica; Virginia Maclaren, Department of Geography,University of Toronto; Omar Masera, Centro de Ecología, Universidad Nacional Autónoma deMéxico; Rogelio Ramírez de la O, Director General, Ecanal S.A. de C.V.; Sidney Weintraub,Centre for Strategic and International Studies; David Wilk Graber, WG Consultores y Asociados,S.A. de C.V.; Ralph Cavanagh, Natural Resources Defense Council, San Francisco; RafaelFernández de Castro, Instituto Tecnológico Autónomo de México (ITAM); Dermot Foley,Association for the Advancement of Sustainable Energy Policy, Vancouver; Glenn Fox,Department of Agricultural Economics and Business, University of Guelph; Edward Hoyt, EICde México, S.A. de C.V.; John Paul Moscarella, Econergy International Corporation (EIC),Washington, DC; Alejandro Nadal, Professor, Center for Economic Studies and Science andTechnology Program, El Colegio de México; Carol Reardon, Heenan Blaikie, Vancouver; C.Ford Runge, Distinguished McKnight University Professor of Applied Economics and Law,Department of Applied Economics, Center for International Food and Agricultural Policy,University of Minnesota.
Research assistance was provided at various points during the past four years by the followingindividuals: Julie Soloway at the Centre for International Studies in Toronto; Jan Gilbreath at theUniversity of Texas in Austin; Enrique Velasco-Ibarra at Johns Hopkins School of AdvancedInternational Studies in Washington, DC; Ashley Prince at the University of South Florida; TimEgan (Toronto); Mary Vanderbilt (Washington, DC); Olga Sandoval García (México, DF);Cecilia Brain; Michael P. Ivy; Marcos Chávez Maguey; and Francisco Aguayo.
A number of people assisted the CEC and the Project Team during Phase I of this project,assembling and analyzing critical background material. Notably, we owe thanks to Dan Esty ofYale University for his assessment, in 1995, of attempts to model the effects of trade andeconomic activity on the environment, and Mark Spalding and Marc Stern from the University ofCalifornia, San Diego, who, in 1995, prepared an index of potential NAFTA effects that wereidentified during the policy debates surrounding NAFTA in 1991–1994.
In Phase II, important contributions to the work on NAFTA’s institutions were made in 1997 bySanford Gaines of the University of Houston; John Audley, from the National WildlifeFederation; Armand de Mestral, in the Faculty of Law at McGill University, and Raoul Hinojosa,a professor of Economics at the University of California at Los Angeles. Additionalcontributions were made to the issue studies in Phase II by Rafael Ortega Paczka, of theUniversidad Autónoma de Chapingo; Antonio Turrent, from the Colegio de Posgraduados andINIFAP; Rocío Alatorre, from the Instituto de Salud, Ambiente y Trabajo (ISAT); Carlos Salas

Analytic Framework for Assessing the Environmental Effects of NAFTA
vi
Páez, from the Science and Technology Program at El Colegio de México; and Víctor Suárez ofthe Asociación Nacional de Empresas Comercializadoras de Productos del Campo (ANEC).
An important component of Phase III of this exercise has been the extensive peer reviewconducted by individuals from the three NAFTA countries. The CEC would like to thank thereviewers for their thoughtful comments. They include, from Canada, Yvan Bernier, Faculté deDroit, Université Laval; Peter Victor, Faculty of Environmental Studies, York University; MikeBeale, Environment Canada; John Curtis, Department of Foreign Affairs and International Trade.From Mexico, Rolando Cordera, Nexos TV; Carlos Muñoz Piña, University of Berkeley; AnilMarkandya, University of Bath; José A. Canela-Cacho, University of California at Berkeley.And finally, from the United States, Robert Shackleton, US Environmental Protection Agency;Scott Nance, Colby & Nance; Michael Ferrantino, US International Trade Commission; andRichard Boltuck, Trade Resources, Co.
The CEC has received generous institutional support at important points during the course of thisproject from the following institutions: Centre for International Studies at the University ofToronto; the Johns Hopkins University School of Advanced International Studies, inWashington, DC; the Center for Strategic and International Studies, in Washington, DC; TheInstitute of the Americas, in La Jolla, CA; The National Round Table on the Environment andthe Economy, in Canada; and El Colegio de México. We have been privileged to work withinstitutions in the three NAFTA countries that play such distinctive roles in the policy debate onissues related to the environment and the economy in North America.
In addition, there are a number of individuals from environmental groups, business organizationsand governments, who have made themselves available to the CEC and to individual members ofthe Project Team for the series of specialized interviews that form an important part of theresearch for this project, and who have provided advice to the CEC over the life of this project.These groups include the National Advisory Groups, set up under NAAEC, who advise the CECCouncil on program-related issues. The CEC would also like to thank the individuals who tookthe time to participate in the public consultation in La Jolla in 1996, and in the expert workshopsheld in Montreal in 1997, to discuss the issue studies and the framework. Public interest,commentary, and feedback have been critical in assisting the CEC to develop and refine its workand bring this project to its final phase.
Finally, the CEC gratefully acknowledges the work of the NAFTA Effects Advisory Group:Pierre Marc Johnson (Chair), Heenan Blaikie, Montreal; Alicia Barcena, Advisor, UNEP-Mexico; León Bendesky, Director, ERI Consultants, Mexico; Pierre Goselin, Comité de santéenvironnementale du Québec; William Haney III, President, Molten Metal Technologies;Kenneth Harrigan, Past Chair and CEO, Ford Motor Company of Canada; Gary Hufbauer,Council on Foreign Relations, New York; Richard Kamp, Director, Border Ecology Project;Elizabeth May, Executive Director, Sierra Club of Canada; Jack McLeod, Corporate Director(former CEO), Shell Canada; Edmund Miller, Mott Foundation; José Montemayor Dragonné,Commercial Director, Química Pennwwalt, S.A. de C.V., Mexico; Robert Repetto, VicePresident and Chief Economist, World Resources Institute; Hilda Salazar, President, GrupoDesarrollo-Ambiente; Víctor Urquidi, Professor, El Colegio de México. The individuals on theAdvisory Group, and past members, including Philip Shabecoff, Editor, Greenwire; and VíctorToledo, Centro de Ecología, UNAM, have volunteered their time, assisting the CEC to enrichthis work.

Analytic Framework for Assessing the Environmental Effects of NAFTA
vii
The Framework at a Glance
Six preliminary hypotheses to focus the analysis1. Does NAFTA reinforce existing patterns of comparative advantage and specialization to the
benefit of efficiency?2. Does NAFTA trade liberalization lead to a regulatory/migratory “race-to-the-bottom”?3. Does NAFTA give rise to competitive pressures for capital and technological modernization?4. Do liberalized rules under NAFTA serve to increase the use of environmentally friendly
products?5. Does NAFTA lead to upward convergence of environmental practice and regulation through
activities of the private sector?6. Does NAFTA lead to upward convergence of environmental practice and regulation through
activities of the various levels of government, and if so, how?
Framework applicationI. Select the sector to be studiedII. Select the specific issues for study within or across sectorsIII. Establish connection of sector/issue to NAFTA
A. NAFTA rule changes1. Tariff reductions and other border measures2. Changes affecting goods/services once imported3. Inputs4. Substitute products5. Norms for particular processes6. Preambular principles and stated objectives7. National implementing legislation8. Accelerated tariff reduction
B. NAFTA’s institutions1. Meeting mandatory responsibilities2. Acting upon discretionary environmental mandates3. Extending to other relevant subjects4. Generating new institutions5. Fostering communication6. Capacity building7. Discouraging unilateral action8. Fostering high levels of environmental convergence9. Participating multilaterally10. Contributing to community building and identity
C. Trade flows1. Value and volume of exports/imports2. Market share3. Structure and composition4. Creation and diversion
D. Transborder investment flows1. Regional concentration of investment2. Sectorial investment shift, migration and subsidies

Analytic Framework for Assessing the Environmental Effects of NAFTA
viii
3. Technology transfer and diffusion4. Intracorporate production and standards integration5. Corporate concentration6. Foreign portfolio investment
E. Other economic conditioning forces1. Domestic macroeconomic forces2. Microeconomic changes in each economy3. Major fluctuations from international forces4. Changes in weather and climate
IV. Examine four “processes” by which NAFTA’s rules and institutions affect theenvironmentA. Production, management, and technology
1. Inputs2. Production efficiency3. Physical technology4. Management standards5. Product characteristics and prices6. Sectoral and geographic concentration
B. Physical infrastructure1. Existing infrastructure capacity2. Correlation of capacity3. Choke points4. Competitive corridors5. Transportation/transmission scale6. Intermodal shifts7. Distancing effects
C. Social organization1. Civil society groups2. Property rights3. Culture4. Migration and community formation5. Transnational coalitions
D. Government policy1. Governmental intervention in the market2. Jurisdiction over environmental policy3. Balance between government branches4. Strength of market-oriented government policies5. Effects of specific government policies on the environment
a. Procurement practicesb. Environmental management systems in state-owned enterprisesc. Financial instrumentsd. Government research and developmente. Regulations, environmental assessment, intellectual property rightsf. Environmental regulation of producers and productsg. Conservation programs
6. Environmental surveillance and enforcement

Analytic Framework for Assessing the Environmental Effects of NAFTA
ix
7. Trilateral cooperation at various governmental levels outside NAFTAinstitutions
V. Indicators of environmental impacts stemming from NAFTAA. Air indicators
1. Acid precipitation (SOx)2. Ozone concentration (O3, NOx, VOCs)3. Particulate matter (PM10, PM2.5, Hg, Pb)4. Persistent organic pollutants (POPs)5. Carbon monoxide (CO)6. Carbon dioxide (CO2)
B. Water indicators1. Quality of drinking water2. Freshwater use (by source/sector)3. Lead concentration4. Copper concentration5. Surface water pollutants6. Fish capture7. Sewage treatment connection rates
C. Land indicators1. Intensity of pesticide use for agriculture2. Nitrogen from fertilizers and livestock3. Area of forested land4. Intensity of forest use5. Waste generation6. Recycling rate
D. Biodiversity indicators1. Number of threatened/extinct species2. Wetlands3. Protected areas
E. Aggregate indicators1. Climate change2. Ozone depletion3. Acidification4. Eutrophication5. Cost of environmental remediation6. “Ecological footprint”7. Energy intensity8. Human health costs of environmental pollution9. Energy mix10. Biological integrity

Analytic Framework for Assessing the Environmental Effects of NAFTA
x

Part I: Analytic Framework for Assessing the Environmental Effects ofthe North American Free Trade Agreement

Analytic Framework for Assessing the Environmental Effects of NAFTA
2
I. Introduction to Framework Analysis
This document presents the final version of an Analytic Framework that has been developedunder the North American Free Trade Agreement (NAFTA) Environmental Effects Project,within the Commission for Environmental Cooperation’s (CEC) Environment, Economy andTrade Program. The overall goal of this project has been to advance the understanding of therelationship between the environment, economy, and trade in the North American region, inorder to promote increased cooperation and dialogue, and strengthen environmental protectionamong the NAFTA Parties. The CEC recognizes the importance of understanding therelationships between environment, economy and trade to highlight positive relationships andmitigate any negative ones. Such increases in knowledge and analytical capabilities will allowgovernments and other interested parties better to identify and address these linkages.
The Analytic Framework presented in this document has evolved over three years of study anddiscussion. It is supported by a background document that includes the empirical evidence andanalysis underpinning the methodology used here. In short, this framework is a tool that putsforward hypotheses suggesting relationships between trade and the environment and, in thespecific context of NAFTA, provides a methodology for analysis and suggests variables forempirical study, in order to confirm or refute existing hypotheses or generate new ones. Theoverall goal of this exercise is to develop an improved understanding of the linkages betweentrade liberalization and the environment.
The NAFTA Environmental Effects Project, and the Analytic Framework it has produced,responds directly to Article 10(6)(d) of the North American Agreement on EnvironmentalCooperation (NAAEC). This article prescribes cooperation between the CEC Council and theNAFTA Free Trade Commission, to achieve the environmental goals and objectives of NAFTAby assessing, on an ongoing basis, its environmental effects
For the purposes of this analysis, “NAFTA” (or the “NAFTA regime”) is defined broadly ascomprising the three agreements (The North American Free Trade Agreement, the NorthAmerican Agreement on Environmental Cooperation, the North American Agreement on LaborCooperation) that took formal effect on 1 January 1994, covering trade, investment,environment, and labor. This definition further includes the principles embodied in, andinstitutions created or catalyzed by, these international agreements.
This document does not offer a definitive judgment about NAFTA’s environmental effects todate. The lack of knowledge about important variables and relationships, the absence of reliablecomparative baseline data, and the relatively short time NAFTA has been in effect mean thatsuch conclusive, comprehensive judgment is not yet possible. However, the Analytic Frameworkhas now been developed to the point where its empirical application is both possible andappropriate. It is hoped that it will be applied, using the NAFTA model, to generate suchjudgments, thereby enriching the methodology, the state of knowledge, and the analyticalunderstanding in North America of the relationships between the environment, the economy andtrade.

Analytic Framework for Assessing the Environmental Effects of NAFTA
3
A. Major Hypotheses to Focus the AnalysisOn a general level, six major hypotheses can serve as arguments to guide the application of thisframework. These are not assumptions intended to predispose the analysis in a particulardirection. Rather, they are hypotheses that together should serve to direct the analysis in adisciplined fashion; each to be individually supported, refuted or modified as the evidencesuggests. These hypotheses suggest views about how NAFTA might affect the North Americanenvironment through economic, social and political processes. They are based on the work andliterature about relevant relationships between the environment and the economy, on thevariables presented in the framework and, where possible, on the diagnostic empiricalapplications conducted in this project. It is hoped that they will aid the analyst to tie together theparticular variables and relationships identified in the framework, and address important areas ofpossible environmental effects.
1. Specialization and Efficiency: Does NAFTA-induced liberalization reinforce existingpatterns of comparative advantage and specialization, concentrating production andtransportation where it takes place most efficiently?
New economic activity may be concentrated in sectors and firms operating by methods, inlocales, and through transportation networks where environmental conditions are mostfavorable and regulatory oversight the strongest. Because of their size, profitability andvisibility, such firms can develop, incorporate and diffuse state-of-the-art technology, andadopt high environmental standards, both on a voluntary basis and in anticipation ofgovernmental inspection/enforcement action. Conversely, liberalization may concentrateeconomic activity in sectors, firms or geographic areas unsupported by adequate technology,management, physical infrastructure or the institutional capacity to handle NAFTA-inducedgrowth, and where ecological stress is already acute.
2. Regulatory/migratory “race-to-the-bottom”: Does economy-wide liberalization associatedwith NAFTA intensify competitive pressures throughout the region, leading firms to lowertheir environmental regulatory burden?
Competitive pressures may lead firms to lower input costs, in part by reducing environmentalprotection or by pressuring governments to lower costly environmental standards. Somefirms might move production to jurisdictions with lower standards, or shift to less costly andless environmentally friendly sources of supply. The resulting “race-to-the-bottom” can,absent offsetting policy intervention, create an economy-wide incentive to more highlypolluting production throughout the region. Alternatively, it can induce firms, as part of theircorporate strategy, to engage in cost-reducing environmental innovation, and to urge theirgovernments to introduce new, more stringent environmental regulation that supports thenew production methods.
3. Competitive capital and technological modernization: Does liberalization lead to theeconomic growth that promotes industrial modernization and reduces environmental stress?
NAFTA-induced growth and competitive market pressures generated by liberalization canhasten processes of capital and technological modernization for all firms. The newly openedNAFTA marketplace can provide the revenue and the income to allow firms to accelerate

Analytic Framework for Assessing the Environmental Effects of NAFTA
4
capital turnover, and invest in cleaner, more efficient plants, technologies and processes. Inthe process, however, this new marketplace may harm the even more environmentallyfriendly and socially valuable traditional methods. Government policy may enhance orimpede both processes.
4. Increased use of environmentally friendly products: Do NAFTA’s liberalizing rules inspecific sectors and products lead to the greater use of imported environmentally superiorproducts as substitutes for less-clean domestic alternatives?
NAFTA’s rules can reduce, or allow for the reduction of, barriers on relatively clean productsand services and/or on relatively clean inputs. At an economy-wide level, such substitutioncan lead to a shift of production and consumption to those sectors and products with lowertariffs that generate less environmental stresses. Government policy and political processescommitted to maximizing the environmental benefits of trade liberalization can beinstrumental in ensuring that this occurs to the greatest extent possible.
5. Private sector-led upward convergence of environmental practice and regulation: DoesNAFTA-associated liberalization affect corporate practice and subsequent governmentpolicy by creating an upward movement of environmental standards and regulations towarda common, high, regional norm?
This dynamic may arise on an ad hoc individual or collective, voluntary, private-sector basis.NAFTA liberalization can intensify the need for companies to access the larger NorthAmerican market and to operate production systems that are integrated region-wide. Industryleaders may build and operate to meet the highest standards in any of the three countries.They may create a single, industry- and supplier-wide set of environmental standardscovering their operations in all three jurisdictions in order to lower their transaction costs.The private sector may also be leaders in implementing environmental management systemsthat meet international standards, such as ISO (International Organization forStandardization) 14000. This can have the dual effect of facilitating trade liberalization,while at the same time raising levels of environmental protection. Governments can adjusttheir policy and regulation to reflect and reinforce this evolving corporate practice.
6. Government-led upward convergence of environmental regulation and practice: Is upwardregulatory convergence being led by the governments through individual adjustment, on anegotiated basis, or through NAFTA’s trilateral institutions?
NAFTA can induce the federal governments in North America to engage in communication,capacity building, regional regulatory convergence, and cooperation as a region. Byinvolving other stakeholders, it may, over time, create transnational coalitions and a sense ofcommunity that leads to regional standards, practices, awareness, and a sense of collectiveresponsibility. The institutional structures created and catalyzed by NAFTA can also assistsocial organizations and civil society to present governments with demands for enhancedenvironmental performance. The NAFTA regime features dispute settlement and surveillancemechanisms that may also encourage and assist governments to engage in strongerenvironmental performance. In addition, such a dynamic might encourage the NAFTA

Analytic Framework for Assessing the Environmental Effects of NAFTA
5
countries to approach wider international fora, and adopt multilateral approaches that supportthe particular environmental requirements of North America.
B. Applying the Framework AnalysisTo achieve its objective, the analytical methodology of the framework may be applied bothgenerally and specifically to issues or sectors. The component sections of the frameworkexamine the NAFTA regime and associated trade and investment flows (§§ III. A–E, below),and trace four major processes through which activity generated or affected by NAFTA’s rulesand institutions impact the region’s environment (§§ IV. A–D, below). In addition to the sixoverall hypotheses identified above, the framework specifies the content of key variables relatingto rules, institutions, trade, investment, production management and technology, physicalinfrastructure, social organization, government policy, air, water, land and living things.
This framework also identifies, through various techniques, relationships among these variablesat a general or sectoral level, where there may be an important connection between NAFTA andthe environmental concerns of its Parties (§ V). The framework can be applied to specific sectors(and firms or locales within them), to priority trade-environment issues in North America, or tothe North American region as a whole. It can also be applied using qualitative or quantitativeevidence, through case studies or formal economic and/or ecological modeling techniques.
Level of ApplicationThe analytical methodology of the framework can be applied most readily at an intermediatelevel by examining NAFTA-associated change in specific sectors of North American industry,and to important economic or environmental issues that arise within a sector or across a widevariety of sectors.
The following criteria should serve as a guide for the selection of sectors, to maximize an overallunderstanding of NAFTA’s environmental effects.
• The sector relates directly to major environmental media and natural resources.• The sector has been the subject of changes in the economic rules set by NAFTA.• The sector has experienced changes in trade during the post-NAFTA period.• The sector has involved new, direct foreign investment among NAFTA Parties since 1994.• The sector is one where one might expect, a priori, that there are important effects
attributable to NAFTA.
Criteria to identify specific issues within or across sectors are as follows:
• The issue relates directly to major environmental media and natural resources.• The issue is significant from an environmental perspective.• The issue bears some significant relationship to the integration of the North American
economy through NAFTA rule changes, government policy changes, institutional changes,investment changes or direct trade impacts.
• An analysis of the issue contributes to an understanding of other issues of importance inNorth America.
Analytic Framework for Assessing the Environmental Effects of NAFTA
6
• An analysis of the issue contributes to tracing linkages between NAFTA and its relativeimpact on the ambient environment.
In exploring specific sectors and issues, it is necessary to set clear boundaries on the field ofanalysis. In some cases, it is useful to trace the entire production and value chain of a specificsector or issue, in a “cradle-to-grave” sequence, to develop a full life-cycle analysis that includesconsideration of elements such as drains on ecological capital, through to ultimate use anddisposal. At a minimum, the boundaries should be able to expand to include changes in the majorupstream (inputs) or downstream (products) sectors or issues with which they are linked. Suchexpansions of the field of analysis should be guided by the following criteria:
• Is there a related sector or issue that is a major input into and/or consumer of the sector orissue under consideration?
• Are there related economic or environmental dynamics from other issues or sectors that arenecessary to the operation of the sector under consideration?
• Is there a related sector or issue that has proliferating ecological impact on the sector or issueunder consideration?
Methods for AnalysisThis analytical framework can be applied through various methodologies, alone or incombination. These comprise qualitative (even anecdotal) and quantitative methods, includingpartial and general equilibrium, economic and ecological modeling. In all cases, they shouldintegrate the major variables that appear in the framework, including legal, economic,institutional, social, political and ecological factors.
At present, the framework can be most readily applied by using qualitative and selectedquantitative methods. The former, based largely on specialized interviewing techniques, areparticularly useful for examining legal, institutional, technological and social factors, as well ascomponents relating to management, production, and policy. A reliance on existing quantitativematerial is most useful to identify trade and investment flows, physical infrastructure andchanges in the ambient environment.
Partial or general equilibrium models of the economy, based only on quantitative methods, arestill of limited use for assessing NAFTA’s environmental effects. There are importantcomponents of the North American economy, such as technology and foreign direct investment,that have not been directly incorporated into existing economy-wide economic models applicablefor an assessment of NAFTA effects.
Nevertheless, some partial equilibrium models do show promise as having important applicationfor specific variables in the analysis. At present, particularly as applied to the agricultural sector,partial equilibrium models are used successfully to indicate how changes in trade are affected bymacroeconomic forces. Combined with other variables in the framework, these models can traceand produce a relatively accurate account of NAFTA-induced changes in trade flows.
Existing quantitative models are generally less useful in relating economic change toenvironmental factors. While some helpful work is available correlating sectoral changes in trade

Analytic Framework for Assessing the Environmental Effects of NAFTA
7
and investment with the pollution intensities of those sectors, such analyses still do notincorporate important differences in production and technology among the three NAFTAcountries, or other intervening processes, such as those identified in the framework.
Efforts to realize the potential of quantitative models should focus on generating required datafrom all NAFTA countries, linking trade with environmental indicators, and identifying how thedifferent processes unleashed by NAFTA-associated trade liberalization affect the environmentin distinct ways. The existing, limited state of such modeling efforts should not deter or delayefforts to build new models or applications relying on other quantitative or qualitativetechniques.
II. The Broader Context
The environmental impact of an activity will often be determined by a range of forces, manyunconnected to NAFTA. It is thus necessary to identify and take into account, throughout theanalysis, the environmental, economic, social, geographic and political factors that have animportant effect on a particular issue or sector.
III. The NAFTA Connection
The next step is to consider how NAFTA is connected to the sector or issue under consideration.
Although NAFTA came into formal effect on 1 January 1994, it is a dynamic regime that beganto influence economic life in the region from the time it first emerged as a possibility in 1990. Itis a regime that confirmed, as well as changed, existing rules, and one whose institutions aresteadily expanding the content and force of the initial rules of the Agreement. Indeed, NAFTAmight well offer an instrument to address environmental issues, and serve ecologicalopportunities that are not otherwise directly associated with it.
It is in the spirit of environmental enhancement and the precautionary principle—both of whichare integral to the principle of sustainable development that NAFTA promotes—that this broadconception of NAFTA is adopted. To identify the NAFTA connection, the framework offers thefollowing key areas for consideration:
• NAFTA rule changes,• NAFTA’s institutions,• trade flows,• transborder investment flows,and• other economic conditioning forces.
Within this configuration, NAFTA may be associated with economic, social, political andenvironmental change in several ways. In some cases, NAFTA’s provisions might have a directeffect on the environment, while in others its impacts will be less direct. In certain instances,NAFTA may have little visible impact upon economic or ecological activity, given processesalready underway in the private sector, the wider economies, or other international agreements;

Analytic Framework for Assessing the Environmental Effects of NAFTA
8
but it can serve to codify and reinforce these existing or emerging practices, or be critical insteering them in particular directions.
A. NAFTA Rule ChangesNAFTA’s rules are those specified in the agreement itself, in its tariff annexes, and in its twocompanion agreements. A number of important variables should be examined in order to obtain acomprehensive picture of the impact of specific NAFTA rules on any given product, service, orsector.
The specific rules of greatest relevance are the following:
1. Tariff reductions and other border measures. These include tariffs, quotas, quantitativerestrictions, and rules of origin. These reductions should be assessed according to:
• the base-level tariff among the three countries prior to NAFTA;• the degree and timing of liberalization already scheduled to take place according to other
trade agreements and unilateral national action;• the particular NAFTA tariff phase-out schedule; and• the tariffs that NAFTA Parties maintain and face with non-NAFTA countries.
2. Changes affecting goods/services once imported. These include changes in NAFTA rules onbehind-the-border or domestic issues that may affect trade flows. It also includes changes inproduct standards.
3. Inputs. This refers to tariff reductions and other border measures affecting major inputs torelevant products and goods. These changes affect price and therefore demand for inputs anddetermine the mix of inputs used in the production chain.
4. Substitute products. This refers to tariff reductions and other border measures affecting
“like” or substitute products.. Rule changes affecting a particular product or sector must beconsidered relative to changes in related products and sectors among NAFTA countries andwith their other trading partners. Full account must be taken of the possibility of substitutionsencouraged by the differential reduction of tariffs and other trade barriers.
NAFTA also includes general rules which, while they do not explicitly apply to a single productor sector, discipline the means or processes by which products and services (and their inputs) inall sectors across the economy are produced, sold or purchased. The following variables arerelevant to determine the impact of more general NAFTA rules that discipline behavior on aneconomy-wide basis: 5. Norms for particular processes. Such norms include the Article 1114 disciplines on
investment, risk assessment, sanitary and phytosanitary standards, health and safetystandards, procurement policies, and investment guarantees.

Analytic Framework for Assessing the Environmental Effects of NAFTA
9
6. Preambular principles and stated objectives. NAFTA’s stated objectives include thepromotion of sustainable development and strengthening of environmental regulation andenforcement.
7. National implementing legislation. This is legislation required in the three countries for
NAFTA and its related agreements to take force, including agreements subsequent toNAFTA itself, such as the Canadian intergovernmental agreement governing provincialparticipation.
8. Accelerated tariff reduction. These are those rules generated by the NAFTA institutions or
those reached intergovernmentally subsequent to the Agreement coming into force, and thecumulative overall reduction of tariffs and trade and investment barriers, including futurespecified liberalization, that parties can anticipate and adjust to in advance.
B. NAFTA’s InstitutionsNAFTA’s institutions are the 26 trilateral intergovernmental commissions, committees orworking groups created directly by NAFTA and its related agreements, and the similar numbercatalyzed by them since 1 January 1994. These institutions are designed to implement and extendthe agreements. The operation of these institutions can affect the application and result ofNAFTA’s rules, even when the latter come with very precise targets and timetables.
There are a number of institutions that can be included in the present examination, as identifiedbelow. In all cases, it is important to consider the relationship of these institutions with nationalregulatory and government authorities, which retain significant capacity and whoseintergovernmental cooperation outside NAFTA institutions has substantial effects.
The NAFTA institutions of greatest relevance to the environment are:
• the Council of the Free Trade Commission (FTC),• the Council of the Commission for Environmental Cooperation (CEC),• the Council of the Commission for Labor Cooperation (CLC),• institutions created by NAFTA with mandatory environmental responsibility,• institutions created by NAFTA whose subject matter has an inherent environmental
relevance, and• NAFTA’s dispute settlement, avoidance and surveillance mechanisms.
To assess the impact of these institutions, it is important first to focus on their development astrilateral entities and their specified purposes, programs, resources and decision-makingprocedures. Further, it is useful to examine each in accordance with how it performs thefollowing functions: to foster the growth of the NAFTA regime, balance the interests of the threecountries and the trade and environment communities, and promote sustainable development.Variables that should be considered within relevant institutions include how they areaccomplishing the following:

Analytic Framework for Assessing the Environmental Effects of NAFTA
10
1. Meeting their mandatory responsibilities. These are the areas where the rules specify that aNAFTA institution “shall” act in a prescribed way, often to meet a specified target with aprecise timetable attached.
2. Acting upon their discretionary environmental mandates. The institutions may act on thediscretionary, environmentally-related mandates set forth in NAFTA or its relatedagreements, such as those where the Parties “may” rather than “shall” act on environmentalissues.
3. Extending to other relevant subjects. The institutions may include within the trilateralprocess additional subjects and issue areas beyond those specified in the initial agreements.
4. Generating new institutions. The institutions may perform a role in catalyzing other bodies
or processes as part of, or outside, the NAFTA structure of institutions.
5. Fostering communication. This includes communication through an open exchange ofinformation and learning. Such communication makes it easier to understand and meetnational standards, leads to transparency and trust, and fosters a sharing of best practices.
6. Building capacity.. This is done by sharing resources of a financial, material and intellectualnature. Institutions can lead national governments to offer environmentally enhancingequipment and training to their NAFTA partners.
7. Discouraging unilateral action. Norms developed in institutions can lead to a reluctance touse national restrictive measures and can allow problems to be collectively resolved at anearly stage. This would include how institutions act to constrain unilateral use ofdiscretionary national regulatory and compliance measures.
8. Fostering high levels of environmental convergence. NAFTA’s institutions can encouragethe adjustment of specific national regulations to more compatible or convergent levels, andfoster new single region-wide regulations where none existed before.
9. Participating multilaterally. The institutions may strengthen cooperation among the three
North American countries as they participate in broader multilateral forums. They may thusbe extending the geographic relevance of NAFTA’s work through its impact on outsiders(including use as a model), and by developing complementary North American positions andconsultations in outside forums.
10. Contributing to community building and identity. The institutions may help engender asense of regional community and responsibility through consciousness-raising or concernabout the full region.
C. Trade FlowsBecause NAFTA is an agreement aimed at liberalizing trade among its members, it is essential toexamine next its impacts on trade flows. This can be done by analyzing readily availablequantitative data. Here one might employ one of the many existing formal methodologies that

Analytic Framework for Assessing the Environmental Effects of NAFTA
11
can more conclusively demonstrate and quantify the existence of an independent NAFTA effect,both on trade at the general, economy-wide level and in specific sectors in Canada, Mexico andthe United States.
At a minimum, trade flows should be assessed for an individual product, for its major inputs andfor the good for which it is a major input. This should be done for trade between the NAFTAmembers and in their trade with outsiders, beginning in 1991 and using the pre-NAFTA period(1985–90) as a baseline.
The key variables for examination in such an analysis are as follows:
1. Value and volume of exports/imports. This is the value and volume of exports and importsof each NAFTA country with its other NAFTA partners and with non-NAFTA countries.This includes both goods and services, and serves as the first indicator of how NAFTA’srules and institutions cause economic change.
2. Market share. This refers to the market share of a product (overall and for imports) that eachNAFTA partner’s exports represent in each of the other NAFTA countries, and what othercountries are being affected by this changing market share. This market-share analysis allowsfor the control of a number of conditions in the importing economy, as many such conditionsshould apply equally to imports from NAFTA countries, imports from non-NAFTAcountries, and domestic production alike.
3. Structure and composition. The focus here is how differences over time and across countriesare associated with NAFTA liberalization, as specified by the rules of the Agreement and asimplemented by its institutions. This considers whether the particular changes in trade flowsare consistent with the provisions of NAFTA and the work of its institutions. In addition, itconsiders the changing structure and sectoral composition in trade over time and acrossnational borders as liberalization substitutes one product for another. In what sectors is theshare of the nation’s trade increasing and in which is it decreasing?
4. Creation and diversion. This refers to trade creation and diversion effects with regard tonon-NAFTA countries. How does North American liberalization increase trade with somecountries, but lessen it with others?
D. Transborder Investment FlowsIn important respects, NAFTA was an investment agreement as well as a trade agreement, andtransborder flows of foreign direct investment (FDI) are closely associated with trade. Inassessing changes among the three North American countries, it is important to focus first ondirect investment, and second on portfolio investment.
Direct foreign investment, particularly that of highly integrated transnational corporations(TNCs), brings important capital, management, technology, distribution systems, reputation,markets, and other business assets. Attention should be given to both “greenfield” (new)investment, and acquisitions or expansions, and include both fully-owned investment, jointventures and North American business alliances. Priority should be placed on changes in stocks,more than on flows of foreign investment, as the latter data incorporate the fullest range ofinvestment alterations.

Analytic Framework for Assessing the Environmental Effects of NAFTA
12
In assessing these changes, several variables are central:
1. Regional concentration of investmen. This addresses how post-NAFTA FDI stocks (andsecondarily, flows) among the three NAFTA countries, relative to pre-NAFTA periods andnon-NAFTA partners, have changed overall, and in particular sectors, for each of the threecountries. In all cases, transborder investment should be considered in the context of:
• domestic investment (including both net domestic investment and the percentage of anindustry that is foreign-owned, by firms headquartered and owned in NAFTA and non-NAFTA countries);
• how investment from NAFTA countries and non-NAFTA countries is concentrating in,as opposed to outside, North America; and
• the geographic concentration of investment in particular countries and locations withineach NAFTA country, including transborder production clusters or transportationcorridors.
2. Sectoral investment shifts, migration and subsidies. This considers whether this investmentis expanding most rapidly in relatively polluting or relatively clean sectors. Of particularinterest is whether NAFTA-associated FDI constitutes an environmentally costly transfer ofindustries and plants (including costs for environmental regulatory compliance) from onecountry or locale in the NAFTA region to another, and how the standards, subsidies, andother relevant government policies compare in those locales. Transfers of investment cantake the form of a physical move of an existing plant or an expansion or placement of newinvestment in one area at the expense of another.
3. Technology transfer and diffusion. This looks at the degree and speed of the spread of
advanced technology from one firm to a related enterprise in the other NAFTA countries.Such a trend is promoted by regional production systems. It increases both technologytransfer and diffusion to competing firms in the same industry, to related and non-relatedfirms in the sector, and throughout the economy. Of particular relevance are technologies thatimprove overall efficiency, and those directed at enhancing environmental quality.
4. Intracorporate integration in production. This considers whether and how the NAFTA
regime is increasing intracorporate trade and affiliated trade between and among themembers. Such a process can be expected to encourage integrated production systems thatmake it more likely that plants operating in all three countries will adopt and follow acommon set of standards and practices.
5. Corporate concentration. This examines how FDI may be encouraging changes in facilitysize and a trend toward concentration within industrial sectors by creating a smaller numberof larger, more capable firms servicing the NAFTA marketplace.
6. Foreign portfolio investment. This is concerned with how portfolio investment relates to,reinforces, substitutes for, or provides domestically owned firms with the finance forupgrades and expansion in technology and production.

Analytic Framework for Assessing the Environmental Effects of NAFTA
13
E. Other Economic Conditioning FactorsTo demonstrate the presence of a NAFTA connection in trade and transborder investment, it isimportant to take into account the other macroeconomic and microeconomic conditions thataffect trade and FDI flows. Among the most important variables to consider are:
1. Domestic macroeconomic forces. Relevant domestic macroeconomic forces includeaggregate growth, income levels, demand, and consumption in the economy, as distinct fromthe scale effect of growth and production (and consumption) generated by trade liberalizationitself. They also include inflation and interest rates arising from and directly affectinggrowth, transborder trade and investment. Also relevant are the rate of national savings andinvestment, and the size of government deficits and debts, all of which affect the demand forforeign capital. Together, these factors influence cyclic changes in price that can affect somesectors.
2. Microeconomic changes in each economy. Important microeconomic processes include
deregulation and privatization. Also significant are the condition of the domestic financialand banking systems, and the availability of credit and insurance. Additional factors includeemployment levels, the structure of the labor market, and the structure and profitability offirms.
3. Major fluctuations from international forces. The most important macroeconomic forces in
the international domain are exchange rates and the balance of payments deficits andsurpluses among the NAFTA countries.
4. Changes in weather and climate. Unpredictable weather and climatic conditions occurring
in the region, including precipitation abnormalities and extremes of temperature, can affectpatterns of production, and thus trade and investment.
IV. Linkages to the Environment
The second major function of this framework is to consider how the specific changes associatedwith NAFTA may be transformed into the environmental pressures, supports and changes thatcan ultimately determine their environmental impact. This framework identifies four criticallinkages through which NAFTA’s rules, institutions, trade and investment impact the naturalenvironment, and whose structures and practices will determine the force, timing and direction ofthose impacts. These four linkages are:
• production, management and technology,• physical infrastructure,• social organization, and• government policy.
A. Production, Management and TechnologyThe first linkage to the environment is the process, including the technology and managementsystems, employed by the production unit (usually a firm) that carries out NAFTA-associated

Analytic Framework for Assessing the Environmental Effects of NAFTA
14
trade and investment, or is otherwise affected by it. The environmental stresses and supports ofNAFTA-associated production depend on the following critical variables:
1. Inputs. This includes raw materials and other inputs to the production process, their sources,and the ecological capital (renewable and non-renewable) they represent.
2. Production efficiency. This focuses on the efficiency of the process, as well as suchadditional factors as the location, scale, profitability, and emissions of the producing units.
3. Physical technology. This considers the physical technology employed in production,
including technology that can increase overall efficiency (greater production with lowerinputs, emissions and waste), and technology devoted specifically to environmental purposes(such as pollution prevention technologies).
4. Management standards. These include the dominant strategic management systems for
production units, in both their economic and environmental dimensions. Also included arethe strategies adopted or devised to respond to NAFTA-affected and other incentives, thepresence and use of a high-standards environmental management system or industry-wideenvironmental code, and the way in which an “environmental culture” permeatesmanagement and the firm as a whole. Also relevant is the presence of outside stakeholders inthe operation of the environmental management systems.
5. Product characteristics and prices. These include the relative price and other characteristics
of the product, and the environmental emissions and supports flowing directly from thisproduct and its production process. Also important are the performance, use, and ultimatedisposal or reuse of the products.
6. Sectoral and geographic concentration. This includes the number, size and geographic
concentration of production units in the sector. NAFTA may reinforce comparativeadvantage and produce a geographic concentration of production in a few, large, capablefirms in environmentally permissive locations.
B. Physical InfrastructureIt is next important to consider the character and environmental impact of the physicalinfrastructure that supports and sustains the site-specific production units and connects them totheir inputs, customers and stakeholders.
Physical infrastructure includes facilities in the public or private sectors. Key components ofphysical infrastructure are, inter alia:
• transportation/transmission infrastructure, including roads, railways, ports, aircraft andairports, electrical transmission corridors, telecommunication grids, pipelines, irrigationcanals, locks, dams, trucks, railcars, bridges, grain elevators and warehouses; and
• service infrastructure, including water and sewage plants, the local production anddistribution of electricity, telephone and telecommunications networks, and irrigationsystems.

Analytic Framework for Assessing the Environmental Effects of NAFTA
15
Attention should be paid to the overall public and private investment in such infrastructure, theunused capacity of existing systems, and the creation of and need for new systems to handleadditional demand.
In examining the environmental impacts of physical infrastructure, the following variablesshould be considered:
1. Existing infrastructure capacity. NAFTA may direct trade toward products and serviceswhere the existing infrastructure can absorb the new traffic and demands, thereby obviatingthe need for new investments, new routes, and associated impacts on the environment.
2. Correlation of capacity with concentrated activity. NAFTA-generated comparative
advantage and specialization may concentrate new production activity in geographiclocations with an already well-developed transportation/transmission and local environmentalservice infrastructure. While there will be additional environmental impacts from increaseduse, incremental additions to a well-developed and regulated network can minimizeenvironmental stress; they may even result in environmental improvement by divertingactivity from less efficient, more ecologically stressed regions.
3. Choke points. NAFTA-generated trade may create choke points that generate local
environmental stress where the transportation that carries trade increases or concentratesmore rapidly than new transportation/ transmission infrastructure can be constructed toservice it.
4. Competitive corridors. Competition on the part of coalitions of subfederal governments and
private sector actors may create new north-south corridors.
5. Transcription/transmission scale. The scale or volume of NAFTA-generated transportationmay increase fuel consumption, emissions, and accidents involving dangerous goods.
6. Intermodal shifts. The NAFTA-associated intersectoral or “intermodal” shift may produce anet move to more or less environmentally friendly modes. Transporting goods and servicesinvolved in trade may be done by sea, rail, road or air, all of which affect the environment indifferent ways, and trade may concentrate on goods that use one mode rather than the other.
7. Distancing effect. This refers to moving the “ecological footprint” of production far from theawareness and sense of responsibility of the intermediate and ultimate consumers and theirpolitical authorities.
C. Social OrganizationThe environmental impacts of NAFTA-associated production further depend on the waystakeholders operate collectively in networks of social organizations. Environmentalenhancement flows from well-developed networks of social organizations that can add importantenvironmental, cultural and public values to economic and market logic.
Analytic Framework for Assessing the Environmental Effects of NAFTA
16
Key variables to be considered when assessing the environmental impacts of social organizationinclude the following:
1. Civil society groups. The way well-organized and influential business, labor, community,consumer, and environmental groups, other cooperatives, and aboriginal communities, act inbalanced or inclusive fashion to affirm ecological values is important. Some businessassociations are engaged in pollution prevention and voluntary environmental standard-setting. Also relevant is the impact of production activities on traditional social units such asthe family farm or ejido.
2. Property rights. Regimes that can provide resources for environmental supports, or that
respect values other than short-term profitability, foster environmental enhancement.
3. Culture. The cultural values shared by local and national communities give daily activitiessignificance, render them relatively immune from short-term, rational economic incentives,and may increase environmental awareness and action.
4. Migration. Migration and associated demographic changes consist broadly of community
formation and change, as workers and their families migrate from one location in theNAFTA region to another, to take advantage of employment opportunities or to avoidunemployment. Sudden clustering of populations in ecologically sensitive areas, or oneswithout adequate environmental infrastructure, can cause environmental stress. Out-migration can lead, over time, to the establishment of community organizations that demandenvironmental supports. It can, however, also relieve environmental stress.
5. Transnational coalitions and community formation. The development of trilateral
transnational networks of civil society groups, and their involvement in the work of theNAFTA institutions, may enhance environmental awareness and action.
D. Government PolicyA fourth process that influences how NAFTA-associated economic change might affect theenvironment is government policy. At the national and subfederal levels, government policyplays a major role in forwarding programs that can reinforce, offset or otherwise alter the impactof NAFTA liberalization. Governments also impose and enforce environmental regulations thatrespond to, or prompt, new developments in production and technology, and that can encouragea move to a high level of general and environmental regulatory convergence in North America. Itis important to assess whether NAFTA is sectorally or geographically concentrating productionactivity in jurisdictions with the highest government regulatory and other policy capacity.Furthermore, is NAFTA facilitating the move to extend such high capacity, through upwardregulatory convergence and other forms of environmentally beneficial international cooperation?

Analytic Framework for Assessing the Environmental Effects of NAFTA
17
The following variables are relevant when considering the role of government policy:
1. Government intervention in the market. This is the degree of government intervention in themarket (or society), including through the use of state-owned enterprises.
2. Jurisdiction over environmental policy. This refers to the division of responsibility forenvironmental policy and the degree of cooperation between federal and subfederalgovernments, notably, the degree of centralization within the three central systems.Decentralization can compound problems of upward convergence, but it can also generatecompetitive innovation that is environmentally beneficial.
3. Balance between government branches. Relevant also is the balance within governments
among the executive, legislative and judicial branches. In general, the coordinated orconvergent involvement of all three branches in environmental policy is likely to promoteenvironmental enhancement. Pertinent within the executive branch is the balance andrelationship among environment, trade, foreign, finance and industrial-sector ministries, andthe role of central government in coordinating them. This would include the involvement ofthe head of state or government. An equal and integrated role for environment ministries andagencies and the active involvement of leaders will almost certainly lead to environmentalenhancement.
4. Strength of market-oriented government policies. This includes the strength of government
polices to ensure freely functioning markets, rather than monopolistic or oligopolisticconcentrations, which are asymmetrical in their policies of access, information andaccountability, and thus tend to be environmentally harmful. It further includes governmentpolicies and interventions intended to increase efficiency and compensate for market failure,in order to affect the macroeconomic and microeconomic forces discussed above.
5. Effects of specific government policies on the environment. These potentially powerful
instruments to improve environmental quality include:
• procurement practices,• environmental management systems used by state-owned enterprises,• financial instruments such as taxes, credits, subsidies, and user fees,• government research and development, and technical assistance,• regulation, environmental assessment, and intellectual property rights,• direct environmental regulation of producers and consumers, and• conservation programs.
6. Environmental surveillance and enforcement. High capacity and performance ofgovernments in environmental surveillance and enforcement reduces environmental stress.
7. Trilateral cooperation at various governmental levels outside NAFTA institutions.Increased trilateral cooperation at the federal and subfederal level on environmental issuesenhances the quality of the environment.

Analytic Framework for Assessing the Environmental Effects of NAFTA
18
V. Indicators of Environmental Impacts Stemming from NAFTA
The third major component of this framework provides indicators to assess how NAFTA-associated processes generate environmental pressures and supports that affect the four majorcomponents of the ambient environment: air, water, land and living things (biota).Environmental pressures tend to increase the stress on the environment by providing a furtherload on its absorptive capacity, while environmental supports respond to these pressures, or toindependent changes in the state of the environment.
The impact of pressures, combined with that of supports, will vary according to the existing stateof the natural environment in the geographic area affected. In some cases, small net increases inpressures over supports can have a major catalytic and potentially irreversible effect on theambient environment. In other cases, a small amount of environment-enhancing intervention cangenerate large gains. Of particular interest are high impact locales—places where environmentalpressures concentrate to overwhelm the available supports.
Of ultimate interest is the cumulative impact of such pressures and supports on air, water, land,and biota, and on the aggregate indicators that help move towards an integrated understanding ofoverall ecosystem conditions and dynamics.
These four components—air, water, land, and biota—and the overall state of the environmentcan be assessed at both a general or sector/issue level. The key indicators identified here arethose which are nationally or internationally recognized in scientific and policy realms for theirimportance. They are, further, of particular relevance to the distinctive biophysical characteristicsand ecosystems of the North American region and to the environmental issues at the forefront ofpublic and policy interest in NAFTA. They should be considered in general analyses and by allsector/issue studies. Not all of these indicators will be relevant for every sector/issue study.However, this set can act as a starting point or checklist for identifying environmental effects,while more detailed sector/issue specific indicators are being developed and analyzed.
The following list concentrates on those indicators where reliable cross-national data is currentlyavailable, so that application of this framework might proceed immediately. Within each of thefour domains of the ambient media, an effort has been made to include indicators relating to themajor environmental pressures, states, and supports or responses.
A. Air IndicatorsMost generally, air, the atmospheric environment, includes local and regional air quality,pollution levels, and broader processes such as stratospheric ozone depletion and climate change.Specific indicators for examination include the following:
1. Acid precipitation. The acidification of lakes and rivers diminishes their ability to supportaquatic life. Acid precipitation and dry deposition, caused principally by emissions andconcentration of sulfur oxides (SOx), primarily sulfur dioxide (SO2), damage ecosystems aswell as buildings and highways, cause forest damage, accelerate leaching of metals fromrocks and soils and decrease agricultural outputs. Effects on humans include eye and

Analytic Framework for Assessing the Environmental Effects of NAFTA
19
respiratory system irritation. Children and those with respiratory disease are particularlysusceptible to harm.
2. Ozone (O3)concentration. Ground-level ozone, the primary component of smog, is animportant air pollution problem shared by all three countries. High concentrations can lead toinflammation of the respiratory tract, respiratory illness in children, reduced pulmonaryfunction, a decreased capacity for work and exercise, and even death. Individuals with heartor lung disease are more susceptible to all of these symptoms. It also damages crops andornamental plants. Principal ozone precursors (in combinative reactions catalyzed bysunlight) are the following:
• Nitrogen oxides (NOx). These ground-level ozone precursors also contribute to acidprecipitation, dry deposition and photochemical smog. They are chiefly produced by high-compression internal combustion engines, as well as by some industrial furnaces, and bylightening.
• Volatile organic compounds (VOCs). VOCs are produced by fossil fuel combustion, as
well as by incinerators, gasoline and petrochemical vapors, paints and solvents, and variousindustrial processes.
3. Particulate matter (PM). This is a broad category of air pollutants that includes a range ofsmall solids or liquids that vary in size and chemical composition. Some particles are acidic“acid aerosols.” There are particle categories that include toxic substances, such as heavymetals, polycyclic aromatic hydrocarbons, as well as numerous other organic compounds.Anthropogenic sources include industrial activities, incineration, agriculture, construction,and mobile sources. PM is commonly divided by size fraction:
• PM10 consists of fine particles 10 micrometers or less in diameter. These inhalableparticles have been implicated in chronic lung disease since 1979. They are also associatedwith pulmonary and heart disease and are major contributors to urban haze. PM10 canreside in the atmosphere for hours or days before settling to earth.
• PM2.5
refers to the smallest and most dangerous particulate matter, those particlesmeasuring 2.5 micrometers or less—an estimated 60 percent of PM10 particles. They mayinclude a wide range of toxic metals and chemicals as well as sulfates and nitrates. PM2.5have been implicated in cardiorespiratory illnesses, premature death due to respiratorydisease, reduced pulmonary function, and bronchitis.
• Elemental metallic particulates. These can include toxic heavy metals, such as mercury(Hg) and lead (Pb). In biological systems, these are persistent and bioaccumulative, causingcancer, birth defects, organ damage, and disorders of the nervous system. Mercury,especially, can volatilize and be reinjected into the atmosphere by a variety of mechanisms,moving hundreds or thousands of kilometers from its original sources.
4. Persistent organic pollutants (POPs). These are organic molecules, often of extremely hightoxicity, characterized by low water and high fat solubility. This causes them to

Analytic Framework for Assessing the Environmental Effects of NAFTA
20
bioaccumulate to high levels as they move up the food chain. Many POPs are pesticides—such as mirex, toxaphene, DDT, and chlordane—and others include polychlorinatedbiphenyls (PCBs), dioxins and furans, and various other byproducts of industrial processes.Some POPs are now known to function as endocrine disrupters and interfere with thefunctioning of hormones. Others may be responsible for declining sperm counts and risinglevels of birth abnormalities among certain human populations and affected animal species.
5. Carbon monoxide (CO) emissions and concentrations. This compound impedes the
absorption of oxygen into the bloodstream, causing headaches, nausea, fatigue, andimpairment of judgment. In extreme concentrations, it is lethal. Produced by mobile sourcesand fossil fuel combustion, in terms of volume, it is the single most important component ofair pollution. CO oxidizes readily in the atmosphere to form carbon dioxide, which isinvolved in the cycle of global warming.
6. Carbon dioxide (CO2). The fourth most abundant gas in the earth’s atmosphere, carbon
dioxide poses no direct threats to human health. However, the gas is implicated in globalwarming through its contribution to the greenhouse effect, and its output from combustionactivities in developed and developing countries is probably exacerbating this phenomenon.
B. Water IndicatorsAnalysis parameters for water include its quality and quantity in uses ranging from drinking toirrigation, the condition of inland, coastal, and groundwater areas, and how much of it issubjected to effluent discharges of such compounds as pesticides and fertilizers. Water is both anessential part of ecosystem and human health, and a basic resource for most economic activitiesand processes. Elements for consideration include the following:
1. Quality of drinking water. This considers the presence of such harmful contaminants asVOCs, pesticides, PCBs, semi-volatile synthetic organic contaminants, antimony, arsenic,barium, beryllium, cadmium, chromium, cyanide, fluoride, mercury, nickel, nitrate, nitrite,and selenium. These contaminants are known to cause a wide range of health problems.
2. Freshwater use (by source/sector). Overuse of water resources can result in low river flows,water shortages, salinization of groundwater in coastal areas, loss of wetlands, desertificationand declining sustainability for agriculture.
3. Lead concentration. Concentrations over threshold standards have adverse effects on human
health.
4. Copper concentration. High concentrations kill fish and cause brain damage in higheranimals.
5. Surface water pollutants. These include suspended solids, fecal coliform bacteria, and thetotal content of phosphorus, nitrates, dissolved oxygen (related to biological oxygendemand––BOD). Fecal coliform bacterial level is an indicator of the possible presence ofpathogens. Nitrates and phosphorous are the primary substances that cause eutrophication oflakes and rivers. Reduced levels of dissolved oxygen affects the ability of a body of water to

Analytic Framework for Assessing the Environmental Effects of NAFTA
21
assimilate wastewater and to support fish and aquatic plant life. Extreme conditions, such asat the mouth of the Mississippi River, result in “dead” zones incapable of supporting life.
6. Fish capture. Conservation of fish stocks requires a balance between biological productivityand harvesting rates. Lower fish captures can indicate water quality problems.
7. Sewage treatment connection rates. Discharge of untreated, used water is one of the primecauses of water contamination. This element of physical infrastructure is an indicator ofefforts, or lack thereof, to decrease pollution loads.
C. Land IndicatorsParameters related to land include soil quality and patterns of land use, including agriculture,forest cover, and natural and protected areas. Here attention should focus on soil erosion, soilconservation and other tillage methods, soil runoff (of substances such as nitrates, fertilizer andpesticide buildup from over-application), the overuse of marginal land from expandedagricultural production, land left fallow, and land conversion. Some specific indicators are asfollows:
1. Intensity of pesticide use for agriculture. This component of production, technology andmanagement is important because pesticide use adds persistent organic chemicals toecosystems. Pesticides accumulate in soils and biota and are passed on to humans throughfood and water consumption. Residues leach into surface water and groundwater.
2. Nitrogen from fertilizers and livestock. Overabundance of nitrogen may exceed theassimilation capacities of soils. The surplus may leak into groundwater or run-off of surfacewaters, contributing to eutrophication.
3. Area of forested land. Forests have many functions, including provision of timber and other
wood-derived products, recreational benefits, and ecosystem services. They provide habitatin support of biodiversity and act as carbon sinks.
4. Intensity of forest use. Clearcutting and unsustainable harvest rates cause loss of habitat andaffect wildlife survival.
5. Waste generation. This is best considered by type: household/municipal, hazardous,
industrial, and nuclear. At its most benign, waste disposal consumes land. If improperlymanaged, especially with hazardous substances, disposal can have significant impacts onhuman health and the environment.
6. Recycling rate. Recycling reduces the need for waste disposal.
D. Biodiversity IndicatorsBiota refers to overall biodiversity, i.e., all forms of living organisms, including animals, plantsand microorganisms. Industrial activities and intensive agriculture and forestry can lead to thepollution or erosion of soils, which in turn adversely affects flora and fauna. The loss and

Analytic Framework for Assessing the Environmental Effects of NAFTA
22
fragmentation of forests and wetlands (either through nonsustainable harvesting or conversion toother land uses) also results in the loss of biodiversity. Animals and plants, essential parts of theenvironment, also serve as economic resources for human activity. Indicators should reflect bothaspects. Areas of consideration include the following:
1. Number of threatened/extinct species. Many ecological processes depend on wildlife,including native mammals, birds, fish, reptiles, amphibians, plants and, especially, insects.
2. Wetlands. Wetlands store and allow the slow release of large quantities of water, provideprotection from erosion, provide habitat for waterfowl and fish, and offer recreationalopportunities.
3. Protected areas. Healthy natural habitat of adequate size is necessary for species’ survival.
E. Aggregate IndicatorsAn aggregate indicator or index consists of two or more individual indicators. All indicatorsreflect pressures, responses or changes in the state of an ambient environmental medium. Theyalso often reflect, at least indirectly, the linkage processes that lie behind them. However, it isuseful to include indicators that address change in more than one environmental medium, or thatintegrate more directly the interactions among economic, social and environmental processes.
Integrative indicators are particularly difficult to develop, given the complexity of the theoreticalcalculations involved and the need for more experimental results to substantiate them.Nonetheless, development work on several indicators has shown promise. The followingaggregate indices and integrative indicators are among those. They avoid many of the pitfalls ofindex construction by aggregating only those indicators that are measured in the same units.
1. Climate change. A commonly-used pressure index relevant for climate change is totalgreenhouse gas emissions. The index is the weighted summation of five gases that contributeto global warming: carbon dioxide (CO2), methane (CH4), nitrogen oxides (NOx),chlorofluorocarbons (CFCs) and halons. The theoretical foundation for the weights used inthe index is strong, since the weights are based on the Global Warming Potential (GWP) ofeach gas. One tonne of CO2, for instance, has a GWP of 1, while the other gases are knownto be larger contributors to global warming, per unit weight. For example, over a 100-yearperiod, the GWP of methane is 11 times greater than that of carbon dioxide, while the GWPfor CFC-12 is 7,100 times greater. Multiplying the annual emissions of each gas by its GWPtransforms the emissions into CO2 equivalents (Ceq), and then these amounts are summedacross the gases to produce the index.
2. Ozone depletion. Stratospheric ozone shields humans and other organisms from harmfulultraviolet (UV) rays. Excessive exposure to UV rays causes skin cancer, cataracts andimmunosuppressive diseases in humans and animals. It also causes degradation of materialssuch as rubber, wood and plastics, and slows plant growth. The damage to the ozone layercaused by CFCs, halons and other ozone-depleting gases, depends on their residence time inthe atmosphere and the rapidity with which they contribute to the decomposition of ozone.These two factors determine the ozone depletion potential (ODP) of ozone-depleting gases.
Analytic Framework for Assessing the Environmental Effects of NAFTA
23
An ozone depletion pressure index can be formed by multiplying the emissions of CFCs andhalons individually times their ODP and then summing the products. Since generation—orthe atmospheric liberation (in the case of CFCs)—of these substances is assumed to becorrelated with emissions, and since production data are usually more readily available thanemissions data, it is convenient to use production rather than emissions data in the index.Indicator weights deriving from the ODP have scientific backing, and therefore overcome thesubjectivity inherent in the weights found in many types of environmental indices.
3. Acidification. The three main acid gases incorporated in an acidification index are sulfurdioxide (SO2), nitrogen oxides (NOx) and ammonia (NH3). The contribution of each gas tothe acidification of atmospheric water vapor or surface lakes and rivers is weighted by itsacidic potential and expressed in acidification equivalents.
4. Eutrophication. Two major contributors to the eutrophication of water bodies are nitrates andphosphates. This index aggregates emissions of nitrogen and phosphorous, using a weightingscheme that accounts for their potential eutrophication effect.
5. Cost of environmental remediation. The cost of environmental remediation refers to the costof cleaning up polluted or degraded environments and reducing pollution generated byhuman activity. Examples of remediation include building sewage treatment plants, cleaningup contaminated soil, installing pollution control devices in industrial plants, and replantingforests. This index is particularly attractive because it combines measures of the economy(including production, management and technology, physical infrastructure, socialorganization and government policy) and the environment.
6. “Ecological footprint.” Although extremely complex to apply, this index is useful, as itproduces results that are easy to visualize. It estimates the total land area needed to produceall of the resources consumed by the population of a specific geographic unit (e.g., a city orcountry) and to assimilate the wastes discharged by that population.
7. Energy intensity. Greater efficiency in energy production and use reduces environmentalstresses. This indicator also combines measures of the economy and the environment, anddoes so from a preventative rather than remedial perspective.
8. Human health costs of environmental pollution. Polluted air, water and land result inquantifiable hospital and health care costs from the illnesses they cause, which can becalculated and used as an indicator.
9. Energy mix (by source: coal, oil, gas, nuclear, hydro, other). This component of production isimportant because higher reliance on fossil fuels in the energy mix is associated with moresevere local and regional air quality problems and with greater production of greenhouse gasemissions.
10. Biological integrity. This index can reflect the cumulative effect on natural ecosystems of awide variety of chemical and physical stressors on natural ecosystems, and the extent towhich the ecosystem supports healthy biological communities.

Analytic Framework for Assessing the Environmental Effects of NAFTA
24
VI. Conclusion
This framework is offered to individuals, institutions and governments to assist in understandingthe linkages between environmental and trade policies. Such an understanding will assist theCommission for Environmental Cooperation, and its constituents in North America, to protectand enhance the environment in the face of expanding economic activity and build synergiesbetween the two policy areas. The CEC encourages individuals and organizations to apply theframework to priority sectors and issues in North America. As past experience suggests andfuture application will confirm, the use of this framework is a dynamic process and furtherdevelopment will be required as the base of our empirical evidence expands and the analyticlinkages become clearer and more refined. The CEC is committed to continuing to work bothempirically and analytically on issues that link trade and environment—the ultimate goal being abetter North American environment, a mission all North Americans share.

Part II: User’s Guide to the Final Analytic Framework

Analytic Framework for Assessing the Environmental Effects of NAFTA
26
Developing and applying an analytic framework to assess NAFTA’s environmental effects is acomplex and challenging task. Throughout the process, difficult but informed choices must bemade to pursue particular methodological paths, emphasize specific variables and relationships,and focus on priority uses—taking into account the distinctive features of NAFTA, the NorthAmerican economy and its environment. Above all, such a framework must reflect the fact thatNAFTA is only one cause of economic and environmental change in North America.
This background document details how the present analytic framework constructed to assessNAFTA’s environmental effects has dealt with these complexities. It has three central purposes:
• to identify and explain the analytical and methodological choices made in constructing theFramework;
• to provide basic background information about the characteristics of the North Americaneconomy and environment that were relevant in shaping the Framework; and
• to report the empirical results of preliminary applications of the Framework.
In designing this Analytic Framework, five considerations have been fundamental.
1. The first is the focus on NAFTA in particular, rather than on trade or trade liberalization ingeneral, taking into account the comprehensive and innovative character of the NAFTA“regime.” This “regime” is construed as including the principles, norms, rules, and decision-making procedures specified in the NAFTA agreements, together with the institutions theycreated. The NAFTA trade agreement itself covers a broad set of subjects. It deals not onlywith trade but also with investment and several other aspects of economic life.
NAFTA contains changes to the principles and rules governing North American commerceand related activities. In addition, to apply, interpret and extend the Agreement, it alsocreated or catalyzed the subsequent emergence of about fifty trilateral intergovernmentalinstitutions. NAFTA was accompanied by two “parallel” or “side” agreements—one for theenvironment and one for labor. These are the North American Agreement on EnvironmentalCooperation (NAAEC), and the North American Agreement on Labor Cooperation(NAALC). Each agreement established a new institution: the Commission for EnvironmentalCooperation (CEC) and the Commission for Labor Cooperation (CLC), respectively.Together these institutions represent a new network of North American oversight.
In assessing NAFTA’s environmental effects, it is important to include the specific newprinciples and rules brought about by NAFTA, the way they have been implemented andaltered in practice by the NAFTA institutions, and their relationships with the rules andinstitutions of parallel environmental and labor agreements.
2. This framework distinguishes clearly between environmental processes that are associatedwith NAFTA and those that are not. It begins with a comprehensive and precise conceptionof what “NAFTA” is, both to avoid falsely attributing to the trade agreement changes whosecauses lie elsewhere, and also to capture the range of effects that NAFTA may have on theNorth American environment. Therefore, in designing the framework, care was taken to

Analytic Framework for Assessing the Environmental Effects of NAFTA
27
focus on major relationships and consider factors not related to NAFTA that causeenvironmental change.
3. It is also important to consider both the direct and indirect effects of NAFTA, and the manyprocesses through which NAFTA may ultimately affect the environment. In order to do thisthe framework is constructed and outlined in a linear fashion. It begins with the contextwithin which NAFTA operates in relation to the entire region or to a particular sector or issueof interest. It next considers NAFTA’s rules and institutions and their trade and transborderinvestment effects. It then addresses “linkages to the environment”—formed by processes ofproduction, physical infrastructure, social organization and government policy. Theseprocesses might be affected by the NAFTA-induced changes in trade and investment and inturn may shape how such change affects the ambient environment. Finally, the frameworkexamines the resulting environmental pressures, supports and changes to air, water, land andliving things.
4. This framework is flexible in its application. In outlining and applying it in a linear way,three factors must thus be kept in mind. First, NAFTA’s rules and institutions may have adirect impact on the four processes of production, physical infrastructure, social organizationand governmental policy, without these processes first affecting or being transmuted byaltered trade and investment patterns. Second, the analytical linkages between variableswithin the framework are complex and multidimensional, and contain many feedbackloops—notably the way in which changes in the ambient environment themselves affectNAFTA’s rules and institutions and the trade and investment associated with it. Third, this isa flexible framework that can be applied by starting at any point of key interest, such asenvironmental change, and tracing the relationships to other variables associated with it.
5. While focusing on the North America experience, this framework forms part of a largereffort to identify and improve the analysis surrounding the environmental effects of tradeliberalization agreements. It builds on and contributes to existing studies within thegovernments and research communities within and beyond North America. Several recentlypublished studies provide guidance on addressing components of NAFTA‘s effects, notablyits effects on trade (DFAIT 1997; US TR 1997a, 1997b; US ITC 1997a, 1997b). Now,however, more than five years after NAFTA formally came into force, there is still nocomprehensive analysis of effects that NAFTA has had on the environment in NorthAmerica.
I. Methodological Issues
This Analytic Framework has been designed to meet the needs of multiple users, from thoseseeking to understand NAFTA’s effects on the ecology of North America as a whole, through tothose concerned about NAFTA’s relationship to a particular environmental issue or problem inone local area or sector within one country of North America. The framework has thus beenfashioned so that it may be applied at many different levels of analysis, from the most macro tothe very specific, including ultimately the activities of individual communities or firms. Atpresent, it may be applied both generally and to specific issues or sectors. In all cases it examinesin turn the NAFTA regime and associated trade and investment flows, and traces four major

Analytic Framework for Assessing the Environmental Effects of NAFTA
28
processes through which activity generated or affected by NAFTA’s rules and institutions affectsthe region’s environment.
A. Level of Application in the AnalysisAt present, the framework may be applied most readily to individual sectors of the NorthAmerican economy, or to particular environmental issues within or across such sectors. In orderto encourage a close look at pressing concerns, and particularly those that contribute to a largerand ultimately comprehensive understanding of the dynamics of the region as a whole, it isuseful to develop criteria by which to select sectors and issues for priority application.
Selection of SectorsTo maximize overall understanding of NAFTA’s environmental effects, the following fivecriteria may serve as a guide for the selection of sectors:
1. The sector must relate directly to major environmental media and natural resources.2. The sector has been the subject of changes in the economic rules set by NAFTA.3. The sector has experienced changes in trade during the post-NAFTA period.4. The sector has involved new direct foreign investment among NAFTA parties since 1994.5. The sector is one where one might expect, a priori, that there would be important effects
attributable to NAFTA.
During Phase II of the NAFTA Environmental Effects project, several sectors of the NorthAmerican economy were considered in light of these criteria. On the basis of this, the agricultureand energy sectors were chosen as those warranting priority attention.
In the case of agriculture, the large variety of major crops and livestock grown and traded withinthe NAFTA region produce a broad range of environmental issues. Such priority environmentalissues include: possible effects on the Canadian dairy, poultry, grain, and oilseed industries fromNAFTA-enhanced trade and expanded US production and competition; Mexican imports of UScorn and exports of fruits and vegetables; and use of water, fertilizers and pesticides. Theagriculture sector is a central concern for public policy and the subject of muchintergovernmental and trilateral institutional activity throughout the NAFTA area. Some of themajor public policy issues raised by the agricultural sector in North America relate to theimplications of recent reforms in Mexican agricultural law, the increasing incidence ofagricultural non-tariff barriers throughout the NAFTA region, and the dismantling of Canada’ssupply-managed milk, dairy, egg and poultry industries. Much of the relevant agricultural tradeand related investment was directly or indirectly affected by NAFTA.
Energy also emerged from an application of these criteria as a leading sector for priorityattention. From its generation, transportation, and transmission to the efficiency of its ultimateuse, energy has a comprehensive impact on the North American environment. Its effects arepervasive, as it is a critical input for all economic sectors and individual households. NAFTA hasmade several specific changes to the rules for trade and investment in the energy sector, andgovernments of the NAFTA Parties have concurrently been in the process of major policychanges at their national levels. These NAFTA-associated changes in trade and investment,

Analytic Framework for Assessing the Environmental Effects of NAFTA
29
combined with such other forces as the advent of the “open grid,” are rapidly bringing a fullyintegrated North American marketplace into being.
Selection of IssuesWithin and across these broad economic sectors, this framework allows analysis of specificissues of environmental consequence. The five criteria for identifying specific issues for analysisare as follows:
1. The issue must relate directly to major environmental media and natural resources.2. The issue is significant from an environmental perspective.3. The issue bears some important relationship to the integration of the North American
economy through NAFTA rule changes, government policy changes, institutional changes,investment changes or direct trade impacts.
4. This analysis will contribute to an understanding of other issues of importance in NorthAmerica.
5. This analysis will contribute to tracing linkages among the elements affected by NAFTA andthe agreement’s impact on the environment.
In Phase II of the project, these selection criteria were applied within the broader economicsectors identified previously. Their application yielded three specific issues for analysis: maize inMexico, feedlot production of cattle in the United States and Canada, and electricity in NorthAmerica. This provided a balanced array of issues involving all three countries (electricity), twocountries (cattle), and one country (maize).
One study examined the impacts of imports and attendant domestic liberalization in the Mexicanwhite corn sector and its ultimate effects on the environment. An important contribution hadseemed likely from a careful identification of ecologically beneficial effects of NAFTA-inducedchanges in the maize economy. In part, this was because NAFTA rule changes have altered tradeand investment flows in the agricultural industry, with many of the most significant changestaking place in the US-Mexican agricultural trading relationship. At the same time, Mexico hasreformed its agricultural and subsidy policy relating to maize. NAFTA-induced policy changesand rule changes could generate both positive and negative environmental effects over a broadrange of variables affecting, in particular, land, water and biodiversity. Maize was thus a richissue from an environmental perspective. Through the exploration of the complex environmentalvariables related to its production and use and an examination of the NAFTA rule changes andNAFTA-induced policy changes surrounding this issue, it was one that promised to serve as auseful model to clarify some of the linkages between trade liberalization and processes(including technological adaptation and social organization) that affect the environment.
Such a clear NAFTA connection was also evident in the case of concentrated cattle feedlots. Inan effort to take advantage of the new trading environment, firms are rationalizing cattleproduction in North America. Environmental impacts and regulatory changes have occurred as aresult of more concentrated feedlotting of cattle in particular areas of the United States andCanada. This study thus examined the environmental impacts of the altered structures of thisindustry, and its relationship with cross-border trade in livestock and feed grains. Theconcentrated feedlot production of both cattle and hogs has been an emerging problem in Canada

Analytic Framework for Assessing the Environmental Effects of NAFTA
30
as well as the United States, as Canadian meat producers have sought to take advantage of amore favorable post-NAFTA regulatory structure. In Mexico, imports of US feed grains areposing challenges for producers of more traditional grains, notably maize. This made the studyespecially important—not only for the livestock sector, but also as it relates to the feed grain andfood grain needs of North America.
The issue study on electricity in North America examined the environmental implications of theincreasing potential for trade in electricity, fuels and related technologies. Electricity sectors inNorth America are undergoing a process of significant structural change. Traditional industrystructures are being exposed to new types of competition, which are being introduced largely as aresult of the gradual easing of restrictions on who can generate, transmit, distribute and sellelectricity. There is also increasing interest in the potential for cross-border trade in electricity—both between Canada and the United States, and between the United States and Mexico. InCanada and the United States, the trend is toward deregulating the access to transmission for sub-federal public utilities. This important public policy issue is generating a great deal of interest inNorth America. As well, if impacts could be ascertained in the Canadian-US relationship, theymight emerge in the Mexican-US relationship. Here trade was likely to increase at a much fasterrate as the Mexican electricity sector underwent similar forms of liberalization. A Canadian-USanalysis could point to policy implications that might be expected in the Mexican-USrelationship and even in the emerging Canadian-Mexican relationship.
B. ModelingAt the different levels of analysis, this framework can be applied through various qualitative(even anecdotal) and quantitative methods, including partial and general equilibrium economicmodeling and ecological modeling. In all cases, these methods—employed alone or incombination—should integrate the major variables that appear in the framework, including legal,economic, institutional, social, political and ecological factors.
Relevant Modeling Efforts Currently AvailableAs a foundation for applying and developing this framework through quantitative modeling-based approaches, a brief review of recent relevant work in the field of trade and theenvironment may be useful.
By definition, a model is a simplification designed to represent a system; if it is computable, it issupported with statistical data (see Kmenta 1971). An economic model attempts to represent thestocks and flows of an economy to determine and forecast demand, supply, consumption,production, and the like.1 A trade model extends this analysis to include cross-border flows ofimports, exports and, where possible, mobile factors such as capital and labor. Suchdeterminations and forecasts are subject to numerous errors, ranging from the statistical andtheoretical to the empirical (see Hayo 1998; Hendry 1997). Broadly speaking, empiricaleconomic trade models are divided into computable general equilibrium (CGE) models and
1 Hendry (1997) describes the success of econometric forecasts as a function of four factors: (1) There areregularities to be captured. (2) These regularities are informative about the future. (3) The proposed method capturesthese regularities. (4) Excluded are nonregularities that swamp the regularities.

Analytic Framework for Assessing the Environmental Effects of NAFTA
31
partial equilibrium (PE) models.2 In CGE models, supply and demand for all goods are treatedsimultaneously in all sectors and countries under analysis. In PE models, by contrast, the focus ison a single industry or sector, so that connections with other sectors are left out in the interest ofmore detailed analysis.
At the same time that economic trade models have been developed, considerable effort hasoccurred in the last decade at modeling the environmental impacts of economic activity. Much ofthis work revolves around environmental indicators (see Farrell and Hart 1998). Canada wasamong the first to develop an environmental indicators program (in 1989), and published plansfor sustainability based on these indicators in 1993. Similar efforts are now underway in othercountries, based especially on various versions of the OECD “pressure-state-response”framework. Efforts have also been made to incorporate environmental values in the System ofNational Accounts (SNA), using “green accounting” or “satellite accounts” (UN 1993; Repetto1992). The newer Index of Sustainable Economic Welfare (ISEW) adjusts standard economicaccounting measures, such as income and consumption, for pollution-reduction expenditures andenvironmental degradation (Stockhammer et al. 1997).
Notwithstanding the progress in this area, there is no consensus over appropriate indicators forthe environment comparable to those long used in economics. More importantly, this lack ofconsensus has hampered theoretical and empirical efforts to marry economic and environmentalindicators in a synthetic model incorporating both effects. The simplest of these exercisesinvolves linking trade data on export growth, for example, to indicators of “pollution intensity”in sector-by-sector studies (see Ferrantino and Linkins 1996; Runge et al. 1997). This work, andother hybrid trade-environment models discussed below, relies heavily on the pollution intensitydata set developed for US manufacturing by Hettige and colleagues, the Industrial PollutionProjection System (IPPS), at the World Bank (Hettige et al. 1995: Lucas et al. 1992).3 Pollutionis measured in terms of toxic pollutants in water, air, and land; bioaccumulative toxic metals inair, soil and water; air pollutants such as SOx, NOx, and CO, volatile organic compounds (VOC)and particulates; biological oxygen demand (BOD); and total suspended solids (TSS).
The other main data set on environmental impacts used in economic analysis of environment-trade linkages is that produced by the Global Environment Monitoring System (GEMS), whichhas been recording SO2 concentrations in major urban areas in 44 countries since the early1970s. This monitoring system was initiated by the World Health Organization (WHO), and hasformed the basis of work by Grossman and Kreuger (1992) and various studies by Taylor andcoauthors, to be discussed below.
Recent work in the development of economy-wide CGE models, led in part by researchers at theOECD Development Centre, has begun to show promise in linking trade to these environmentalimpacts. Illustrative are empirical assessments of trade-environment linkages by Beghin andvarious coauthors (Beghin et al. 1995; Beghin and Potier 1997; Beghin et al. 1997). These efforts
2 This discussion is based in part on the thoughtful review comments of Michael J. Ferrantino (1998) and his citedreference to Francois and Reinert (1997) and US ITC (1997b).3 The IPPS draws from the US EPA Toxics Release Inventory for 1987 to calculate total releases for 320 toxicsubstances, weighted by the risks estimated by the EPA Human Health and Ecotoxicity Database. Particularly usefulis the World Bank web site: <http://www.worldbank.org/nipr/polmod.htm>.
Analytic Framework for Assessing the Environmental Effects of NAFTA
32
derive from the OECD Development Centre’s prototype CGE model, applied to a variety ofspecific countries and sectors.4 Beghin et al.(1995) adapted the OECD model to Mexico, creatingthe Trade and Environment Equilibrium Analysis (TEQUILA) model, which has the importanttechnical advantage of deriving pollution emissions from intermediate as well as finalconsumption. This contrasts with input-output (Leontief) models, in which the only way toreduce emissions is to reduce final demand (see Dessus et al. 1994). The TEQUILA model linksconsumption to pollution using the thirteen pollutant parameters noted above, including toxicpollutants, bioaccumulative toxic materials, air pollutants, particulates, and water pollution.
Three dynamic features of the TEQUILA model bear emphasis. These include growth in laborsupply and capital stock, productivity growth, and the flexibility with which new capital issubstituted for old.5 The model is calibrated using a detailed social accounting matrix forMexico, with eight labor categories and 20 households, divided evenly between urban and rural.Trade is modeled assuming goods are differentiated with respect to region of origin anddestination, and distortions are expressed as ad valorum tariffs for 22 agricultural sectors and 14processing sectors.
Results from the TEQUILA model indicate that economic integration in Mexico, measuredagainst a 1990–2010 base trend, will result in less pollution-intensive activity, but also inincreases in the scale of economic activity. Increases in total emissions will require targetedenvironmental interventions to be mitigated. Results are presented for a sequence of threereforms: environmental tax reform, trade liberalization, and a combination of trade andenvironmental reforms. In effect, the model allows separate judgments about the environmentaleffects of trade liberalization without accompanying environmental reforms, the environmentalimpacts of taxes designed to compel companies to deal with the environmental repercussions oftheir activities, and the joint effect of liberalization accompanied by such environmental taxes.
In the cases of environmental tax reform or trade liberalization taken alone, Mexican output fallsmoderately, but trade liberalization alone induces expanding sectors (e.g., rice, horticulture,coffee and honey) to become more pollution intensive. Only when trade reforms are combinedwith environmental reforms is expanded GDP accompanied by emissions decreases in almost allsectors (Beghin et al. 1997, pp. 124–130). It is this combination, or balance, that has been at thecenter of several proposed trade/environment policy reforms (see Beghin and Potier 1997; Rungeet al. 1994). Broadly speaking, the value of the TEQUILA model is that it allows examination ofcomplicated effects in various sectors and subsectors due to economy-wide changes inenvironmental and/or trade policy. In this respect, it offers a very promising tool in assessingpotential issues and trouble spots as changes occur under NAFTA. 6
4 Beghin and Potier (1997) also present a review of evidence on the impacts of trade liberalization using the scale,composition and technique effects first developed by Grossman and Krueger (1992).5 More technically, TEQUILA is a recursive dynamic model, so that each period is solved as a static equilibriumproblem given an allocation of savings and expenditure on current consumption. It has 92 sectors. Labor supply isgiven exogenously, while capital stock evolves with investment activity. Productivity is given by attributingefficiency factors to capital, labor by occupation category, and energy. Capital stock and its vintage are influencedby the time path of total and sectoral allocation (Beghin et al. 1995, p. 781; Beghin et al. 1997, p. 119).6 For example, it shows surprising increases in toxic emissions in the production of honey after trade liberalization,even with environmental reforms (Beghin et al. 1997, p. 129).

Analytic Framework for Assessing the Environmental Effects of NAFTA
33
A similarly detailed modeling effort, led by Hertel and colleagues, is the Global Trade AnalysisProject (GTAP). Here a CGE model is used for sectoral evaluations of trade liberalization inagriculture, forestry, fisheries, mining, processed food and beverages, textiles, and woodproducts (see Hertel, ed. 1997).7 While this model has been used to examine some environmentalissues, such as global climate change, it has been less specifically targeted to these impacts thanthe TEQUILA model. However, it has proven useful in showing the relative differences ineffects from CGE models and partial equilibrium models (Tsigus et al. 1997). This work alsoallows comparison of GTAP estimates with partial equilibrium studies based on such models asthe Static World Policy Simulation (SWOPSIM) used by the US Department of Agriculture toestimate trade impacts for 22 food and agricultural commodities and 36 countries/regions of theworld (Roningen 1986). The GTAP work on climate change concludes that partial equilibriummodels that incorporate processing sectors produce satisfactory results in estimating prices andquantities, although they understate effects occurring through labor and capital markets (Tsiguset al. 1997, p. 302). Other applications of the GTAP modeling framework to forecasting includeAnderson et al. (1996).
In a 1999 evaluation of environmental standards harmonization in the Western Hemisphere,Tsigus et al. (1999) used the GTAP model, as expanded by Perroni and Wigle (1997), toexamine 24 regions and 37 aggregates.8 Due to insufficient international data, pollution emissionestimates for soil erosion, pesticide runoff and livestock waste were drawn from US sources. Soilerosion estimates were based on US experience with the Conservation Reserve Program (CRP)(Osborne 1995). Estimates of pesticide runoff were based on the environmental impact quotient(EIQ) developed by Kovach et al. (1992). Amounts of livestock pollution were extrapolated fromnitrogen emission rates based on US Soil Conservation Service estimates (SCS 1992).Manufacturing pollution was based on the World Bank data set of Hettige et al. (1995). Like thework of Beghin et al. (1997), the study by Tsigus et al. (1999) explored the impacts of tradeliberalization with and without accompanying environmental taxes harmonized across theWestern Hemisphere. They considered both absolute (US) levels of environmental policyharmonization and relative (i.e., differentiated) harmonization, in which environmental taxeswere less stringently applied in Latin American countries. Their results indicate thatenvironmental policy intervention, together with trade liberalization, is most beneficial whenapplied at less-than-US levels in countries such as Mexico, Argentina and Brazil, but is clearlypreferable to no environmental intervention and trade liberalization. As Tsigus et al. (1999, 20)noted: “relative environmental policy harmonization does not greatly diminish gains fromregional trade policy liberalization and it appears to be preferable to absolute harmonization.”
Several other economy-wide modeling efforts bear mention. They include work undertaken toestimate impacts of multilateral trade liberalization by or in cooperation with the World TradeOrganization (WTO) Secretariat, such as work quantifying the likely impacts of the UruguayRound of multilateral trade negotiations. Harrison et al. (1997) used a CGE model of 24 regionsand 22 commodity groups to assess the impact of the Uruguay Round, and compared these
7 Documentation of the model and its uses by other modeling groups in Australia (ABARE), the Netherlands, and atMIT and the Environmental Policy Research Institute (EPPI), is available at its Purdue University web site:<www.Purdue.agecon.edu/GTAP>.8 An earlier effort by these authors at CGE modeling of trade-environment effects suggested that trade impacts onenvironmental quality were negligible (Perroni and Wigle 1994).

Analytic Framework for Assessing the Environmental Effects of NAFTA
34
estimates with other modeling efforts using a base year of 1992. They found that the world as awhole gains from $96 billion to $171 billion annually, depending on model assumptions, withgains concentrated in the developed countries. This was compared to earlier work by a team atthe GATT/WTO Secretariat, which found global gains of $510 billion in 1990 dollars, projectedforward to 2005 (Francois et al. 1994). When Francois et al. (1995) also used 1992 as a baseyear, their estimate was $193 billion, within one standard deviation of the Harrison et al. (1997)counterpart model. Neither of these efforts explicitly linked these results to environmentalimpacts or indicators.
Robinson developed a CGE model of trade liberalization that explicitly accounted for pollutionexternalities, prior to the development of the “pollution intensity” data noted above. One sucheffort developed a multisector, economy-wide CGE model in which pollution and pollutionabatement were explicitly included in a social welfare function, and were joined in a nonlinearprogramming model (Robinson 1990). Similar models have also been applied to US-Mexicanmigration and agricultural policies under NAFTA (Robinson et al. 1993).
Another CGE model, developed at the University of Michigan, the Brown-Deardorff-Stern CGEModel of World Production and Trade, has been applied to NAFTA and its potentialenlargement to include Chile, Argentina, Colombia and Brazil (Brown et al. 1995). Although noexplicit environmental effects were modeled, the Brown-Deardorff-Stern work is capable of suchenlargement. The model has already been enlarged to include a services sector (Brown et al.1996).
In an application to Morocco, Diao and Roe (1998) used an intertemporal CGE model toconsider the impact of trade liberalization on water prices and the potential for water tradingschemes. Essentially, they showed that by expanding trade in intensive water-using crops such asfruits and vegetables, the price of water is driven up, putting pressure on policies which subsidizeand distort water markets. This argument is likely to have considerable relevance to Mexico.
Although it is often argued that models have difficulty capturing investment and technologychanges, recent efforts suggest that at least some aspects of these changes can be assessed. Workongoing at the World Bank, for example, has sought to capture the environmental implications ofshifting investment and technology under trade liberalization (Cruz et al. 1997; Munasinghe etal. 1996). Using the CGE model to analyze the effects of public infrastructure investments onMexican national income, Feltenstein and Ha (1999) showed that such investments have rapidlydecreasing benefits.
Apart from CGE models, several authors have used theoretical simulations to explore varioustrade-environment linkages. Abrego et al. (1998) explored the strategic incentives that drivecountries to link environmental issues to trade liberalization (see Hauer and Runge 1998). Themain result was that a joint trade-environment negotiation provides leverage to developingcountries that they lack in a trade-only negotiation.
Papers by Taylor and various coauthors (Copeland and Taylor 1994, 1995, 1997, 1999; Branderand Taylor 1997a, 1997b) have explored the decomposition of trade liberalization and its effectson the environment, following the work of Grossman and Kreuger (1992), in which the

Analytic Framework for Assessing the Environmental Effects of NAFTA
35
composition of national output due to trade reforms, and its pollution intensity, was estimated(see Runge 1995). These studies rely on environmental data from the World HealthOrganization’s Global Environmental Monitoring System (GEMS), noted above. The most well-developed empirical application is Antweiler et al. (1998), in which a simple model highlightsthe interaction of factor endowments and income differences in determining the pattern of trade.
In particular, using multi-country panel data, Antweiler et al. (1998) distinguished scalarincreases in economic activity (the scale effect) of trade liberalization resulting from cleanerenvironmental technologies consequent to increases in income (the technique effect). Theauthors found that a one percent increase in the scale of economic activity increased pollutionconcentrations by 0.25 to 0.5 percent, but the accompanying increase in income drove thesesame concentrations down by more than one percent. By analyzing the sensitivity of countrycharacteristics in determining the impacts of trade openness, they showed trade liberalization tohave a relatively small impact on pollution concentrations. Using data from 40 developed anddeveloping countries, they confirmed the earlier, more restricted findings of Grossman andKreuger that trade liberalization induces positive changes in production techniques thatultimately offset negative environmental scale effects. Finally, they found that pollution inducedby economic growth is directly tied to the sources of this growth: income gains due to trade or(neutral) technological progress lower pollution, while those due to capital accumulation raise it.
Data Needs and LimitationsThere can be little doubt that the accumulation of better data will assist in advancing these andother modeling efforts. The paucity of data is greatest involving the environmental impacts oftrade. The definition of environmental “damage functions,” and the metric by which suchdamage should be measured, are both underdeveloped, as are the data to support them. As notedabove, the two most well-developed efforts are the data sets on manufacturing pollutiondeveloped by Hettige et al. (1995) at the World Bank, and the Global Environmental MonitoringSystems (GEMS) data set on urban pollution developed by the World Health Organization. Otherenvironmental indicators, such as those employed by Tsigus et al. (1999), use US data to projecteffects for the entire Western Hemisphere. The pollution intensity of estimates of the WorldBank are also primarily based on US EPA data.
A very substantial need exists to replicate these estimates for the United States elsewhere,notably in developing countries. In addition, some of the other efforts at environmental indicatordevelopment noted above (e.g., Stockhammer et al. 1997) might usefully be linked to trademodels. It is especially critical to examine the ways in which trade is supposed to driveenvironmental changes, since these mechanisms are still very imperfectly understood. Work byTaylor and colleagues (e.g., Antweiler et al. 1998) has focused especially on disentangling thecomplex paths by which such effects occur. As observations on pollution and its abatement aredeveloped into data sets for other parts of the world, it will be important to extend theseobservations over time, so that trends and patterns related to economic expansion and businesscycles can be better understood. In the final analysis, both cross-section (multiple country andregion) and time-series (multi-year) data will be needed.

Analytic Framework for Assessing the Environmental Effects of NAFTA
36
Foreign Direct Investment and Technology TransfersForeign Direct Investment (FDI) and the international transfer of technology are notoriouslydifficult to model (Deardorff 1999). There exists little clear consensus over the behavioralfoundations driving either type of activity, The theory translated into modeling equations orparameters, when attempted, is largely ad hoc. This is an especially glaring problem from theperspective of developing countries, where both FDI and technology transfer are among the mostimportant factors conditioning economic growth and development. As noted above, work at theWorld Bank has begun to try to capture these effects and their environmental implications (Cruzet al. 1997; Munasinghe et al. 1996).
Research by Antweiler et al. (1998) revealed the critical importance of these issues for trade-environment analysis. For example, disaggregating scale and technique effects is a preconditionfor determining the relative environmental impact of income transfers versus FDI. As Antweileret al. (1998, n. 1) note: “income transfers across countries raise national income but not output,whereas foreign direct investment raises output more than national income.” If the techniqueeffect is primarily a function of income expansion and the scale effect is primarily a function ofoutput, separate estimates of these effects will be needed to distinguish the consequences of FDIfrom income transfers.
This analysis indicates that, at present, existing economy-wide and ecology-wide quantitativemodels show promise. However, they have thus far been generally less useful than moresectorally and qualitatively focused approaches in relating economic change to environmentalimpacts. Forging such a relationship is a central concern of this framework. While some helpfulwork is available correlating changes in trade and investment by sector with the pollutionintensities of those sectors, such analyses still do not incorporate important differences inproduction and technology among the three NAFTA countries or other intervening processessuch as those identified in this framework. Efforts to realize the potential of quantitative modelsshould focus on generating the required data from all NAFTA countries, linking trade withenvironmental indicators, and identifying how the different processes unleashed by NAFTA-associated trade and investment liberalization affect the environment in distinct ways. Theexisting, limited state of such modeling efforts should not, however, deter or delay efforts tobuild new models or applications relying on other quantitative or qualitative techniques.

Analytic Framework for Assessing the Environmental Effects of NAFTA
37
II. Empirical Background
These methodological considerations have helped shape the development of a framework thatexamines in turn the rules and institutions that form the NAFTA regime, the trade andtransborder effects associated with them amidst other economic forces, and their impact onlinking processes and the environment. This section of the paper examines the variouscomponents of the framework, outlining in detail the variables and hypothesized relationshipsincluded, explaining their selection, and reporting relevant recent evidence as a guide to furtherapplication and development.
A. The Broader ContextThe environmental impact of an activity will often be determined by a range of forces, manyunconnected to NAFTA. It is thus necessary to identify and take into account throughout theanalysis, environmental, economic, social, geographic and political factors that have animportant effect on a particular issue or sector. By identifying the relevant context at the start,this Framework guards against attributing to NAFTA environmental changes that are notempirically associated with it, and assists in isolating the identity, direction and force ofparticular processes that are.
It is necessary to first consider the full range of environmental dimensions of an activity selectedfor analysis. This will confirm the environmental relevance of the subject and clarify thedifference between the environmental effects of the activity itself and any deriving fromNAFTA. These environmental dimensions are considered, as subsequently in the Frameworkitself, through a pressure-state-response model. Such a model describes pressures exerted on theenvironment, the latter’s responses to them, supports arising from them and the resulting state ofthe ambient environment.
Environmental pressures include the wastes, byproducts and emissions of economic activities, asproducts and services are produced and consumed and as natural resources (particularlynonrenewable ones) are transformed in production. Environmental supports include the directprovision of environmental goods and services, such as the creation of natural protected areas,restoration of wilderness areas, and waste management practices, or indirect processes, such asthe reduction of stress on marginal lands, or activities resulting from lower subsidies for heavilypolluting fuels. The state of the ambient environment includes the condition of the major media:air, water, land and biota.
Environmental change in these media can have an important autonomous effect on economicactivity, whether NAFTA-related or not. Factors such as weather patterns, including temperatureand rainfall, affect production, distribution and trade. The dynamic complexity of ecologicalsystems as natural phenomena mean that they respond only partially to human-created change,and to the economic, social and political forces that a trade agreement creates. Yet they can exerta powerful independent effect on such economic processes as the levels of crop production, orthe generation of electricity.

Analytic Framework for Assessing the Environmental Effects of NAFTA
38
Second, the economic character of an issue will often be largely or even wholly determined by arange of forces unaffected by NAFTA, particularly in relatively large, closed economies such asthe United States. Thus, environmental impacts in an issue or a sector may be based on long-established patterns of activity in domestic macroeconomic factors, international macroeconomicfactors, and domestic microeconomic factors.
Domestic macroeconomic forces are the key economic trends that affect an issue or a sector. Assuggested in the discussion of economic modeling above, such forces include growth andproduction, demand and consumption, population and income, and prices of a product or service,as these change over time and in relation to other goods and services in the economy. Alsorelevant are inflation rates, interest rates, and credit as affected by government policy andsavings rates, and fiscal policy, including deficits and debt.
International macroeconomic factors may also be relevant. These include exchange rates thatdetermine the relative prices of domestic and international goods, and the current and capitalaccount balances that can lead to macroeconomic adjustment.
Domestic microeconomic factors may also be relevant. These include systems for banking andcredit, the size and concentration of firms in an industry and sector, and labor market dynamics.
In exploring the operation and impact of these processes, it is important to start by recalling thedifferences in the overall size and structure of the United States, Canadian and Mexicaneconomies. In overall economic size, the US$8 trillion GNP of the United States is about tentimes larger than that of Canada and 20 times larger than that of Mexico. The three countries thusrank, respectively, as the world’s first, eighth and fifteenth largest economies. Another differenceis in average income levels, where the average per capita income in the United States andCanada substantially exceed that in Mexico.
There are further important differences in the structure of the economies. Canada is a highlyopen economy, where exports of goods and services account for almost 38 percent of GDP—about three times the level in the United States. Canada is also heavily reliant on inward foreigndirect investment, having a larger share of its business sector owned by foreigners, especiallyfrom the United States, than any other major advanced country.
In addition, economic and ecological changes can be influenced by the social context in whichthey unfold and by the social institutions that sustain them. The individuals that produce andconsume do so not only in response to rational market and price incentives, but also as socialbeings equipped with a wide variety of preferences, embedded in family and communitynetworks grounded in cultural values.
One important social factor is the quantity, quality and mobility of the labor force, and itsresponsiveness to incentives (such as language and local community) other than purely marketones. Of potential relevance is the organization of the workforce into labor unions, and the rolethat they and others play in pressing for high health, safety and environmental standards, andother social improvements.

Analytic Framework for Assessing the Environmental Effects of NAFTA
39
A related factor is migration, as workers and their families move, temporarily or permanently,within a country, or to other countries within the region, in search of employment opportunitiesand family reunification. Migration, domestically and internationally, can be both a cause and aresult of environmental change.
A further social factor is the presence and strength of cooperatives, community groups and civilorganizations, notably environmental, consumer and other nongovernmental organizations. Theirimpact depends also on their resources and the property and other rights they possess. Ofparticular relevance are the associations and networks through which industry engages inenvironmental standardization on a sector- or economy-wide basis. These associations mayinvolve a broad range of stakeholders.
A final factor is culture, a dimension of relevance to sectors that are, for historical and otherreasons, highly valued by a population as an integral part of national life. For example, someCanadians may retain an attachment to publicly produced and distributed electric power or non-trade water, and Mexicans to domestic maize production and consumption for historical reasonsnot fully reducible to current economic calculations.
These social and cultural differences are expressed within political systems that also exhibitconsiderable diversity. Politically, while all three countries have federal and democratic systems,the traditionally centralized and state-dominated Mexican polity contrasts with strongersubfederal units in Canada and the United States. This is particularly notable in policy areasrelated to the environment, where an estimated 70 percent of constitutional responsibility restswith the provinces in Canada. It is also apparent in national regulatory and standards-settingsystems. Mexico’s reliance on central government regulation, for instance, contrasts withCanada, where provinces and five major multistakeholder standards-setting bodies have animportant role. It also contrasts with the United States, where states and many hundreds ofprivate standard-setting associations play a major part.
Finally, change can be influenced by the variety of geographic features—such as geology,climate, hydrology and demography—throughout North America, and within each of the threediverse NAFTA countries. Territorially, both Canada and the United States are largetranscontinental countries bordering on three oceans, with a varied climate that includes Arcticregions. Mexico includes important tropical areas. Environmentally-relevant geographicconditions vary within each country and can influence the nature, location and extent ofeconomic activity. Demographically, the 275 million consumers in the United States provide amuch larger market than the 85 million in Mexico and the 30 million in Canada. Mexico’spopulation is also, on average, younger than that of the United States or Canada.
III. The NAFTA Connection
After the context has been set, the framework identifies the content of the “NAFTA regime,” as areferent for isolating the economic and other changes that flow from it. This section identifiesways in which NAFTA is connected to these other changes, and the key components of the rulesand institutions that comprise the “NAFTA regime.”

Analytic Framework for Assessing the Environmental Effects of NAFTA
40
The NAFTA regime exerts its effects in several ways. One is the impact it may have had,through anticipatory, strategic adjustment on the part of actors, before it came into force on 1January 1994. NAFTA had already acquired an identity and impact on the consciousness ofsome of the North American public well before the agreements themselves were negotiated andtook formal effect. This began in the United States and Mexico as early as 1990 and extended toCanada after it joined the NAFTA negotiations in February 1991. The intergovernmentalnegotiations and political debates over NAFTA had a further impact through the adjustment ofnational policies. This was based in large part on domestic considerations but was also inspiredby the prospect of NAFTA and by the wish to take maximum advantage of the opportunities itoffered.
NAFTA further affects the environment in both direct and indirect ways. NAFTA’s rules andinstitutions have equipped North American governments—and, in some cases, citizens—withinstruments for improving the environment directly. However, much of NAFTA’s impact willarise indirectly, as its rules and institutions first alter trade and transborder investment flows andinteract with the production, infrastructural, social and governmental processes that createpressures on the environment or supports for it.
In some cases, NAFTA confirms and consolidates the impact of changes already underway in theprivate sector, in the national economies of the parties, and in other trade liberalization arenas. Inthese cases NAFTA exerts effects as it codifies existing or emerging practices, representing agovernmental and intergovernmental response to, reflection of, and legitimization of economicand corporate activity already underway. By putting an authoritative, intergovernmental “seal ofapproval” on emerging North American trends through NAFTA, this very act stabilizes andreinforces them. Such a NAFTA confirmation is important, as the ongoing process of tradeliberalization, economic integration and community formation underway in North America priorto NAFTA was not an inevitable trend with a certain course. The vigor of the NAFTA debateboth before and after the passage of the agreement shows that something very important was, andis, at stake.
A. NAFTA Rule ChangesNAFTA’s rules are those specified in the agreement itself and its tariff annexes. At the heart ofNAFTA are the rules dealing explicitly with a specific product or sector (including both goodsand services). Of key interest are rules that are different from, or that change, those of theCanada-United States Free Trade Agreement, the General Agreement on Tariffs and Trade(GATT) or other trade liberalization agreements in which the three countries participate.Instances where NAFTA confirms existing rules are also relevant.
In general, the rules contained in the NAFTA agreements can be taken as a fixed baseline for thepurposes of analysis. Evidence suggests that the three governments have generally complied withNAFTA to implement intended trade liberalization in accordance with the phase-out schedulesspecified (Weintraub 1997, US TR 1997a).

Analytic Framework for Assessing the Environmental Effects of NAFTA
41
Specific Rules
The specific rules of greatest relevance are the following:
1. Tariff reductions and other border measures. This refers to reductions in and other bordermeasures on a specific product. These include tariffs, quotas, quantitative restrictions, andrules of origin. NAFTA-specified reductions can be assessed according to:
• the base-level tariff among the three countries prior to NAFTA;• the degree and timing of liberalization already scheduled to take place according to other
trade agreements and unilateral national action;• the particular NAFTA tariff phase-out schedule; and• the tariffs that NAFTA parties maintain and face with non-NAFTA countries.
2. Changes affecting goods/services once imported. These include changes in productstandards and government procurement rules. For example, NAFTA’s procurement rulesrequire Mexico’s Comisión Federal de Electricidad (CFE) to consider bids from suppliers inthe United States and Canada in addition to Mexico.
3. Inputs. This refers to tariff reductions and other border measures affecting major inputs torelevant products and goods. This includes domestic measures with a similar effect.Electricity trade, for example, may be affected by tariff changes on coal or electricalgenerating equipment.
4. Substitute products. This refers to tariff reductions and other border measures affecting“like” or substitute products. Rule changes affecting a particular product or sector must beconsidered relative to changes regarding related products and sectors among NAFTAcountries and with their other trading partners. Full account must be taken of the possibilityof substitutions encouraged by the differential reduction of tariffs and other trade barriersacross individual items and sectors.
The case of maize in Mexico demonstrates that rule changes affecting a particular product orsector must be considered relative to changes in related products and sectors (such as yellowcorn in the United States or grain in Mexico). The differential pace and degree of reduction andelimination of tariffs and other trade barriers under NAFTA can have major impacts onproduction and consumption substitution in ways that are not optimal for economic efficiency orenvironmental enhancement.
General Rules/Crosscutting DisciplinesNAFTA also includes general rules which, while not explicitly applying to a product (such asgeneration equipment) or sector (such as electricity or energy), discipline the means or processesby which products and services (and their inputs) in all sectors across the economy are produced,sold or purchased. They include the NAFTA rules that govern behavior laterally on an economy-wide basis (e.g., government procurement, risk assessment methodologies) and temporallythrough anticipatory or deterrent effects.

Analytic Framework for Assessing the Environmental Effects of NAFTA
42
Such general rules include the following:
5. Norms for particular processes. Such norms include the Article 1114 disciplines oninvestment; risk assessment, sanitary and phytosanitary standards; health and safetystandards; procurement policies; and investment guarantees.
6. Preambular principles and stated objectives. NAFTA’s stated objectives include thepromotion of sustainable development and strengthening of environmental regulation andenforcement.
Also relevant are rules introduced subsequent to the signing of the agreements, notably:
7. National implementing legislation. This refers to legislation required in the three countriesfor NAFTA and its related agreements to take force, including agreements subsequent toNAFTA itself, such as the Canadian intergovernmental agreement governing provincialparticipation.
8. Accelerated tariff reduction. These are those rules generated by the NAFTA institutions orthose reached intergovernmentally subsequent to the Agreement coming into force, and thecumulative overall reduction of tariffs and trade and investment barriers, including futurespecified liberalization, that parties can anticipate and adjust to in advance. This overallliberalization and opening of markets creates new competitive pressures that differentiallyaffect specific sectors and products, depending on the height of previous trade barriers andthe underlying level of North American competitiveness.
B. NAFTA’s InstitutionsNAFTA institutions are the 26 trilateral intergovernmental bodies created directly by NAFTAand its related agreements, and the similar number catalyzed or inspired by them since 1 January1994 (Weintraub 1997, CEC 1996b, CEC 1997b). These institutions are designed to implement,interpret, and extend the agreements and their specific principles, norms and rules. The actualoperation of these institutions independently affects the application and result of NAFTA rules,even when the latter come with precise mandates, and targets and timetables for action. Thecases of trucking access to Mexico for US and Canadian carriers and trilaterally-mandated workon automotive emissions show the difference between rules on paper and results in practice.
There are a number of core institutions that can be included in this examination, as identifiedbelow. In all cases, it is important to consider the relationship of these institutions with nationalregulatory and government authorities, which retain significant capacity and whoseintergovernmental cooperation outside NAFTA institutions has substantial effects.
The NAFTA institutions of greatest relevance to the environment are:
• the Council of the Free Trade Commission (FTC);• the Council of the Commission for Environmental Cooperation (CEC);
Analytic Framework for Assessing the Environmental Effects of NAFTA
43
• institutions created by NAFTA with mandatory environmental responsibilities, particularly ifthey have a target and timetable related to a particular product or sector or process, anexample being the Automotive Standards Council on emissions;
• institutions created by NAFTA whose subject matter has an inherent environmentalrelevance, such as those dealing with agriculture; and
• NAFTA’s dispute settlement, avoidance and surveillance mechanisms, notably NAFTAChapters 11, 19, 20, and most broadly NAAEC’s Articles 14, 15, 23 and 24. Here the focusshould be on their operation in cases with clear environmental dimensions. For example, ofthe 11 cases initiated from 1 January 1994 to 20 August 1999 under the Chapter 11 processon investment in NAFTA, eight have concerned environmental regulations or had a clearenvironmental relevance.
To assess the impact of these institutions, it is important to focus first on their development astrilateral entities and their specified purposes, programs, resources and decision-makingprocedures. Thus far, the evidence suggests that most of the NAFTA institutions with specificenvironmental responsibilities or relevance have moved into operation, with activity beginning in1996 (CEC 1997b).
It is also useful to examine how each performs functions that deepen the NAFTA regime,balance separate national interests with trade and environment communities, and promotesustainable development.
Within relevant institutions, the following functions should be examined:
1. Meeting mandatory responsibilities. There have been concrete environmental achievementsin some cases, notably the transportation of dangerous goods and pesticides. Yet performancevaries. In some areas, such as automotive emissions, slow progress has been made in meetingmandatory targets and timetables (CEC 1997b).
2. Acting upon discretionary environmental mandates. The institutions may act on thediscretionary, environmentally-related mandates set forth in NAFTA or its relatedagreements such as those where the Parties “may” rather than “shall” act on environmentalissues, such as off-road vehicle emissions. In the latter case, there has been no action duringNAFTA’s first five years (CEC 1997b).
3. Extending to other relevant subjects. The institutions include within the trilateral processadditional subjects and issue areas beyond those specified in the initial agreements.
4. Generating new institutions. The institutions may perform a role in catalyzing other bodiesor processes as part of, or outside, the NAFTA structure of institutions. From 1994 to 1997there was a notable institutional proliferation, with the original 26 institutions doubling toabout 50 and the new additions being at least as environmentally-oriented as the originals(CEC 1997b). NAFTA’s institutions also include other regular trilateral processes that haveemerged, such as those at the ministerial level for Transportation, Health and Agriculture.

Analytic Framework for Assessing the Environmental Effects of NAFTA
44
5. Fostering communication. This can be done through an open exchange of information andlearning. During NAFTA’s first five years, there has been considerable cooperation,openness and trust emerging on a trilateral basis (CEC 1997b).
6. Building capacity. This is done by sharing resources of a financial, material and intellectualnature.
7. Discouraging unilateral action. Norms developed in institutions can lead to a reluctance touse national restrictive measures and can allow problems to be collectively resolved at anearly stage. This would include how institutions act to constrain unilateral use ofdiscretionary national regulatory and compliance measures.
8. Fostering high levels of environmental convergence. The institutions may foster a highlevel of regional convergence in environmental regulations. Here NAFTA, and the CEC inparticular, has helped foster a high level convergence through a process of mutual adjustmentamong the three NAFTA members. In some key sectors such as automotive products,however, such convergence has taken place outside of the NAFTA institutions or process(Kirton 1998b).
9. Participating multilaterally. The institutions may strengthen cooperation among the threeNorth American countries as they participate in broader multilateral forums. They may thusbe extending the geographic relevance of NAFTA’s work through its effect on outsiders(including use as a model), and by developing complementary North American positions andconsultations in outside forums. For example, NAFTA’s agricultural bodies have begun toconsider common North American interests in relation to the outside world, and the 1996Canada-Chile Free Trade Agreement was created very closely and consciously according tothe NAFTA model.
10. Contributing to community building and identity. The institutions may help engender asense of regional community and responsibility through consciousness-raising or concernabout the full region. On one important dimension of community building there has beenlimited movement to integrate and balance trade and environment values in the interactionbetween the NAFTA institutions primarily responsible for each, and in the operation of thework of the NAFTA institutions as a whole.
In considering the long-term economic and environmental impact of NAFTA, it is vital to viewthese rules and institutions as making up a dynamic, expanding regime. Most basically, they willevolve, as tariff reductions take effect in stages and as institutions come to full operation.Moreover, the rules and institutions will change, as those charged with applying them acquireexperience, or react to numerous economic forces and outside pressures. Most broadly, the rulesand institutions will change in response to NAFTA-related and external environmental effects, asparticular problems or successes engender new rules and concentrate institutional activity incertain areas rather than others. Through the work of its institutions, NAFTA can have animportant environmental impact.

Analytic Framework for Assessing the Environmental Effects of NAFTA
45
Looking ahead, it is useful to explore how the performance of such functions deepens theNAFTA regime by producing additional liberalization, and broadens the process to include otherissues. Of ultimate interest is the impact of the NAFTA institutions, in behavioral process andsubstantive outcome, in integrating and balancing the interests of the three countries and thetrade and environment communities, and creating or privileging regional interests andsustainable development objectives. In all cases, it is important to consider the relationship ofthese institutions with national regulatory and government authorities, which retain significantcapacity and whose intergovernmental cooperation outside NAFTA institutions has substantialeffects.
It is also useful to examine how the NAFTA institutions encourage consultation and regulatorydesigns that exploit opportunities for harmonization (as in animal health, meat and plantinspection, grading standards, mercury emissions). At present there appear to be opportunitiesfor major gains in the convergence of national and introduction of region-wide standards inseveral areas, such as electricity. Even where the NAFTA institutions currently provide thecapacity for such convergence, as in agriculture, there is relatively little environmentallyenhancing activity in evidence.
C. Trade FlowsBecause NAFTA is an agreement aimed at liberalizing trade among its members, it is essential toexamine the impacts of its rules and institutions on trade flows. This can be done by analyzingreadily available quantitative data. Here one might employ one of the many existing formalmethodologies that can more conclusively demonstrate and quantify the existence of anindependent NAFTA effect on trade at the general, economy-wide level and in specific sectors inCanada, Mexico and the United States. There are also a number of studies employing differentmethodologies that conclusively demonstrate such an effect.
The majority of these studies suggest that the economic effects of NAFTA are broadly positiveor neutral on major indicators such as trade growth, GDP, income, and employment (US TR1997a). A few allege specific negative effects on such selected indicators as income equality andtrade diversion (Council on Hemispheric Affairs 1997, and Economic Policy Institute 1997).Several studies also detail beneficial-to-neutral trade effects in specific sectors (US TR 1997b).For example, in the case of feed grains, the NAFTA provisions replacing Mexico’s protectionwith a tariff-rate quota system have led to increased Mexican imports of the liberalized productsor close substitutes from the United States (Runge et al. 1997). In the case of energy, NAFTAreductions in the tariff on coal have had the same effect (CEC 1999).
The sectoral composition of trade can affect the environment in both positive and negative ways.There is some evidence to suggest that the sectoral composition of post-NAFTA trade, and thedynamic changes in the share of such trade among sectors, is not having a negative effect onenvironmental quality (CEC 1999).
It is possible to move beyond aggregate statistics to firm-level behavior and use more detailed“process tracing” methodologies that connect the NAFTA regime to the trade that results from it.Through specialized interviews with corporate officials and other stakeholders, public data andother methods (such as NAFTA certificates of origin on goods or the qualification of firms for
Analytic Framework for Assessing the Environmental Effects of NAFTA
46
NAFTA adjustment assistance in the United States), it would be possible to explore howNAFTA relates to creating or reducing new trade flows among firms and what are the distinctiveproduction characteristics of this NAFTA-associated trade.
Identifying NAFTA’s trade effects at a firm level is also a manageable task because NorthAmerican trade, both overall and in most sectors in all three countries, is heavily concentrated ina few large companies. For example, 63 percent of all US exports globally are made bytransnational corporations (TNCs), many of them very large firms. A full 50 percent of Canada’sexports come from only 50 firms, many of them foreign-controlled (CEC 1996a, 123). Regularsurvey research could assist in assessing their trade and investment performance and intentions,the importance of NAFTA in their corporate strategies, and the production characteristics of theirNAFTA-related trade and investment.
At a minimum, trade flows should be assessed for an individual product, for its major inputs andfor the good for which it is a major input. This should be done for trade between the NAFTAmembers and in their trade with outsiders, beginning in 1991 and using the pre-NAFTA period(1985–90) as a baseline.
The key variables for examination in such an analysis are as follows:
1. Value and volume of exports/imports. This is the value and volume of exports and importsof each NAFTA country with its other NAFTA partners and with non-NAFTA countries.This includes both goods and services, and serves as the first indicator of how NAFTA’srules and institutions cause economic change.
2. Market share. This refers to the market share of a product (overall and for imports) that eachNAFTA partner’s exports represent in each of the other NAFTA countries, and what othercountries are being affected by this changing market share. This market-share analysis allowsfor the control of a number of conditions in the importing economy, as many such conditionsshould apply equally to imports from NAFTA countries, imports from non-NAFTAcountries, and domestic production alike. It leads to an analysis of how differences over timeand across countries are associated with NAFTA liberalization as specified in its rules andimplemented by its institutions.
3. Structure and composition. This considers the changing structure and sectoral orintrasectoral composition of trade that liberalization has brought about on a cross-countrybasis over time as product substitution and specialization take effect.
4. Creation and diversion. This refers to trade creation and diversion effects with regard tonon-NAFTA countries.
Analyses of the trade impact of NAFTA during the first few years of its formal operationsuggested that the NAFTA regime was having a substantial, trade-creating effect among all threeof the two-way trading relationships governed by it. It further suggested that such NAFTA-expanded trade was not having a negative environmental effect, concentrating trade in sectorsthat were pollution intensive. Production grew from maquiladoras in locations underenvironmental stress, but with greater attention focused on the effects of that stress.

Analytic Framework for Assessing the Environmental Effects of NAFTA
47
It is important to update this analysis, in particular to take account of the trends that havedeveloped as a result of several factors. These factors include:
• the accomplishment of much of NAFTA’s five-year tariff phase-outs and the two rounds ofaccelerated tariff reduction that have come into effect;
• Mexico’s recovery from its 1995 economic recession;• the Asian-turned-global financial crisis and emerging market downturn from 1997–99; and• the sustained growth in the US economy during the late 1990s.
At present, an examination of recent trade flows suggests that NAFTA continues to have aneffect in stimulating and sustaining increased trade among the three member countries(International Monetary Fund 1998).
US-Canadian TradeFrom 1991 to 1998, US trade (both exports and imports) with Canada almost doubled, fromUS$178.9 billion to US$332.2 billion. During the three years of NAFTA anticipation from 1991to 1993, when the 1989 bilateral Canada-United States Free Trade Agreement was also exertingits initial pull, US trade with Canada rose 19.5 percent, to US$213.8 billion. During thefollowing three years, when NAFTA first took formal effect, it rose 36.7 percent, to US$292billion (in 1996). During the subsequent two years of the mature NAFTA, it rose again by 13.7percent, to US$332.2 (in 1998). In all cases the annual increases exceeded the growth in GNP ofthe United States and Canada. These increases are all the more remarkable, given the very highlevel of pre-existing US-Canadian trade as the decade began. Indeed, that bilateral relationshipwas and is the largest two-way bilateral trading relationship in the world.
US-Mexican TradeThe impact of NAFTA was expected to be far more evident in the US-Mexican traderelationship, given the lower levels of that trade, the smaller size of the Mexican economy andthe absence of any prior major free trade arrangements (apart from the maquiladora program).The record has met these expectations. Between 1991 and 1998, two-way US trade with Mexico(starting from a base one-third that of US trade with Canada) more than doubled, from US$65.1billion (in 1991) to US$160.0 billion. During the three years of NAFTA anticipation, the traderose 26.6 percent. During the initial three years of NAFTA’s formal operation, it jumped astriking 58.9 percent. In the following two years, it increased again by 22.2 percent. In all threeperiods, the increase was greater than that experienced in the US-Canadian relationship.
Canadian-Mexican TradeThe Canada-Mexico relationship was expected to experience the largest autonomous, NAFTA-propelled increase, if only because of the very small size of the pre-existing trade and othercommercial connections between these two geographically and linguistically distant partners.The record bears out this expectation. During the decade, Canada’s two-way trade with Mexicomore than doubled, rising 136 percent from US$2.5 billion in 1991 to US$5.9 billion in 1998. In
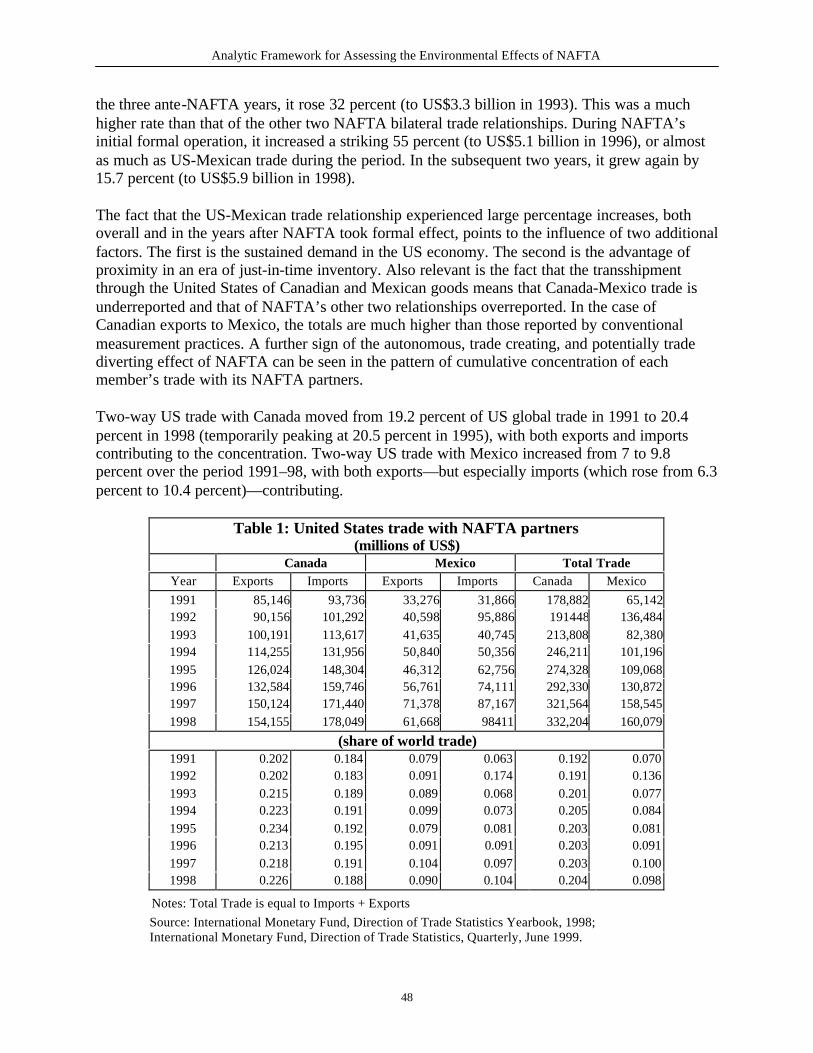
Analytic Framework for Assessing the Environmental Effects of NAFTA
48
the three ante-NAFTA years, it rose 32 percent (to US$3.3 billion in 1993). This was a muchhigher rate than that of the other two NAFTA bilateral trade relationships. During NAFTA’sinitial formal operation, it increased a striking 55 percent (to US$5.1 billion in 1996), or almostas much as US-Mexican trade during the period. In the subsequent two years, it grew again by15.7 percent (to US$5.9 billion in 1998).
The fact that the US-Mexican trade relationship experienced large percentage increases, bothoverall and in the years after NAFTA took formal effect, points to the influence of two additionalfactors. The first is the sustained demand in the US economy. The second is the advantage ofproximity in an era of just-in-time inventory. Also relevant is the fact that the transshipmentthrough the United States of Canadian and Mexican goods means that Canada-Mexico trade isunderreported and that of NAFTA’s other two relationships overreported. In the case ofCanadian exports to Mexico, the totals are much higher than those reported by conventionalmeasurement practices. A further sign of the autonomous, trade creating, and potentially tradediverting effect of NAFTA can be seen in the pattern of cumulative concentration of eachmember’s trade with its NAFTA partners.
Two-way US trade with Canada moved from 19.2 percent of US global trade in 1991 to 20.4percent in 1998 (temporarily peaking at 20.5 percent in 1995), with both exports and importscontributing to the concentration. Two-way US trade with Mexico increased from 7 to 9.8percent over the period 1991–98, with both exports—but especially imports (which rose from 6.3percent to 10.4 percent)—contributing.
Table 1: United States trade with NAFTA partners(millions of US$)
Canada Mexico Total TradeYear Exports Imports Exports Imports Canada Mexico1991 85,146 93,736 33,276 31,866 178,882 65,1421992 90,156 101,292 40,598 95,886 191448 136,4841993 100,191 113,617 41,635 40,745 213,808 82,3801994 114,255 131,956 50,840 50,356 246,211 101,1961995 126,024 148,304 46,312 62,756 274,328 109,0681996 132,584 159,746 56,761 74,111 292,330 130,8721997 150,124 171,440 71,378 87,167 321,564 158,5451998 154,155 178,049 61,668 98411 332,204 160,079
(share of world trade)1991 0.202 0.184 0.079 0.063 0.192 0.0701992 0.202 0.183 0.091 0.174 0.191 0.1361993 0.215 0.189 0.089 0.068 0.201 0.0771994 0.223 0.191 0.099 0.073 0.205 0.0841995 0.234 0.192 0.079 0.081 0.203 0.0811996 0.213 0.195 0.091 0.091 0.203 0.0911997 0.218 0.191 0.104 0.097 0.203 0.1001998 0.226 0.188 0.090 0.104 0.204 0.098
Notes: Total Trade is equal to Imports + ExportsSource: International Monetary Fund, Direction of Trade Statistics Yearbook, 1998;International Monetary Fund, Direction of Trade Statistics, Quarterly, June 1999.

Analytic Framework for Assessing the Environmental Effects of NAFTA
49
Table 1 indicates that in the period after NAFTA took effect, total US trade with Canadaincreased by approximately 85 percent, representing an increase of 1.2 percent of total US trade.In the same period US trade with Mexico increased by approximately 145 percent, representingan increase of 2.8 percent of total US trade.
The two-way trade of the much smaller and much more open Canadian economy experienced agreater concentration. From 1991 to 1998 its trade with the United States rose from 69.2 percentto 77.6 percent of its total, as exports to the United States rose from 75.8 percent to 86.5 percentand imports from the United States rose from 62.3 percent to 68.3 percent of the Canadian globaltotal. Canada’s trade share with Mexico rose from 1.0–1.4 percent of the Canadian total.
Table 2: Canadian trade with NAFTA partners(millions of US$)
United States Mexico Total TradeYear Exports Imports Exports Imports United
StatesMexico
1991 95,574 75,025 386 2,131 170,599 2,5171992 103,860 79,294 613 2,207 183,154 2,8201993 114,448 87,759 599 2,665 202,207 3,2641994 133,112 99,628 715 3,126 232,740 3,8411995 152,896 108,988 786 3,774 261,884 4,5601996 164,761 114,626 855 4,281 279,387 5,1361997 177,317 131,948 916 4,968 309,265 5,8841998 182,802 136,816 858 5,079 319,618 5,937
(share of world trade)1991 0.758 0.623 0.003 0.018 0.692 0.0101992 0.778 0.635 0.005 0.018 0.709 0.0111993 0.813 0.650 0.004 0.020 0.734 0.0121994 0.825 0.658 0.004 0.021 0.744 0.0121995 0.804 0.667 0.004 0.023 0.741 0.0131996 0.823 0.674 0.004 0.025 0.755 0.0141997 0.832 0.675 0.004 0.025 0.757 0.0141998 0.865 0.683 0.004 0.025 0.776 0.014
Notes: Total Trade is equal to Imports + ExportsSource: International Monetary Fund, Direction of Trade Statistics Yearbook, 1998;International Monetary Fund, Direction of Trade Statistics, Quarterly, June 1999.
Table 2 shows the increase in Canadian trade with the NAFTA partners since the signing of theAgreement. Trade with the United States increased by approximately 87 percent, representing anincrease in the US market share of 8.4 percent. Trade with Mexico increased by 136 percent,which translates into an increase in market share of 0.4 percent.
The two-way trade of the smaller and somewhat less open Mexican economy also underwent aregional concentration. Mexico’s two-way trade share from 1991 to 1998 rose from 76.5 percent

Analytic Framework for Assessing the Environmental Effects of NAFTA
50
to 77.9 percent with the United States, and from 2.0 percent to 2.1 percent with Canada. But itsshare of imports from Canada have plummeted from their peak in 1994, and its concentration ofexports and imports from the United States dropped in 1998.
Table 3: Mexican trade with NAFTA partners(millions of US$)
United States Canada Total Trade
Year Exports Imports Exports Imports UnitedStates
Canada
1991 33,953 36,868 1,139 698 70,821 1,8371992 37,468 44,279 1,000 1,052 81,747 2,0521993 43,117 46,542 1,541 1,163 89,659 2,7041994 51,943 57,009 1,470 1,600 108,952 3,0701995 66475 53,995 1,979 1,374 120,470 3,3531996 80,673 67,629 2,170 1,744 148,302 3,9141997 94,531 82,182 2,157 1,968 176,713 4,1251998 87,343 79,011 3,692 863 166,354 4,555
(shares of world trade )1991 0.795 0.739 0.027 0.014 0.765 0.0201992 0.811 0.713 0.022 0.017 0.755 0.0191993 0.833 0.712 0.030 0.018 0.765 0.0231994 0.853 0.718 0.024 0.020 0.777 0.0221995 0.836 0.745 0.025 0.019 0.793 0.0221996 0.840 0.756 0.023 0.019 0.800 0.0211997 0.856 0.748 0.020 0.018 0.802 0.0191998 0.819 0.739 0.035 0.008 0.779 0.021
Notes: Total Trade is equal to Imports + ExportsSource: International Monetary Fund, Direction of Trade Statistics Yearbook, 1998;International Monetary Fund, Direction of Trade Statistics, Quarterly, June 1999.
Table 3 illustrates the changes after NAFTA came into effect in the trinational trade balancefrom the Mexican perspective. Mexican trade with the United States increased by 134 percent,equaling an increase in market share of 1.4 percent. Trade with Canada increased by 148percent—an increase of 0.1 percent in market share.
In all three cases, with the exceptions noted, there has tended to be a continuous rise (if withsome occasional fluctuation) over the decade, rather than any single step-level jump afterNAFTA took formal effect.
D. Transborder Investment FlowsIn examining NAFTA’s immediate economic effects, it is important to accord foreign directinvestment equal attention to that given to trade. This is for four major reasons, as follows:
First, in North America, transborder flows of foreign direct investment (FDI) are closelyassociated with trade. About 65 percent of Canada’s and almost as high a percent of Mexico’smanufactured exports to the United States take place not between anonymous buyers and sellers

Analytic Framework for Assessing the Environmental Effects of NAFTA
51
in an open market but as intra-firm or intra-alliance transactions between firms and plants joinedin an equity or negotiated arrangement (Zeile 1997, Weintraub 1994, Alcerreca-Joaquin 1997).In the case of Canada’s exports to the United States, 40 percent of exports are between differentplants or subsidiaries of the same multinational corporation, and an additional 25 percentbetween firms joined in some form of business alliance (e.g., for marketing, supply, distribution,research and development). With free market forces so heavily internalized within firms andbusiness alliances, and with the NAFTA-driven dynamics of regional rationalization andintegration in production intensifying this phenomenon, the corporate strategy of leadingmultinational firms assumes considerable relevance.
Second, and partly as a reflection of the above, in important respects NAFTA was an investmentagreement as well as a trade agreement. Many of its most innovative provisions came in the newprotection it provided for transborder investment. For example, the provisions of NAFTA’sChapter 11 to allow firms direct access to an international tribunal to settle disputes, when theyalleged governments had engaged in harmful actions that were “tantamount to expropriation,”represented a new step in international law and procedure.
Third, the results of existing modeling exercises, reported above, point to the important role thatforeign direct investment, and the technology embedded within it, has in altering environmentalperformance in recipient firms and countries.
Fourth, as NAFTA took effect, there were already strong ties in FDI, as in trade, among the threeNAFTA countries (excepting between Mexico and Canada). In particular, US-sourced FDIplayed a significant role in the Canadian and Mexican economies. In 1995, over 2,000 US-owned companies operating in Canada produced 9 percent of Canada’s GDP. The United Stateswas also Mexico’s leading foreign direct investor, with the amount of the investment triplingfrom 1989 to 1996. While the United States was far less dependent on FDI, almost 1,300Canadian-owned subsidiaries in the United States employed 704,000 Americans, a numbersecond only to that of Japanese-owned companies (Fry 1997). It was through this existing basisof substantial direct investment integration that NAFTA’s effects could be most immediately andintensely felt.
In assessing changes among the three North American countries, it is important to focus on directrather than portfolio investment. The former carries with it a powerful package of capital,management, technology, distribution systems, reputation and markets. With the integratedproduction systems of TNCs, it also makes the diffusion of advanced technology more likely, aswell as adherence to a corporate-wide set of high-level environmental standards.
Attention should be given to both “greenfield” investment and to acquisitions or expansions ofexisting facilities. It should include fully-owned investment, joint ventures and North Americanbusiness alliances. Although it is useful to assess the annual flows of direct investment, wherepossible the emphasis should be placed on changes in stocks of foreign investment. The latterdata (which include retained earning or subsidiaries and expansions of existing investment usingmoney raised on domestic banking and capital markets) will incorporate the fullest range ofinvestment alterations.

Analytic Framework for Assessing the Environmental Effects of NAFTA
52
Currently, only inconclusive data are available for examining these topics. Information is mostcomplete with regard to overall flows and stock of FDI. Even here, the differences inmeasurement criteria between the United States and Canada on the one hand (whose dataexamine actual transfers), and Mexico on the other (which measures approvals), makes directcomparison difficult. It is thus useful to rely on US government data to assess both the US-Canadian and the US-Mexican flows and stock changes and on Canadian data to assess theCanadian-Mexican flows and stock changes.
In exploring NAFTA-associated changes in transborder investment with a view to tracing theirenvironmental effects, several factors are of importance:
• regional concentration of investment,• sectoral investment shifts, migration and subsidies,• technology transfer and diffusion,• intracorporate integration in production,• corporate concentration, and• foreign portfolio investment.
Each of these factors is examined below, together with a summary of the dominant changeswithin it during NAFTA’s first few years of operation.
1. Regional concentration of investment. This addresses how post-NAFTA FDI stocks (andsecondarily, flows) among the three NAFTA countries, relative to the pre-NAFTA periodand to non-NAFTA partners, have changed overall for each of the three countries. In allcases, transborder investment should be considered in the context of:
a. domestic investment (including both net domestic investment and the percentage of anindustry that is foreign-owned, by firms headquartered and owned in NAFTA and non-NAFTA countries);
b. how investment from countries within and without NAFTA is concentrating inside, asopposed to outside, North America; and
c. the geographic concentration of investment in particular countries and locations withineach NAFTA country, including transborder production clusters or transportationcorridors.
As enactment of NAFTA approached, its investment rules were expected to result inincreased NAFTA and non-NAFTA FDI in the United States (particularly in capital-intensive industries), as the center of the new NAFTA region, and in Mexico (inemployment-intensive industries), due to the effect NAFTA’s Chapter 11 and other factorshad in opening the latter’s economy. Less impact was expected in Canada, already moreintegrated into US-based production systems. Such increases in FDI were expected to bestrongest in sectors that were included in the liberalization, and subject to the disciplines, ofChapter 11. Increased direct portfolio investment in Mexico and domestic investment(primarily in export-oriented industries that would benefit from NAFTA) were alsoconsidered likely.

Analytic Framework for Assessing the Environmental Effects of NAFTA
53
Evidence from 1994 suggested these initial investment changes were taking place (Kirton1998a). In the immediate post-NAFTA period, the United States gave a rising share of itsoutward FDI to Mexico (and a diminishing share to Canada), Canada increased its FDI stockin Mexico (while holding steady in the United States), and Mexican FDI in the United Statesrose between 1993 and 1994 (while remaining negligible in Canada).
After this initial concentration in Mexico and secondarily in the United States, however, thetrend slackened. Mexico’s share of US FDI outflows, which had risen from 3.3 percent in1993 to 5.3 percent in 1994, dropped in 1995 to 3.4 percent (US$3.0 billion) and again to 3.1percent (US$2.7 billion) in 1996. Canadian FDI flows into the United States rose steadilyfrom US$1.3 billion in 1992 to US$7.1 billion in 1995, but dropped to US$5.7 billion in1996. The stock of Mexican FDI in the United States, which had risen from US$1.0 billion in1993 to US$2.3 billion in 1994 fell to US$2.0 billion in 1995 and again to US$1.0 billion in1996. Mexican FDI in Canada remained very low, despite signs of new interest at the end of1997 (with a prospective purchase of the Nova Scotia steel producer Sysco by a Mexicanfirm). Thus, over this longer period, there is no absolute movement of FDI from the UnitedStates and Canada to Mexico.
There is no firm base to conclude Canada is losing its attraction as a destination for USinvestment as Mexican locations become more attractive and as US locations appear the bestfrom which to service the entire NAFTA marketplace. Yet Canadian and Mexican levels ofUS FDI remain higher than their share of the regional economy. Moreover, Canada’s declinein the North American region is less than that in its global and G-7 FDI shares, pointing to anindependent effect of NAFTA in enhancing Canada’s desirability as an investment location.
In addition, the concentration of new investment should be considered for production ortransportation in geographic locales that are environmentally fragile, stressed, or lackaccompanying environmental infrastructure and supports. Such an investment concentrationcan also have effects on social organization and cohesion (as outlined below) as some localcommunities gain and others lose from investment shifts.
Of particular concern are FDI’s concentration in and affect on:
a. the Mexican maquiladoras that border the United States;b. particular production clusters that grow, or shrink, within an integrated North American
region; andc. the major transportation and transmission corridors and border crossings where
investment concentrates.
There is only partial evidence on the geographic concentration of such investment. There is aclear post-NAFTA increase in investment in and production and trade from themaquiladoras. But this appears to be a result of exchange rate changes, differential demand inthe US and Mexican economies, and locational pulls that value proximity in an increasinglyintegrated North American supply chain and production system. NAFTA’s rules createdincentives in the opposite direction by according over time to all of Mexico the advantageslong enjoyed by the northern maquiladoras. Thus NAFTA-generated FDI does not appear to

Analytic Framework for Assessing the Environmental Effects of NAFTA
54
be geographically concentrating in the already-stressed maquiladora region in northernMexico.
There is limited evidence on concentration in particular geographic locales. In areas whereNAFTA is reinforcing the geographic concentration of investment, as with cattle feedlots andprocessing and packaging plants in Kansas and Alberta, it is doing so where the availabletechnology, resources and capacity for government regulatory oversight is relativelyadvanced. US-sourced FDI in the Canadian beefpacking industry is also increasinglycentering in southern Alberta, with attendant stress on the local infrastructure and ecology.
In general, there is no evidence of strong concentration of FDI or NAFTA-associateddomestic investment in particular regions such as north-south transportation corridors orenvironmentally-sensitive areas. However, more generally, as explored below, the increasingscale of locally-sourced raw materials, greater use of packaging and plastics, andintensification of transportation in intracorporate trade may increase environmental stress.
2. Sectoral investment shifts, migration and subsidies. The second factor is whether thisinvestment is expanding most rapidly in relatively pollution-intensive or relatively cleansectors. Of particular interest is whether NAFTA-associated FDI constitutes a transfer ofindustries and plants with heavy environmental costs (including those for environmentalregulatory compliance) from one country or locale in the NAFTA region to another and howthe standards and subsidies compare in those locales. An analysis of investment migrationshould also include an analysis of whether plant reductions and closures, and plant openingsand expansions in another country, are taking place in ecologically stressed locations. Theneed to consider the government policy of direct subsidization (including tax credits) toattract investment is important, given its ability to generate environmental gains frominvestment migration, and the lesser capacity of smaller and poorer governments in NorthAmerica to compete for industry on this basis. Such transfers of investment can take the formof a physical move of an existing plant or an expansion or placement of new investment inone area at the expense of another.
The evidence on investment migration or differential expansion and the environmentalmotives and consequences of such shifts is partial. The best developed of several studiesdemonstrates a trend of US FDI into Mexico in industries characterized as lower polluting(Cole and Ensign 1997). A recent study of the Canadian automotive parts industry indicatesthat necessity for environmental regulatory compliance was negligible as a factor influencingcorporate strategy and production location decisions (Eden et al. 1997).
A more detailed examination of sectoral shifts sustains this portrait. From 1993 to 1996 USFDI flows into Mexico were low in the automotive sectors, steady in computers, householdappliances, and textiles apparel, but negative in chemicals (where total US investmentdeclined 47 percent over the period) and printed products. In processed food and beverages,where more than 25 percent of total US FDI into Mexico is concentrated, US FDI stock rosefrom US$2.3 billion in 1993 to US$2.8 billion in 1994 but declined to US$2.3 billion in1995. There is thus no general tendency for US investment to flow into sectors that arerelatively high polluting.

Analytic Framework for Assessing the Environmental Effects of NAFTA
55
The sectoral pattern of new US FDI into Mexico in the post-NAFTA period appears to beavoiding or declining in those sectors with a large ecological footprint (basic metals,industrial chemicals, and non-metal products) and concentrating in those with a smallerecological footprint (textiles, metal products, food products). Such a pattern suggests that USindustry is not moving its heavily polluting production to Mexico. This is consistent with thepattern of initial post-NAFTA investment in Mexico (Ramirez de la O. 1996a). With US FDIflows to Mexico in 1996 representing only 0.2 percent of US gross private domestic fixedinvestment that year, there has been no general migration of US firms (US TR 1997b, USITC 1997b).
Little is known about the effect of subsidies offered to offset environmental compliance costsin attracting investment to particular jurisdictions. Anecdotal evidence, however, suggestssuch a subsidy was employed to attract a US-owned beef packing plant to Alberta.
3. Technology transfer and diffusion. The degree and speed of the spread of advancedtechnology from one firm to a related enterprise in the other NAFTA countries is a criticalfactor. Such a trend is promoted by regional production systems. It increases both technologytransfer and diffusion to competing firms in the same industry, to related and non-relatedfirms in the sector, and throughout the economy. Of particular relevance are technologies thatimprove overall efficiency and those directed at enhancing environmental quality.
Little is known either about how NAFTA-associated FDI transfers environmentally-enhancing technology from one NAFTA country to another, or how that technology moveswithin countries to other firms, sectors and the economy as a whole. There is some evidencethat FDI is a contributing source of technology transfer and diffusion (Kirton 1998).However, there are no studies dealing with these processes in environmental technologies orimpacts specifically. The outflows of US and Canadian FDI into Mexico, reinforced byMexican FDI into the United States, should improve environmental performance in therecipient countries, through capital modernization, technology transfer among affiliates, andinvestments in environmental equipment, infrastructure and management systems. Thisshould be especially true as the surge of new investment took place in 1994 whenenvironmental consciousness in North America was at its peak. Preliminary evidence fromthe 1995 interview program conducted for the NAFTA Effects project suggests that theanticipation and advent of NAFTA led to environmental investments in foreign-owned anddomestically-owned firms in Mexico (CEC 1996a, Ramirez de la O. 1996a).
4. Intracorporate production and standards integration. A further important factor is whetherand how the NAFTA regime is increasing intracorporate trade and affiliated trade betweenand among the members. Such a process can be expected to encourage integrated productionsystems that make it more likely that plants operating in all three countries will adopt andfollow a common set of standards and practices.
There is no systematic evidence about how FDI and resulting intracorporate trade has led touniform, high-level, region-wide industrial practices and standards. NAFTA has encouragedcoordinated production in the automotive, telecommunications equipment, computer,electronic products, and textiles-apparel sectors, thereby increasing the export of high-value

Analytic Framework for Assessing the Environmental Effects of NAFTA
56
US component and services to firms in Mexico and allowing Mexican firms to displaceextra-NAFTA competitors (US TR 1997b). This increases the incentive of such firms toadopt the generally high levels of environmental regulations followed by parent corporationsin the United States.
5. Corporate concentration. Also relevant is how FDI may be encouraging a trend towardconcentration within industrial sectors by creating a smaller number of larger firms servicingthe NAFTA marketplace. Firm size and concentration may have various effects, fromenhancing the impact of poor corporate environmental performance to equipping the firmswith the resources, visibility and thus the incentive to adopt best practices in itsenvironmentally-relevant operations.
There is limited evidence on concentration in particular sectors, in a few large firms whoseresources and visibility enable and encourage them to perform at a high environmentalstandard. In the cattle feedlotting sector, the industry is concentrating in the United States,while four large US firms have come to dominate a Canadian beefpacking industryincreasingly centered in southern Alberta.
6. Foreign portfolio investment. A final factor of is foreign portfolio investment, as it relates toand reinforces FDI, or substitutes for FDI, and provides domestically-owned firms with thefinance for technological and production upgrades and expansion.
Together, the available evidence from NAFTA’s first few years in operation suggests thatNAFTA-associated investment has not had a negative affect on environmental quality overall,and may well have led to environmentally-enhancing impacts in several ways. Such a portrait issustained by a more detailed examination of investment trends in North America in recent years.
The results of such a review are reported in detail in Appendix A. They suggest that trends inFDI are driven primarily by the global position of the United States as the world’s largestoutward and inward foreign direct investors. US outward FDI stocks surged in Mexico, but notCanada, in the years leading up to NAFTA, but have concentrated on Canada in the years sinceNAFTA took effect. NAFTA was the motivating force behind these expansions, as a vehicle ofincreasing economic integration in North America. But its overall effect was to enable bothMexico and Canada to maintain their share of outward US FDI in the face of intense competitionfrom established and emerging markets overseas. A sectoral analysis shows that NAFTA had itsgreatest impact in enhancing FDI flows to Mexico and Canada in the manufacturing sector.Moreover, the anticipation rather than the aftermath of NAFTA led to the large outflows ofportfolio capital from the United States to Mexico that Mexican industry needed to modernize.
It is evident that NAFTA has a clear impact on investment within North America, particularly ininducing US investors to expand their involvement in the Mexican and Canadian manufacturingindustry. Particularly when assessed against trends in global investment, they did not give rise toany overall trends for investment to move to Mexico to take advantage of any lesserenvironmental regulatory performance, nor concentrate unduly in a US hub of an integratedregion. Much more detailed research is required before firm conclusions can be drawn about the

Analytic Framework for Assessing the Environmental Effects of NAFTA
57
precise environmental effects these investment changes have had through various mechanismsand in an overall sense.
E. Other Economic Conditioning FactorsTo demonstrate the presence of a NAFTA connection in trade and transborder investment, it isnecessary to take full account of the other macroeconomic and microeconomic conditions, notrelated to NAFTA, that affect trade and FDI flows. Among the most important factors that mustbe controlled are the major macro- and microeconomic processes within the three countries’domestic economies, and the macroeconomic impact of the countries’ involvement in theinternational economy. Although the precise variables in these macro- and microeconomicprocesses vary according to the specific issue or sector under scrutiny, in general, the followingshould be considered.
1. Domestic macroeconomic forces. Relevant domestic macroeconomic forces includeaggregate growth, income levels, demand, and consumption in the economy, as distinct fromthe scale effect of growth and production (and consumption) generated by trade liberalizationitself. They also include inflation and interest rates arising from and affecting growth,transborder trade, and investment directly. An additional component is the demand forforeign capital, as affected by the rate of national savings and investment and the size ofgovernment deficits and debts. Together, these factors influence cyclic changes in price thatcan affect some sectors.
2. Microeconomic changes in each economy. Of increasing importance are the microeconomicchanges in each economy, as it adjusts to the liberalization brought about by the GATT/WTOand other trade agreements, ongoing changes in the global economy, and the opportunitiesand challenges of new technologies. Important microeconomic processes includederegulation and privatization, as well as the condition of the domestic financial and bankingsystems and the availability of credit and insurance. Additional factors include employmentlevels, the structure of the labor market, and the structure and profitability of firms.
The relevance of microeconomic processes of deregulation and privatization is evident, forexample, in the case of electricity in all three countries. On the other hand, an importantfactor in the maize industry in Mexico is the condition of the domestic financial and bankingsystem and the availability of credit and insurance to small producers.
3. Major fluctuations from international forces. International macroeconomic forces, andshocks, are relevant, particularly for internationally open economies such as Canada’s.Indeed, the post-NAFTA period has witnessed wide swings and sudden shocks in exchangerates, balance of payments, foreign exchange reserves, and credit for all three NAFTAcountries. The most important macroeconomic forces in the international domain areexchange rates, and the balance of payments deficits and surpluses among the NAFTAcountries. Also important can be the volume and direction of portfolio capital.
4. Changes in weather and climate. Finally, it is often useful to consider here how ecologicalconditions occurring in the region can autonomously affect patterns of production in tradeand investment. Of immediate relevance are changes in weather patterns including rainfall

Analytic Framework for Assessing the Environmental Effects of NAFTA
58
and temperature. A severe drought in northern Mexico is said to have led to a sharp declinein the number of cattle from 1992 to 1996. Diminished rainfall lowers the level of reservoirsand results in less hydroelectric production in the three countries. Changes in temperature canalso be important in affecting growing seasons and the volume of agricultural crops.
These macro- and micro-economic forces can and do exert a powerful independent effect on theeconomy and ecology of North America—one that can overwhelm any effect that NAFTA itselfmay have. However, the available evidence suggests that post-NAFTA North American tradeoften remains insulated from the impact of such changes. Indeed, the existence of an autonomousNAFTA effect is evident at times of change in direction of the macroeconomic forces mostaffecting trade and of failure of observed trade patterns to conform to the patterns they direct butinstead to respond to the patterns directed by the provisions of NAFTA.
For example, in 1995 when the Mexican peso lost 45 percent of its value against the US (andCanadian) dollar, Mexican GDP contracted almost 7 percent, Mexican domestic demand fell 22percent and Mexican imports from non-NAFTA countries dropped by 25 percent. However, theoverall value of Mexican imports from the United States fell by only 2 percent. Mexican importsfrom Canada rose by 5.4 percent.
Some of these economic anomalies may be explained as pre-existing integration between US andMexican firms, notably Mexican firms importing intermediate and capital goods from the UnitedStates in order to increase their exports of finished goods to the US market. Yet the results in theMexican-Canadian case, where the NAFTA effect is likely to be largest (given the lower levelsof pre-NAFTA integration and trade and investment flows), indicate the presence of a powerfulNAFTA-generated trade effect. Such results, consistent with the new institutional economics andthe results of the FTA liberalization, point to the importance of institutional rather than economicmarket forces in determining the direction and shape of post-NAFTA trade flows. They alsopoint to the need to use techniques in addition to general and partial equilibrium modelingmethodologies to account for some important changes (Ramirez de la O. 1996b).
Finally, the high concentration of NAFTA-associated trade and transborder investment in a fewlarge firms, often TNCs in which market forces have been internalized and thus controlled,suggest that NAFTA’s economic effects flow not only from macroeconomic market forces butfrom microeconomic organization and the corporate strategy of individual firms, businessalliances, and households as production units.
This suggests that the way NAFTA-associated trade and investment affects the environment canusefully be assessed, for many current purposes, not only at a broad macro level throughquantitative modeling, but through an examination of the operations of individual plants andfirms, the physical infrastructure that services them, the social organization that surrounds them,and the government policy that regulates their behavior and that of their stakeholders. Thefollowing section outlines the factors and relationships on which to focus in exploring theseprocesses that link NAFTA-associated trade and investment to ecological change.

Analytic Framework for Assessing the Environmental Effects of NAFTA
59
IV. Linkages to the Environment
The environmental effects of NAFTA-associated trade and investment are often not direct,immediate, and unilinear. Rather, they depend for their effect on the particular operation of thefirms and plants that produce the goods and services for the international or domestic market,and the physical infrastructure that supports the plants, brings their inputs and workers to them,and transports their goods to market. They further depend on the social system in which workers,owners, consumers, surrounding communities and other stakeholders interact and the way inwhich governments domestically regulate the activities of all. Even where a NAFTA rule isrelatively clear, its ultimate effect on the physical environment often depends on how firms,authorities operating infrastructure networks, social organizations, and governments react to andimplement it. It is thus vital to examine in detail the processes of production, infrastructure,social organization and government policy that lie behind aggregate changes in trade andtransborder investment, and see how their operation directly generates pressures on, and supportsfor, the physical environment.
These intervening processes, or “linkages to the environment,” are logically related to NAFTA inseveral ways. Some may be a direct, immediate result of NAFTA’s legal, political, and economicforces. Others may be affected by NAFTA but also operate with sufficient autonomy to exerttheir own independent impact on how NAFTA affects the environment. Others may be anindirect or delayed result of NAFTA but also exert a mediating effect. Still others may beunrelated factors that operate independently but in doing so intersect with NAFTA-generatedforces to affect the environment in different ways. And some, such as national governmentpolicy measures, may, in a reverse flow of influence, be sufficiently strong to offset the impactof NAFTA and even determine the shape the NAFTA regime itself takes over time.
To understand NAFTA’s environmental effects, it is thus necessary to examine in some detailthe operation of four linkage processes:
• production, management and technology;• physical infrastructure ;• social organization; and• government policy.
A. Production, Management and TechnologyThe first linkage to the environment is the process employed by the production unit (usually afirm) that carries out NAFTA-associated trade and investment, or is otherwise affected by it, andthe technology and management employed in this process. An analysis of the production unit atthis micro level allows for a detailed examination of a broad range of NAFTA connections, andof its complex environmental impacts. It also permits a detailed tracing of the specific process bywhich NAFTA affects the environment. In so doing, it enables policymakers and otherstakeholders to target potential interventions with precision, ensuring maximum effectiveness.
The environmental stresses and supports of NAFTA-associated production depend on thefollowing variables:

Analytic Framework for Assessing the Environmental Effects of NAFTA
60
• inputs,• production efficiency,• physical technology,• management standards,• product characteristics and prices, and• sectoral and geographic concentration.
Each of these is discussed in turn below.
1. Inputs. This includes raw materials and other inputs to the production process, their sources,and the ecological capital (renewable and nonrenewable) they represent. In all cases, theymay consume natural resources, or lead to greater emissions as they flow through theprocessing chain than would alternative inputs.
For example, it is of environmental importance whether North America’s electricity isgenerated by high-sulfur coal as opposed to wind or geothermal sources, whether maize orthe feed grains for cattle feedlots is produced using high levels of pesticides, and whether thegasoline in North America’s automobiles is produced with or without lead, sulfur or benzene.
2. Production efficiency. This focuses on the efficiency of the process which converts inputsinto products. Highly efficient production processes reduce the volume of raw material andother inputs, generate fewer emissions, scrap and waste, and increase the overall profitabilityof the enterprise, including the funds available for technological modernization andenvironmentally-enhancing investments. Efficiency includes the degree to which scrap fromone process within a plant or firm is reused internally as an input to another process orproduct.
The competitive pressures intensified by NAFTA may produce a strong incentive to generatesuch production efficiencies. For example, some leading firms in the highly integratedautomotive parts sector have a target and a record of “zero to landfill” production. The trendof the major automotive assemblers to rely ever more heavily on Tier 1 and Tier 2 suppliersfor the development and supply of components and modules, and the use of “target pricing”with successful suppliers is generating a constant incentive to reap such efficiencies and thuslower costs and prices throughout the value chain.
Thus far, post-NAFTA trends in trade and investment do not appear to be leading to greateremissions. In Mexico, most of the new maquiladoras are not in industries that produce manypollutants, such as steel or chemicals. Rather, most of them concentrate on electronics, carparts, advanced electrical equipment, electrical household appliances, computers and parts,and office equipment with relatively little and declining (per units of output) emissions.
More generally, the emissions associated with particular firms, industrial plants and sites canbe assessed by reviewing the data of such sources as the US Toxics Release Inventory andthe Canadian National Pollutant Release Inventory. Over time, as these two inventoriesachieve greater data harmonization and the Mexican inventory begins generating data, they

Analytic Framework for Assessing the Environmental Effects of NAFTA
61
can assist in assessing NAFTA’s environmental effects. Such assessments, and those fromnational enforcement records, can provide a useful indication of which NAFTA-associatedfirms and industries are generating the greatest environmental stresses and fewest supports,and the particular geographical areas associated with the greatest environmental stress. Intime, such data could contribute to computable general equilibrium models to help assessNAFTA’s environmental effects.
3. Physical technology. This considers the physical technology employed in production,including technology that can increase overall efficiency (greater production with lowerinputs, emissions and waste) and technology devoted specifically to environmental purposes(such as pollution prevention technologies). Of greatest general relevance is the modernityand transferability of the technology. It is important to examine the investment in and use ofgeneral and environmentally-specific technologies, their price, cost and effectiveness, theability of the workforce to effectively employ them, and the speed of the innovation,development, adoption and diffusion of state-of-the-art technologies.
Technology is a critical factor in increasing the overall productivity of the firm or sector.Such productivity increases can bring significant environmental benefits. Increasedefficiencies bred by the use of the most modern technology in production generally imposeless environmental pressure, allowing aggregate environmental impacts to be held constantwith increasing levels of production. There are cases, however, where technicalimprovements can lead to the depletion of a renewable resource.
The advent of NAFTA, and the new competitive incentives and resources which it hasbrought, have generated several significant instances of environmentally-enhancingtechnological modernization. In the maize sector in Mexico, it is fostering the use in cornproduction of high-precision farming, soil management techniques, integrated pestmanagement methods. In the case of cattle feedlotting, there is a growing use of waste andwater recycling and biotechnology to control methane emissions.
More generally, technology is a critical factor in increasing the overall productivity of thefirm or sector, and such productivity increases can bring significant environmental benefits.The static yields and low level of investment and technology in maize in Mexico in the 1990spoint to the difficulties that low technology and poor productivity bring about.
The resources to speed technological modernization can come significantly from foreigndirect investment. This process appears to be underway in several sectors in Mexico. Recentincreases in investment in food and beverages in Mexico have been directed mainly to beer,bottled mineral water, preserved foods and vegetables, alcoholic beverages, snacks and fastfood stores. In most of these cases the foreign investor is in a joint venture with Mexicaninvestors and contributes investment funds that have been used to increase manufacturingand export capacity. Much of this increase has come in the form of new plants thatincorporate the latest technology, as efficiency has been a major driving force in thestrategies of investors. This is regarded as essential for the firms to compete in the newlyopen, full North American marketplace.

Analytic Framework for Assessing the Environmental Effects of NAFTA
62
In the sector of metallic goods and machinery in Mexico, FDI has been mainly in the autoindustry. It takes the form of wholly owned facilities by US investors. This investment isfocused on upgrading and re-tooling existing Mexican plants of auto firms. Such projectsoften entail extensive adaptation and modernization of the plants. This is also the case withengine plants. Here US investors have brought new models of engines and more efficientproduction facilities and processes. The new engines replace models (and technologies) thathave been in Mexico since the 1970s and that were mainly acquired by state firms. Suchfirms were privatized in the 1990s and their plants overhauled by the new owners. The latterinclude Dina, Cummins, and Mercedes Benz, producers of truck engines and trucks.
The technology brought about by the new owners involves new models of engines, withconsiderably more efficient combustion, reduced noise and fewer emissions than the enginesthey replace. The plants were re-tooled to make production runs more efficient and cleaner.All of them introduced new emission control equipment and made environment a specificarea in the plant’s organization.
4. Management standards. This factor has at its core the dominant strategic managementsystems for production units and firms, in both their economic and environmentaldimensions. It also includes strategies adopted or devised to respond to NAFTA-affected andother incentives, the presence and use of a high-standards environmental management systemor industry-wide environmental code, and the way in which an “environmental culture”permeates management and the firm as a whole. Also relevant is the presence of outsidestakeholders, including private citizen groups, in the operation of the environmentalmanagement systems.
In general, NAFTA has helped foster the use of modern, high-level, high-qualityenvironmental, health and safety management system standards within all plants, firms andtheir suppliers, wherever they are located within North America or oversees. NAFTA hasaccelerated the integration of manufacturing processes in North America, which compelsproducers to maintain steady flows of inputs and products countries. This is most evident inthe auto industry, which now regards the whole region as a single site for production as wellas being a single market. Other industries following the same trend are car parts, electronics,office equipment, chemicals, textiles, professional equipment, sporting goods and manyconsumer products.
Many of North America’s leading multinational corporations are now moving from a“reactive” concern with regulatory compliance to emphasize eco-efficiency—strategicallyand proactively considering the use of best environmental practices as a way of increasingthe shareholder value of the firm as a whole. They thus employ the highest managementsystem standards seamlessly throughout their global operations.
This is also true for major multinationals headquartered and owned outside North America.In Mexico, NAFTA has encouraged many investments by European and Japanese car partmanufacturers to produce electrical components, windshields, plastic and aluminum parts,and electronic equipment. These firms have incorporated the same technique of production astheir parent companies in Europe and Japan use, as well as the same controls on emissions

Analytic Framework for Assessing the Environmental Effects of NAFTA
63
and management of scrap and residual materials and water. They include many suppliers forvehicles made by VW, Mercedes and BMW, companies who demand that their suppliersfollow the same high standards as they, the flagship firms at the center of the businessnetwork, do.
A similar process is at work in Mexico’s maquiladoras. The plants of the third generation ofmaquiladoras follow high standards of efficiency, safety, and emission controls in theirequipment, technology and organization. Managers follow detailed manuals and report on aconstant basis to divisions in the US parent company. Supervision by US managers on thebasis of US standards is intense, in particular with regards to environmental controls. Morerecently, very rigorous supervision has been introduced on maquiladora shipments to theUnited States to prevent drug smuggling. Appropriate standards for firms to avoid problemsinclude strict control of the product flow and the contracting of transport firms and customsclearinghouses.
Environmental concerns and controls figure prominently in the standards adopted by foreigninvestors in the NAFTA region. Most of the investors acquiring positions in NAFTA arelarge, resourceful and visible firms. Most of these foreign investors are under great pressureto maintain a leading presence in key markets, but they face global competitors of similarlylarge size. This applies to automobile, oil, chemical, consumer goods, office equipment,computer, and service industries, the last ranging from telecommunications to banking. Suchlarge firms adopt appropriate environmental standards in order to minimize contingent costs.
From an economic standpoint, there is a compelling case for using the same technicalstandards and management systems in the affiliates and subsidiaries of large Canadian or USmanufacturing investors in Mexico as in their countries of origin. Most of the investments inmanufacturing have been made with the objective of integrating the Mexican plant with thenetwork of parent company facilities elsewhere. This means that the Mexican plant is part ofa global program of production: what products are produced, and how, is centrallyprogrammed, and the timing for delivery is critical to the efficient operation of the wholenetwork.
This means that the Mexican plant must use the same production techniques as in theinvesting country. Whenever this condition is not met, the Mexican plant is closedtemporarily for re-tooling or technological upgrade. This explains the major transformationin recent years of auto industry plants, as well as of those producing engines, officeequipment, electrical appliances, and textiles.
For the same reason, the environmental controls are the same as those the parent companyhas in place in any plant of the same type in the world. This minimizes the contingent legalcosts and potential fines or the closure of facilities by the local authorities. Such a closure oreven the threat of it causes great disruption to any plant whose production participates in theforeign investor’s global network of integrated, just-in-time production.
NAFTA has also facilitated the entry of smaller investors into Mexico by setting clear rulesand providing certainty. Nevertheless, there is not yet an inflow of investments by small

Analytic Framework for Assessing the Environmental Effects of NAFTA
64
firms. Substantial barriers to entry remain, such as the large operating scale needed in manysectors for profitable results. Overcoming differences between the country of origin and thedestination country is another barrier, particularly when the latter is Mexico. Mexico has lessadvanced distribution channels than the United States or Canada, lower levels of bankfinancing, and insufficient infrastructure. These differences are a deterrent to small investorswho lack the capital and resources to overcome them.
5. Product characteristics and prices. This factor includes the key environmentally-relatedcharacteristics of the product and its price, including the environmental emissions andsupports flowing directly from this product. Relatively high prices for a product may sustainactivity and prevent strategic or market-driven substitution of alternative products withdifferent environmental impacts. Also important are the performance, use and ultimatedisposal and reuse of the products. Attention should be placed on components of productswhose effects are not yet fully known.
Examples of the environmental consequences of such product characteristics abound. Thecase of Mexican maize shows that relatively high prices for a product such as traditionally-cultivated maize may sustain activity and prevent strategic or market-driven substitution ofalternative products with different environmental impacts. The energy efficiency of electricalappliances and the reuse of newsprint has important environmental consequences. There area host of concerns surrounding the environmental and health effects of additives in gasoline,such as MMT and MTBE. Likewise, mercury emissions from coal-generated electricityproduction have uncertain effects that warrant attention.
6. Sectoral and geographic concentration. This includes the size, number, relative share ofproduction and geographic concentration of production units in the sector. NAFTA-inducedcompetition, specialization and rationalization may well reinforce comparative advantage andproduce a geographic concentration of production in a few large, well-endowed firmscapable of serving the entire North American marketplace.
Sectoral concentration may consolidate production in a few large firms with the resourcesand visibility to engage in state-of-the art environmental performance. It may also clusterproduction activity in environmentally permissive locations, where the ecosystem is nothighly stressed and where environmental regulatory oversight by government authorities, andmonitoring by citizens, is strong.
Concentration in itself is not an environmentally enhancing, or endangering factor.Clustering of production in a few large firms in a single location may increase economies ofsupply and distribution, or lead to an accumulation of environmental stresses or supports.Although small-scale production is often more environmentally friendly, large productionunits can offer economies of scale that have the potential to be more efficient and thus lessenvironmentally degrading. In general, profitable enterprises are better able to invest inenvironmentally friendly production methods, or provide more direct environmentalsupports.
The environmental impact of sectoral and geographic concentration depends on a process ofstrategic calculation and adaptation by those managing production units, a process that can,

Analytic Framework for Assessing the Environmental Effects of NAFTA
65
for example, enable those directing large units to invest in greater environmental controls. Itis thus important to consider in detail the particular incentives that managers of large andsmall production units respond to, the strategies they adopt, and the role environmentalvalues play in this process.
The evidence to date suggests the multifaceted environmental impacts that sectoral andgeographic concentration, together with underlying strategic calculation by managers, have.In the cattle feedlot and beef packing sectors, NAFTA appears primarily to reinforcecomparative advantage and concentrate production in a few large (US-owned) firmsclustered in a single location (with its epicentre at Garden City, Kansas). These firms havethe size, profitability, visibility, and international marketing power to induce the wideradoption of state-of-the-art production methods, technologies and management systems.Concentration does increase point source air pollution and waste management problems butalso offers opportunities for recycling and easy regulatory oversight.
In the case of Mexican maize, economic and geographic concentration may diminish thediversity of inputs, such as seeds and genetic resources, and the array of technologies, infavor of a monoculture less able to withstand environmental shocks and more dependent onenvironmentally-demanding production methods such as irrigation and pesticides.Conversely, traditional small-scale production among many small households in the ejidosector does much to protect the often hilly landscape and associated water and forestresources.
In the electricity sector, concentration of production in older coal-fired units, centered in theUS Midwest can compound environmental stress. Conversely, production throughout NorthAmerica from numerous smaller enterprises engaged in co-generation, using wind orgeothermal sources or adopting new technology turbines can exhibit improved environmentalperformance.
B. Physical InfrastructureA second linkage process to consider relates to physical infrastructure. Much of theenvironmental impact of NAFTA-associated production comes from activity spread throughoutand taking place across North America, often in or over otherwise uninhabited areas. Suchactivity takes place as inputs are transported to plants and products to markets; as plants rely onthe water, wastewater and power generation infrastructure required for their operation; and asirrigation systems or other public works operate to sustain logistical and economic systems.
It is thus important to consider the character and environmental impact of the physicalinfrastructure that supports, sustains and connects the site-specific production units. Attentionshould be paid to the overall public and private investment in such infrastructure, the unusedcapacity of existing systems available for additional throughput, and the creation of, and needfor, new systems (including those in new locations) to handle additional demand.
Physical infrastructure includes facilities in the public or private sector required to transport andtransmit inputs and outputs of NAFTA-related production between suppliers, production sites,and markets, and to service production sites with basic inputs such as water, wastewater

Analytic Framework for Assessing the Environmental Effects of NAFTA
66
treatment, energy, and communications. The transportation/transmission infrastructure includes,among other things, roads, railways, ports, aircraft and airports, electrical transmission corridors,telecommunication grids, pipelines, irrigation canals, locks, dams, trucks, railcars, bridges, grainelevators and warehouses. The service infrastructure includes such items as water and sewageplants, irrigation systems, telephone and telecommunications networks, and the local productionand distribution of electricity.
Physical infrastructure plays a critical role linking trade and investment flows to the environmentin several ways. In general, transportation patterns will vary and have differential environmentaleffects, according to NAFTA-associated economic growth, privatization, logistical efficienciesand mode shift, or import substitution and changes in transportation distances. Especially in anera of regionally rationalized production systems and just-in-time inventory, the absence ofadequate or appropriate infrastructure can impede NAFTA’s liberalization from creating the newtrade volumes or flows that would otherwise arise. For example, the absence of interconnectioncapacity on the US-Mexican border has led to less US-Mexican electricity trade than the NAFTAregime encourages. Transportation and service infrastructure affects the location and volume ofproduction (including transborder investment flows), and the location and quality of life enjoyedby the local communities that provide the workforce and supporting infrastructure for plants. Inthe agriculture sector, investment in hydro-agricultural infrastructure is critical to reaping theefficiency gains promised by NAFTA.
To a large degree, the provision and operation of such infrastructure is regulated by local andnational authorities in their planning, siting, and environmental assessment activities. However,the NAFTA agreements placed importance on physical infrastructure in several ways. Theregion’s transportation and transmission infrastructure was, in cases such as the LandTransportation Standards Subcommittee and its mandate for the transportation of dangerousgoods, made the responsibility of the NAFTA institutions. Responsibility for serviceinfrastructure in the high impact area immediately adjacent to the US-Mexican border wasassigned to two institutions whose creation was catalyzed by the advent of NAFTA—the BorderEnvironment Cooperation Commission (BECC) and the North American Development Bank(NADBank).
Governments have an important role to play in providing and regulating the creation andoperation of physical infrastructure throughout the region. Physical infrastructure can also ensurethat such production and its distribution and consumption is more or less environmentallyfriendly. In tracing the environmental impact of the physical infrastructure that supports andsustains the site-specific production units and connects them to their inputs, customers, andstakeholders, several factors are of interest:
• existing infrastructure capacity,• correlation of capacity with concentrated activity,• choke points,• competitive corridors,• transporation/transmission scale,• intermodal shifts, and• distancing effects.

Analytic Framework for Assessing the Environmental Effects of NAFTA
67
Each is discussed in turn below.
1. Existing infrastructure capacity. The first factor is the capacity of the existing infrastructureto handle the existing and ongoing NAFTA-induced increments of production andtransportation. NAFTA may direct trade toward sectors and toward geographic locations,where the existing infrastructure can absorb the new traffic and demands, thereby obviatingthe need for new investments, new routes, and associated impacts on the environment. Thisappears to be the most likely short-term scenario in the case of electricity, wheretechnological solutions for interconnection and wheeling power appear able to provide amuch more intensively used integrated regional grid with few new transmission corridors oreven twinning of existing transmission lines required.
However, NAFTA-associated trade and investment may generate production that follows apath leading to environmental stress. For example, in Mexican maize production, theNAFTA-associated transition from traditional to modern cultivation methods is weakeningsupports for traditional terracing techniques, and generating increased demands formechanical irrigation systems and water.
A more environmentally positive result has arisen in the real estate sector, where a largeshare of the new post-NAFTA investment in Mexico went to tourist resorts on Mexico’s westcoast, Baja California, and the Yucatán peninsula. These involved construction of resorts anddevelopment of infrastructure to provide water, electricity and sewage to areas that had beenlargely underdeveloped until then.
Another portion of this investment went to the Santa Fe office and commercial developmentwest of Mexico City. The Santa Fe area had been for decades a site of garbage collection thatcaused substantial air pollution and contamination as the garbage was under intense sunlightand completely exposed to winds. The Mexico City government started the cleaning andrehabilitation of this entire area in the late 1980s. The area is now a modern and clean site ofoffice buildings and retail shops, with efficient use of space and green areas. Foreigninvestors from the United States, Canada and the United Kingdom took a major stake in thisdevelopment.
2. Correlation of capacity with concentrated activity. A second factor is how well existing andnew infrastructure capacity correlates, in place and form, with the new concentrations ofNAFTA-associated economic activity. NAFTA-generated comparative advantage andspecialization may concentrate new production activity at locations with an already well-developed transportation/transmission and local environmental infrastructure. While therewill be additional environmental impacts from increased use, incremental additions to a well-developed and regulated network can minimize environmental stress. They may even resultin environmental improvement by diverting activity from less efficient and more ecologicallystressed regions.
This appears to be the case with cattle feedlotting, which in the United States has come to beheavily concentrated along Interstate 35. That highway, running from Duluth to Laredo, has
Analytic Framework for Assessing the Environmental Effects of NAFTA
68
its epicenter in Kansas, where more than 300 motor freight carriers are headquartered. Itcarries 74 percent of all goods traded between the United States and Mexico by truck. Suchlocations also feature advanced service infrastructure and waste management facilities.
In contrast, along the US-Mexican border, since NAFTA came into effect, increases inproduction designed for export to the United States and accompanying production andpopulation concentrations continue to overwhelm the capacity of local infrastructure.However, these concentrations and resulting environmental stresses are not the result ofNAFTA but of the 1995 peso devaluation that generated a need for Mexico to increaseexports and sheer proximity to the US market. Indeed, NAFTA may well engender thegeographic diffusion of production by giving, over time, to all of Mexico the special tradeprivileges long enjoyed by only the border region. Moreover, the negative environmentaleffects, due overwhelmingly to the lack of local environmental infrastructure, may besubstantially diminished as the BECC and NADBank move into full-scale operation.
3. Choke points. NAFTA-generated trade may create choke points that generate localenvironmental stress where the transportation that carries trade increases or concentratesmore rapidly than new transportation/transmission infrastructure can be constructed toservice it.
For example, Texas alone accounts for over half the 3,326-kilometer US-Mexican border. Asubstantial 40 percent of total US exports to Mexico move south along Texas highways andrailways (Fry 1997, 8). This has raised concerns about the fumes and emissions from theheavy road traffic and idling trucks at border crossing such as Laredo, and the entry ofsubstandard trucks from one jurisdiction into another.
4. Competitive corridors. Competition on the part of coalitions of subfederal governments andprivate sector actors may create new north-south corridors from Canada to Mexico, to servicenew NAFTA trade in ways that will benefit their local jurisdictions.
For example, the Canamex Corridor runs from Edmonton to Mexico along US Interstate 15and involves Alberta, Idaho, Arizona, California, Montana, Utah and Nevada. A parallelRocky Mountain corridor currently contains extensive two-lane roads in southern Utah andnorthern Arizona. In Canada, no fewer than ten regional and corridor-specific initiatives havebeen launched. There is a possibility that such competitive corridor building may producemore local environmental stress than increasing the throughput of, or twinning, a singleexisting corridor. Government cooperation may also not keep pace with the newtransportation demands. In the most recent comprehensive survey of subfederal linkagesamong Canadian provinces and US and Mexican states, there were very few involving bothtransportation and environmental authorities (Munton and Kirton 1996).
Conversely, NAFTA may facilitate the foreign direct investment that integrates otherwisepoorly connected single systems into a much more efficient and environmentally friendlynorth-south grid. The recent takeover of Illinois Central Railroad by Canadian National, aspart of a single north-south system running from Canada to Mexico, appears to have thesecharacteristics.

Analytic Framework for Assessing the Environmental Effects of NAFTA
69
5. Transportation/transmission scale. The scale or volume of NAFTA-generated production,and thus of the transportation/transmission it requires, may increase fuel consumption,emissions, and accidents involving dangerous goods. Scale effects can be particularlyenvironmentally endangering where there is no additional throughput capacity in existingsystems, or where “twinning” existing systems (e.g., roads, rail lines, pipelines, electricitytransmission corridors) is less economically desirable than constructing new ones in differentlocations.
6. Intermodal shifts. The NAFTA-associated intersectoral or “intermodal” shift from one formof transportation to another may produce a net move to more or less environmentally friendlymodes. European evidence suggests that regional integration induces a shift fromenvironmentally friendly sea and rail transport to less environmentally friendly road and airtransport. There is a need to confirm the applicability of these findings to North America,particularly as partial data for Canada suggest a different pattern of environmental impact(CEC 1996a).
At present, trucks transport about 80 percent of freight shipments between the United Statesand Mexico and 60 percent between the United States and Canada. Bottlenecks appear moreextensive with rail and air than road transport, as parts of the southwestern United States andnorthern Mexico lack modern or standardized railroads, and the United States and Mexicoare far from having an “Open Skies” regime. It would be useful to monitor whether theportion of truck transport increases in the future and study the changing environmentalimpacts that trucks, especially under NAFTA-wide regulations relative to rail, sea and air,have in the North American setting. It would also be useful to consider how new systems ofelectronic data transfer, by substituting for the movement of more weighty physical elements,might result in an overall reduction in environmental stress.
7. Distancing effect. Finally, it would be useful to examine the distancing effect associated withlong distance transportation/transmission. The distancing effect refers to the move of theecological footprint of production far from the awareness and sense of responsibility of theintermediate and ultimate consumers and of their political authorities. To date, NAFTA’sinstitutions have had a variable record in producing high-level, region-wide, environmentalregulations to govern transportation. Work in transportation of dangerous goods isproceeding rapidly, while that regarding automotive emissions seems to have reached aplateau.
C. Social OrganizationThe environmental impacts of NAFTA-associated production further depend on the waystakeholders operate collectively in networks of social organization. Such networks, with theirbonds and obligations, add to and alter the impact of the rational incentives which economiccalculations alone offer. Loyalties to family, local community, to other groups joined by non-market considerations, and to particular values may all effect how NAFTA-associated trade,investment, production and transportation unfolds.

Analytic Framework for Assessing the Environmental Effects of NAFTA
70
Social organization has clear environmental consequences. Environmental enhancement flowsfrom a well-developed network of social organizations that can add important environmental,cultural and public values to economic and market logic. Conversely, ecological stress can arisewhen a rapid inflow of migrant workers to new production locations overwhelms theenvironmental infrastructure and existing community supports, or when outwards migrationleaves institutions and communities unable to carry out the traditional roles involved insupporting the environment.
In considering the environmental impacts of social organization, it is useful to examine sixfactors:
• civil society groups,• property rights,• culture,• migration, and• transnational coalitions and community formation.
Each is discussed in turn below.
1. Civil society groups. Social organization consists of well-organized and influential business,labor, community, consumer, and environmental groups, other cooperatives, and aboriginalcommunities. The strength of and balance among these groups is important, as it determineshow effectively they can operate in response to market forces and are able to create abroader, more inclusive sense of community
Different civil society groups react to and affect NAFTA-associated economic activity invarious ways. Some business associations are engaged in pollution prevention and voluntaryenvironmental standard-setting. An important component of social organizations are thevoluntary environmental and other standards created, administered and accepted by themembers of industry or professional associations. These can be created as needed in responseto, in anticipation of, or as an alternative to, government regulation. They can also serve asthe basis for regulation, as government-owned firms or departments adopt them or as they arereferenced in government legislation.
Traditional social units such as the family farm or ejido can be heavily affected byproduction changes flowing from NAFTA-associated trade and investment. The particularadaptation strategies they pursue are important in determining the environmental effects thatensue. For example, in the maize sector in Mexico, the incentives produced by NAFTA’sliberalizations do not yet appear to have induced people in the ejido to abandon theirtraditional way of life and cultivation practices on a large scale.
Environmental NGO’s can be an important source of the injection of greater environmentalawareness and custodianship into the practices and policies by which business andgovernments react to NAFTA-associated change. They have an important role in acting onbehalf of citizens to foster transparency, openness and public participation.

Analytic Framework for Assessing the Environmental Effects of NAFTA
71
2. Property rights. A second social factor is the system of property rights regimes that canprovide resources for environmental supports or respect values other than short-termprofitability. Important components are the extent to which surface and subsurface resourcesare publicly or privately owned, and the specific property rights which aboriginal or firstnations communities have.
The recent changes to the ejido sector in Mexico are of particular importance in this respect.Conversely, even within the market-based economy, NAFTA-related price changes can makerelatively low-priced products such as beef more affordable to low-income consumers, andthus reduce lifestyle differences based on socio-economic class.
3. Culture. A third social factor consists of the cultural values shared by local and nationalcommunities that give daily activities significance and render them relatively immune fromshort-term, rational economic incentives. These values may include a sense of ecologicalpreservation and custodianship that can be deeply rooted in a national or local community.
For example, the central place that maize occupies in the culture of Mexico makes it lesslikely that traditional production methods will be drastically altered by new NAFTA-associated market forces. Explanations of patterns of migration themselves are not fullyreducible to the rational structure of economic incentives but also reflect family and groupnetworks that have arisen over time (Marichal 1998).
4. Migration. A fourth social factor is migration and associated demographic change. Theseconsist broadly of community formation and change as workers and their families migratefrom one location in the NAFTA region to another to take advantage of employmentopportunities or to avoid unemployment (OECD 1998).
The environmental effects of migration are complex. Sudden clustering of populations inecologically sensitive areas, or locales without adequate environmental infrastructure, cancause environmental stress. It can also lead over time to the community organizations thatdemand environmental supports.
Emigration can also relieve environmental stress (as when it leads to reduced farming onmarginal lands). However, it can also reduce the availability of labor for social institutionsthat provide low-cost, community-based environmental supports (as with ejido labor inmaintaining terraces and other labor-intensive supports for environmentally adapted rain-fedmaize production in Mexico). NAFTA-induced concentration can place pressures on thefamily farm as the dominant production unit, and thus on the many rural communities whichsuch farms sustain. More specifically, NAFTA’s rules may have a direct environmentally-enhancing impact by allowing for the expanded temporary migration of businessprofessionals, including those involved in the environmental services industries, migrantworkers and tourists.
Migration to, and population concentration in, border areas and crossings and along newNAFTA transportation corridors and production centers, is of environmental importance.Also of interest is NAFTA-associated rural-to-urban migration, and the resultant impact ontraditional units such as the family farm.
Analytic Framework for Assessing the Environmental Effects of NAFTA
72
In the electricity sector, for example, restructuring, by facilitating the delivery of low-costelectricity to any location in North America, should reduce undue pressures for industrial andmigratory concentration. Here consumer and environmental groups in the United States andCanada are pressing, with some effect, for new regulatory regimes creating an “open grid”that would allow consumers from anywhere in North America to purchase electricitygenerated anywhere in North America from renewable sources. This electricity would thusbe produced and transmitted in ways that promote energy efficiency and nationalenvironmental objectives.
5. Transnational coalitions and community formation. A fifth social factor of importance isthe emergence of transnational coalitions and a common sense of North Americancommunity and identity across the region. Here, the processes of trilateralism and regionalintegration due to the NAFTA regime and its trade and investment flows may give rise to thedevelopment of trilateral transnational networks of civil society groups and a growingawareness of, and attachments to, a North American identity among individuals in the region.
There is considerable evidence of the emergence of trinational cooperative networks withinthe business community. For example, in 1996, Mexico’s National Livestock Councilreached an agreement with the US National Cattlemen’s Association to exchangeinformation and promote beef consumption in Mexico. In 1996 they reached a trilateralagreement to pursue joint cattle export opportunities in Asia and Europe. Trilateralorganizations of environmental NGOs and consumers have also arisen, although theirstrength and influence is uncertain.
The emergence of trinational networks and identities can do much to affect the NorthAmerican environment. The cooperation in voluntary, private sector–driven,multistakeholder standards-setting that has long flourished between Canada and the UnitedStates is now expanding to embrace Mexico. Voluntary standardization in environmentally-enhancing ways can be assisted by the NAFTA institutions, as they stimulate the work ofsuch societal equivalents on a trinational basis. The intensification of integrated productionsystems on a region-wide basis through trade and investment can have a similar effect,particularly if the NAFTA institutions or ad hoc initiatives toward intergovernmentalharmonization are unable, for other reasons, to move with sufficient speed or effectiveness.
Evidence suggests, though, that relatively few of NAFTA’s environmentally relevantinstitutions involve civil society groups (CEC 1997b). It further suggests that thoseinstitutions, insulated from concentrated industry involvement by multistakeholderparticipation or government-only operation, are more likely to rapidly generate high-levelregional environmental regulatory convergence. At the same time, NAFTA has createdinnovative processes—as in the Chapter 11 dispute settlement mechanisms, and in NAAEC’sArticle 14-15 citizen submission process—that give private citizens direct access tointernational bodies.
Beyond involvement in and the influence of the NAFTA institutions, the political andpopular pressure for improved environmental controls has grown throughout the NAFTAregion. This is an external factor that makes the presence of industrial plants with inferior

Analytic Framework for Assessing the Environmental Effects of NAFTA
73
environmental standards potentially costly and risky, diminishing the likelihood that largeforeign investors will be willing to engage in the practice. Contingent costs arising fromdifferent environmental standards are very difficult to calculate, while senior personnel mustgive too much costly time to legal and political problems that can arise from inferiorstandards.
Most generally, a common conception of regional identity and a sense of custodianship canultimately offset the “distancing effect” noted above and foster high levels of environmentalperformance anywhere in the region.
D. Government PolicyA fourth process that determines how NAFTA-associated economic change might affect theenvironment is government policy. At the national and subfederal levels, government policyplays a major role in forwarding programs that can reinforce, offset or otherwise alter the impactof NAFTA liberalization. Through direct expenditures, tax regimes, credit, subsidies, usercharges, set-asides and infrastructure and conservation programs, whether targeted toenvironmental purposes, to a particular sector, or to the economy as a whole, governments canprovide important environmental supports at a level and with a focus tailored to the newenvironmental pressures NAFTA-associated production might bring. Governments also imposeand enforce environmental regulations that respond to, or prompt, new developments inproduction and technology, and that can encourage a move to a high level of general andenvironmental regulatory convergence in North America. They can do so, and offer supports,where NAFTA is geographically or sectorally concentrating production activity.Intergovernmental action can facilitate the extension of such high standards and capacity throughregulatory convergence and other forms of international cooperation.
The environmental effects of government policy depend most broadly on the balance ofresources and linkages between state and society. In general, the responsiveness of the state tothe social organizations and the transparency and meaningfully balanced involvement of civilsociety in decision-making should strengthen the demand and capacity for environmentalenhancement. Moreover, a strong, resource-rich, high-capacity state is often required to protectthe public good that the environment represents, as in the creation of national parks, thepreservation of biodiversity, and the exercise of regulatory oversight over nonrenewableresources.
More specifically, the variables relevant when considering the role of government policy are:
• government intervention in the market,• jurisdiction over environmental policy,• balance between government branches,• strength of market-oriented government policies,• effects of specific government policies on the environment,• environmental surveillance and enforcement, and• trilateral cooperation at various governmental levels outside the NAFTA institutions.
Each is discussed in turn below.

Analytic Framework for Assessing the Environmental Effects of NAFTA
74
1. Government intervention in the market. The broad forces of state-society balance and statecapacity are first registered in the degree of government intervention in the market (orsociety), especially through the presence of state-owned enterprises. Although the threeNorth American countries began the NAFTA era with different mixes of state-societyrelations, there has been a general move in all three countries to less governmentalintervention. This move has varying environmental consequences.
For example, the current restructuring in the North American electricity sector may lead to alessening of public utilities’ previous demand-side management programs, and theirtraditional role as an employer of last resort. At the same time, as detailed in Appendix A, inthe case of Mexico’s opening of electricity and gas distribution, restructuring can prompt theinflow of a whole range of environmentally enhancing technologies and practices. To take aroughly parallel example—the case of agriculture in Mexico—the 1991 amendment toArticle 27 of the Constitution to allow private sector participation in ejidos has had variedconsequences for their adjustment under NAFTA.
2. Jurisdiction over environmental policy. A second factor is the division of responsibility forenvironmental and environmentally-related policy between federal and subfederalgovernments. In addition to the three national governments, the North American regioncontains nearly 100 states, provinces, federal districts, and major territories. These are in turnsubdivided into tens of thousands of counties and municipalities (Fry 1997). Of relevance isthe degree of centralization within the three federal systems of the member countries, and thenumber, diversity and capacity of subfederal governments within each.
The relatively highly centralized Mexican government contrasts with the extensive powers ofthe provincial governments within the Canadian federation, where an estimated 70 percent ofthe responsibility for environmental matters rests. The large number of states within theUnited States also creates great scope for regulatory diversity and can increase the challengeof coordination. As the case of cattle feedlotting suggests, environmental enhancement isincreased when the standards mandated by environmental regulations are high in thoseparticular subfederal jurisdictions where production activity is being concentratedgeographically by NAFTA’s dynamics of comparative advantage and other forces.
An important issue is the degree of federal-provincial cooperation in matters relating to theenvironment, including enforcement (explored below). For example, the scope of Canada’sfull participation in NAAEC depends in part on an intergovernmental agreement among thefederal and provincial authorities that governs the role of each. Also important is the effect ofdecentralization, a large number of subfederal units, and diversity in the environmentalconditions and regulations among each in enhancing the competitive pressures stemmingfrom NAFTA’s liberalization. These may intensify incentives to lower—or at least notraise—environmental standards to seek competitive advantage. This may be particularly truewhere subfederal jurisdictions are contiguous (and thus exposed by low transportation costs)to those in partner countries, especially where such jurisdictions have an economy dominatedby natural resource-based industries or relatively high polluting industries.

Analytic Framework for Assessing the Environmental Effects of NAFTA
75
However, such diversity can also allow subfederal jurisdictions, some of whoseenvironmental regulations are more stringent than those of federal authorities, to pioneer newand higher environmental standards that may become more widely adopted. Examples ofsuch policy leadership include the “California effect” in automotive emission controls, theinitiatives of Alberta and California in 1993 and 1994, respectively, to move to electricityrestructuring, and policies to promote “green” electricity in some New England states.
In general, however, diversity can complicate the process of setting common nationwidestandards, as indicated in the case of standard-setting among Canadian provinces for thetransportation of dangerous goods. It may also raise the cost of trade and even impede it byrequiring industry to produce products to meet different standards for several differentjurisdictions, some of which contain a small market. At the same time, NAFTA’s institutionsand intergovernmental cooperation among its member governments (see below) can helpovercome federal-subfederal differences to generate single, high-level regional standards.
3. Balance between government branches. A third factor is the balance within governmentsamong the executive, legislative and judicial branches. In general, the coordinated orconvergent involvement of all three branches in environmental policy is likely to promoteenvironmental enhancement. Pertinent within the executive branch is the balance andrelationship among environment, trade, foreign affairs, finance and industrial-sectorministries, and the role of central government in coordinating them. This would include theinvolvement of the head of state or government. An equal and integrated role forenvironment ministries and agencies, and the active involvement of leaders, will almostcertainly lead to environmental enhancement.
4. Strength of market-oriented government policies. A fourth factor is the strength ofgovernment polices to ensure freely functioning markets, rather than monopolistic oroligopolistic concentrations that are asymmetrical in their policies of access, informationdisclosure and transparency, and accountability. This includes government policies andinterventions to affect the macroeconomic and microeconomics forces discussed above.
Environmentally relevant policies here include unilateral or accelerated tariff reductions, theprovision of export credits, and regulations on FDI. An example of the latter is Mexico’s1995 opening of gas distribution to foreign investors. (See the Appendix for details.)
5. Effects of specific government policies on the environment. A fifth factor consists of the setof more specific government policies relevant to how NAFTA and its trade and investmentflows affect the environment. These include policies directed both at government operationsand outside society. The most important policies are as follows:
a. Procurement practices. This includes policies and practices of both national andsubfederal governments.
b. Environmental management systems used by state-owned enterprises. This includesthe use of systems, such as ISO 14000, by government departments and their operatingfacilities.

Analytic Framework for Assessing the Environmental Effects of NAFTA
76
c. Financial instruments. These include taxes, credits, subsidies, and user fees. Examplesare targeted financial incentives for customers to buy efficient appliances, subsidizedwater for irrigation for corn production in the United States, programs targeted tosustainability rather than income transfer or production of particular crops to agriculturalproducers, and the 1996 US Environmental Quality Incentive Programs (EQIP) for smalllivestock facilities to construct lagoons.
d. Government research and development. This includes the provision of technicalassistance, and the level of and targets for such supports, as against the environmentalstresses generated by NAFTA-associated production. The use of these programs byalready affluent producers, or by those seeking to invest in particular productiontechniques (such as highly irrigated and pesticide-intensive agriculture) with highenvironment stress) is also relevant.
e. Regulations, environmental assessment, and intellectual property rights. Theseinclude regulations allowing access for producers and consumers to transportationnetworks/transmission grids, or imposing uniform charges for electricity efficiency. Alsorelevant are regulations for environmental assessment, which affect the siting decisionsfor electricity generation plants as well as their resulting environmental quality. Domesticand international regimes for intellectual property rights can be important factors.
f. Environmental regulation of producers and products. Relevant here are directenvironmental regulation of producers (such as emission levels on old and new plants,US and Canadian regulations on beef processing and packaging), their inputs (forinstance, minimum content requirements in electricity), their products (includingdisclosure requirements and eco-labels) and their consumers (such as automotiveinspection and maintenance and end-use regulation of electrical appliances). Also ofinterest are environmental rules, such as the US NAAQS on SOx and Mexico’s 1994regulations on SOx and NOx, which diminish harmful air emissions from electricitygeneration plants.
g. Conservation programs. This includes direct conservation programs, such as the USSoil Bank Act of 1956, its descendant—the USDA Conservation Reserve Program, andpolicies for national parks and natural protected areas.
6. Environmental surveillance and enforcement. A sixth factor is the capacity andperformance of governments in environmental surveillance and enforcement, particularly inregard to sectors or locations under acute environmental stress, or in regard to substanceslikely to create it. This includes the capacity of governments for environmental reporting andmonitoring, their capacity for inspection and enforcement, their levels and quality ofinspections, and their use of various compliance-inducing measures.
7. Trilateral cooperation at various governmental levels outside NAFTA institutions. Aseventh factor is trilateral cooperation at the federal and subfederal level on environmentalissues. Such environmentally-related cooperation enhances environmental quality, notablywhen its deals with transboundary issues, but also when it relates to the global commons or

Analytic Framework for Assessing the Environmental Effects of NAFTA
77
domestic practices and problems. As with cooperation taking place through the NAFTAinstitutions themselves, it can take the form of communication, capacity building andresource sharing, the upward convergence of standards and cooperation in multilateralforums.
Thus far, such cooperation appears to be limited at the subfederal level. At the federal level,while the NAFTA institutions appear to be the central forums for fostering such exchanges,there is considerable intergovernmental activity emerging on a trilateral basis. In the future,such cooperation could come to include far-reaching innovations, such as a region-wideemissions permit trading system to assist the three countries in meeting their climate changetargets.
V. Indicators of Environmental Impacts Stemming from NAFTA
This section addresses the possible environmental impacts of changes from these four linkingprocesses, as a foundation for identifying indicators that would be most useful at this stage tomeasure NAFTA-induced or associated effects. Of ultimate interest is how NAFTA-associatedforces can or do create movement toward sustainability in each of the four major components ofthe ambient environment: air, water, land and living things. The measurement and monitoring ofindicators will require different techniques according to the particular problem under analysis. Inmost cases, heavy reliance will be made on data already being generated and collected byenvironmental agencies other than the CEC.
This analysis begins by exploring the ways in which both pressures and supports acting on theambient environment are created by these linkage processes. Environmental pressures areprocesses that increase the stress on the environment in its existing state by providing a furtherload on its absorptive capacity. Example of such pressures, or stresses, are pollution andemissions that flow from industrial and human activity. In the agriculture sector, in activitiessuch as maize production and cattle feedlotting, beef processing and packaging, and associatedfeed grains production, environmental pressures can take several forms. These include dams anddiversions for irrigation, overgrazing which causes soil erosion, water consumption in thefeedlot, pesticide and agricultural chemical use, and food residues.
The impact of such pressures must be considered together with environmental supports, whichcan be created by the same processes. Supports include waste management practices, such asanimal and nutrient management and manure disposal in cattle feedlotting. The socialorganization of maize production in Mexico, with its emphasis on communal terracing and theuse of a wide variety of seeds as an insurance policy against natural conditions, creates importantenvironmental supports for improving water quantity, preventing soil erosion and maintaininggenetic diversity. Creating such supports may be the deliberate target of government policies,such as the establishment of natural protected areas, and thereby constitute responses toenvironmental pressures or to changes in the state of the ambient environment.
The impact of such mixtures of pressures and supports will vary according to the existing state ofthe natural environment in the geographic area and particular ecosystem they affect. Although itis very difficult to establish precise stability thresholds for specific ecosystems, of particular

Analytic Framework for Assessing the Environmental Effects of NAFTA
78
concern are those instances in which small net increases in pressures over supports can have amajor catalytic and potentially irreversible effect on the ambient environment, or where a smallenvironmentally-enhancing intervention can generate large gains. Also of particular interest arehigh-impact locales—places where environment pressures concentrate to overwhelm theavailable supports. One such area may be the large hypoxic zone in the Gulf of Mexico at themouth of the Mississippi river, resulting from the contamination of surface water frompesticide/fertilizer application in the US Corn Belt.
Of ultimate interest is the cumulative impact of such pressures and supports on the air, water,land, and biota that constitute the ambient environment of an entire ecosystem. It is thusimportant to identify a set of indicators that measures change in each of these four ambientdomains. In doing so, it must be recognized that these major components of the ambientenvironment are interrelated in complex ways. It is the overall state of the ecosystem that is ofessential concern. It is thus important to add more inclusive, “aggregate impact” indicators—those that measure the consequences of change in a particular aspect of the ambient environmenton the natural ecosystem, human health, or the economy or society-at-large.
There are hundreds of possible environmental indicators that could be used for assessing theeffects of NAFTA on the ambient environment at both a general or sector/issue level. However,resource constraints make it impossible to assess all of them and, in any case, not all are equallyvalid. Some indicators are clearly more important than others, as evidenced by their morefrequent use in scientific and policy documents. The key indicators identified here are those thatare nationally or internationally recognized for their importance. They are of particular relevanceto the distinctive biophysical characteristics and ecosystems of the North American region and tothe environmental issues at the forefront of public and policy interest in NAFTA. They should beconsidered in general analyses and by all sector/issue studies. Not all of these indicators will berelevant for every sector/issue study. However, this set can act as a starting point or checklist foridentifying environmental effects at the same time that detailed sector/issue specific indicatorsare being developed and analyzed.
Several guidelines were used for identifying the key indicators identified below. The first was toinclude all pollutants for which there are national ambient standards, objectives or guidelines inCanada, Mexico or the United States. Eight air pollutants and 44 water pollutants (related todrinking water standards) fall into this set. Second, many of the environmental indicatorscurrently recommended by the OECD and employed in that organization’s environmentalperformance reviews of the three NAFTA countries make up an additional set. Third, theseindicators are those which best meet the core methodological criteria of scientific validity,representativeness, responsiveness, early warning potential, data availability, accuracy andaccessibility, understandability, comparability to reference points, comparability with indicatorsdeveloped in other jurisdictions, cost effectiveness, and clarity. Fourth, they include someindicators that incline toward an aggregate analysis. These do so because they encompass morethan one specific indicator within a single medium of the ambient environment, or they applyacross different media. They may also connect indicators of the ambient environment with thepressure, state, response environmental model; with the four linkage processes (see § III above);or with core economic dynamics identified above in § II.

Analytic Framework for Assessing the Environmental Effects of NAFTA
79
The following list of indicators, generated according to these criteria, concentrates on thosewhere reliable cross-national data is currently available, so that application of this frameworkmight proceed immediately. In the longer term, this should become a less important constraint onthe selection of indicators, as additional environmental data becomes available and monitoringefforts expand. The list thus emphasizes indicators relating directly to the four dimensions of theambient environment (air, water, land, biota) and aggregates impacts on ecosystems as a whole.A balance across all four ambient domains has been sought, within the constraints set by ease ofmeasurement and resulting data availability. Within each of these four ambient domains, aneffort has been made to include indicators relating to pressures, states and supports or responses.
A. Air indicatorsAir, or the atmospheric environment includes local and regional air quality, pollution levels, andbroader processes, such as stratospheric ozone depletion and climate change. There is a standardlist of indicators of atmospheric quality generally accepted by the scientific community (Maseraand Maclaren 1996; CEC 1996a, 114). Many of these are employed by federal governments ofthe NAFTA countries in their overall and sector-specific environmental monitoring programs.For example, US livestock facilities are subject to the National Ambient Air Quality Standards(NAAQS) under the Clean Air Act for six compounds: carbon monoxide, ozone, particulates,sulfur dioxide, nitrogen oxides, and hydrocarbons.
At present, the core air indicators best used to assess the environmental change associated withNAFTA are as follows:
1. Acid preciptation. The acidification of lakes and rivers diminishes their ability to supportaquatic life. Acid precipitation and dry deposition, caused principally by emissions andconcentration of sulfur oxides (SOx), primarily sulfur dioxide (SO2), damage forests andecosystems as well as buildings and highways, accelerate leaching of metals from rocksand soils, and decrease agricultural outputs. Effects on humans include eye andrespiratory system irritation. Children and those with respiratory disease are particularlysusceptible.
2. Ozone (O3) concentration. Ground-level ozone, the primary component of smog, is animportant air pollution problem shared by all three countries. High concentrations canlead to inflammation of the respiratory tract, respiratory illness in children, reducedpulmonary function, a decreased capacity for work and exercise, and even death.Individuals with heart or lung disease are more susceptible to all of these symptoms. Italso damages crops and ornamental plants. Principal ozone precursors (in combinativereactions catalyzed by sunlight) are:
• Nitrogen oxides (NOx). These ground-level ozone precursors also contribute to acidprecipitation, dry deposition and photochemical smog. They are chiefly produced byhigh-compression internal combustion engines, as well as by some industrialfurnaces, and by lightening.

Analytic Framework for Assessing the Environmental Effects of NAFTA
80
• Volatile organic compounds (VOCs). VOCs are produced by fossil fuelcombustion, as well as by incinerators, gasoline and petrochemical vapors, paints andsolvents, and various industrial processes.
3. Particulate matter (PM). This is a broad category of air pollutants that includes a rangeof small solids or liquids that vary in size and chemical composition. Some particles areacidic “acid aerosols.” There are particle categories that include toxic substances, such asheavy metals, polycyclic aromatic hydrocarbons, as well as numerous other organiccompounds. Anthropogenic sources include industrial activities, incineration, agriculture,construction, and mobile sources. PM is commonly divided by size fraction:
• PM10 consists of fine particles 10 microns or less in diameter. These inhalableparticles have been implicated in chronic lung disease since 1979. They are alsoassociated with pulmonary and heart disease and are major contributors to urbanhaze. PM10 can reside in the atmosphere for hours or days before settling to earth.
• PM2.5 refers to the smallest and most dangerous fraction of particulate matter, thoseparticles 2.5 microns or less—an estimated 60 percent of PM10 particles. They mayinclude a wide range of toxic metals and chemicals as well as sulfates and nitrates.PM2.5 have been implicated in cardiopulmonary illnesses, premature death due torespiratory disease, reduced pulmonary function, and bronchitis.
• Elemental metallic particulates. These can include toxic heavy metals, such asmercury (Hg) and lead (Pb). In biological systems, these are persistent andbioaccumulative, causing cancer, birth defects, organ damage, and disorders of thenervous system. Mercury, especially, can re-volatilize and be re-injected into theatmosphere by a variety of mechanisms, moving hundreds or thousands of kilometersfrom its original sources.
4. Persistent organic pollutants (POPs). These are organic molecules, often of extremelyhigh toxicity, characterized by low water and high fat solubility. This causes them tobioaccumulate to high levels as they move up the food chain. Many POPs arepesticides—such as mirex, toxaphene, DDT, and chlordane—and others includepolychlorinated biphenyls (PCBs), dioxins and furans, and various other byproducts ofindustrial processes. Some POPs are now known to function as endocrine disrupters andinterfere with the functioning of hormones. Others may be responsible for decliningsperm counts and rising levels of birth abnormalities among certain human populationsand affected animal species.
5. Carbon monoxide (CO) emissions and concentration. This compound impedes theabsorption of oxygen into the bloodstream, causing headaches, nausea, fatigue, andimpairment of judgement. In extreme concentrations, it is lethal. Produced by mobilesources and fossil fuel combustion, in terms of volume, it is the single most importantcomponent of air pollution. CO oxidizes readily in the atmosphere to form carbondioxide, which is involved in the cycle of global warming.

Analytic Framework for Assessing the Environmental Effects of NAFTA
81
6. Carbon dioxide (C02). The fourth most abundant gas in the earth’s atmosphere, carbondioxide poses no direct threats to human health. However, the gas is implicated in globalwarming through its contribution to the greenhouse effect, and its output fromcombustion activities in developed and developing countries is probably exacerbating thisphenomenon.
Further development and use of this framework should concentrate on establishing the cross-national comparability of such scientifically and governmentally accepted core indicators. Thisprocess could begin with those dimensions currently in the forefront of scientific interest andclosely associated with such economy-wide practices as electricity generation and automobiletransportation—notably particulate matter, ground-level ozone and sulfur dioxide. It might alsoinclude other air quality parameters that arise in particular industries of interest and which arenot currently subject to widespread or full federal and subfederal monitoring. In the case of cattlefeedlots, for instance, such parameters could include dust, ammonia emissions from manure anddust, particulates, methane, and reactive organic compounds. It could also focus on emissions notyet widely monitored but considered important, such as mercury emissions from electricitygeneration, or on ensuring that such national monitoring programs and regulations are introducedon a comparable, region-wide basis.


Analytic Framework for Assessing the Environmental Effects of NAFTA
83
Table 4: Air indicators
Indicator Source/Organization
Countries Objective Measurement unit Smallestspatial scale
# oflocations
Time period Frequency
OECD
OECD Environmental DataCompendium—1997
Canada,Mexico
none mean annual pH,concentration of SO4
=
(mg/l)concentration of NO3
-
(mg/l)
national n/a Canada(1980–95)Mexico1990–95
unknownAcidprecipitation
DDF (Department of theFederal District)Government of Mexicowww.ine.gob.mx/indicatores/ingles/indice amb.htm
Mexico none pH of precipitation(pH<5.6=acid)
municipal(urban)
unknown 1987–95 annual
Environment Canada—National EmissionsInventory of CriteriaPollutantshttp://www.ec.gc.ca/pdb/pdb_e.html
Canada none tonnes by sector state/provincial
unknown ? to present annual
INE (National Institute ofEcology)http://www.ine.gob/indicadores/ingles/ca2_31.htm
Mexico none tonnes/year municipal(urban)
32 1994 annual
SO2 (and SOx)emissions
OECDTowards SustainableDevelopment:Environmental Indicators(1998) (update of the 1991core set)
Canada,Mexico,UnitedStates
none total emissions (tonnes),% change since 1980
national,municipal(urban)
2 percountry
1980–mid-1990s
unknown

Analytic Framework for Assessing the Environmental Effects of NAFTA
84
Environment Canada—NAPS database
Canada desirable:11 ppb,30 µg/m3
(annual)acceptable: 23ppb,60 µg/m3
(annual)
µg/m3 monitoringstations
84 1974–present monthly
INE(National Institute ofEcology)www.ine.gob.mx/indicatores/ingles/indice amb.htm
Mexico 0.13 ppm(1 hour)0.03 ppm(annual)
ppm, IMECA(Mexico’s air qualityindex)
municipal(urban)
5 1988–96 Annual
US EPA—AIRS Datawww.epa.gov/airsweb/info.htm
UnitedStates
0.03 ppm, 80µg/m3 (annual)
ppm monitoringstations
759 1993–98 annual
SO2
concentration
OECDTowards SustainableDevelopment:Environmental Indicators(1998) (update of the 1991core set)
Canada,Mexico,UnitedStates
none µg/m3 national,municipal(urban)
2 percountry
1990–95 annual
Environment CanadaNAPS
Canada 30 ppb ppb monitoringstations
50 1974 to present monthly
US EPA—AIRS Datawww.epa.gov/airsweb/info.htm
UnitedStates
0.08 ppm,157 µg/m3
(8-hour average)
ppm monitoringstations
1042 1993–98 annual
Ozone (O 3)concentration
INEwww.ine.gob.mx
Mexico 0.11 ppm(1 hour)
ppm, IMECA (airquality index)
municipal(urban)
5 1988–96 annual
Total columnozone
OECDTowards SustainableDevelopment:Environmental Indicators(1998) (update of the 1991core set)
Canada,Mexico,UnitedStates
none total emissions (tonnes),% change since 1980
national,municipal(urban)
2 percountry
1980–mid-1990s
unknown

Analytic Framework for Assessing the Environmental Effects of NAFTA
85
Nitrogen oxidesEnvironment Canada—National EmissionsInventory of Criteria AirPollutantswww.ec.gc.ca/pdb/pdb_e.html
Canada none tonnes by sector state/provincial
unknown ? to present annual
DDF and state governments Mexico none tonnes per year bysector
municipal(urban)
32 1994–95 annual
NO2 (and NOX)emissions
OECDTowards SustainableDevelopment:Environmental Indicators(1998) (update of the 1991core set)
Canada,Mexico,UnitedStates
none total emissions (tonnes),% change since 1980
national,municipalurban
2 percountry
1980–mid-1990s
unknown
Environment Canada—NAPS database
Canada desirable:32 ppb,60 µg/m3
(annual)acceptable:53 ppb,100 µg/m3
(annual)
ppb monitoringstations
50 1974 to present annual
US EPA—AIRS Datawww.epa.gov.airsweb/info.htm
UnitedStates
0.053 ppm, 100µg/m3 (annual)
ppm monitoringstations
420 1993–98 annual
OECDTowards SustainableDevelopment:Environmental Indicators(1998) (update of the 1991core set)
Canada,Mexico,UnitedStates
none µg/m3 national,municipalurban
2 percountry
1990–95 annual
NO2
concentration
INEwww.ine.gob.mx/indicatores/ingles/indice amb.htm
Mexico 0.21 ppm(in 1 hour)
ppm, IMECA (airquality index)
municipal(urban)
5 1988–96 annual
Environment Canada—National EmissionsInventory of Criteria AirPollutantshttp://www.ec.gc.ca/pbd/pdb_e.html
Canada none tonnes by sector state/provincial
unknown ? to 1998 annualVOC emissions
US EPA—AIRS Datawww.epa.gov/airsweb/info.htm
UnitedStates
none tons per year country unknown ? to present annual

Analytic Framework for Assessing the Environmental Effects of NAFTA
86
Particulatematter (PM)
Environment Canada Canada ? µg/m3 monitoringstations
unknown 1995 to present monthly
US EPA—AIRS Data UnitedStates
50 µg/m3(annual)
ppm monitoringstations
1759 1993–98 annual
PM10concentration
INEDDF
Mexico 150 µg/m3 (24-hr max), 50µg/m3 (annual)
µg/m3 municipal(urban)
5 1988–94 annual
Environment Canada—Pollution Data Branch
Canada none tonnes by type ofindustry
state/provincial
unknown 1995 to present annual
Environment Canada—National EmissionsInventory of Criteria AirPollutants
Canada none tonnes by sector state/provincial
unknown 1995 to present annual
PM10 emissions
US EPA—AIRS Data UnitedStates
none tons per year county unknown ? to 1998 annual
Environment Canada Canada ? µg/m3 monitoringstations
unknown 1995 to present monthlyPM2.5
concentrationUS EPA—AIRS Data United
States15 µg/m3
(annual)ppm monitoring
stationsunknown 1993–98 annual
Environment Canada—Pollution Data Branchhttp://www.ec.gc.ca/pdb/cac/cacdoc/1995e/pm25_95.htm
Canada none tonnes by type ofindustry
state/provincial
unknown 1995 to present annualPM2.5 emissions
Environment Canada—National EmissionsInventory of Criteria AirPollutants
Canada none tonnes by sector state/provincial
unknown 1995 to present annual
Environment Canada—NAPS database
Canada none µg/m3 monitoringstations
118 1974 to present monthly
US EPA—AIRS Datawww.epa.gov/airsweb/info.htm
UnitedStates
µg/m3
(3-monthaverage)
ppm monitoringstations
465 1993–98 quarterly
INEwww.ine/gob.mx
Mexico IMECA (air qualityindex)
municipal(urban)
5 1993–96 annual
Pbconcentration
DDF Mexico µg/m3
(3-monthaverage)
µg/m3 municipal(urban)
5 1986–95 seasonal

Analytic Framework for Assessing the Environmental Effects of NAFTA
87
US EPA—AIRS Datawww.epa.gov/airsweb/info.htm
UnitedStates
none tons per year county unknown ? to 1998 annualPb emissions
DDF and state governmentswww.ine.gob.mx
Mexico none tonnes per year bysector
municipal(urban)
32 1994–95 annual
Environment Canada—National Air PollutionSurveillance (NAPS)
Canada desirable:5.2 ppm,6 mg/m3
(annual)acceptable : 13.1ppm,15 mg/m3
(annual)
ppm monitoringstations
53 1974 to present monthly
US EPA—AIRS Datawww.epa.gov/airsweb/info.htm
UnitedStates
9 ppm,10 mg/m3
(8-hour average)
ppm monitoringstations
552 1993–98 annual
COconcentration
INE (National Institute ofEcology)www.ine.gob.mx
Mexico 11 ppm in8 hours
ppm, IMECA (airquality index)
municipal(urban)
5 1988–96 annual
Environment Canada—National EmissionsInventory of Criteria AirPollutantswww.ec.gc.ca/pdb/pdb_e.html
Canada tonnes by sector state/provincial
unknown ? to present annual
US EPA—AIRS Datawww.epa.gov/airsweb/info.htm
UnitedStates
none tons per year county unknown ? to present annual
CO emissions
DDF and state governmentswww.ine.gob.mx/indicadores/ingles/indice
Mexico none tonnes per year bysector
municipal(urban)
32 1994–95 annual

Analytic Framework for Assessing the Environmental Effects of NAFTA
88
B. Water IndicatorsThe second sets of indicators includes those dealing with the quality and quantity of water ininland, coastal and underground areas, its use for purposes ranging from irrigation to drinking,and its subjection to the discharge of effluents and compounds such as pesticides and fertilizers.Water is both an essential part of the ecosystem and human health and a basic resource for mosteconomic activities and processes.
Water quality is directly affected by the activities in specific sectors. For example, agriculture isthe primary cause of surface water impairment nationwide in the United States. Groundwater,which supplies half the US population with drinking water, and is the sole source for most ruralcommunities, is a resource that is renewable only over long periods of time, and is subject tocontamination from such substances as pesticides and nitrates in fertilizers. There is also concernin some locations regarding water quantity—for instance, in the Ogallala aquifer underlying theUS Great Plains.
There are standard indicators of water quality and quantity generally accepted by the scientificcommunity (Masera and Maclaren 1996; CEC 1996a, 114). At present, the core water indicatorsbest used to assess the environmental change associated with NAFTA are as follows:
1. Quality of Drinking Water. This considers the presence of such harmful contaminants asVOCs, pesticides, PCBs, semi-volatile synthetic organic contaminants, antimony, arsenic,barium, beryllium, cadmium, chromium, cyanide, fluoride, mercury, nickel, nitrate,nitrite, and selenium. These contaminants are known to cause a wide range of healthproblems.
2. Freshwater use (by source/sector). Overuse of water resources can result in low riverflows, water shortages, salinization of groundwater in coastal areas, loss of wetlands,desertification and declining sustainability for agriculture.
3. Lead (Pb) Concentration. Concentration has adverse effects on human health.
4. Copper Concentration. High concentrations kill fish and cause brain damage in higheranimals.
5. Surface Water Pollutants. These include suspended solids, fecal coliform bacteria, andthe total content of phosphorus, nitrates, dissolved oxygen (related to biological oxygendemand––BOD). Fecal coliform bacterial level is an indicator of the possible presence ofpathogens. Nitrates and phosphates are the primary substances that cause eutrophicationof lakes and rivers. Reduced levels of dissolved oxygen affects the ability of a body ofwater to assimilate wastewater and to support fish and aquatic plant life. Extremeconditions, such as at the mouth of the Mississippi River, result in “dead” zonesincapable of supporting life.
6. Fish Capture. Conservation of fish stocks requires a balance between biologicalproductivity and harvesting rates. Lower fish captures can indicate water qualityproblems.

Analytic Framework for Assessing the Environmental Effects of NAFTA
89
7. Sewage Treatment Connection Rates. Discharge of untreated used water is one of theprime causes of water contamination. This element of physical infrastructure is anindicator of efforts to decrease pollution loads.
Further development of the framework could usefully concentrate on reliable cross-nationalinformation gathering and monitoring of that subset of indicators which is critical inenvironmentally salient sectors such as agriculture. Such a list for agriculture would include fiveindicators: (1) nitrates in groundwater at a threshold of less than the EPA drinking water standardof 10mg/L; (2) atrazine (a corn herbicide, the most frequently detected pesticide and a possiblecarcinogen) in ground and surface water; (3) phosphates, which cause oxygen depletion in water,eutrophication, and algae growth, in concentrations of as little as 0.05 mg/L; (4) biologicaloxygen demand (BOD)—which the EPA uses as a standard measure; and (5) and total suspendedsolids (TSS)—a measure also used by the EPA (Runge et al 1997a, 82).

Analytic Framework for Assessing the Environmental Effects of NAFTA
90
Table 5: Water indicatorsIndicator Source/Organization Countries Objective Measurement unit Smallest
spatialscale
# oflocations
Time period Frequency
Freshwater use (bysource/sector)
OECDTowards Sustainable Development:Environmental Indicators (1998)(update ofthe 1991 core set)
Canada,UnitedStates,Mexico
none overall estimates(m3/capita/year) as % oftotal resources,estimates by usecategory (municipal,industrial, irrigation)
national n/a 1980–95 unknown
Lead OECDEnvironmental Data Compendium—1997
Canada,UnitedStates
µg/L (annual mean) national n/a 1980–95 unknown
Ammonium OECDEnvironmental Data Compendium—1997
UnitedStates,Mexico
none mg/L (annual mean) national n/a 1980–95 unknown
Cadmium OECDEnvironmental Data Compendium—1997
Canada,UnitedStates
none µg/L (annual mean) national n/a 1980–95 unknown
Chromium OECDEnvironmental DataCompendium—1997
Canada,UnitedStates
none µg/L (annual mean) national n/a 1980–95 unknown
Copper OECDEnvironmental Data Compendium—1997
Canada,UnitedStates,Mexico
none µg/L (annual mean) national n/a 1980–95 unknown
Surface water pollutants(suspended solids, fecalcoliform, totalphosphorus, nitrates,dissolved solids,dissolved oxygen)
US Geological Survey (1990)US EPA, Office of WaterEnvironmental Indicators of WaterQuality in the United States(June 1996)
UnitedStates
none % of stations showingchanges inconcentration levels(downward trend,upward trend, or notrend)
national unknown 1980–89 annual
Fish capture OECDTowards Sustainable Development:Environmental Indicators (1998)(update ofthe 1991 core set)
Canada,UnitedStates,Mexico
none % of world capture,trends in total catchcompared to 1980levels, marine catch as% of total catch
national n/a 1980–95 unknown
Sewage treatmentconnection rates
OECDTowards Sustainable Development:Environmental Indicators (1998)(update ofthe 1991 core set)
Canada,UnitedStates,Mexico
none % of populationconnected withprimary/secondary/ter-tiary or no treatment
national n/a Canada &UnitedStates(1980–mid-1990s)Mexico(mid-1990s)
unknown

Analytic Framework for Assessing the Environmental Effects of NAFTA
91
C. Land IndicatorsThe third set of indicators relates to land. It includes soil quality and patterns of land use,including agriculture, forest cover and natural protected areas. Soil degradation is the mostserious threat to the agricultural industry over the long term. Agricultural pesticides, acid rainfrom burning of fossil fuels, deforestation from over-harvesting of timber, and poor wastemanagement practices can adversely affect soil health. In certain parts of North America, soilerosion due to deforestation already contributes to pollution of local streams and lakes. On otherparts of the continent, valuable agricultural land is lost each year from poor cultivation practices.Shifting trade patterns under NAFTA, particularly those involving timber harvesting, agricultureor mining operations, could affect soil health by advancing or slowing the rate of erosion, thelevel of salinity, or chemical contaminants contained in soil. Urban development spawned byNAFTA-associated investment may also encroach on agricultural lands, affecting productivecapacities. Finally, hazardous and solid waste disposal arising from industrial activities can leadto widespread soil contamination.
A general set of indicators to measure the major effects of NAFTA-associated activity on soil isas follows:
1. Intensity of pesticide use for agriculture. This component of production, technology andmanagement is important because pesticide use adds persistent organic chemicals toecosystems. Pesticides accumulate in soils and biota and are passed on to humans throughfood and water consumption. Residues leach into surface water and groundwater.
2. Nitrogen from fertilizers and livestock. Overabundance of nitrogen may exceed theassimilative capacities of soils. The surplus may seep into groundwater or run off intosurface waters, contributing to eutrophication.
3. Area of forested land. Forests have many functions, including provision of timber andother wood-derived products, recreational benefits, and ecosystem services. They providehabitat in support of biodiversity and act as carbon sinks.
4. Intensity of forest use. Clearcutting and over-producing through unsustainable harvestrates cause loss of habitat and affect wildlife survival.
5. Waste generation. This is best considered by type: household/municipal, hazardous,industrial, and nuclear. At its most benign, waste disposal consumes land. If improperlymanaged, especially with hazardous substances, disposal can have significant impacts onhuman health and the environment.
6. Recycling rate. Recycling reduces the need for waste disposal.
In a specific sector such as agriculture, attention should focus on indicators of soil erosion,conservation and other tillage methods, soil runoff (of substances such as nitrates), fertilizer andpesticide buildup from over-application, the overuse of marginal land from expanded agriculturalproduction, land left fallow, and land conversion. The spread of highly mechanized cultivationtechniques and irrigation suggest themselves as priority indicators.

Analytic Framework for Assessing the Environmental Effects of NAFTA
92
Table 6: Land indicators
Indicator Source / Organization Countries Objective Measurement unit Smallestspatial scale
# ofLocations
Time period Frequency
Intensity ofpesticide use foragriculture
OECDTowards SustainableDevelopment:Environmental Indicators(1998) (update of the 1991core set)
Canada,UnitedStates,Mexico
none active ingredients inkg/km2, % change since1980
national n/a 1980–mid-1990s
unknown
Nitrogen fromfertilizers andlivestock
OECDTowards SustainableDevelopment:Environmental Indicators(1998) (update of the 1991core set)
Canada,UnitedStates,Mexico
none tonnes per km2, %change since 1980(compared to totalagricultural output andGDP)
national n/a 1980–95 unknown
Area of forestedland
OECDTowards SustainableDevelopment:Environmental Indicators(1998) (update of the 1991core set)
Canada,UnitedStates,Mexico
none area as % of total landarea
national 1970s–95 unknown
Intensity offorest use
OECDTowards SustainableDevelopment:Environmental Indicators(1998) (update of the 1991core set)
Canada,UnitedStates,Mexico
none harvest as % of annualgrowth, % change inannual harvest, annualgrowth and growingstock since 1980
national n/a Canada &Mexico(1980s–90s)United States(1980s–90s)
unknown
Wastegeneration
OECDTowards SustainableDevelopment:Environmental Indicators(1998) (update of the 1991core set)
Canada,UnitedStates,Mexico
none household or municipalin kg/capita, % changesince 1980
national n/a Canada &United States(1980–mid-1990s)Mexico(mid-1990s)
unknown
Recycling rate OECDTowards SustainableDevelopment:Environmental Indicators(1998) (update of the 1991core set)
Canada,UnitedStates,Mexico
none % recycled (paper &cardboard, glass)
national n/a Canada &United States(1980–96)Mexico (1990–96)
unknown

Analytic Framework for Assessing the Environmental Effects of NAFTA
93
D. Biodiversity IndicatorsThe fourth set of indicators deals with biota, or living things. Biota encompasses overallbiodiversity, including all forms of living organisms, including animals, plants, micro-organisms,and humans. Flora and fauna are adversely affected by the pollution of soils, water andatmosphere that results from industrial activities and intensive agriculture and forestry. The lossand fragmentation of forests and wetlands (either through nonsustainable harvesting orconversion to other land uses) can also spell disaster for biodiversity. Animals and plants are anessential part of the environment and also serve as economic resources for human activity.Indicators should therefore reflect both aspects.
The core set of general indicators for biota are below.
1. Number of threatened/extinct species. Many ecological processes depend on wildlife,including native mammals, birds, fish, reptiles, amphibians, plants and, especially,insects.
2. Wetlands. Wetlands store and allow the slow release of large quantities of water, provideprotection from erosion, provide habitat for waterfowl and fish, and offer recreationalopportunities.
3. Protected areas. Healthy natural habitat of adequate size is necessary for speciessurvival.

Analytic Framework for Assessing the Environmental Effects of NAFTA
94
Table 7: Biodiversity indicators
Indicator Source / Organization Countries Objective Measurement unit Smallestspatial scale
# oflocations
Time period Frequency
Number ofthreatened/extinct species
OECDTowards SustainableDevelopment:Environmental Indicators(1998) (update of the 1991core set)
Canada,UnitedStates,Mexico
none number of speciesknown and %threatened by class(mammals, birds, fish,reptiles, amphibians,vascular plants)
national n/a most recentlyavailable
unknown
Wetlands US Fish and WildlifeService, US Department ofAgricultureOECDTowards SustainableDevelopment:Environmental Indicators(1998) (update of the 1991core set)
UnitedStates
none total area (acres) national unknown 1950s–1990s unknown
Protected areas OECDTowards SustainableDevelopment:Environmental Indicators(1998) (update of the 1991core set)
Canada,UnitedStates,Mexico
none number of sites, totalsize (km2/1000inhabitants), area as %of national territory
national n/a 1996 unknown

Analytic Framework for Assessing the Environmental Effects of NAFTA
95
E. Aggregate IndicatorsThe various components of the ambient environment specified above are interrelated in complexways. As the overall state and sustainability of entire ecosystems ate the ultimate concern ofanalysis, it is important to include more inclusive, “aggregate impact” indicators. Such indicatorsmeasure how change in a specific component of the ambient environment affects the naturalecosystem, human health, the economy, or society-at-large.
Such aggregate impact indicators or indices consist of two or more indicators. The greatestadvantage of an index is its ability to collapse the data contained in two or more indicators into asingle number and thus reduce the need for multiple indicators. A disadvantage of an index isthat it can hide the contribution of each individual indicator contained within it. For example,one indicator in an index might be very negative while the remaining indicators are very positive.They thus produce an index number that is positive, but that conceals the fact that onecomponent indicates a problem. Another concern in developing indices is the need to weigh andstandardize indicators reporting different units when aggregating them into a single number.Different standardization methods can produce different index values, as can differentweightings of the relative importance of the individual indicators.
All indicators reflect pressures, states, or responses in an ambient environmental medium. It isuseful to include indicators that embrace change in more than one environmental medium, or thatintegrate more directly the interactions among economic, social and environmental processes,since they often reflect, at least indirectly, the linkage processes that lie behind them.
Integrative indicators are particularly difficult to develop, given the current need for muchstronger theory to substantiate them. Some, such as photosynthetic balance, while conceptuallyappealing, remain difficult to apply in practice. On the other hand, in the case of severalindicators, promising progress has been made. For example, there is sufficient theoreticaldevelopment and empirical research to warrant the inclusion of “costs of environmentalremediation” as an integrative and embracive indicator here. The same is true for the “ecologicalfootprint,” an indicator that measures the impact of human consumption activities on air, water,land and biota. A now widely used integrative indicator is “energy intensity,” which measuresenergy consumed (and, by implication, pollution generated) by different approaches inproduction, management, technology and transportation across an entire economy.
The ten aggregate indices and embracive or integrative indicators identified in this section avoidmany of the pitfalls of index construction by aggregating only those indicators that are measuredin the same units. The indices include one for climate change, one for ozone depletion, one foreutrophication, one of acidification and one for the costs of environmental remediation. Theseindicators tend to be readily applicable. Four of these indices are being used on a regular basis inthe Netherlands for monitoring the performance of its 1989 National Environmental Policy Plan.This plan and the monitoring program associated with it have received worldwide attention as anexample of environmental performance monitoring (KPMG Milieu and TVA-Tilburg 1993).
The ten aggregate indicators or indices for general analysis are outlined below.

Analytic Framework for Assessing the Environmental Effects of NAFTA
96
1. Climate change. A commonly-used pressure index relevant for climate change is totalgreenhouse gas emissions. The index is the weighted summation of five gases thatcontribute to global warming: carbon dioxide (CO2), methane (CH4), nitrogen oxides(NOx), chlorofluorocarbons (CFCs) and halons. The theoretical foundation for theweights used in the index is strong, since the weights are based on the global warmingpotential (GWP) of each gas. One tonne of carbon dioxide has a GWP of 1 while theother gases are known to be larger contributors to global warming, per unit weight. Forexample, over a 100-year period, the GWP of methane is 11 times greater than carbondioxide while that of CFC-12 is 7,100 times greater. Multiplying the annual emissions ofeach gas by its GWP transforms the emissions into carbon dioxide equivalents (Ceq) andthen these amounts are summed across the gases to produce the index.
2. Ozone depletion. Stratospheric ozone shields human and other organisms from harmfulultraviolet (UV) radiation. Excessive exposure to UV radiation causes skin cancer,cataracts and immunosuppressive diseases in humans and animals. It also causesdegradation of materials, such as rubber, wood and plastics, and slows plant growth. Thedamage to the ozone layer caused by CFCs, halons and other ozone-depleting gasesdepends on their residence time in the atmosphere and the rapidity with which theycontribute to the destruction of ozone. These two factors determine the ozone depletionpotential (ODP) of ozone-depleting gases. An ozone depletion pressure index can beformed by multiplying the emissions of CFCs and halons individually times their ODPand then summing the products. Since generation—or the atmospheric liberation (in thecase of CFCs)—of these substances is assumed to be correlated with emissions, and sinceproduction data is usually more readily available than emissions data, a more accurateestimate can be achieved by using production rather than emissions data in the index.Indicator weights deriving from the ODP have scientific backing, and therefore overcomethe subjectivity inherent in the weights found in many types of environmental indices.
3. Acidification. The three main acid gases incorporated in this index of acidification aresulfur dioxide (SO2), nitrogen oxides (NOx) and ammonia (NH3). The contribution ofeach gas to the acidification of atmospheric water vapor or surface lakes and rivers isweighted by its acidic potential and expressed in acidification equivalents.
4. Eutrophication. Two major contributions to the eutrophication of water bodies arenitrates and phosphates. This index aggregates emissions of nitrogen and phosphorususing a weighting scheme that accounts for their potential eutrophication effect.
5. Cost of environmental remediation. The cost of environmental remediation refers to thecost of cleaning up polluted or degraded environments and reducing pollution generatedby human activity. Examples of remediation include building sewage treatment plants,cleaning up contaminated soil, installing pollution control devices in industrial plants,and replanting forests. This index is particularly attractive because it combines measuresof the economy (including production, management and technology, physicalinfrastructure, social organization and government policy) and the environment.
6. Ecological footprint. Although extremely complex to apply, this index is useful, as itproduces results that are easy to visualize. It estimates the total land area needed to

Analytic Framework for Assessing the Environmental Effects of NAFTA
97
produce all of the resources consumed by the population of a specific geographic unit(e.g., a city or country) and to assimilate the wastes discharged by that population.
7. Energy intensity. Greater efficiency in energy production and use reduces environmentalstress. This indicator also combines measures of the economy and the environment, anddoes so from a preventative rather than remedial perspective.
8. Human health costs of environmental pollution. Polluted air, water and land result inquantifiable hospital and health care costs from the illnesses they cause, which can becalculated and used as an indicator.
9. Energy mix (by source: coal, oil, gas, nuclear, hydro, other). This component ofproduction is important because higher reliance on fossil fuels in the energy mix isassociated with more severe local and regional air quality problems and with greaterproduction of greenhouse gas emissions.
10. Biological integrity. This index can reflect the cumulative effect of a wide variety ofchemical and physical stressors on natural ecosystems, and the extent to which theecosystem supports healthy biological communities.


Analytic Framework for Assessing the Environmental Effects of NAFTA
99
Table 8: Aggregate indicators
Indicators Source / Organization Countries Objective Measurement Unit SmallestSpatial Scale
# ofLocations
Time Period Frequency
Environment Canada,Pollution Data Branchwww.ec.gc.ca/pdb/pdb_e.html
Canada none tonnes CH4 by source,CO2-equivalents bysource
national n/a 1990–94 annualGreenhouse gasemissions (CH4,CFCs, NOx,CO2)
OECDEnvironmentalCompendium: 1997
Canada,UnitedStates,Mexico
stabilizeemissions by2000 at 1990levels
total annual emissions(tonnes)
national n/a 1995 unknown
CFCconsumption(includinghalons andHCFCs)
OECDTowards SustainableDevelopment:Environmental Indicators(1998) (update of the 1991core set)
Canada,UnitedStates,Mexico,industrial-izedcountries
CFCs andhalons—zeroproduction andconsumption,phase out supplyof HCFCs andmethyl bromideby 2005
tonnes, % change since1986, kg per capita
national n/a 1986–95 unknown
CFC production(includinghalons andHCFCs)
OECDTowards SustainableDevelopment:Environmental Indicators(1998) (update of the 1991core set)
Canada,UnitedStates,Mexico,industrial-izedcountries
CFCs andhalons—zeroproduction andconsumption,phase out supplyof HCFCs andmethyl bromideby 2005
tonnes, % change since1986
national n/a 1986–95 unknown
Energy intensity OECDTowards SustainableDevelopment:Environmental Indicators(1998) (update of the 1991core set)
Canada,UnitedStates,Mexico
none compared to 1980 level,energy supply and GDP
national n/a 1980–95 unknown
Energy mix (bysource: coal, oil,gas, nuclear,hydro, other)
OECDTowards SustainableDevelopment:Environmental Indicators(1998) (update of the 1991core set)
Canada,UnitedStates,Mexico
none total, % change since1980, structure bysource (share of total)
national n/a 1980–95 unknown
BiologicalIntegrity
US EPA, Office of WaterEnvironmental Indicators ofWater Quality in the UnitedStates (June 1996)
UnitedStates
none tons per year state 31 1992–94 annual

Analytic Framework for Assessing the Environmental Effects of NAFTA
100
F. Selection Criteria for Sector-Specific IndicatorsIn addition to referring to the common indicators of ambient and aggregate environmentalquality detailed above, sectoral or issue studies on the environmental effects of NAFTAwill need to investigate and develop indicators that describe sector- or issue-specific effectsin more detail. One consideration in the selection of these additional indicators is to seek abalance of pressure, state and response indicators. Another consideration is to narrowdown the range of possible indicators to a manageable set. The remainder of this sectionpresents several selection criteria that may be useful for deciding which indicators toinclude in that set.
The selection criteria are drawn from a variety of sources describing criteria for selectingenvironmental and sustainability indicators (Corvalán et al. 1997, Environment Canada1994, Forrest and Morrison 1991, Gallopin 1997, Liverman et al. 1988, Maclaren 1996,OECD 1994, and Pocock 1981). The inclusion of sustainability selection criteria isrelevant because sustainability indicators always comprise at least some environmentalindicators.
The ten selection criteria most commonly cited in the literature are as follows:
1. Scientific validity. This criterion normally refers to the validity of the indicator withregard to the system, issue, or environmental medium being described. Demonstratingthe existence and strength of the link between a pressure indicator and the state towhich it applies (e.g., the link between pesticide use in agriculture and water quality) isimportant in evaluating its scientific validity. Likewise, for a state indicator, thevalidity assessment could focus on showing the link between the state and a particularissue (e.g., between CO2 concentrations in the atmosphere and global warming).Alternatively, a judgment about the scientific validity of a state indicator might rest onthe significant impacts of that indicator (e.g., the significance of dioxin as a knowncarcinogen). Assessing the validity of a response indicator might involve showing howthe policy response can, in fact, reduce the level of a pressure indicator or improve thestate indicator.
In some cases, the scientific validity of an indicator is self-evident or can be deducedlogically, and does not need empirical support (e.g., the pressure indicator, amount ofwaste sent to landfill, is clearly linked to the state indicator, amount of landfill capacityremaining). Scientific validity can also refer to the validity of the measurement unitsbeing used. For example, total car ownership by residents in a city is an inadequateparameter for measuring air quality in that city as affected by automobile use. Arrivingat the indicator in this way excludes the contribution of cars driven by commuters fromoutside the city and ignores the fact that many people who own cars in the city may useother modes of transportation, particularly in the city’s inner core.
2. Representativeness. This criterion deals with the breadth of pressures, states orresponses covered by an indicator. A consideration of this is important because of the

Analytic Framework for Assessing the Environmental Effects of NAFTA
101
cost and time involved in collecting data for a very large number of indicators. Using asingle representative indicator cuts down on these costs. A common example of arepresentative indicator is fecal coliform, which is known to be correlated with anumber of other biological contaminants of water. The distinction betweenrepresentativeness and scientific validity is that a representative indicator correlateswith other indicators within a particular category of indicators (i.e., a representativepressure indicator correlates with other pressure indicators) whereas a scientificallyvalid indicator often refers to the correlation of an indicator across indicator categories(i.e., the correlation of a pressure indicator with a relevant state indicator).
3. Responsiveness. A responsive indicator should exhibit detectable changes during theperiod of analysis and respond to external stimuli, such as policy interventions.
4. Early warning capability. Some indicators can provide early warning of futureenvironmental problems because they anticipate changes in pressure or state indicators.For example, changes in the ozone layer typically lag several years behind changes inthe emissions of ozone-depleting substances. Therefore, increased emissions of ozone-depleting substances can provide an early warning of future deterioration in the ozonelayer.
5. Data availability, accuracy and accessibility. In practice, data availability may be thesingle most important constraint on the selection of indicators. Over the longer term,this is less a problem since the indicator development process can identify andrecommend areas where future data collection will be needed. Indicators that havesufficient data to show trends over time are most preferred. Data accuracy refers to thenecessity for collecting data that are free of errors. Data accessibility refers to situationsin which data are being collected but are not accessible to the public.
6. Intelligibility. The meaning of an indicator should be comprehensible to the targetaudience. Almost any indicator can be made comprehensible with accompanying textexplaining the meaning, but the impact of an indicator may not be as great if theaudience has difficulty understanding completely new or complex information.
7. Comparability to reference points. Typical reference points include targets, thresholds,regulatory standards, and national averages. The ability to compare an indicator toreference points is an effective method for measuring progress toward stated goals, andis therefore meaningful from a policy perspective. When using reference points in acomparative context, it is important to remember that different jurisdictions mayemploy different reference points for the same indicator.
8. Comparability with indicators developed in other jurisdictions. For the purposes ofmonitoring the environmental effects of NAFTA, the most desirable indicators, at leastinitially, will be those for which data and reporting systems already exist or are beingcreated in all three member countries. These indicators will facilitate continent-wide

Analytic Framework for Assessing the Environmental Effects of NAFTA
102
analysis of environmental effects. Over time, as data gaps are identified, theavailability of comparable indicators should increase.
9. Cost-effectiveness. The cost of collecting data may be a consideration in choosingamong potential indicators. For some types of data, it may be possible to reduce costsin the longer term by encouraging the growth of community-based monitoringprograms or by using remote sensing data.
10. Unambiguity. There should be general agreement about the meaning—positive ornegative—of an increase in the level of an indicator. For example, one potentiallyambiguous indicator is urban density. Empirical research has shown that higher urbandensities are associated with reduced gasoline consumption per capita (Newman andKenworthy 1988) and are therefore preferred over lower urban densities. On the otherhand, research has also shown that higher densities bring negative environmentaleffects (Gordon and Richardson 1989). Some argue that ambiguity is a desirablecharacteristic because it can stimulate debate about the message being sent by theindicator. Most experts agree, however, that such debate usually reflects the indicator’slack of utility.

Analytic Framework for Assessing the Environmental Effects of NAFTA
103
Appendix: Foreign Direct Investment Trends under NAFTA
This appendix explores the patterns of foreign direct investment, and related foreign portfolioinvestments, that have taken place in North America during the 1990s. It assesses the extent andways in which changes in the flow, stock and other aspects of this investment are associated withNAFTA. It also identifies, where possible, the environmental incentives these changes ininvestment have created, and the environmental impacts they have had.
In undertaking this analysis, it is important to recognize that as soon as the negotiation ofNAFTA started in 1991, investors assumed that the agreement would be approved by thelegislative powers of the three countries. Therefore, investments made during the years 1991–94can be considered as related to NAFTA. They are largely explained by the prospect of theagreement and the enlarged regional markets expected from it. Investors from within the regionwould be at an advantage over those from without, as they would enjoy a more favorable traderegime and guarantees over market access not extended to others from outside.
Similarly, the prospect of NAFTA also limited all new investments to those that could becompetitive in such a regime. This involved both the need for technical efficiency and the needfor firms to meet minimum standards of quality, and labor and environmental performance.
For these reasons, most of the flows of FDI as the NAFTA negotiations started were the result ofstrategic corporate decisions. Firms wanted to take positions in a market expected to grow underthe benefits of a new trade and investment regime. The new regime assured them of a continuedreduction in trade tariffs and, more significantly, it relaxed some restrictions for investing inanother country of the region. The latter included enhanced security to investors in case ofdisputes with the host government and the important principle of “national treatment,” alluded toabove. This principle compels governments to view investors from the partner countries as beingno different from domestic investors. It thus rejects discrimination on the basis of national origin.
An analysis in 1996 indicated that in NAFTA’s first few years in operation, Mexico was thecountry that recorded the greatest impact from this change of regime (Ramirez de la O. 1996a).Not only did the flow of FDI increase, but the new investment was also based on more moderntechnologies than existed in most of the equivalent domestic industries.
In assessing NAFTA’s effects over a longer period, it is important to begin with a recognitionthat the largest flows of FDI in the world originate in the United States. Indeed, the global trendsin FDI stem largely from the trends in US outward-directed FDI. The United States is also thelargest recipient of flows of FDI from the rest of the world. Flows to the United States haveincreased rapidly since the late 1980s, through the start of NAFTA, and have continued to rise inrecent years. The book value of the stock of FDI in the United States grew by 173 percentbetween 1985 and 1994 while that of US FDI in the rest of the world grew by 167 percent. Thisis indicated in Table A-1.
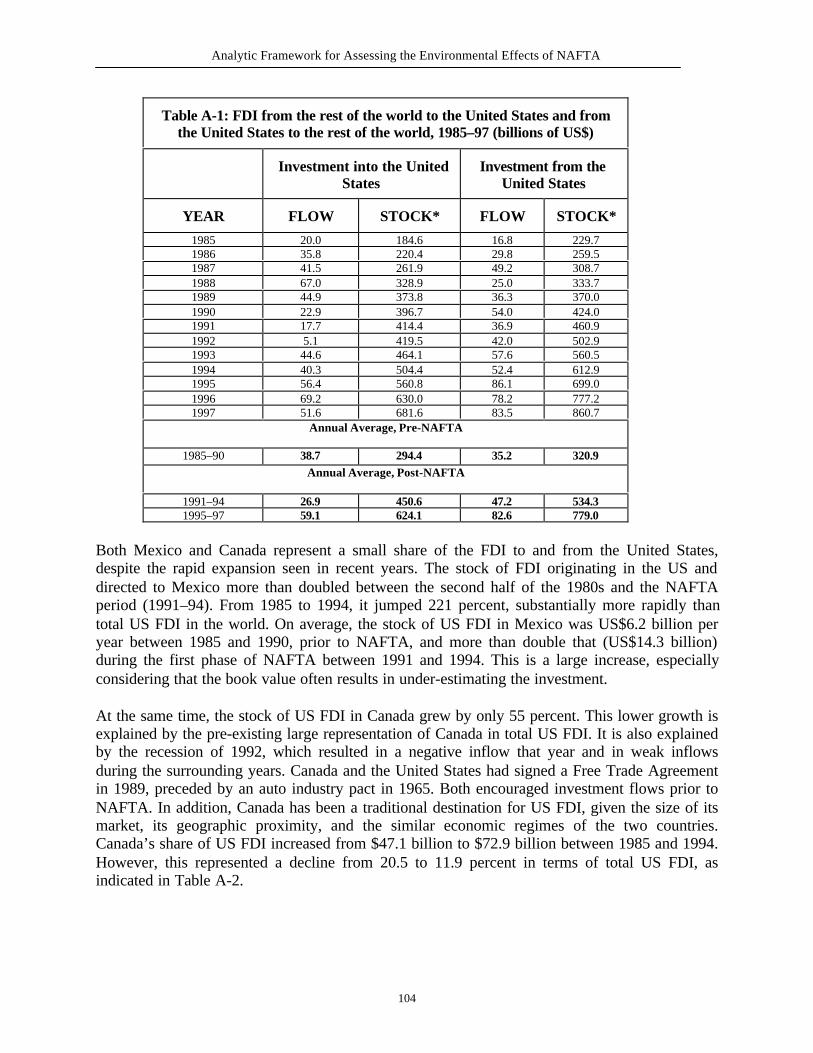
Analytic Framework for Assessing the Environmental Effects of NAFTA
104
Table A-1: FDI from the rest of the world to the United States and fromthe United States to the rest of the world, 1985–97 (billions of US$)
Investment into the UnitedStates
Investment from theUnited States
YEAR FLOW STOCK* FLOW STOCK*
1985 20.0 184.6 16.8 229.71986 35.8 220.4 29.8 259.51987 41.5 261.9 49.2 308.71988 67.0 328.9 25.0 333.71989 44.9 373.8 36.3 370.01990 22.9 396.7 54.0 424.01991 17.7 414.4 36.9 460.91992 5.1 419.5 42.0 502.91993 44.6 464.1 57.6 560.51994 40.3 504.4 52.4 612.91995 56.4 560.8 86.1 699.01996 69.2 630.0 78.2 777.21997 51.6 681.6 83.5 860.7
Annual Average, Pre-NAFTA
1985–90 38.7 294.4 35.2 320.9
Annual Average, Post-NAFTA
1991–94 26.9 450.6 47.2 534.31995–97 59.1 624.1 82.6 779.0
Both Mexico and Canada represent a small share of the FDI to and from the United States,despite the rapid expansion seen in recent years. The stock of FDI originating in the US anddirected to Mexico more than doubled between the second half of the 1980s and the NAFTAperiod (1991–94). From 1985 to 1994, it jumped 221 percent, substantially more rapidly thantotal US FDI in the world. On average, the stock of US FDI in Mexico was US$6.2 billion peryear between 1985 and 1990, prior to NAFTA, and more than double that (US$14.3 billion)during the first phase of NAFTA between 1991 and 1994. This is a large increase, especiallyconsidering that the book value often results in under-estimating the investment.
At the same time, the stock of US FDI in Canada grew by only 55 percent. This lower growth isexplained by the pre-existing large representation of Canada in total US FDI. It is also explainedby the recession of 1992, which resulted in a negative inflow that year and in weak inflowsduring the surrounding years. Canada and the United States had signed a Free Trade Agreementin 1989, preceded by an auto industry pact in 1965. Both encouraged investment flows prior toNAFTA. In addition, Canada has been a traditional destination for US FDI, given the size of itsmarket, its geographic proximity, and the similar economic regimes of the two countries.Canada’s share of US FDI increased from $47.1 billion to $72.9 billion between 1985 and 1994.However, this represented a decline from 20.5 to 11.9 percent in terms of total US FDI, asindicated in Table A-2.

Analytic Framework for Assessing the Environmental Effects of NAFTA
105
Table A-2: Stocks and flows of US FDI, 1985–97 (billions of US$ or % of total)
Stock (book value) Flows
YEARAllNations
InMexico
% ofTotal
InCanada
% oftotal
Allnations
InMexico
% ofTotal
InCanada
% ofTotal
1985 229.7 5.1 2.2 47.1 20.5 16.8 0.5 3.0 0.3 1.81986 259.5 4.8 1.8 50.0 19.3 29.8 -0.3 -1.0 2.9 9.71987 308.7 5.0 1.6 56.9 18.4 49.2 0.2 0.4 6.9 14.01988 333.7 5.7 1.7 62.0 18.6 25.0 0.7 2.8 5.1 20.41989 370.0 7.3 2.0 66.8 18.1 36.3 1.6 4.4 4.8 13.21990 424.0 9.4 2.2 67.0 15.8 54.0 2.1 3.9 0.2 0.41991 460.9 12.2 2.6 68.8 14.9 36.9 2.8 7.6 1.8 4.91992 502.9 13.3 2.6 68.4 13.6 42.0 1.1 2.6 -0.4 -1.01993 560.9 15.2 2.7 69.0 12.3 57.6 1.9 3.3 1.2 2.11994 612.9 16.4 2.7 72.9 11.9 52.4 1.2 2.3 3.2 6.11995 699.0 15.6 2.2 83.2 11.9 86.1 -0.8 -0.9 10.4 12.11996 777.2 19.9 2.6 91.3 11.7 78.2 4.3 5.5 8.1 10.41997 860.7 25.4 3.0 99.8 11.6 83.5 5.5 6.6 8.5 10.2
Annual average, pre-NAFTA
1985–90 6.2 1.9 58.3 18.4 35.2 0.8 2.2 3.4 9.9
Annual average, post-NAFTA
1991-94 14.3 2.7 69.8 13.2 47.2 1.8 3.9 1.5 3.0
1995-97 20.3 2.6 91.4 11.7 82.6 3.0 3.7 9.0 10.9Source: US Department of Commerce, Survey of Current Business, 1986–88
The Canadian economy is closely integrated in many ways with that of the US. Thus, Canada’srelative decline as a recipient of US FDI should not be interpreted as a reversal of this integrationor a loss of interest on the part of US investors. The rapid expansion of US FDI in other regionsof the world responds to dynamic changes in economies that were previously not so attractive orso open to US investors. Thus, Asia and Eastern Europe attracted large inflows from the UnitedStates, as investors sought to position themselves in economies that had great potential formodernization and market growth. Similarly, the process of European integration attracted a newwave of FDI, most of it originating in the United States.
Thus, while Canada’s relative share of US FDI has fallen, its continued increase—especiallyafter 1994—indicates growing integration of the two economies. By the same token, Mexico’ssmall increase in total US FDI, from 2.2 percent of the total in 1985 to 2.7 percent in 1994,masks its increasing importance to US investors.
Accelerated flows of FDI after NAFTA
NAFTA went into effect in 1994. This coincided with a large increase of FDI from the UnitedStates to both Canada and Mexico. Similarly, Canadian FDI experienced considerable growth—both in the United States and Mexico. On the other hand, Mexican FDI in the United Statespeaked in 1994 and continued to be negligible in Canada. (The contraction of Mexican FDI inthe United States is explained by the negative outcome of some large investments made prior toNAFTA by Mexican firms in that market. The losses, and eventually the disposal of US assets byMexican investors, explain the contraction, as will be discussed further, below.)

Analytic Framework for Assessing the Environmental Effects of NAFTA
106
The large increase in the stock of US investment in Mexico and in Canada coincided with a largeincrease in world investment into the United States and of US investment in the rest of the world.The stock of US FDI in Canada increased by a large US$26 billion between 1994 and 1997. Thismeans that Canada received 10.5 percent of the increased flow in total US FDI—a global FDIstock totaling US$248 billion. The increase of US FDI in Mexico was similarly very high atUS$9 billion, or 3.6 percent of the US global total. Taken together, the two NAFTA partners thusaccounted for 14.1 percent of the increase in the US global stock of outward FDI from 1994–97.
Thus, although FDI in North America during the NAFTA phase has been impressive and—in thecase of Mexico—large relative to its share in the period prior to NAFTA, it was part of a globaltrend. Mexico has seen the percentage of its share of the total US flows increase from 1.2 percentof total US outflows in 1994 to 3.0 percent in 1997, but the figure is still too small to carry anydefinitive meaning. Although NAFTA has been a major motivation for the expansion of FDI inthe region, it is still not certain that it exerts any extraordinary influence beyond that indicated byglobal trends. NAFTA has been, however, a vehicle of increasing economic integration in NorthAmerica and this has enabled Mexico and Canada to maintain a position in the global flows ofFDI.
Leading sectors in global FDI
In the expansion of US FDI between 1985 and 1997, the leading investments were in thefinancial sector. This sector experienced the largest relative increase, from 7.4 percent of thestock of US FDI to 32.3 percent in 1997. This increase also explains why the manufacturingindustry’s share of the US FDI stock has declined from 40.6 percent to 33.2 percent over thesame period. However, manufacturing continues to be the largest individual recipient of USflows, as indicated in Table A-3.
By contrast, in global FDI directed to the United States, the share of manufacturing, whichcontinues to be the largest, grew from 31.5 percent of the total to 39.2 percent during the sameperiod. In the case of foreign investment in the United States, investment in finance hasexpanded less than it has expanded for outflows of US investment in the same sector. Thishighlights not only the strength of US financial industries relative to that of foreign financialindustries, but also the liberalization of financial sectors in many countries in which foreigninvestors could not participate before the 1990s. This is shown in Table A-4.

Analytic Framework for Assessing the Environmental Effects of NAFTA
107
Table A-3: Stocks* of US FDI in the world by sector, 1984–97 (billions of US$)
Pre-NAFTA NAFTA period
1984 1985 1986 1987 1988 1989 1990 1991 1992 1993 1994 1995 1996 1997
All industries 211.5 230.2 259.8 308.0 326.9 381.8 427.0 461.0 502.1 559.7 612.1 717.6 777.2 870.7
Petroleum 58.0 57.7 58.8 61.8 59.6 48.3 52.8 55.9 58.5 63.5 65.7 70.2 74.5 85.7
Manufacturing 85.9 94.7 105.1 127.1 133.8 147.9 158.0 180.5 186.3 194.3 220.3 250.2 272.2 288.9Whole trade 21.1 22.8 26.2 31.4 34.4 38.4 43.1 47.9 52.7 57.1 67.3 67.2 69.6 69.1Banking 13.5 14.5 14.5 15.2 16.1 19.4 20.7 21.2 24.7 27.1 29.5 28.1 33.7 34.4Finance** 15.7 22.5 36.4 52 60.6 101.1 109.4 118.0 137.2 169.0 175.0 228.7 241 280.9Services 4.4 4.7 5.1 6.4 7.1 11.7 13.1 15.4 17.2 19.7 23.0 32.8 35.79 40.9Other Industries 12.8 13.4 13.9 14.1 15.2 14.8 19.9 22.2 25.5 29.0 31.2 40.2 50.38 61.5
*At book value; **Includes insurance and real estateSource: US Department of Commerce, Survey of Current Business, 1984–98

Analytic Framework for Assessing the Environmental Effects of NAFTA
108
Table A-4: Stocks* of world FDI in the US by sector, 1984–97 (billions of US$)
Pre-NAFTA NAFTA period
1984 1985 1986 1987 1988 1989 1990 1991 1992 1993 1994 1995 1996 1997All industries 164.6 184.6 220.4 328.8 314.8 368.9 394.9 419.1 427.6 464.1 504.4 560.9 594.1 681.7Petroleum 25.4 28.3 29.1 35.6 36.0 40.3 42.8 40.0 37.6 31.7 34.0 33.9 43.8 47.7Manufacturing 51.8 59.6 72.0 64.7 122.6 150.9 152.8 157.1 158.9 166.4 184.5 213.0 242.3 267.1Wholesale trade 24.4 29.0 34.0 39.8 43.7 45.4 50.9 56.9 57.5 60.6 65.8 79.1 75.1 87.6Retail trade 6.8 6.8 8.9 10.2 9.9 8.5 9.2 8.4 10.4 12.2 13.8 n/a 13.7 16.1Banking 10.3 11.4 12.4 14.4 16.9 18.4 18.4 24.9 28.4 33.5 36.7 34.1 32.2 37.1Finance 5.6 4.2 7.2 3.8 8.1 18.6 8.3 11.4 12.9 34.4 34.7 62.4 37.7 42.5Insurance 8.9 11.8 15.3 17.4 19.0 22.5 27.1 33.3 35.8 40.4 41.4 51.0 54.7 69.1Real estate 17.8 19.4 22.5 27.5 25.9 30.4 34.9 33.6 32.4 28.4 28.4 29.7 33.2 34.1Services 2.5 2.9 6.7 13.6 19.0 20.6 30.59 34.4 35.4 34.8 36.5 n/a 32.4 45.6Other industries 7.1 7.1 7.1 8.9 13.6 13.0 19.6 19.0 18.3 21.7 28.6 57.7 29.1 34.8
*At book value; n/a: not availableSource: US Department of Commerce, Survey of Current Business, 1984–98

Analytic Framework for Assessing the Environmental Effects of NAFTA
109
Similarly, FDI in services has experienced rapid growth, both into and out of the UnitedStates. The expansion of world foreign investment in US services since the late 1980sunderlines the increasing importance of this sector for US economic activity. By contrast,US investments in services in the rest of the world appear to be more closely related to theliberalization of that sector in Europe, Asia and Latin America, which took place duringthe early 1990s. This was particularly the case in telecommunications, where USinvestment has been prominent.
Large share of manufacturing in FDI in North America
The FDI trends by sector in North America are similar to those observed in global FDI.Some distinctions, however, must be highlighted. In US FDI in Canada, the manufacturingindustry has maintained a large representation, increasing from 44.8 percent to 46.0percent of the total stock of US FDI in Canada between 1984 and 1997. This was despitethe large increase in the share of finance (similar to that observed in global US FDI) from13.1 percent to 19.0 percent during the same period. Thus, FDI from the United States toCanada is largely focused on the manufacturing industry. This is to be expected from thehigh economic integration between the two countries, an integration that involves jointproduction plants located in the United States and in Canada under the same ownership.This started with the automotive industry, but has now expanded to other industries. This isshown in Table A-5.
Table A-5: Stocks* of US FDI in Canada by sector, 1984–97 (billions of US$)
Pre-NAFTA NAFTA period
1984 1985 1986 1987 1988 1989 1990 1991 1992 1993 1994 1995 1996 1997
All industries 46.4 47.2 50.0 56.9 70.7 65.7 67.0 68.9 68.5 69.7 72.9 85.4 91.3 99.8Petroleum 11.2 10.5 10.9 11.9 11.7 10.7 11.4 9.7 8.0 8.7 8.6 10.4 11.3 12.7Manufacuturing 20.8 21.9 25.4 25.8 38.9 31.6 31.8 31.8 33.3 33.6 35 42.2 42.2 45.9Wholesale trade 2.4 2.5 2.6 3.2 3.5 3.9 4.1 5.5 5.6 6.9 7.0 7.2 7.9 7.3Banking 0.5 0.5 0.6 0.6 0.8 1.0 1.0 1.1 0.9 0.8 0.8 0.9 1.0 1.0Finance** 6.1 5.8 6.4 8.9 10.9 11.7 11.4 12.9 12.9 11.1 12.2 14.3 16.8 19Services 0.7 0.8 0.9 0.9 1.3 1.3 1.9 2.5 2.3 3.2 3.5 4.0 4.1 4.7Other industries 4.7 5.2 5.2 5.6 3.6 5.5 5.4 5.4 5.5 5.4 5.8 6.4 7.9 9.2
*At book value; n/a: not availableSource: US Department of Commerce, Survey of Current Business, 1984–98
Manufacturing investment drew a very large proportion—79.5 percent—of the total stockof US FDI in Mexico in 1984. This is shown in Table A-6. This was largely becauseMexico had restricted foreign investment in many other areas, particularly in finance andsome services, where global FDI was growing rapidly. The reduction observed inmanufacturing in Table A-6 from 79.5 percent in 1984 to 59.5 percent in 1997 took placedespite a five-fold increase in the stock of FDI from $3.6 billion to $15.1 billion. In otherwords, given the large, untapped opportunities for FDI in Mexico in service industries and

Analytic Framework for Assessing the Environmental Effects of NAFTA
110
finance, it is difficult to attribute the relative reduction in the flows for manufacturing to agradual loss of interest of investors in this industry.
NAFTA appears to have been a major motivation for investment in many manufacturingfirms. This was evident from interviews with investors since 1996 (Ramirez de la O.1996a). Table A-6 shows that the stock of US FDI more than trebled between 1988 and1997, while the stock in finance went from zero to $4.1 billion in the same period.Investment participation by US investors in finance in Mexico have included insurance,stock-brokerage houses, investment banking, and other financial services, althoughinvestment in banking remains poor.

Analytic Framework for Assessing the Environmental Effects of NAFTA
111
Table A-6: Stocks† of US FDI in Mexico by sector, 1984–97 (millions of US$)
Pre-NAFTA NAFTA period
1984 1985 1986 1987 1988 1989 1990 1991 1992 1993 1994 1995 1996 1997All industries 4,568 5,070 4,750 1,997 5,694 7,280 9,398 12257 13350 15229 16,375 15,980 19,900 25,395Petroleum 75 52 42 65 60 79 80 (*) (*) (*) (*) 134 84 109Manufacturing 3,632 4,073 3,775 3,959 4,776 5,853 7,196 8,778 9,281 9,349 10,697 9,843 12,407 15,119Wholesale trade 410 522 647 277 351 480 508 704 777 872 994 783 826 862Banking 0 0 (*) (*) (*) (*) 39 (*) (*) (*) (*) 299 442 510Finance** 194 184 158 198 0 242 400 659 798 2,045 1,982 2,263 2,873 4,079Services (*) -16 129 147 101 128 149 32 325 250 261 368 685 924Other industries 261 257 (*) (*) (*) (*) 1,025 1,647 1,935 2,419 2,335 2,289 2,583 3,792Note: The sum of the parts may be less than the total in all industries because of omission of minor values†At book value; (*) Less than $0.5 million; **Includes insurance and real estateSource: US Department of Commerce, Survey of Current Business, 1984–98

Analytic Framework for Assessing the Environmental Effects of NAFTA
112
The Mexican banking sector, as is the case in Canada, has recorded very small FDI inflows. Thisis due to the restrictions imposed by the Mexican government on foreign ownership in banking.This situation was exacerbated by the banking crisis that started in the early 1990s and continuedinto the late 1990s. Though Mexico has now lifted most of the former restrictions, foreigninvestment in banking is inhibited. This is due to continued problems of insufficientcapitalization of all Mexican banks.
Canadian and Mexican FDI
Canadian data on FDI have not been available in the same degree of detail as US data for theperiod after 1994, while Mexican data show large discrepancies with US data. Thesediscrepancies are probably caused by the use of different valuation criteria. For that reason, dataof these two countries are only used here to further discuss basic trends found with US data.
Table A-7 shows the stocks of Canadian and Mexican FDI in the United States. The Canadianseries indicates that between 1990 and 1994 its stock rose by $10.5 billion. The stock ofCanadian FDI in the United States (according to the US series), however, jumped during thesame period by $13.7 billion.
Table A-7: Mexican FDI in the United States, 1985–97 (billions of US$)
Pre- NAFTA NAFTA period
1985 1986 1987 1988 1989 1990 1991 1992 1993 1994 1995 1996 1997
Annualaverage,pre-NAFTA
Annualaverage,post-NAFTA
Stock* 0.5 0.8 0.9 0.8 1.2 0.6 0.7 0.8 1.2 2.2 2.0 1.4 1.7 0.8 1.4Flows 0.2 0.3 0.3 -0.1 0.4 -0.6 0.1 0.1 0.4 1.0 -0.3 -0.6 0.3 0.1 0.1
Canadian FDI in the United States, 1985–97 (billions of US$)
Pre-NAFTA NAFTA period1985 1986 1987 1988 1989 1990 1991 1992 1993 1994 1995 1996 1997
Annualaverage,pre-NAFTA
Annualaverage,post-NAFTA
Stock* 17.1 20.3 24.0 26.6 30.4 29.5 36.8 37.8 40.1 43.2 48.2 54.8 64.0 24.7 46.4Flows 1.8 3.2 3.7 2.6 3.8 -0.9 7.3 1.0 2.3 3.1 5.0 6.6 9.2 2.4 4.9
* At book valueSource: US Department of Commerce, Survey of Current Business, 1986–98
After 1994, the stock of Canadian investment in the United States continued to rise from $43billion to $64 billion by 1997, according to US data, with the flows recovering from the lowlevels recorded during the US recession of 1992.
Mexico has been recording a large increase in the inflows of Canadian FDI. Despite the largepercentage increase; however, such investments are very small. They totaled only $1.8 billion in1997, according to Mexican sources. Originally, until the mid-1980s, Canadian investment inMexico was concentrated in mining, machinery, and electrical cables, but this investment did not

Analytic Framework for Assessing the Environmental Effects of NAFTA
113
show great momentum. Later, in the early 1990s, Canadian investment was attracted to Mexicanbanking, with three Canadian banks taking minority stakes in Mexican banks. Theimplementation of NAFTA also attracted Canadian investment in telecommunicationsequipment. These investments grew at a fast pace, but they started from a very low base. Overall,therefore, Mexico has attracted only a small amount of Canadian FDI. NAFTA has encouragedCanadian direct investment in Mexico in banking, telecommunications and auto parts, but thishas not been spread uniformly across all sectors.
Mexican outflows of FDI have always been very small and almost exclusively concentrated inthe United States. This is largely a consequence of the sectors in which Mexican firms have acomparative advantage. Such sectors are related to large-scale industrial materials such aschemicals, cement, glass and textiles. To a lesser degree, some investments relate to processedfoods and beverages.
During the early NAFTA period (1991–94), when Mexico benefited from a strong peso andartificially cheap credit, the outflows of FDI from Mexico to the United States increased. Thiscoincided with a time of weakness in some US industrial sectors. Large Mexican firms who hadliquid resources ventured for the first time into such sectors of US industry, in anticipation of agrowing integration of the two economies. The increase in Mexican FDI in the United Statesreached a peak of $2.2 billion in 1994. By that time this stock also included some small banks inCalifornia and Texas bought by Mexican investors, a large firm of preserved fruits andvegetables, a newspaper and a US cable TV company.
The peso crisis of 1994, followed by a long period of scarce liquidity, high interest rates anddeteriorating bank portfolios in Mexico resulted in sales of Mexican assets in the United States.The stock of Mexican FDI thus declined after 1994, although it is still well above the levelrecorded during years prior to NAFTA.
Employment and Exports of US FDI
Data on employment and trade generated by firms with foreign direct investment are availableonly for US outflows, not for Mexican or Canadian FDI abroad. An analysis in 1996 (see TableA-8) showed that in 1993, Mexico accounted for 3.2 percent of all assets of US direct investorsabroad, but 11.7 percent of total US exports to affiliates of US investors abroad and 10.0 percentof their employees (Ramirez de la O. 1996a). US FDI in Mexico was thus highly export- andemployment-intensive.
US FDI to Canada in 1993 was responsible for a slightly higher percentage of employees (13.1percent), but a much higher share of total assets (11.7 percent) and even higher share of exportsto US affiliates (36.5 percent). In the cases of both Canada and Mexico, those percentage sharesrose until 1993. This underlines the strong link between investment and trade in North America.
Table A-8 shows further that employment by US direct investors in both countries continued itsrise to 1996. In Mexico, this added 68,000 workers between 1993 and 1996, to reach 733,900workers in the latter year. This is a noticeable increase, in light of the heavy recession suffered inMexico, which caused a fall in total employment of about one million workers in 1995.

Analytic Framework for Assessing the Environmental Effects of NAFTA
114
Table A-8: US FDI in Canada and Mexico: Assets, exports and employment,1992–96
(billions of US$)
M exicoYear Total
US assets% of
US totalUS exports
to affiliates*% of
US totalEmployees % of
US total
1992 47.1 2.7 13.2 10.8 660,300 9.91993 56.6 3.2 14.3 11.7 666,100 10.01994 57.5 2.4 16.7 10.5 735,300 10.31995 59.4 2.1 17.2 9.7 746,100 10.21996 67.4 2.2 21.2 10.9 733,900 9.6
C anadaYear Total
US assets% of
US totalUS exports
to affiliates*% of
US totalEmployees % of
US total
1992 193.9 11.0 42.0 34.4 870,000 13.11993 205.8 11.7 44.6 36.5 874,900 13.11994 224.0 9.4 56.8 35.6 891,800 12.61995 251.9 8.9 D -- 925,500 12.61996 276.6 9.0 61.1 31.5 921,800 12.1
* Affiliates of US firms in the host countrySource: US Department of Commerce, Survey of Current Business, 1995–98
The figures of Table A-8 show no relapse in the employment generated by US investors. This islargely because of the increasing manufacturing activity in Mexico, much of it focused onexports, especially to the United States. Part of this activity is in maquiladoras, or processingassembly plants. Such plants have multiplied and their employment has too. However, they arenot very different from other Mexican plants dedicated to export markets.
Moreover, under the NAFTA regime, maquiladoras are allowed to sell increasing percentages ofoutput in the domestic market. Thus, convergence is taking place between maquiladoras, in thepast exclusively dedicated to exports, and other firms that now have improved access to importedmaterials.
However, the recession of 1995 in Mexico still took its toll. This is reflected in the fact thatemployment did not keep increasing and actually fell as a percentage of total employmentcreated by US firms abroad. The recovery that started in 1996 has continued so that thepercentage share of Mexico in total employment is expected to rise again. The same correction in1995 in US exports to US affiliates in Mexico is observed.
In Canada, a reduction in the shares of Canadian assets as a percentage of total US investmentsabroad is evident between 1992 and 1996. This is despite the large increase in the value of assetsof US investors and in the value of US exports to the affiliates of US investors in Canada (risingfrom $42.0 billion in 1992 to $61.1 billion in 1996—see Table A-8).

Analytic Framework for Assessing the Environmental Effects of NAFTA
115
Thus, although trade generated by US investors has been increasing in North America during the1990s, it has not increased at a faster pace than trade with the rest of the world. Similarly, thevalue of assets of US investors in Canada and Mexico, though increasing over time, has notincreased as fast as the value of total assets abroad. These patterns are explained in terms of theopening up of new opportunities for investment in other areas of the world.
The low value of assets of US investors in Mexico relative to the large number of workersemployed is explained by the labor-intensive operations of maquiladoras. These plants areintensive assembly operations that require little in the way of fixed assets and constantlyexchange products and parts with their US parent or sister companies across the border. Thus,although they are not capital-intensive operations, this does not imply low-quality production ortechnologically obsolete plants.
Indeed, maquiladoras on the northern Mexican border have become increasingly complex andtechnical in their operation. Some of these plants are in the third generation of their evolutionfrom simple assembly of products to engineering and design functions. GM, the largest employerof maquiladoras, has used Mexico as a site for complex design works through its Delphisubsidiary. Similarly, the operations of other investors have become gradually more complex.Another example of this is Sony’s state-of-the-art operation in Tijuana dedicated to the USmarket. Emerson Electric has increased its employment from 10,000 to nearly 18,000 employeesin various plants located all over Mexico that assemble complex electronic control andmeasurement products. GE is undertaking a rapid transformation of its product mix in Mexicanmaquiladoras, switching from relatively simple products to more complex electronics andplanning that will include software development.

Analytic Framework for Assessing the Environmental Effects of NAFTA
116
Sectoral Destination of FDI in Mexico
The Mexican Ministry of Trade and Industry has identified the sectors to which FDI from theUnited States and Canada has been directed. Table A-9 shows that prior to NAFTA, between1989 and 1990, FDI from the United States was $4.1 billion or about $2 billion per year. Of this,26.8 percent ($1.1 billion) was directed to the manufacturing industry, mainly metallic goods andmachinery. The auto industry is the largest in this sector and accounted for most of the inflows.
Table A-9: Main destination of US FDI in Mexico bysector, 1989–98 (accumulated inflows , billions of US$)
1989–90 1991–94 1995–98Total 4.1 11.5 19.8Manufacturing 1.1 4.0 12.4
Processed food,beverages, tobacco
0.2 1.5 2.3
Textiles 0.0 0.4 n/aChemicals 0.3 0.6 0.7Metallic goods,machinery
0.4 1.1 1.9
Trade 0.4 1.6 2.6Finance 0.6 0.2 1.4Real estate 1.2 0.5 0.1Restaurants, hotels 0.4 1.2 0.3Professional services 0.2 1.7 0.2n/a: not available
Source: Mexican Ministry of Commerce and Industry
Investment in real estate was greater than that in manufacturing. The amount invested inmanufacturing metallic goods and machinery (including autos) was matched by the amount ofinvestment in trade and was exceeded by that in finance.
Between 1991 and 1994, during the early phase of the NAFTA period, the share of investment inmanufacturing rose to 34.7 percent ($4 billion) of the total. The largest share was in processedfoods followed by metallic goods and machinery. Investment rose in the professional servicessector, as accounting, advertising, and public relations firms expanded in Mexico.
The large investment in food and beverages was directed mainly to beer, mineral bottled water,preserved foods and vegetables, alcoholic beverages, snacks and fast food stores. In most ofthese cases, the foreign investment took the form of a joint venture with Mexican investors,contributing funds that were used to increase manufacturing and export capacity. Much of thisincrease came through new plants that incorporated the latest technology, as efficiency was amajor driving force in the strategies of investors. This was regarded as essential for the firms tocompete in North American markets.

Analytic Framework for Assessing the Environmental Effects of NAFTA
117
The investment in metallic goods and machinery was mainly for the auto industry, and itinvolved wholly-owned facilities by US investors. This investment was focused on upgradingand re-tooling the existing Mexican plants of auto firms. Such projects often entailed extensiveadaptation and modernization of plants. This was also the case of engine plants, where USinvestors capitalized new engine models and more efficient production facilities and processes.The new models replaced older ones that had served in Mexico from the 1970s, produced mainlyby state firms that had been privatized in the 1990s and their plants overhauled by the newowners. They included Dina, Cummins, and Mercedes Benz, producers of trucks and truckengines. The technology brought about by the new owners involved new models of engines, withconsiderably more efficient combustion, reduced noise and fewer emissions than those theyreplaced. The plants were re-tooled to render production runs more efficient and cleaner. All ofthem introduced new emission control equipment and made the environment a specific concernin plant operation.
A large share of the real estate investment shown in Table A-9 went to tourist resorts on the WestCoast of Mexico, Baja California, and the Yucatán peninsula. These involved construction ofresorts and development of infrastructure to provide water, electricity and sewage to areas thathad been largely underdeveloped until then. Another portion of this investment went to the SantaFe office and commercial development west of Mexico City.
The Santa Fe area had been for decades a site of garbage collection that caused substantial airpollution and contamination as the garbage was under intense sunlight and completely exposedto winds. The Mexico City Government started the cleaning and rehabilitation of this entire areain the late 1980s. The area is now a modern and clean site of office buildings and retail shops,with abundant use of space and green areas. Foreign investors from the United States, Canadaand the United Kingdom took a major stake in this development.
In the second stage of NAFTA (post-1994), investment in manufacturing has seen its shareincrease to 63 percent of the US total. There is an even larger inflow accumulated for the period1994–98, with $2.3 billion in foods and beverages and a higher amount in metallic goods andmachinery. This stage has featured large US inflows in joint ventures with Mexican firms in thefood and beverage industries, as well as large inflows into the auto industry. The latter includenew investments from the three large American car producers, and from tire and enginemanufacturers as well. Such investments by US investors have been accompanied at this stage byinvestments from Japan (Honda and Nissan) and Europe (BMW, Mercedes, VW).
Portfolio Investment Flows in Mexico
In 1996, the large inflows of portfolio foreign investment into Mexico were taken to indicate thegreat potential for industrial modernization. This is because, unlike Canada or the United States,Mexico has lacked a well-developed banking system, while it has suffered from very highinterest rates. Historically, large Mexican firms have often financed their expansion plans withforeign bond or equity issues.
Thus, the trend of portfolio investment, especially into the equity market, and its destinationprovided additional information on the momentum for modernization in Mexican industry.

Analytic Framework for Assessing the Environmental Effects of NAFTA
118
During the first NAFTA phase (1991–94), large outflows of these investments were observed,but with the advent of the peso crisis, a contraction took place in 1995. This included negativeflows of portfolio investment in securities (bonds, commercial paper and government securitiesin pesos) and a weak inflow to equities.
The latter inflow tended to recover between 1996 and 1997, but it again became negative in1998, as foreign investors withdrew from emerging markets. Table A-10 shows that portfolioinvestment was very high in 1992–93.
Table A-10: Foreign direct and portfolio investment in Mexico from the world, 1989–98(millions of US$)
1989 1990 1991 1992 1993 1994 1995 1996 1997 1998 1991–94 1995–98Total 3,669 4,828 12,302 22,434 33,308 16,166 -188 22,604 17,867 11,530 84,210 51,813
Direct 3,176 2,633 4,762 4,393 4,389 7,980 9,526 9,186 12,830 10,238 21,524 41,780Portfolio 493 1,995 7,940 18,041 28,919 8,185 -9,715 13,418 5,037 1,293 63,085 10,033
Stock market 493 1,995 6,332 4,783 10,717 4,088 519 2,801 3,215 -666 25,920 5,869Peso securities 1,606 8,147 7,406 -2,225 -13,860 908 585 214 14,934 -12,153
Public sector 8,147 7,013 -1,942 -13,791 948 490 290 13,218 -12,063Private sector 0 393 -283 -69 -41 95 -76 110 -92
Dollar securities* 5,111 10,797 6,324 3,625 9,700 1,237 1,744 22,232 16,306Public sector 1,552 4,872 3,980 2,994 8,909 -1,659 198 10,404 10,442Private sector 3,559 5,925 2,344 632 801 2,896 1,546 11,828 5,875
* Includes securities denominated in other international currenciesSource: Bank of Mexico, Indicadores Económicos, February 1995, January 1996 and January 1999
Investments in equities through the stock market were motivated by the prospects of NAFTAimproving the outlook for large, listed Mexican firms. The investments in peso securities weremotivated by the high interest rates that Mexico paid to portfolio investors, combined with theirperception of a strong peso.
The table shows that portfolio investment had started to weaken before the peso collapse, even inearly 1994, although this was in contrast with the continued increase in direct investment. Whilethe latter reached the record figure of $7.98 billion in 1994 (up from $4.389 billion in thepreceding year), portfolio foreign investment was down to $8.185 billion (from $28.919 billionin the preceding year). Moreover, this amount included an outflow in peso securities and wasonly offset by a large increase in dollar securities issued by public and private sectors in theinternational capital market (although in both cases, the amount issued was also smaller relativeto that of 1993).
In other words, in 1994, even before the economic crisis materialized, the trend in portfolioinvestment had started to diverge from that evident in direct investment. The reason is thatforeign direct investment is made with a long-run horizon and usually the investor has controlover the management of the firm. By contrast, portfolio investment reflects decisions to buy andsell positions of portfolio managers in firms regarded as opportunities or as risks.
In 1995, foreign direct investment continued to rise and actually accelerated. The pesodevaluation did not deter FDI—if anything it actually contributed to its increase. For one thing,

Analytic Framework for Assessing the Environmental Effects of NAFTA
119
Mexican assets bore more attractive prices. For another, the peso devaluation restoredcompetitiveness to Mexican exports and automatically made FDI in manufacturing moreattractive, especially if this was focused on foreign markets. NAFTA was a catalyst for thisinvestment.
By contrast, portfolio foreign investment was negative, as Mexico had to redeem governmentsecurities sold by the foreign investors. In the equity market, which could have represented anopportunity to investors, the flows were very small, owing to the deep recession that Mexico wassuffering and the high interest rates.
As Mexico was forced to rely much more on manufacturing, for exports became the only engineof growth during 1995 and most of 1996, domestic consumption, reduced wages and highunemployment discouraged investment in the equity market. This was because most of thecompanies listed on the Mexican Stock Exchange were closely related to sectors that had beenthe engine of growth prior to 1995. These included domestic consumption, financial services,real estate, banking, and production of other nontradable goods and services. By contrast, thelargest exporters, being subsidiaries of multinational firms, are not listed on the Mexican StockExchange.
Being a sector of high growth, exports of manufactured goods during 1995–97 attractedincreased FDI. The growth in manufactured exports paralleled FDI increases in themanufacturing industry and were related to the increasing economic integration of Mexico withthe United States. NAFTA played a pivotal role in reaffirming the trends of this integration.Canadian FDI was also significant in some sectors, such as telecommunications equipment andauto parts, but to a much smaller degree than US FDI.
As FDI in manufacturing increased and Mexico cemented its position in manufacturing linked toUS industry, FDI expanded to other areas. Some of these are directly related to manufacturingand exports, but others are only indirectly so—finance, infrastructure, electricity generation, andgas distribution.
Thus, during the period in which FDI has been consolidating, portfolio FDI has performedweakly, as indicated in Table A-10. The annual average of portfolio investment of $15.8 billionduring 1991–94 fell to only $5.9 billion in 1995–98, or $6.6 billion excluding 1995, when theflows were negative. Even this smaller figure contains inflows relating to securities issued by theGovernment in the international bond market in 1995–96. The proceeds of these issues werelargely used to repay international loans obtained in 1995 during the peso crisis (mainly from theUS Treasury and the Canadian Central Bank), most of which were repaid in 1997. Therepayment explains the negative flow that year.
Thus, amounts of portfolio investment in the stock market have been small even after the 1995recession, despite the fact that the Mexican recovery was one of the most solid recoveries ofemerging markets. During the period from 1995 to 1998, foreign equity in the stock marketrepresented average annual flows of only $1.5 billion, compared to the flows of $6.5 billionbetween 1991 and 1994.

Analytic Framework for Assessing the Environmental Effects of NAFTA
120
The peso devaluation and adjustment of the economy post-1995 hurt activities focused on thedomestic market, especially consumption, while it favored manufacturing firms, in particularthose who export. As few of the latter firms are listed, trends in the stock market mainly reflectedthe negative side of the adjustment.
One reason that large exporters are not listed in the Mexican stock market is that they consist ofsubsidiaries of multinational firms. These firms, however, have continued to expand in Mexico,increasing efficiency and profitability, and deepening their penetration into global markets. Suchfirms are key to growth in the NAFTA region through their increasing specialization, trade andforeign investment.
Table A-11 shows the composition of foreign investment in the Mexican stock market accordingto the sector of the issuing company. It can be seen that the value of such holdings has notrecovered to the level of $54.5 billion recorded at the end of 1993. Although in 1997 the markethad a large increase, this was followed by a fall in 1998. The fall was a general response ofinternational investors in emerging markets to the debt default by the Russian Government andpressures on Brazilian markets.
Table A-11: Holdings of foreign investors of Mexican equities by sector, 1991–98*(millions of US$)
Sector Dec. 1991 Dec. 1992 Dec. 1993 Dec. 1994 Dec. 1995 Dec. 1996 Dec. 1997 Dec. 1998
Mining 29.4 40.1 110.1 228.4 401.8 433.5 658.0 646.2Industrials 1,620.4 1,807.8 5,506.2 3,921.7 3,525.7 6,820.7 9,738.0 6,869.9Construction 1,730.3 2,241.2 7,320.8 4,788.0 2,690.7 3,909.0 5,291.5 2,695.2Retail 1,096.6 2,509.2 5,253.7 3,368.3 1,844.2 2,509.7 5,674.8 3,551.7Communications &transportation
12,854.8 18,133.6 25,929.8 16,063.7 12,027.9 11,834.2 19,073.3 15,841.1
Services 429.2 2,252.6 6,061.1 3,087.4 1,418.2 2,589.5 4,168.9 1,843.9Holding companies 749.4 1,084.2 3,638.0 3,199.4 2,112.1 2,731.1 3,994.8 2,172.3Others 19.3 599.2 684.6 -369.9 457.7 151.0 358.4 1,041.7
Total 18,531.5 28,668.0 54,484.3 34,287.1 24,478.3 30,978.7 48,967.7 32,578.6Memorandumstock market index
1,431 1,759 2,609 2,376 2,778 3,361 5,229 3,960
*Capitalization valuesSource: Bolsa Mexicana de Valores, Indicadores Bursátiles. Various issues.
By far the largest concentration of foreign investment is in the communications sector, especiallyTelmex, the largest issuer in Mexico. In 1999, we observe a recovery in both equity prices andflows to the stock market. This will eventually be reflected in a large increase in the balancefrom the value it reached at the end of 1998 ($32.6 billion). Although much of the foreigninvestment in portfolios is of a short-term nature (i.e., investors can flee by selling their positionsat any moment), they have nevertheless helped Mexican issuers to finance many of theirexpansion projects. This was clearly the case in construction, retailing, communications (mainlytelephones), and services during the first phase of NAFTA.

Analytic Framework for Assessing the Environmental Effects of NAFTA
121
Mexican firms that have financed investment through the stock market have become much moretransparent in their operations—not only to investors, but also to single-issue groups. Theseinclude unions, environmental groups, human rights and other groups promoting corporategovernance and political rights. In other words, even portfolio investment that appears not to beclosely related to the management of firms has in Mexico resulted in more information on whatproducers do. It has also led corporations to greater awareness of their responsibilities to localcommunities and the environment.

Analytic Framework for Assessing the Environmental Effects of NAFTA
122
References
Adriaanse, A. 1993. Environmental policy performance indicators: A study on the development of indicators forenvironmental policy in the Netherlands. (The Hague: Netherlands Ministry for Housing, Physical Planningand Environment).
Alcerreca-Joaquín, Carlos. 1997. Free trade and human resources in North America: Theory and practice. NorthAmerican Outlook 6 (June).
Anderson, K, B. et al. 1996. Asia-Pacific food markets and trade in 2005: A global, economy-wide perspective.Discussion Paper No. 1474. London: Centre for Economic Policy Research. September.
Antweiler, W., et al. 1998. Is free trade good for the environment? Manuscript. 17 March.
Beghin, J., et al. 1995. Trade liberalization and the environment in the Pacific basin: Coordinated approaches toMexican trade and environmental policy. American Journal of Agricultural Economics 77 (August): 778–785.
Beghin, J. and M. Potier. Effects of trade liberalization on the environment in the manufacturing sector. The WorldEconomy 20:4 (July 1997): 435–456.
Beghin, J., et al. 1997. The trade and environment nexus in Mexican agriculture: A general equilibrium analysis.Agricultural Economics 17: 115–131.
Brander, J. A. and M. S. Taylor. 1997a. International trade and open-access renewable resources: The small openeconomy case. Canadian Journal of Economics 30/3 (August): 526–552.
Brander, J. A. and M. S. Taylor. 1997b. International trade between consumer and conservationist countries.Resource and Energy Economics 19: 267–297.
Brown, D. K., et al. 1995. Expanding NAFTA: Economic effects of accession of Chile and other major SouthAmerican nations. North American Journal of Economics and Finance 6:2 (Fall): 149–70.
Brown, D. K., et al. 1996. Modeling multilateral trade liberalization in services. Asia-Pacific Economic Review 2:1(April): 21–34.
Cole, E. and P. Ensign. 1997. An examination of United States foreign direct investment into Mexico and its relationto the North American Free Trade Agreement: Towards a balanced understanding of the effects ofenvironmental regulation and the factor endowments that affect the location decision, Paper Presented atthe Annual Meeting of the Academy of International Business , Monterrey, Mexico, 8–12 October.
Commission for Environmental Cooperation (CEC). 1996a. Building a framework for assessing NAFTAenvironmental effects , Report of a workshop held in La Jolla, California on 29–30 April 1996 . CECEnvironment and Trade Series, No. 4. Montreal: Commission for Environmental Cooperation.
CEC. 1996b . Dispute avoidance: Weighing the values of trade and the environment under the NAFTA and theNAAEC, CEC Environment and Trade Series, No. 3. Montreal: Commission for EnvironmentalCooperation.
CEC. 1996c. NAFTA effects—A survey of recent attempts to model the environmental effects of trade: An overviewand selected sources . CEC Environment and Trade Series, No. 1. Montreal: Commission forEnvironmental Cooperation.
CEC. 1996d. NAFTA effects—Potential NAFTA environmental effects: Claims and Arguments, 1991–94. CECEnvironment and Trade Series, No. 2. Montreal: Commission for Environmental Cooperation.
CEC. 1997a. Continental pollutant pathways . Montreal: Commission for Environmental Cooperation.
CEC. 1997b . NAFTA’s institutions: The environmental potential and performance of the NAFTA Free TradeCommission and related bodies, CEC Environment and Trade Series, No. 5. Montreal: Commission forEnvironmental Cooperation.

Analytic Framework for Assessing the Environmental Effects of NAFTA
123
CEC. 1997c. Proceedings of an expert consultation on the NAFTA Effects general framework and agriculture issuestudy. Montreal: Commission for Environmental Cooperation. October.
CEC. 1997d. Proceedings of an expert consultation on the NAFTA Effects general framework and energy issuestudy. Montreal: Commission for Environmental Cooperation. October.
CEC. 1999. Assessing environmental effects of the North American Free Trade Agreement (NAFTA): An analyticalframework (phase II) and issue studies. Montreal: Commission for Environmental Cooperation.
Copeland, B. R. and M. S. Taylor. 1994. North-South trade and the environment. Quarterly Journal of Economics109: 755–787.
Copeland, B. R. and M. S. Taylor. 1995. Trade and transboundary pollution. American Economic Review 85/4: 716–737.
Copeland, B. R. and M. S. Taylor. 1997. The trade-induced degradation hypothesis. Resource and EnergyEconomics 19: 321–344.
Copeland, B. R. and M. S. Taylor. 1999. Trade, spatial separation, and the environment. Journal of InternationalEconomics 47: 137–148.
Corvalán, C., et al. 1997. Health and environment indicators in relation to sustainable development. In B. Moldan, S.Billharz and R. Matravers (eds.). Sustainability indicators: A report on the project on indicators ofsustainable development. (New York: Wiley)
Council on Hemispheric Affairs. 1997. NAFTA’s failure to deliver (Proceedings). Washington, DC, June 27–29.
Cruz, W., et al. (eds.). 1997. The greening of economic policy reform. Washington, DC: The World Bank.
Deardorff, A. Personal communication. 8 April 1999.
de Janvry, A. 1996. NAFTA and agriculture: An early assessment. NAFTA and agriculture: Is the experimentworking? A trinational research symposium, keynote address. San Antonio, Texas, 1–2 November 1996.
Department of Foreign Affairs and International Trade Canada (DFAIT). 1997. NAFTA: A partnership at work.Ottawa: DFAIT. June.
Dessus, S., et al. 1994. Input-based pollution estimates for environmental assessment in developing countries.OECD Development Centre Technical Paper, No. 101. Paris.
Diao, X. and T. Roe. 1998. The effect of sequencing trade and water market reform on interest groups in irrigatedagriculture: An intertemporal economy-wide analysis of the Moroccan case. Bulletin 98-5. EconomicDevelopment Center. University of Minnesota. November.
Economic Policy Institute (EPI). 1997. The failed experiment: NAFTA at three years. Washington DC: TheEconomic Policy Institute.
Eden, L., et al. 1997. Shocks and responses: Canadian auto parts suppliers adjust to free trade and lean production.Paper presented to the annual meeting of the Academy of International Business, Monterrey, Mexico, 12October.
Environment Canada. 1994. Environmental indicator selection criteria. Ottawa: State of the EnvironmentDirectorate, Environment Canada.
Farrell, A. and M. Hart. 1998. What does sustainability really mean? The search for useful indicators. Environment40/9 (November): 2–9, 26–31.
Feltenstein, A. and J. M. Ha. 1999. An analysis of the optimal provision of public infrastructure: A computationalmodel using Mexican data. Journal of Development Economics 58/1 (February): 219–230.
Ferrantino, M. and L. Linkins. 1996. Global trade liberalization and toxic releases” US International TradeCommission. Discussion Paper.
Ferrantino, M. J. 1998. Peer review of An analytic framework for assessing environmental effects of the NorthAmerican Free Trade Agreement (NAFTA): Phase II. 17 August.

Analytic Framework for Assessing the Environmental Effects of NAFTA
124
Forrest, W. and A. Morrison. 1991. A government role in better environmental management. The Science of theTotal Environment 108: 51–60.
Francois, J. F., et al. 1994. The Uruguay Round: A global general equilibrium assessment. GATT Secretariat.Geneva. September.
Francois, J. F., et al. 1995. Assessing the Uruguay Round. In The Uruguay Round and the developing countries(eds., W. Martin and L. A. Winters). Discussion Paper No. 307. Washington, DC: World Bank.
Francois, J. F. and K. A. Reinert. 1997. Trade policy modeling: A handbook. Cambridge: Cambridge UniversityPress.
Fry, E. 1997. NAFTA and the expanding role of non-central governments in North America. Paper presented at theJoint Conference of the Asociación Mexicana de Estudios Internacionales and the International StudiesAssociation , Manzanillio, Mexico, 11–13 December.
Gallopin, G. C. 1997. Indicators and their use: Information for decision making. In B. Moldan, S. Billharz and R.Matravers (eds.) Sustainability indicators: A report on the project on indicators of sustainabledevelopment. New York: J. Wiley and Sons.
García, R. and D. Wilk. 1996. NAFTA’s environmental effects: General connecting processes. NAFTA EffectsWorking Paper Series Number 6. Montreal: Commission for Environmental Cooperation. April.
Gordon, P. and H. W. Richardson. 1989. Gasoline consumption and cities: A reply. Journal of the AmericanPlanning Association 56: 342–346.
Grossman, G. M. and A. B. Kreuger. 1992. Environmental impacts of a North American Free Trade Agreement.CEPR Discussion Paper 644. London.
Hammond, A., A. Adriaanse, E. Rodenburg, D. Bryant, and R. Woodward. 1995. Environmental indicators: Asystematic approach to measuring and reporting on environmental policy performance in the context ofsustainable development. Washington, DC: World Resources Institute.
Harrison, G. W., et al. 1997. Quantifying the Uruguay Round. The Economic Journal 107 (September): 1405–1430.
Haughton, J. T., et al. (eds.) 1992. Climate change: The supplementary report to the IPCC scientific assessment.Cambridge: Cambridge University Press.
Hayo, B. 1998. Simplicity in econometric modeling: Some methodological considerations. Journal of EconomicMethodology, 5:2 (December): 247–202.
Hendry, D. F. 1997. The econometrics of macroeconomic forecasting. The Economic Journal 107 (September):1330–1357.
Hertel, T. W., ed. 1997. Global trade analysis: Modeling and applications. Cambridge: Cambridge University Press.
Hettige, H., P. et al. 1995. The industrial pollution project system. World Bank Policy Research Working Paper,M31. March.
Hinjosa-Ojeda et al. 1996. North American integration three years after NAFTA. Los Angeles: University ofCalifornia.
Hirshhorn, R. 1997. Industry Canada’s foreign investment research: Messages and policy implications. DiscussionPaper Number 5, October.
International Monetary Fund. 1999. Direction of Trade Statistics yearbook, 1998; International Monetary Fund,Direction of Trade Statistics Quarterly . June.
Johnson, P. M. and A. Beaulieu. 1996. The environment and NAFTA: Understanding and implementing the newcontinental law. Washington, DC: Island Press.
Kirton, J. 1998a. NAFTA, foreign direct investment and economic integration; A Canadian approach. in OECD,Migration, Free Trade, and Regional Integration in North America , OECD Proceedings. Paris: OECD,181–194.

Analytic Framework for Assessing the Environmental Effects of NAFTA
125
Kirton, J. 1998b. The impact of environmental regulation on the North American auto industry since NAFTA. In S.Weintraub and C. Sands (eds.), The North American Auto Industry under NAFTA, Washington, DC: CSISPress, 184–220.
Kmenta, J. 1971. Elements of econometrics . New York: Macmillan.
Kouparitsas, M. 1996. A dynamic macroeconomic analysis of NAFTA. Federal Reserve Bank of Chicago, 14–35,Chicago, IL.
Kovach, J., et al. 1992. A method to measure the environmental impact of pesticides. New York's Food and LifeScience Bulletin . National Engineering Handbook. US Department of Agriculture. Washington, DC. April.
KPMG Milieu and TVA-Tilburg. 1993. National Environmental Policy Plan 2: Evaluation of industry. The Hague.March. (see Resource Renewal Institute. URL <http://www.rri.org/gparchive/policyplan.html>.)
Levy, S. and S. van Wijnbergen. 1995. Transition problems in economic reform: Agriculture in the North AmericanFree Trade Agreement. The American Economic Review 85 (4): 738–754.
Liverman, D. et al. 1988. Global Sustainability: Toward measurement. Environmental Management 12(2): 133–143.
Lucas, R. E. B., D. Wheeler and H. Hettige. 1992. Economic development, environmental regulation and theinternational migration of toxic industrial pollution: 1960–1988. In P. Low (ed.), International trade andthe environment. World Bank Discussion Paper 159. Washington, DC, 67–86.
Masera, O. and V. Maclaren. 1996. NAFTA’s environmental effects: Dimensions and indicators of environmentalquality NAFTA Effects Working Paper Series , Working Paper Number 5. Montreal: Commission forEnvironmental Cooperation, April.
Maclaren, V. W. 1996. Developing indicators of urban sustainability. Toronto: Intergovernmental Committee onUrban and Regional Research.
Marichal, C. 1998. Regional experiences of migration and economic integration in North America. Paper presentedat an OECD Seminar on Migration, Free Trade and Regional Integration in North America, Mexico City,15–16 January 1998.
Mexico, Government of. 1997. NAFTA works for Mexico-Canada trade, 1993–96. Mexican Embassy, Trade Office,Ottawa.
Munasinghe, M. et al. 1996. The environmental impact of economy-wide policies: Some recent evidence. InMunasinghe, M. (ed.), Environmental impacts of macroeconomic and sectoral policies . Washington, D.C.:The World Bank.
Munton, D. and J. Kirton. 1996. Beyond and beneath the nation-state: Province-state interactions and NAFTA.Paper Presented at the International Studies Association Annual Meeting, San Diego, California, April.
Newman, P. and J. R. Kenworthy. 1988. Gasoline consumption and cities: A comparison of US cities with a globalsurvey. Journal of the American Planning Association 55: 24–37.
OECD (Organisation for Economic Cooperation and Development). 1994a. Environmental indicators—OECD coreset Paris: OECD.
OECD. 1994b. Methodologies for environmental and trade reviews. Paris: OECD.
OECD. 1995. Environmental performance reviews: Canada . Paris: OECD.
OECD. 1996a. Environmental performance in OECD countries: Progress in the 1990s. Paris: OECD.
OECD. 1996b. Environmental performance reviews: United States. Paris: OECD.
OECD. 1997a. Economic globalisation and the environment . Paris: OECD.
OECD. 1997b. OECD environmental data compendium—1997. Paris: OECD.
OECD. 1997c. The OECD report on regulatory reform, volume 1: Sectoral studies. Paris: OECD.
OECD. 1998. Towards sustainable development: Environmental indicators. Paris: OECD.

Analytic Framework for Assessing the Environmental Effects of NAFTA
126
OECD. 1999. Environmental performance reviews: Mexico. Paris: OECD.
Osborne, T. 1995. Unpublished data. Economic Research Service. US Department of Agriculture. May.
Perroni, C. and R. M. Wigle. 1994. International trade and environmental quality: How important are the linkages?”Canadian Journal of Economics 27:3 (August), 551–567.
Perroni, C. and R. M. Wigle. 1997. Environmental policy modeling. In T. W. Hertel, Global trade analysis:Modeling and applications. Cambridge: Cambridge University Press.
Pocock, R. L. 1981. Describing the state of the environment at the urban scale. In F. Joyce (ed.) Local governmentand environmental planning and control (Aldershot, England: Gower Publishing), 93–110.
Ramirez de la O., R. 1996a. Literature review of econometric models developed to assess environmental effects ofNAFTA. NAFTA Effects Working Paper Series, Working Paper No. 4. Montreal: Commission forEnvironmental Cooperation, April.
Ramirez de la O., R. 1996b. North American investment under NAFTA. NAFTA Effects Working Paper Number 3,Montreal: Commission for Environmental Cooperation, April.
Rees, W. E. and M. Wackernagel. 1994. Ecological footprints of appropriated carrying capacity: measuring thenatural capital requirements of the human economy. In A.M. Jansson, M. Hammer, C. Folke, and R.Costanza (eds.) Investing in natural capital: The ecological economics approach to sustainability.Washington: Island Press, 362–390.
Repetto, R. 1992. Earth in the balance sheet: Incorporating natural resources in national income accounts.Environment 34:7 (September), 12–20.
Robinson, S. 1990. Pollution, market failure and optimal policy in an economy-wide framework. Working paper559. University of California at Berkeley. Department of Agricultural and Resource Economics. October.
Robinson, S. et al. 1993. Agricultural policies and migration in a US-Mexico free trade area: A computable generalequilibrium analysis. Journal of Policy Modeling 15:5-6 (October–December), 673–701.
Rogers, P. P. et al. 1997. Measuring environmental quality in Asia. Cambridge, MA: Harvard University and theAsian Development Bank.
Roningen, V. 1986. A static world policy simulation (SWOPSIM) modeling framework. Staff report AGES 860625.Economic Research Service. US Department of Agriculture. Washington, DC.
Runge, C. F. et al. 1994. Freer trade, protected environment: Balancing trade liberalization and environmentalinterests . New York: Council on Foreign Relations Press.
Runge, C. F. 1995. Trade, pollution, and environmental protection. In The handbook of environmental economics .Daniel W. Bromley (ed.). Oxford: Blackwells.
Runge, C. F. et al. 1997. Sustainable trade expansion in Latin America and the Caribbean: Analysis andassessment . Washington, DC: World Resources Institute, August.
Stanford, J. O. 1992. CGE models of North American free trade: A critique of methods and assumptions. Testimonyto the United States International Trade Commission Public Hearing on Economy-Wide Modeling of theEconomic Implications of Free Trade. (Investigation No. 332-317), April.
Stockhammer, E. et al. 1997. The index of sustainable economic welfare (ISEW) as an alternative to GDP inmeasuring economic welfare: The results of the Austrian (Revised) ISEW calculation 1955–92. EcologicalEconomics 21:1 (April), 19–34.
Tsigus, M. D., et al. 1997. Global climate change and agriculture. In T.W. Hertel, (ed.): Global trade analysis:Modeling and applications. Cambridge: Cambridge University Press.
Tsigus, M. D., et al. 1999. Harmonization of environmental standards in the Western Hemisphere. Manuscript.Economic Research Service. US Department of Agriculture. March.
United Nations. 1993. Integrated environmental and economic accounting: Interim version. New York: UnitedNations, Department for Economic and Social Information and Policy Analysis.

Analytic Framework for Assessing the Environmental Effects of NAFTA
127
US Congress. 1997. The Secretary of Agriculture’s report to Congress on the effects of the North American FreeTrade Agreement on agriculture and the rural economy, The US Senate Committee on Agriculture,Nutrition and Forestry and the US House of Representatives Committee on Agriculture, Washington, DC,August.
US International Trade Commission (US ITC). 1997a. Cattle and beef: Impact of the NAFTA and Uruguay Roundagreements on US trade. Investigation No. 332-371. Publication 3048. Washington, DC, July.
US ITC. 1997b. The dynamic effects of trade liberalization: An empirical analysis. Publication 3069, October.
US Trade Representative (US TR). 1997a. NAFTA at 3. In L. Nora and S. Weintraub, (eds), Setting the recordstraight. Washington, DC: Center for Strategic and International Studies.
US TR. 1997b. Study on the operation and effects of the North American Free Trade Agreement. Washington, DC:United States Trade Representative, July.
Weintraub, S. 1994. Current state of US-Canada economic relations. The American Review of Canadian Studies 24(Winter), 473–488.
Weintraub, S. 1997. NAFTA at Three Years. Washington, DC: Center for Strategic and International Studies.
Weintraub, S. and J. Gilbreath. 1996. North American trade under NAFTA. NAFTA effects working paper series, 2.Montreal: Commission for Environmental Cooperation, April.
Zeile, W . 1997. US intrafirm trade in goods. Survey of Current Business, February,<http://www.bea.doc.gov/bea/ai/o297iid/maintext.htm>.