analysis righthand drive
TRANSCRIPT

8/9/2019 Analysis Righthand Drive
http://slidepdf.com/reader/full/analysis-righthand-drive 1/36
ANALYSIS OF THE ACCIDENT RISK
FOR RIGHT-HAND DRIVE VEHICLES
IN QUÉBEC

8/9/2019 Analysis Righthand Drive
http://slidepdf.com/reader/full/analysis-righthand-drive 2/36
ANALYSIS OF THE ACCIDENT RISK
FOR RIGHT-HAND DRIVE VEHICLES
IN QUÉBEC
François Tardif, B. Sc., actuarial scienceDirection des études et des stratégies en sécurité routière
Mark Baril, Eng.Service de l’ingénierie des véhicules
Vice-présidence à la sécurité routière Société de l’assurance automobile du Québec
November 2009

8/9/2019 Analysis Righthand Drive
http://slidepdf.com/reader/full/analysis-righthand-drive 3/36
ii
© Société de l’assurance automobile du Québec, 2009
Reproduction or communication of this document, inwhole or in part, in any form and by any process, is
permitted provided it is done for strictly non-
commercial purposes and the source is acknowledged.
In using this document, the content may not be
modified by addition, suppression or any other means
without infringing the copyright of the Société de
l’assurance automobile du Québec.
ISBN: 978-2-550-57646-4 (print version)
ISBN: 978-2-550-57645-7 (PDF version)
Legal deposit Bibliothèque et Archives nationales du Québec, 2009

8/9/2019 Analysis Righthand Drive
http://slidepdf.com/reader/full/analysis-righthand-drive 4/36
iii
Highlights
• The aim of this study was to assess the accident risk for right-hand drive vehicles and
compare it with the accident risk for comparable left-hand drive vehicles, in Québec.
• Right-hand drive vehicles were identified on the basis of the vehicle identification
number (VIN) and the model year of vehicles destined for the Japanese domestic
market. An analysis with respect to these vehicles quickly revealed that the vast
majority of them were sports cars. The right-hand drive vehicles retained for the study
were grouped into the category “Sports – Right-Hand Drive”.
• The choice of comparable left-hand drive vehicles was strongly influenced by a list of
models suggested by the Association des propriétaires de véhicules importés du Québec
(APVIQ). The left-hand drive vehicles retained for the study were grouped into the
category “Comparable – Left-Hand Drive”.
• For men aged 16 to 34, the “Sports – Right-Hand Drive” category presented, with
respect to the “Comparable – Left-Hand Drive” category, increased risks of 22% and 41%
for the years 2007 and 2008, respectively. Thus, the average increased risk for those two
years was 32%.
• In addition, for 2007 and 2008, the increased risk for the “Sports – Right-Hand Drive”
category compared with the “Comparable – Left-Hand Drive” category was present for
the three age groups analysed, namely, 16-19, 20-24 and 25-34.
• A number of confounding effects, including sex and age, were taken into account in
order to compare the accident risk for the two categories of vehicles as objectively as
possible. Leaving aside distinctions of sex and age, the increased risks for “Sports –
Right-Hand Drive” vehicles compared with “Comparable – Left-Hand Drive” vehicles
were 101% and 137% for the years 2007 and 2008, respectively. Thus, for those two
years, the average increased risk was 119%.
• Several complementary analyses were performed in order to strengthen the results
obtained. One of the analyses showed that, despite a major change in the composition
of the “Comparable – Left-Hand Drive” category, the increased risk for the “Sports –
Right-Hand Drive” category remained essentially the same.

8/9/2019 Analysis Righthand Drive
http://slidepdf.com/reader/full/analysis-righthand-drive 5/36
ivTable of Contents
Page
Highlights ......................................................................................................... iii
List of appendices ......................................................................................................... vi
1. Introduction ......................................................................................................... 1
2. Period covered by the study .................................................................................. 1
3. Accidents ......................................................................................................... 1
4. Right-hand drive vehicles ...................................................................................... 2
4.1 Confounding effects .............................................................................................. 4
4.2 Vehicle type, use and storage ............................................................................... 5
4.3 Sex and age .......................................................................................................... 7
5. Comparable left-hand drive vehicles ...................................................................... 8
6. Accident rates ....................................................................................................... 10

8/9/2019 Analysis Righthand Drive
http://slidepdf.com/reader/full/analysis-righthand-drive 6/36
v
Table of Contents
(cont.)
Page
7. Complementary analyses ....................................................................................... 15
7.1 Break-down of accidents by seriousness .............................................................. 15
7.2 Distribution of vehicle owners by region of residence .......................................... 16
7.3 Change in the composition of the
“Comparable – Left-Hand Drive” category ........................................................... 16
7.4 Integration of the preliminary data for September 2009 ...................................... 17
8. Conclusions ........................................................................................................... 18
9. Comments on the conclusions ............................................................................... 19
10. References ............................................................................................................ 20

8/9/2019 Analysis Righthand Drive
http://slidepdf.com/reader/full/analysis-righthand-drive 7/36
vi
List of Appendices
Page
Appendix 1: Order number AM 2009-05 of the Minister of Transportdated 14 April 2009 .............................................................................................. 21
Appendix 2: Number of vehicles allowed to be operated on Québec roadsat June 30 of each year by make, model and model year Sports – Right-Hand Drive .................................................................................... 23
Appendix 3: Number of vehicles allowed to be operated on Québec roadsat June 30 of each year by make, model and model year Comparable – Left-Hand Drive ............................................................................. 24
Appendix 4: Number of vehicles allowed to be operated on Québec roads andnumber of accidents by age group and vehicle category– Men ........................ 25
Appendix 5: Number of vehicles allowed to be operated on Québec roads andnumber of accidents by age group and vehicle category– Women .................. 26
Appendix 6: Calculation of the impact of the regional distribution of vehicle owners ......... 27
Appendix 7: Calculation of the standardized increased risk for the“Sports – Right-Hand Drive” category compared with the“Comparable – Left-Hand Drive” category ......................................................... 28
Appendix 8: Calculation of the non-standardized increased risk for the“Sports – Right-Hand Drive” category compared with the“Comparable – Left-Hand Drive” category ......................................................... 29

8/9/2019 Analysis Righthand Drive
http://slidepdf.com/reader/full/analysis-righthand-drive 8/36
1
1. Introduction
This report arises from the mandate entrusted to us to assess the accident risk for right-hand
drive vehicles and compare it with the accident risk for comparable left-hand drive vehicles, in
Québec.
A ministerial order, dated April 29, 2009, prohibited new right-hand drive vehicles from being
operated on Québec roads for a period of 180 days. Vehicles registered before that date were
exempt from the measure, however, as were vehicles registered outside Québec and vehicles
manufactured before January 1, 1971. The ministerial order is reproduced in Appendix 1.
2. Period covered by the study
In order to assess the accident risks for right-hand drive vehicles and comparable left-hand drive
vehicles, we used the data on accidents and on vehicles allowed to be operated on Québec
roads for the years 2007 to 2009.
It is important to note that 2009 is set apart from 2007 and 2008 by the fact that, for the 180-
day period commencing on April 29, 2009, right-hand drive vehicles not registered by then wereprohibited from being used on the road network.
3. Accidents
The accident data bank contains information on the drivers and vehicles involved in each
accident reported to the Société de l’assurance automobile du Québec. The following excerpt
from the document entitled Dossier statistique – Bilan 2008 : Accidents, parc automobile, permis
de conduire provides a clear idea of the characteristics of the accidents that must be reported:

8/9/2019 Analysis Righthand Drive
http://slidepdf.com/reader/full/analysis-righthand-drive 9/36
2[TRANSLATION]
Further to sections 173 and 176 of the Highway Safety Code, the Regulation respecting
accident reports, made by Order in Council 708-99 of June 16, 1999, stipulates that,
effective July 15, 1999, a peace officer called to the scene of an accident in which a person
has sustained bodily injury must report the accident to the Société. Where an accident
has caused property damage only, a peace officer called to the scene must report the
accident to the Société in the following cases:
1. The accident gave rise to failure to stop at the scene (hit and run).
2. The accident caused only property damage in excess of $1000 and occurred in one of
the following situations:
− it involved a heavy vehicle other than a bus used for urban transport; or
− it occurred on an autoroute or a provincial, regional or feeder road under the
responsibility of the Minister of Transport; or
−it occurred on a road under municipal management on a 100-metre stretch providing
access to an autoroute or a road under the responsibility of the Minister of Transport.
In summary, the data bank on accidents contains information on accidents with bodily injury
and certain accidents with property damage only. In the latter case, the accident has to meet
very specific and restrictive criteria. An accident for which only a joint accident report has been
completed, for instance, will not be included in the data bank. Similarly, an accident for which
there is no accident report, even if a private insurance claim for vehicle repairs has been filed,
will not be included in the data bank.
4. Right-hand drive vehicles
Since the early 1980s, all new vehicles destined for the North American market, regardless of
country of origin, have had to be identified by a unique number, which we call the vehicle
identification number (VIN), consisting of 17 alphanumeric characters. Vehicles destined for the
Japanese domestic market, however, have not been required to be identified in the same way.
Research by make, model and model year showed that the vehicles from the Japanese domesticmarket that are entered in the data bank for vehicles whose operation on Québec roads is
allowed have identification numbers consisting of 9 to 13 characters.

8/9/2019 Analysis Righthand Drive
http://slidepdf.com/reader/full/analysis-righthand-drive 10/36
3
Age of Number of characters in VIN
vehicle 9 10 11 12 13 17 Other Total
-1 0 0 0 0 0 15,267 0 15,2670 0 0 0 0 0 209,874 0 209,8741 0 0 0 0 0 334,451 0 334,4512 0 0 0 0 0 356,189 0 356,1893 0 0 0 0 0 288,345 0 288,3454 0 1 0 0 0 314,774 0 314,7755 0 0 0 0 0 282,023 0 282,0236 0 0 0 0 0 328,790 0 328,7907 0 0 0 0 0 311,165 1 311,1668 0 0 1 0 0 258,570 0 258,5719 0 1 0 0 0 267,082 0 267,083
10 0 0 0 0 0 207,845 0 207,84511 0 0 0 0 0 201,580 0 201,58012 0 0 0 0 0 169,007 0 169,007
13 0 0 0 0 0 116,440 0 116,44014 0 0 0 0 0 114,037 1 114,03815 12 6 11 13 1 90,812 1 90,85616 62 74 171 94 10 72,135 1 72,54717 13 264 361 60 22 64,675 3 65,39818 6 151 331 86 7 42,171 2 42,75419 14 66 311 36 1 31,382 3 31,81320 14 26 109 5 0 23,090 2 23,24621 5 7 6 1 0 19,826 5 19,85022 1 2 4 0 0 12,758 6 12,77123 2 2 2 0 1 9,392 13 9,41224 1 2 3 0 0 6,806 23 6,83525 1 3 1 2 2 5,207 17 5,233
Total 131 605 1,311 297 44 4,153,693 78 4,156,159
Note : Vehicle age was calculated on the basis of model year [2009 - (model year)].
Table 1 shows the number of passenger vehicles1 allowed to be operated on Québec roads at
June 30, 2009, according to the age of the vehicle and the number of characters in the VIN. The
shaded area corresponds to the 2,385 passenger vehicles that are potentially from the Japanese
domestic market and have the steering wheel on the right.
Table 1
Number of passenger vehicles allowed to be operated on Québec roads at June 30, 2009by age of vehicle and number of characters in VIN
1 Vehicles whose category of use is specified as AU-SQ-SP-PROME on the registration certificate.

8/9/2019 Analysis Righthand Drive
http://slidepdf.com/reader/full/analysis-righthand-drive 11/36
4In addition, the fact that Canadian regulations allow vehicles over 15 years old (according to
their date of manufacture) to be imported without requiring that they meet Transport Canada
safety standards facilitated the identification of right-hand drive vehicles from the Japanese
domestic market because, as Table 1 shows, the vehicles in the data bank that have 9-to-13-
character VINs are 15 years old or older (with 3 exceptions).
After this first stage of identification, each VIN was verified to make sure it corresponded exactly
to a right-hand drive vehicle from the Japanese domestic market. We will see later that 39
vehicles were not included in the study because they did not correspond to right-hand drive
vehicles from the Japanese domestic market. This validation process reduced to 2,346 the
number of right-hand drive passenger vehicles from the Japanese domestic market whose
operation on Québec roads was allowed at June 30, 2009. Next, copious research enabled us to
precisely determine the make and model of each vehicle retained for the study. Because
erroneous entries are inevitable when more than 4 million vehicles are registered, a few right-
hand drive vehicles from the Japanese domestic market may have been missed in our study. On
the other hand, the careful validation of each VIN left very little room for the possibility that any
vehicles included were not right-hand drive vehicles from the Japanese domestic market.
4.1 Confounding effects
In order to be able to compare the accident risk for right-hand drive vehicles from the Japanese
domestic market with that for comparable left-hand drive vehicles, a number of confounding
effects had to be eliminated. To illustrate the phenomenon of confounding effect, let us assume
there is a Category A of vehicles that young drivers are strongly drawn to. If we compare the
accident risk for our Category A with that for a Category B of vehicles that are unattractive to
young drivers, the comparison is shaky. What we are actually doing, in large part, is comparing
the accident risk for young drivers with that for older drivers. Special care was taken to
eliminate this kind of confounding effect.

8/9/2019 Analysis Righthand Drive
http://slidepdf.com/reader/full/analysis-righthand-drive 12/36
5
4.2 Vehicle type, use and storage
When a vehicle is registered, its category of use is determined on the basis of what type of
vehicle it is, how it is used, what type of user is concerned and where the vehicle is used. For the
purposes of our analysis, we included right-hand drive automobiles from the Japanese domestic
market that were used as passenger vehicles2 and belonged to a natural person. A cursory
analysis of the vehicles corresponding to these criteria quickly made it apparent that the vast
majority of them were sports cars. Naturally, this fact strongly influenced the choice of vehicles
for the comparison group.
An additional factor that had to be taken into account was vehicle storage. An analysis of the
data on the number of vehicles allowed to be operated on Québec roads showed that more
than half of the right-hand drive vehicles from the Japanese domestic market whose operation
was allowed at June 30 no longer had the same status at December 31 of the same year, as a
result of requests for storage submitted to the Société. That made it inappropriate to use the
most recent official figures for the number of vehicles allowed to be operated on Québec roads,
which correspond to the number of vehicles allowed at December 31 of each year. The official
figures, which are presented in the statistical compendium entitled Dossier statistique – Bilan
2008 : Accidents, parc automobile, permis de conduire, would have led us to overestimate the
accident risk for right-hand drive vehicles from the Japanese domestic market, because the
number of such vehicles used on Québec roads in a given year is actually higher. To ensure that
the results reflected reality, it was more appropriate to use the number of vehicles allowed at
June 30 of each year.
2 “Kei” class vehicles were excluded from the study because they have more in common with low-
speed vehicles (LSV) from the standpoint of the protection they provide to their occupants in the
event of a collision. Furthermore, there are no comparable left-hand drive vehicles that are
registered in Québec and allowed to be operated without restriction.

8/9/2019 Analysis Righthand Drive
http://slidepdf.com/reader/full/analysis-righthand-drive 13/36
6
2,130
1358170 70
26
0
500
1,000
1,500
2,000
2,500
Sports Kei Other (sport utility vehicles,
minivans, etc.)
Type of vehicle
Passenger vehicle
Other (commercial, off-road, etc.)
Graph 1 shows the number of right-hand vehicles from the Japanese domestic market allowed
to be operated on Québec roads at June 30, 2009, according to vehicle type and use. The data
for 2009 are presented because they provide the most recent picture.
Graph 1
Number of right-hand drive vehicles from the Japanese domestic marketallowed to be operated on Québec roads at June 30, 2009
by vehicle type and use
A total of 2,512 right-hand drive vehicles from the Japanese domestic market were allowed to
be operated on Québec roads at June 30, 2009. Of their number, 2,346 (2,130 + 135 + 81), or
93%, were used as passenger vehicles. These included 135 “Kei” class vehicles and 81 vehiclesthat are not strictly automobiles, such as sport utility vehicles and minivans. As a result, for
2009, 2,130 vehicles were retained for the purposes of our study. For convenience, we have
named this category “Sports – Right-Hand Drive”. Appendix 2 shows the number of vehicles in
this category allowed to be operated on Québec roads at June 30 of each year, according to
vehicle make, model and model year.

8/9/2019 Analysis Righthand Drive
http://slidepdf.com/reader/full/analysis-righthand-drive 14/36
7
225
965
645
87 79
19 4 0932 24 11 21 7 2 0
0
200
400
600
800
1,000
1,200
16-19 20-24 25-34 35-44 45-54 55-64 65-74 75 or over
Age group
Male Female
4.3 Sex and age
In view of our goal to compare the accident risk for vehicles in the “Sports – Right-Hand Drive”
category with that for comparable left-hand drive vehicles as objectively as possible, it was
essential to eliminate the effect that sex and age have on accident risk. Graph 2 shows the
distribution of the 2,130 “Sports – Right-Hand Drive” vehicles allowed to be operated on Québec
roads at June 30, 2009 by vehicle owner’s sex and age.
Graph 2
Distribution of the 2,130 “Sports – Right-Hand Drive” vehiclesallowed to be operated on Québec roads at June 30, 2009
by vehicle owner’s sex and age

8/9/2019 Analysis Righthand Drive
http://slidepdf.com/reader/full/analysis-righthand-drive 15/36
8Graph 2 shows that 95% (2,024/2,130) of the vehicles in the “Sports – Right-Hand Drive”
category belong to men. Of those 2,024 vehicles, 91% (1,835/2,024) belong to men aged 16 to
34.
The volume of data for women and that for men aged 35 and over was insufficient for
consideration in our analysis. However, the situation was very different for men under 35. Here,
the volume of data allowed for segmentation into three age groups: 16-19, 20-24 and 25-34. We
were thus able to compare the accident risk for “Sports – Right-Hand Drive” vehicles with that
for comparable left-hand drive vehicles for each age group separately. This brought a non-
negligible advantage, because it was possible to determine not only whether there was an
overall difference in accident risk for “Sports – Right-Hand Drive” vehicles among men under 35,
but also whether the difference was present for each separate age group.
5. Comparable left-hand drive vehicles
As with right-hand drive vehicles, great care was taken in identifying comparable left-hand drive
vehicles. A first list of makes and models was drawn up, representing close to 100,000 vehicles
at June 30 of each year.
Considering the importance of the choice of comparable left-hand drive vehicles, we asked the
Association des propriétaires de véhicules importés du Québec (APVIQ), which represents the
owners of the vehicles concerned by this study, to collaborate. [TRANSLATION] “The APVIQ
committee submitted a list of comparable models developed as a result of consultations with
JDM3 vehicle owners and other stakeholders”.4
The APVIQ’s list made it possible to further restrict our comparison group to less than 30,000
vehicles allowed to be operated on Québec roads at June 30 of each year. It is important to
mention that the vehicles suggested by the APVIQ were all on our initial list. Considering that
the passenger vehicle fleet counts more than 4,000,000 vehicles, we feel that the APVIQ’s
3 JDM = Japanese domestic market.
4 Formulation proposed by the APVIQ representative.

8/9/2019 Analysis Righthand Drive
http://slidepdf.com/reader/full/analysis-righthand-drive 16/36
9
suggestions, which enabled us to use a group representing less than 0.75% of the motor vehicle
fleet (30,000/4,000,000), will limit possible criticism of the vehicles selected as a basis of
comparison.
Appendix 3 shows the number of “Comparable – Left-Hand Drive” vehicles allowed to be
operated on Québec roads at June 30 of each year, broken down by make, model and model
year.

8/9/2019 Analysis Righthand Drive
http://slidepdf.com/reader/full/analysis-righthand-drive 17/36
10
6. Accident rates
A rate is a ratio between two quantities. We compared the number of accidents with the
number of vehicles allowed to be operated on Québec roads in this way. The following formula
shows the calculation of the accident rate per 10,000 vehicles:
Accident rate per 10,000 vehicles = (accidents/vehicles) x 10,000
The only reason for using a rate per 10,000 vehicles was to simplify the interpretation of the
results. To illustrate, if 10 out of a group of 2,000 vehicles were involved in accidents, we would
say that the frequency of accidents in the group was 0.005 (10/2,000). The rate per 10,000vehicles would be 50 (0.005 x 10,000). The result is interpreted by saying that 50 out of 10,000
vehicles will be involved in accidents. Comparing the accident ratio for vehicles in the “Sports –
Right-Hand Drive” category with that for vehicles in the “Comparable – Left-Hand Drive”
category allows us to determine whether there is a difference in accident risk between the two
categories of vehicles.
As mentioned previously, we used the number of vehicles allowed to be operated on Québec
roads at June 30 of each year, rather than at December 31, in order to take into account the fact
that right-hand drive vehicles are often placed in storage. For the same reason, we restricted
our analysis to accidents that occurred from April 1 to September 30 of each year.
We also had to consider the process for transferring accident report data into the Société’s data
bank. Normal routing and entry take a certain amount of time before the data are complete and
ready to be analysed. For the purposes of this study, the data bank was used as it stood at
October 5, 2009. This explains why, for the year 2009, accidents that occurred in September
could not be taken into consideration.
Appendix 4 presents the data, for men, on vehicles allowed to be operated on Québec roads and
on accidents for each of the “Sports – Right-Hand Drive” and “Comparable – Left-Hand Drive”
categories separately. The results are segmented according to the age groups 16-19, 20-24, 25-

8/9/2019 Analysis Righthand Drive
http://slidepdf.com/reader/full/analysis-righthand-drive 18/36
11
Men – aged 16 to 19 Men – aged 20 to 24 Men – aged 25 to 34
(1) (2) (2)/(1) x 10 000 (3) (4) (4)/(3) x 10 000 (5) (6) (6)/(5) x 10 000
Year Vehicle category Vehicles Accidents Rate Vehicles Accidents Rate Vehicles Accidents Rate
2007 Sports – Right-Hand Drive 86 14 1,628 317 20 631 220 7 318
Comparable – Left-Hand Drive 1,109 141 1,271 5,036 268 532 8,433 219 260
2008 Sports – Right-Hand Drive 185 25 1,351 696 47 675 433 11 254
Comparable – Left-Hand Drive 1,228 121 985 4,790 213 445 7,913 155 196
2009 Sports – Right-Hand Drive 225 18 800 965 32 332 645 12 186
Comparable – Left-Hand Drive 1,318 116 880 4,552 153 336 7,300 130 178
34, 35-44, 45-54, 55-64, 65-74 and 75 or over. Also, the results for each of the years 2007, 2008
and 2009 are given separately. The same data, for women, are presented in Appendix 5.
As mentioned previously, the lack of data for women in general and for men aged 35 and over
led us to limit our analysis to men under 35. Table 2 presents the data necessary to calculate the
accident rate per 10,000 vehicles, by vehicle category and the age groups 16-19, 20-24 and 25-
34. We were able to calculate the rate for the years 2007, 2008 and 2009.
Table 2
Calculation of the accident rate per 10,000 vehiclesby vehicle category
For 2007, the accident rate per 10,000 vehicles in the “Sports – Right-Hand Drive” category was1,628 (14/86 x 10,000) for men aged 16 to 19, while that for the “Comparable – Left-Hand
Drive” category was 1,271 (141/1,109 x 10,000). Thus, the accident rate per 10,000 vehicles in
the “Sports – Right-Hand Drive” category was 28% [(1,628/1,271 - 1) x 100]5 higher than that for
the “Comparable – Left-Hand Drive” category for men aged 16 to 19.
5 The comparison between the accident rates uses non-rounded rates. For 2007, the calculation
took the form [((14/86)/(141/1,109) - 1)) x 100] for men aged 16 to 19.

8/9/2019 Analysis Righthand Drive
http://slidepdf.com/reader/full/analysis-righthand-drive 19/36
12
1,628
1,351
800
1,271
985
880
0
200
400
600
800
1,000
1,200
1,400
1,600
1,800
2007 2008 2009
A c c i d e n t r a t e p e r 1 0 0 0 0 v e h i c l e s
« Sports – Right-Hand Drive » « Comparable – Left-Hand Drive »
Graph 3 shows the accident rate per 10,000 vehicles for men aged 16 to 19. We see that the
accident rate per 10,000 vehicles was also higher in 2008 for the “Sports – Right-Hand Drive”
category—37% higher than that for the “Comparable – Left-Hand Drive” category.
Graph 3
Accident rate per 10,000 vehiclesfor men aged 16 to 19
For 2009, the year of the moratorium on the registration of right-hand drive vehicles, the
incomplete data show that the accident rate per 10,000 vehicles was lower for the “Sports –
Right-Hand Drive” category for men aged 16 to 19.

8/9/2019 Analysis Righthand Drive
http://slidepdf.com/reader/full/analysis-righthand-drive 20/36
13
631
675
332
532
445
336
0
100
200
300
400
500
600
700
800
2007 2008 2009
A c c i d e n t r a
t e p e r 1 0 0 0 0 v e h i c l e s
« Sports –Right-Hand Drive » « Comparable – Left-Hand Drive »
Graph 4 shows the accident rate per 10,000 vehicles for men aged 20 to 24. We see that the
accident rate per 10,000 vehicles was higher for the “Sports – Right-Hand Drive” category than
for the “Comparable – Left-Hand Drive” category, by 19% and 52% in 2007 and 2008,
respectively. The incomplete results for 2009 do not show a significant difference between the
two categories.
Graph 4
Accident rate per 10,000 vehiclesfor men aged 20 to 24

8/9/2019 Analysis Righthand Drive
http://slidepdf.com/reader/full/analysis-righthand-drive 21/36
14
318
254
186
260
196
178
0
50
100
150
200
250
300
350
2007 2008 2009
A c c i d e n t r a t e p e r 1
0 0 0 0 v e h i c l e s
« Sports – Right-Hand Drive » « Comparable – Left-Hand Drive »
Finally, Graph 5 shows the accident rate per 10,000 vehicles for men aged 25 to 34. We see that
the accident rate per 10,000 vehicles was higher for the “Sports – Right-Hand Drive” category
than for the “Comparable – Left-Hand Drive” category, by 23% and 30% for the years 2007 and
2008, respectively. For 2009, the year of the moratorium on the registration of right-hand drive
vehicles, the incomplete data show that the accident rate per 10,000 vehicles was higher for the
“Sports – Right-Hand Drive” category.
Graph 5
Accident rate per 10,000 vehiclesfor men aged 25 to 34

8/9/2019 Analysis Righthand Drive
http://slidepdf.com/reader/full/analysis-righthand-drive 22/36
15
7. Complementary analyses
Several complementary analyses were performed to reinforce the validity of the results. In
particular, tests were done on the seriousness of the accidents in the “Sports – Right-Hand
Drive” category compared with those in the “Comparable – Left-Hand Drive” category. Also, the
distribution of the owners of the vehicles in both categories was analysed by region of
residence. In addition, we assessed the impact of further restricting the number of vehicles in
the “Comparable – Left-Hand Drive” category, redoing all our calculations after changing the
composition of the category. The reason for this test is explained a little further on. A last test
was conducted to measure the impact on the results of integrating the preliminary data for
September 2009.
7.1 Break-down of accidents by seriousness
We have seen, in section 3, that the data bank on accidents contains information on the drivers
and vehicles involved in each accident reported to the Société. It thus contains information on
accidents with bodily injury and certain accidents with property damage only.
It was possible to compare the percentage of accidents with bodily injury separately for the
“Sports – Right-Hand Drive” and “Comparable – Left-Hand Drive” categories. This revealed that
28.5% of the 186 accidents involving “Sports – Right-Hand Drive” vehicles in Table 2 caused
bodily injury. The percentage for “Comparable – Left-Hand Drive” vehicles was nearly identical,
with 30.4% of 1,516 accidents resulting in bodily injury. Thus, there was no significant difference
in accident seriousness when we compared the “Sports – Right-Hand Drive” and “Comparable –
Left-Hand Drive” categories.

8/9/2019 Analysis Righthand Drive
http://slidepdf.com/reader/full/analysis-righthand-drive 23/36
16
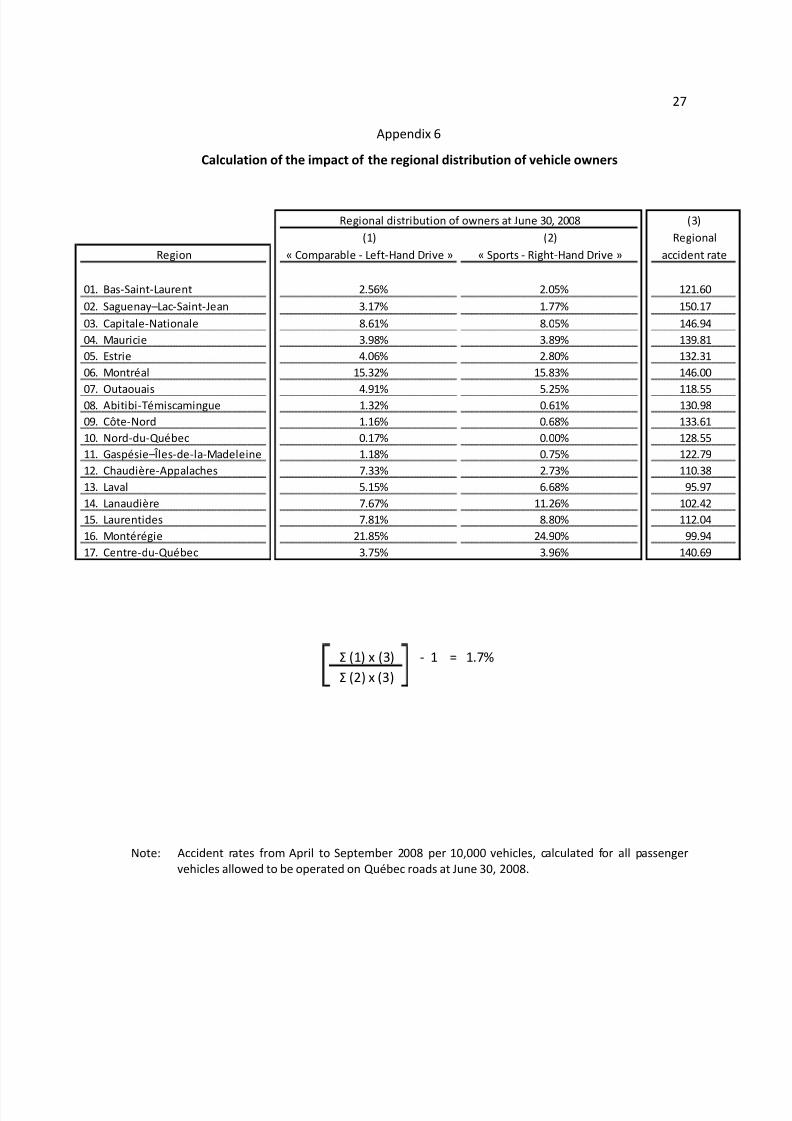
7.2 Distribution of vehicle owners by region of residence
In Section 4, we spoke of the confounding effects that were taken into account so that we could
calculate the difference in accident risk between the “Sports – Right-Hand Drive” and
“Comparable – Left-Hand Drive” categories as objectively as possible. We took into
consideration the sex and age of vehicle owners, as well as the type, use and storage of vehicles.
Since different Québec regions have different accident rates, we felt it was important to
measure the impact that the vehicle owner’s region of residence had on the accident risk for
each vehicle category. Accordingly, we analysed the regional distribution of the owners of the
vehicles in the “Sports – Right-Hand Drive” and “Comparable – Left-Hand Drive” categories.
The aim of this test was to determine whether, for instance, most owners of vehicles in the
“Sports – Right-Hand Drive” category lived in regions where accident rates were highest. The
result of the test, presented in Appendix 6, shows this was not the case. In point of fact, in order
to eliminate the effect of the regional distribution of owners, the frequency of accidents for the
“Comparable – Left-Hand Drive” category would have to be reduced by 1.7%. The impact of
doing so would be to increase the increased risk for the “Sports – Right-Hand Drive” category by
the same percentage. We felt the adjustment was negligible and, therefore, did not take it into
account.
7.3 Change in the composition of the “Comparable – Left-Hand Drive” category
Appendix 3 shows the number of “Comparable – Left-Hand Drive” vehicles allowed to be
operated on Québec roads at June 30 of each year, broken down by make, model and model
year. We see that, from 2007 to 2009, the Honda Civic Si/SiR represented a high percentage
(45.7%) of the vehicles in this category. In such a context, it is important to do a sensitivity
analysis in order to determine whether the results for the model concerned have inordinately
influenced the overall results. Therefore, we redid all our calculations, excluding the Civic Si/SiR
from the “Comparable – Left-Hand Drive” category. The change in the composition of the
category was radical, but the increased risk for the “Sports – Right-Hand Drive” category

8/9/2019 Analysis Righthand Drive
http://slidepdf.com/reader/full/analysis-righthand-drive 24/36
17
Men Men Men
16 to 19 20 to 24 25 to 34
Without September 2009 preliminary data -9% -1% 4%
With September 2009 preliminary data 17% -5% 11%
remained essentially the same, the average for the years 2007 and 2008 being decreased by less
than 1 percent (0.7%).
This significant sensitivity analysis shows that the Honda Civic Si/SiR vehicles included in the
study had accident rates similar to those of all the other vehicles, taken as a group, in the
“Comparable – Left-Hand Drive” category.
7.4 Integration of the preliminary data for September 2009
Because normal routing and entry take a certain amount of time before the data are complete
and ready to be analysed, accidents that occurred in September 2009 were excluded from the
study.
When we include the preliminary data for September 2009 that were available on October 5,
2009, there is an increased risk for the 16-19 and 25-34 age groups. Matters are made worse
especially for men aged 16 to 19. A total of 18 accidents were reported for that group from April
to August. If we add September 2009, the total is increased to 26. Table 3 details the impact of
integrating the preliminary data for September 2009.
Table 3
Accident risk for 2009 for the “Sports – Right-Hand Drive” categorycompared with the “Comparable – Left-Hand Drive” category

8/9/2019 Analysis Righthand Drive
http://slidepdf.com/reader/full/analysis-righthand-drive 25/36
18
Men Men Men Standardized
Year 16 to 19 20 to 24 25 to 34 increased risk
2007 28% 19% 23% 22%
2008 37% 52% 30% 41%
2007-2008 average 32%
8. Conclusions
The aim of this study was to assess the accident risk for right-hand drive vehicles and compare it
with the accident risk for comparable left-hand drive vehicles, in Québec. The analysis of the
data on vehicles allowed to be operated on Québec roads and on accidents, the elimination or
control of the main confounding effects and the performance of complementary analyses
showed that vehicles in the “Sports – Right-Hand Drive” category presented an increased risk
compared with vehicles in the “Comparable – Left-Hand Drive” category.
For 2007, the increased risks were 28%, 19% and 23% for men in the 16-19, 20-24 and 25-34 age
groups, respectively. For 2008, the increased risks were 37%, 52% and 30%. Taking into account
the age distribution, the standardized increased risks were 22% and 41% for the years 2007 and
2008, respectively. Thus, for those two years, the average standardized increased risk was 32%.
Table 4 presents the results, and Appendix 7 details the calculation.
Table 4
Increased accident risk for the “Sports – Right-Hand Drive” categorycompared with the “Comparable – Left-Hand Drive" category
Leaving aside distinctions of sex and age, the increased risks for the “Sports – Right-Hand Drive”
category compared with the “Comparable – Left-Hand Drive” category were 101% and 137% for
the years 2007 and 2008, respectively. Thus, for those two years, the average increased risk was
119%. Appendix 8 details the calculation.

8/9/2019 Analysis Righthand Drive
http://slidepdf.com/reader/full/analysis-righthand-drive 26/36
19
9. Comments on the conclusions
The results for 2007 and 2008, in contrast to those for 2009, are based on complete data. In
addition, the 2007 and 2008 results are not biased by the potential influence of the moratorium
and the announcement of a study of the accident risk for right-hand drive vehicles. Thus, from a
statistical standpoint, the objective assessment of the accident risk for right-hand drive vehicles
must not include the results for 2009. Knowing in advance that a risk study was going to be
conducted may have influenced the behaviour of drivers of right-hand drive vehicles, tending to
make them drive more carefully. While that is desirable, from the standpoint of road safety,
given that the Société has the mission of reducing the number of accidents on Québec’s roads,
the fact remains that, statistically, the 2009 results do not represent the actual accident risk for
right-hand drive vehicles.
It is also important to mention that, in data analysis, the size of the population observed can
influence the stability of the results. In our analysis, we worked with rather restricted volumes of
data, for both the “Sports – Right-Hand Drive” category and the “Comparable – Left-Hand Drive”
category. Despite that, the six results obtained for 2007 and 2008 show increased risks for the
“Sports – Right-Hand Drive” category. This reality brings an additional perspective, because it
shows that an increased risk existed not only for young drivers (aged 16 to 19) but also for older
drivers (aged 25 to 34) in 2007 and 2008.

8/9/2019 Analysis Righthand Drive
http://slidepdf.com/reader/full/analysis-righthand-drive 27/36
20
10. References
Société de l’assurance automobile du Québec. Bilan 2008, Accidents, parc automobile, permis de
conduire. Québec, 2009. 213 p.
http://www.saaq.gouv.qc.ca/publications/dossiers_etudes/bilan2008_accidents.pdf
Polk. Vehicle Identification Number Analysis (VINA).
http://www.polk.com/
Sanford Evans. Gold Book (2003 and 2009 editions).
http://www.sanfordevans.com/
Guide de l’auto (1989 to 1995 editions).
CARFAX Vehicle History Reports.
http://www.carfax.com/
AutoCheck Vehicle History Reports.
http://www.autocheck.com
Cars-directory.net Website.
http://www.cars-directory.net/
SAS Institute Inc. SAS User’s Guide: Basics, Version 5.
SAS Institute Inc. Base SAS 9.1.3 Procedures Guide.
SAS Institute Inc. SAS 9.1.3 Output Delivery System: User’s Guide.

8/9/2019 Analysis Righthand Drive
http://slidepdf.com/reader/full/analysis-righthand-drive 28/36
21
Appendix 1
Order number AM 2009-05 of the Minister of Transport dated 14 April 2009
Highway Safety Code
(R.S.Q., c. C-24.2)
CONCERNING access to public highways by right-hand drive vehicles
THE MINISTER OF TRANSPORT,
CONSIDERING the first paragraph of section 633.1 of the Highway Safety Code (R.S.Q., c. C-24.2),
under which after consultation with the Société de l’assurance automobile du Québec, the
Minister of Transport may, by order, restrict or prohibit, for up to 180 days, the use on public
highways of any model or class of vehicle that endangers the safety of persons and property;
CONSIDERING the first paragraph of this section which provides that any interested party may
submit comments to the person designated in the order within 90 days after its publication in
the Gazette officielle du Québec;
CONSIDERING the first paragraph of this section which provides that at the expiry of 180 days,
the Minister may, by order, make the restriction or prohibition permanent;
CONSIDERING the first paragraph of this section, according to which a restriction or prohibition
under this paragraph comes into force on the date the order is published;
CONSIDERING the fourth paragraph of this section, which provides that the publication
requirement set out in section 8 of the Regulations Act (R.S.Q., c. R-18.1) does not apply to an
order made under this section;
CONSIDERING THAT a consultation with the Société shows that it is in favour of prohibiting for a
period of 180 days, access to public highways to right-hand vehicles because they constitute a
danger to the safety of persons or property;
CONSIDERING THAT for the reasons invoked by the Société, it is appropriate to prohibit access
to public highways to right-hand drive vehicles for a period of 180 days;
ORDERS AS FOLLOWS:
1. Access to public highways is prohibited to righthand drive vehicles, except for:
1) Vehicles registered in Québec before April 29, 2009;
2) Vehicles registered outside of Québec;

8/9/2019 Analysis Righthand Drive
http://slidepdf.com/reader/full/analysis-righthand-drive 29/36
22
3) Vehicles manufactured before January 1, 1971;
4) Trucks, snow blowers, and equipment transport vehicles within the meaning of the
Regulation respecting road vehicle registration, made by Order in Council 1420-91 of October
16, 1991;
5) Vehicles required to stop frequently along a road in performing work for a public service;
6) Special mobile equipment;
7) Road vehicles belonging to a driving school or to an establishment that holds a permit for
teaching the operation of heavy trucks issued under section 10 of An Act respecting private
education (R.S.Q., c. E-9.1).
2. Road vehicles registered before April 29, 2009, by means of a temporary registration
certificate or a removable registration plate, may not claim the exception specified in paragraph1 of section 1.
3. Any interested person may forward observations about this Order before July 28, 2009 to
Mark Baril, Société de l’assurance automobile du Québec, 333 Jean-Lesage, C-4-21, P.O. Box
19600, Québec City, Québec G1K 8J6, email [email protected]
4. This Order comes into force on April 29, 2009. It is repealed on October 26, 2009.
JULIE BOULET,
The Minister of Transport

8/9/2019 Analysis Righthand Drive
http://slidepdf.com/reader/full/analysis-righthand-drive 30/36
23
Appendix 2
Number of vehicles allowed to be operated on Québec roads at June 30 of each yearby make, model and model year
Sports – Right-Hand Drive
Make Model Model year 2007 2008 2009
Honda Civic 1988-1994 25 73 91
CRX 1987-1992 41 53 51
Delsol 1992-1993 3 20 30
Integra 1989-1994 1 4 13
Prelude 1991-1994 3 7 15
Mazda Cosmo 1990-1990 1 1 1
Familia 1989-1993 4 9 15Roadster 1989-1993 7 18 25
RX-7 1988-1994 25 93 133
Mitsubishi Eclipse 1991-1991 1 1 1
Galant 1991-1991 1 2 2
GTO 1990-1993 18 27 39
Lancer 1992-1994 0 9 46
Nissan 180SX 1989-1993 31 107 139
Bluebird 1992-1992 1 1 1
Cedric 1991-1991 0 2 2
Fairlady 1989-1993 98 184 221
Leopard 1992-1992 0 1 0Pulsar 1990-1994 34 72 97
Silvia 1988-1994 60 125 185
Skyline 1988-1994 249 456 564
Subaru Legacy 1994-1994 0 0 1
WRX 1990-1994 0 7 57
Toyota Aristo 1991-1993 8 22 34
Celica 1989-1994 16 40 66
Celsior 1990-1991 1 1 2
Corolla 1983-1992 5 11 12
Mark2 1992-1993 0 0 5
MR2 1987-1994 40 84 120
Sera 1990-1991 2 1 2
Soarer 1991-1993 18 35 55
Supra 1989-1994 13 34 105
Total 706 1,500 2,130

8/9/2019 Analysis Righthand Drive
http://slidepdf.com/reader/full/analysis-righthand-drive 31/36
24
Appendix 3
Number of vehicles allowed to be operated on Québec roads at June 30 of each yearby make, model and model year
Comparable – Left-Hand Drive
Make Model Model year 2007 2008 2009
Acura Integra GSR 1992-2001 443 411 368
Integra RS 1994-2001 3,348 3,066 2,838
Integra Type R 1997-2001 87 82 80
RSX Type S 2002-2003 733 735 724
Dodge Stealth R/T 1991-1995 315 303 298
Eagle Talon TSI 1995-1998 267 243 214
Ford Focus SVT 2002-2004 98 95 94Honda CRX Si 1988-1991 448 397 357
Civic Si/SiR 1989-2004 13,761 12,805 11,756
Del Sol 1993-1997 984 936 911
Prelude SH 1997-2001 172 171 164
Prelude SR-V 1993-1996 140 131 121
Hyundai Tiburon (6 cylinders) 2003-2004 826 780 757
Mazda RX-7 Turbo II 1986-1991 277 253 234
Protege Speed 2003-2003 465 461 438
Mitsubishi 3000 1991-1998 18 17 18
Eclipse 1990-1999 194 202 201
Nissan 240SX 1989-1998 1,106 976 838
300ZX 1990-1995 398 392 386
Sentra SE-R/Spec-V 2002-2004 2,497 2,423 2,368
Plymouth Laser Turbo 1990-1994 83 76 54
Subaru Impreza RS 1998-2000 414 404 402
Impreza WRX 2002-2003 983 983 987
Toyota Celica (see note 1) 1988-1991 18 12 12
Corolla (see note 2) 1984-1987 55 44 36
MR2 Super Charger 1988-1989 48 43 39
MR2 Turbo 1991-1995 101 93 98
Supra Turbo 1986-1991 469 442 417Volkswagen Corrado and Golf GTI 1988-2001 1,007 984 934
Total 29,755 27,960 26,144
Note 1: Models whose VIN begins with JTDDY32T, JT2ST68M or JT2ST88P.
Note 2: Models whose VIN begins with JT2AE86.

8/9/2019 Analysis Righthand Drive
http://slidepdf.com/reader/full/analysis-righthand-drive 32/36
25
age 16 to 19 age 20 to 24 age 25 to 34
Year Vehicle category Vehicles Accidents Vehicles Accidents Vehicles Accidents
2007 Sports – Right-Hand Drive 86 14 317 20 220 7
Comparable – Left-Hand Drive 1,109 141 5,036 268 8,433 219
2008 Sports – Right-Hand Drive 185 25 696 47 433 11
Comparable – Left-Hand Drive 1,228 121 4,790 213 7,913 155
2009 Sports – Right-Hand Drive 225 18 965 32 645 12
Comparable – Left-Hand Drive 1,318 116 4,552 153 7,300 130
age 35 to 44 age 45 to 54 age 55 to 64
Year Vehicle category Vehicles Accidents Vehicles Accidents Vehicles Accidents
2007 Sports – Right-Hand Drive 22 0 24 0 7 0
Comparable – Left-Hand Drive 2,882 39 2,228 24 1,240 11
2008 Sports – Right-Hand Drive 60 2 52 1 7 0
Comparable – Left-Hand Drive 2,739 32 2,087 18 1,182 7
2009 Sports – Right-Hand Drive 87 0 79 0 19 0
Comparable – Left-Hand Drive 2,505 19 1,988 15 1,145 6
age 65 to 74 age 75 or over Total - Men
Year Vehicle category Vehicles Accidents Vehicles Accidents Vehicles Accidents
2007 Sports – Right-Hand Drive 2 0 0 0 678 41Comparable – Left-Hand Drive 296 5 89 3 21,313 710
2008 Sports – Right-Hand Drive 7 0 0 0 1,440 86
Comparable – Left-Hand Drive 310 3 89 1 20,338 550
2009 Sports – Right-Hand Drive 4 0 0 0 2,024 62
Comparable – Left-Hand Drive 311 2 91 1 19,210 442
Appendix 4
Number of vehicles allowed to be operated on Québec roads and number of accidentsby age group and vehicle category
Men
Notes: - Vehicles allowed to be operated on Québec roads at June 30.
- Accidents from April to September.
- The 2009 results exclude accidents that occurred in September 2009.

8/9/2019 Analysis Righthand Drive
http://slidepdf.com/reader/full/analysis-righthand-drive 33/36
26
age 16 to 19 age 20 to 24 age 25 to 34
Year Vehicle category Vehicles Accidents Vehicles Accidents Vehicles Accidents
2007 Sports – Right-Hand Drive 2 0 5 0 6 1
Comparable – Left-Hand Drive 208 23 1,283 56 2,446 46
2008 Sports – Right-Hand Drive 1 0 18 0 13 0
Comparable – Left-Hand Drive 282 28 1,147 36 2,141 28
2009 Sports – Right-Hand Drive 9 1 32 1 24 0
Comparable – Left-Hand Drive 297 15 1,073 27 1,902 25
age 35 to 44 age 45 to 54 age 55 to 64
Year Vehicle category Vehicles Accidents Vehicles Accidents Vehicles Accidents
2007 Sports – Right-Hand Drive 4 0 9 0 1 0
Comparable – Left-Hand Drive 1,511 20 1,806 18 911 6
2008 Sports – Right-Hand Drive 10 0 14 0 3 0
Comparable – Left-Hand Drive 1,273 9 1,631 15 847 4
2009 Sports – Right-Hand Drive 11 0 21 0 7 0
Comparable – Left-Hand Drive 1,116 8 1,460 12 790 5
age 65 to 74 age 75 or over Total - Women
Year Vehicle category Vehicles Accidents Vehicles Accidents Vehicles Accidents
2007 Sports – Right-Hand Drive 1 0 0 0 28 1Comparable – Left-Hand Drive 230 2 47 0 8,442 171
2008 Sports – Right-Hand Drive 1 0 0 0 60 0
Comparable – Left-Hand Drive 248 5 53 0 7,622 125
2009 Sports – Right-Hand Drive 2 0 0 0 106 2
Comparable – Left-Hand Drive 245 2 51 0 6,934 94
Appendix 5
Number of vehicles allowed to be operated on Québec roads and number of accidentsby age group and vehicle category
Women
Notes: - Vehicles allowed to be operated on Québec roads at June 30.
- Accidents from April to September.
- The 2009 results exclude accidents that occurred in September 2009.
8/9/2019 Analysis Righthand Drive
http://slidepdf.com/reader/full/analysis-righthand-drive 34/36
27
Regional distribution of owners at June 30, 2008 (3)
(1) (2) Regional
Region « Comparable - Left-Hand Drive » « Sports - Right-Hand Drive » accident rate
01. Bas-Saint-Laurent 2.56% 2.05% 121.60
02. Saguenay–Lac-Saint-Jean 3.17% 1.77% 150.17
03. Capitale-Nationale 8.61% 8.05% 146.94
04. Mauricie 3.98% 3.89% 139.81
05. Estrie 4.06% 2.80% 132.31
06. Montréal 15.32% 15.83% 146.00
07. Outaouais 4.91% 5.25% 118.5508. Abitibi-Témiscamingue 1.32% 0.61% 130.98
09. Côte-Nord 1.16% 0.68% 133.61
10. Nord-du-Québec 0.17% 0.00% 128.55
11. Gaspésie–Îles-de-la-Madeleine 1.18% 0.75% 122.79
12. Chaudière-Appalaches 7.33% 2.73% 110.38
13. Laval 5.15% 6.68% 95.97
14. Lanaudière 7.67% 11.26% 102.42
15. Laurentides 7.81% 8.80% 112.04
16. Montérégie 21.85% 24.90% 99.94
17. Centre-du-Québec 3.75% 3.96% 140.69
Appendix 6
Calculation of the impact of the regional distribution of vehicle owners
Σ (1) x (3) - 1 = 1.7%
Σ (2) x (3)
Note: Accident rates from April to September 2008 per 10,000 vehicles, calculated for all passenger
vehicles allowed to be operated on Québec roads at June 30, 2008.

8/9/2019 Analysis Righthand Drive
http://slidepdf.com/reader/full/analysis-righthand-drive 35/36
28
Men – aged 16 to 19 Men – aged 20 to 24 Men – aged 25 to 34
(1) (2) (2)/(1) x 10 000 (3) (4) (4)/(3) x 10 000 (5) (6) (6)/(5) x 10
Year Vehicle category Vehicles Accidents Rate Vehicles Accidents Rate Vehicles Accidents Rate
2007 Sports – Right-Hand Drive 86 14 1,628 317 20 631 220 7 31
Comparable – Left-Hand Drive 1,109 141 1,271 5,036 268 532 8,433 219 26
2008 Sports – Right-Hand Drive 185 25 1,351 696 47 675 433 11 25
Comparable – Left-Hand Drive 1,228 121 985 4,790 213 445 7,913 155 19
((86+1,109)x1,628 + (317+5,036)x631 + (220+8,433)x318) / (86+1,109+317+5,036+220+8,433) - 1
((86+1,109)x1,271 + (317+5,036)x532 + (220+8,433)x260) / (86+1,109+317+5,036+220+8,433)
((185+1,228)x1,351 + (696+4,790)x675 + (433+7,913)x254) / (185+1,228+696+4,790+433+7,913) - 1
((185+1,228)x985 + (696+4,790)x445 + (433+7,913)x196) / (185+1,228+696+4,790+433+7,913)
Appendix 7
Calculation of the standardized increased risk for the “Sports – Right-Hand Drive” categorycompared with the “Comparable – Left-Hand Drive” category
Standardized increased risk for 2007
= 22%6
Standardized increased risk for 2008
= 41%7
Average standardized increased accident risk for 2007 and 2008 8
(22.08% + 41.48%)/2 = 31.78%
6 When calculated with non-rounded accident rates, the increased risk for 2007 is 22.08%.
7 When calculated with non-rounded accident rates, the increased risk for 2008 is 41.48%.
8 The average was calculated using the increased risks calculated with non-rounded accident rates.

8/9/2019 Analysis Righthand Drive
http://slidepdf.com/reader/full/analysis-righthand-drive 36/36
29
(1) (2) (2)/(1) x 10 000
Year Vehicle category Vehicles Accidents Rate
2007 Sports – Right-Hand Drive 706 42 595
Comparable – Left-Hand Drive 29,755 881 296
2008 Sports – Right-Hand Drive 1,500 86 573
Comparable – Left-Hand Drive 27,960 675 241
Appendix 8
Calculation of the non-standardized increased risk for the “Sports – Right-Hand Drive”category compared with the “Comparable – Left-Hand Drive” category
Non-standardized increased risk for 2007
(595/296) - 1
= 101%9
Non-standardized increased risk for 2008
(573/241) - 1
= 138%10
Average non-standardized increased accident risk for 2007 and 2008 11
(100.92% + 137.49%)/2 = 119.20%
9 When calculated with non-rounded accident rates, the increased risk for 2007 is 100.92%.
10 When calculated with non-rounded accident rates, the increased risk for 2008 is 137.49%.