analysis of volatile organic compounds in rats with ... · red lines represent peaks originated...
TRANSCRIPT

Senior lecturer, Department of Biotechnology, Tel-Hai academic collage, Israel
&
Oxidative Stress and Human Diseases Research Laboratory – Galilee Research
Institute (Migal), Israel.
Analysis of volatile organic compounds in rats with
dopaminergic lesion:
possible application for early detection of Parkinson’s
disease
By
Dr. Soliman Khatib
Oxidative Stress laboratory

Oxidative stress and human diseases
laboratory activities
Markers
Alzheimer, Parkinson,
diabetic complications,
atherosclerosis,
depression
Analytical chemistry
Isolation, Identification
Protein
oxidation and
modifications Blood
Human
carotid
plaque
VOCs as Biomarkers

Parkinson’s disease
• Parkinson's disease (PD): one of the most
prevalent neurodegenerative disorders • Affecting :
• 0.3% of the entire population,
• 1% of the people over 65yr,
• 4% of the people over 80yr.

Parkinson’s Disease (PD) Pathology
• Pathology is characterized with the death of dopaminergic neurons in the substantia nigra Para compacta and a reduction in dopamine (DA) levels in the striatum and the presence of “Lewy Bodies”.

Symptoms of PD
• Tremor
• Rigidity
•Bradykinesia
• Postural instability

loss of 50-70% of Dopaminrgic neurons
80% reduction in the striatal dopamine
Parkinson’s disease and dopamine

Early detection of PD
• Early detection of PD is important as it enables
slowing or stopping its progression using
neuroprotective drugs.
• Although there are several biomarkers for clinical
diagnosis, none of these is in routine clinical use.
• Thus, a need for an early, reliable, sensitive and
specific diagnostic biomarker still exits.

Aim of the study
Early detection of PD

PD
9
Volatile organic compounds (VOCs) in
blood
Early detection of PD stage and progression
Biochemical pathways specific to the disease
Hypothesis

Objectives
• 1. To identify VOCs in rates blood that can be specific to Parkinson disease.
• To investigate the mechanism of such specific VOCs generation and their association with the disease.

• VOCs can be detected by using the simple and reliable
Solid-Phase Micro Extraction (SPME) technique,
combined with Gas-Chromatography Mass Spectrometry
(GC-MS).
SPME Method
0 5 10 15 20 25 30 350
1
2
3
4
5x 10
6
5.5 6 6.5 7 7.5 8 8.5 9 9.5
0
1
2
x 105
5.5 6 6.5 7 7.5 8 8.5 9 9.5
02468
x 104
5.5 6 6.5 7 7.5 8 8.5 9 9.50
2
4
x 104
5.5 6 6.5 7 7.5 8 8.5 9 9.5
0
10
20x 10
4
5.5 6 6.5 7 7.5 8 8.5 9 9.5
0
5
10
15
x 104
Retention time, [min.]
RT=9.004
RT=8.998
RT=9.004
RT=9.010
RT=9.004

1. Fiber type: (DVB/CAR/PDMS) (gray fiber) or (PDMS)
(red fiber).
Optimization of the SPME method
2. SPME Extraction Temperature ( 40C Vs 90C)
3. Blood or Serum
Gray fiber
Red fiber
400C
900C
Blood
Serum

The requirement for the algorithm
• In each experiment – numerous GC-MS peaks
• Each chromatogram contains hundreds of peaks
• The need for an automatic and reliable algorithm for data handling, signal processing and analysis
13
0 5 10 15 20 25 30 350
0.5
1
1.5
2
2.5
3
3.5
4
4.5
5x 10
7

Development of an algorithm for data handling and
processing.
• accurately detecting and demarcating the peaks in the GC-MS chromatogram.
• calculating the area under each detected peak
• eliminating peaks originated from blanks,
• Normalization of the area under each peak using internal standards
• finding and selecting sample peaks with areas significantly higher or lower than in control.

Baseline computation and removal
24.2 24.4 24.6 24.8 25 25.2 25.4 25.6 25.8 26 26.20
1
2
3
4
5
6
7
8x 10
4
Retention time (minutes)
15
26 27 28 29 30 31 32 33 34
1
1.5
2
2.5
3
3.5
4x 10
4

• “Peak picking”
• Selecting peaks:
peak-to-noise
ratio>3dB
• Left and right
boundaries
24.2 24.4 24.6 24.8 25 25.2 25.4 25.6 25.8 26 26.20
1
2
3
4
5
6
7
8x 10
4
Retention time (minutes)
16
Peak detection and boundary demarcation
Peaks alignment and grouping
5.5 6 6.5 7 7.5 8 8.5 9 9.5
0
1
2
x 105
5.5 6 6.5 7 7.5 8 8.5 9 9.5
02468
x 104
5.5 6 6.5 7 7.5 8 8.5 9 9.50
2
4
x 104
5.5 6 6.5 7 7.5 8 8.5 9 9.5
0
10
20x 10
4
5.5 6 6.5 7 7.5 8 8.5 9 9.5
0
5
10
15
x 104
Retention time, [min.]
RT=9.004
RT=8.998
RT=9.004
RT=9.010
RT=9.004
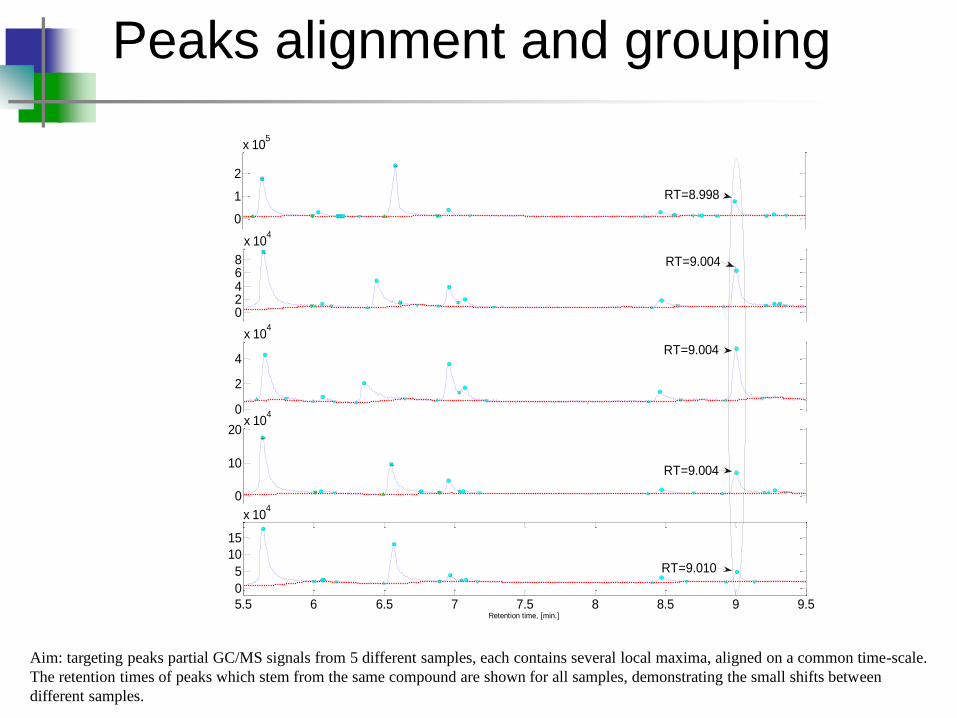
Aim: targeting peaks partial GC/MS signals from 5 different samples, each contains several local maxima, aligned on a common time-scale.
The retention times of peaks which stem from the same compound are shown for all samples, demonstrating the small shifts between
different samples.

Area computation and Internal Standard
Correction
Interpolation
Win=
5
Time
Alignment &
Clustering
k
Area
Computation
Low-pass
Filtering
win=
50
Area
Computation Outlier
Selection
Sample
peaks
Baseline
signal
1
N
2
Internal
Standard
Areas
Blank
peaks
18

Area versus retention-time of all peaks in all blood samples. Dotted
red lines represent peaks originated from blanks, and solid blue lines
represent peaks where no blanks were present.
Peaks vs. Blanks

Rat model: Stable- 50% depletion of dopaminergic neurons by
injection of 6-OHDA i.c.v into the left lateral ventricle (Aluf et al. FRR,
2010).
SHAM
125µg 6-OHDA
250 µg 6-OHDA
325 µg 6-OHDA
Con
trol g
6OHDA-1
25
g
6OHDA-2
50
g
6OHDA-3
25
0.00
0.25
0.50
0.75
1.00
1.25
**
**
**
Su
rviv
ing
cell
s
Rati
o f
ro
m c
on
tro
l
(**P<0.01, one way ANOVA, n = 7)
PD Rates model

Method
1- Rates were injected by i.c.v into the left lateral ventricle with 250 g
6-OHDA, or i.p injection of (DSP-4), 50 mg/kg or seline.
2- after 5 weeks blood was collected.
3- rats were decapitated, the brain removed and the striatum dissected ,
weighted and homogenized into PBS.
4- dopamine content in striatum determined using HPLC connected to
ECD.
5- VOCs from Blood and striatum homogenate were determined using
SPME-GC-MS method PBS was used as blank.
6- data processed and analyzed using the developed algorithm.

Dopamine levels in the striatum homogenate of rats
DA= Dopamine
HDA= 6-hydroxydopamine (HDA)
DSP-4= N-(2-chloroethyl)-N-ethyl-2-bromobenzylamine

The level of VOCs in treated versus control rats as
analyzed by SPME/GC-MS.
A: Blood
B: Brain homogenate

The MS fragmentations of peaks
spectra of 1-Octen-3-ol from blood
spectra of 1-Octen-3-ol from standard
spectra of 2-Ethylhexanol from blood
spectra of 2-Ethylhexanol from standard

VOCs detected in blood or Brain Homogenate

VOCs detected in blood or Brain Homogenate
1-Octen-3-ol is neurotoxic in the Drosophila melanogaster model
and to human embryonic stem cells. (Inamdar et al Neurotox Res 2014)
it reduces dopamine levels, causes dopamine neuron degeneration. (Inamdar et al. PNAS, 2013;)
1-Octen-3-ol has been detected in cow milk (van Aardt et al., 2005),
human sweat (Cork and Park, 1996) , and feces (Garner et al., 2007).

Summary
• Three groups of rats were studied: DA-lesioned rats injected with
6-hydroxydopamine ( n=11); control rats injected with saline
(n=9); and control rats injected with DSP-4 (n=8), a specific
noradrenergic neuron toxin.
• The SPME method was optimized for testing Blood VOCs
• An algorithm for data processing was developed
• In the blood, 1-octen-3-ol and 2-ethylhexanol were found at
significantly higher concentrations in HDA-treated versus sham
rats.

Summary
• In the striatal homogenate 1-octen-3-ol and other four compounds
were found at significantly lower concentrations in HDA rate

Future plans
• To examine the presence of volatile materials in
Parkinson human blood.
• To investigate the mechanism of the obtained
VOCs generation and their association with the
disease.

III. Novel markers for extra cellular OS
2. Extra cellular OS: Microdialysis of a non dialyzable marker
(ROS/RNS trap).
Inlet
Inlet
Outlet

Oxidative stress- extra cellular marker oxidation
•Increased oxidative stress is observed in our rat model (44% and 28% increase in the level of oxidized products of the marker), •NAC decreased the increment almost back to normal
(n=5/6 rats per treatment; ***p<0.001, **p<0.01, *p<0.05)

Thanks
• Prof. Jacob Vaya.
Dr. Soliman Khatib.
Saeed Mahmoud and our group.
• Prof. John Finberg
Dr. Yuval Aluf.
• Dr. Yizhar Lavner.