analysis of vessel dwelling emissions and offset reduction ... · analysis of vessel dwelling...
TRANSCRIPT

Analysis of Vessel Dwelling Emissions and Offset Reduction Measures
Prepared for:The Port Authority of New York and New Jersey
December 2005
Prepared by:

Analysis of Vessel Dwelling Emissions and Offset Reduction Measures
Starcrest Consulting Group, LLC December 2005
i
TABLE OF CONTENTS
EXECUTIVE SUMMARY .............................................................................................. ES-1
INTRODUCTION.............................................................................................................. 1
COLD IRONING OF VESSELS............................................................................................2
ALTERNATIVE EMISSION REDUCTION METHODS..........................................................3
Yard Tractors ...................................................................................................................................3 Locomotives.....................................................................................................................................4 Towboats ..........................................................................................................................................5 Ultra-Low Sulfur Diesel Fuel.........................................................................................................6
COMPARISON OF EMISSION REDUCTION METHOD COST EFFECTIVENESS....................6
CONCLUSION ................................................................................................................ 10
APPENDIX – CALCULATOR TOOL

Analysis of Vessel Dwelling Emissions and Offset Reduction Measures
Starcrest Consulting Group, LLC December 2005
ii
LIST OF TABLES
Table ES-1: Summary Comparison of Emission Reduction Methods...................ES-2 Table ES-2: Comparison of Annualized Costs and Reductions ............................ES-3 Table 1: Annual Hour Assumptions and Resulting Emissions, Yard Tractors ...........4 Table 2: Development of Switch Engine Profile ..........................................................5 Table 3: Towboat Engine Profiles................................................................................5 Table 4: Cost Effectiveness Comparison: Cold Ironing of Vessels vs. Alternative Measures ........................................................................................................................9 Table 5: Comparison of Annualized Costs and Reductions .......................................11 Table 6: Summary Comparison of Emission Reduction Methods .............................11

Analysis of Vessel Dwelling Emissions and Offset Reduction Measures
Starcrest Consulting Group, LLC December 2005
iii
ACRONYMS AND ABBREVIATIONS AMP alternative maritime power CFR Code of Federal Regulations CHE cargo handling equipment CMV commercial marine vessel CO carbon monoxide EI emissions inventory HP horsepower EPA Environmental Protection Agency kW kilowatt NA not applicable NNI No Net Increase NOx nitrogen oxides PM particulate matter POLA Port of Los Angeles ppm parts per million SO2 sulfur dioxide Tpy tons per year ULSD ultra-low sulfur diesel (fuel) VOC volatile organic compound

Analysis of Vessel Dwelling Emissions and Offset Reduction Measures
Starcrest Consulting Group, LLC December 2005
ES-1
EXECUTIVE SUMMARY In this report, various emissions reduction strategies were compared against the use of alternative maritime power, also known as cold ironing, which reduces emissions associated with vessel dwelling operations. Cold ironing is the practice of providing a vessel with shore-side electrical power during the time the vessel is tied up at berth, allowing the auxiliary engines to be shut down. This emission control method requires shore-side infrastructure and modifications to the specific vessels that will engage in the practice. Cold ironing may not be a practical emission reduction strategy for marine terminals leased by the Port Authority of New York and New Jersey (PANYNJ) due to the fact that it requires costly shore-side modifications, and changes to existing long-term lease agreements. More importantly, there is currently no national and/or international regulation that would prompt the spectrum of independently owned vessel holders to invest in the considerable costs of converting their vessels to accept shore-side power. Finally, there are other emission reduction methods that could be employed throughout the harbor, such as towboat retrofits, that could achieve far greater emission reductions at much less cost. The emission reduction methods compared to cold ironing in this report include:
yard tractor modernization locomotive switch engine modernization idling controls for switchers and line haul locomotives retrofits of existing towboat engines use of ultra-low sulfur diesel fuel (ULSD, 15 part per million sulfur) in yard tractors,
locomotives, and tow boat engines A tool, in the form of a calculator in Microsoft™ Excel, was developed to help compare combinations of these strategies to reduce air emissions related to terminal operations. This calculator provides a framework for developing generalized emissions reductions and associated costs; specific projects should be analyzed with respect to operational efficiencies, secondary costs, and other metrics.
Analysis of Vessel Dwelling Emissions and Offset Reduction Measures
Starcrest Consulting Group, LLC December 2005
ES-2
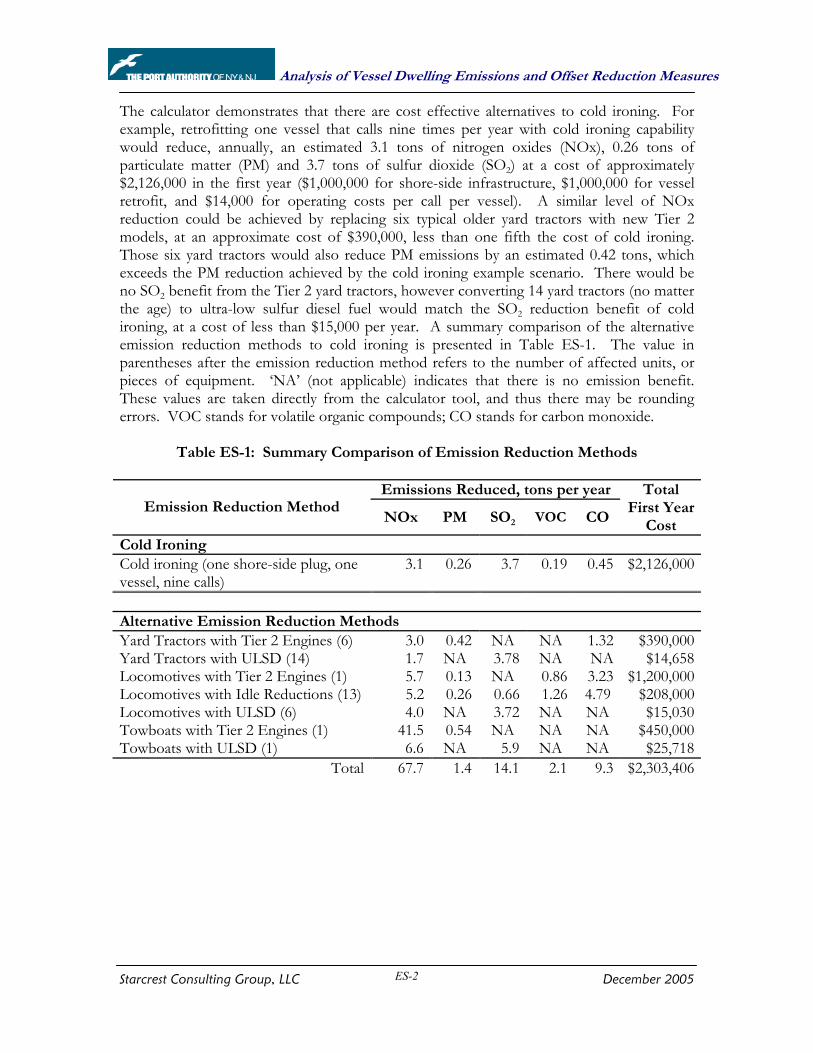
The calculator demonstrates that there are cost effective alternatives to cold ironing. For example, retrofitting one vessel that calls nine times per year with cold ironing capability would reduce, annually, an estimated 3.1 tons of nitrogen oxides (NOx), 0.26 tons of particulate matter (PM) and 3.7 tons of sulfur dioxide (SO2) at a cost of approximately $2,126,000 in the first year ($1,000,000 for shore-side infrastructure, $1,000,000 for vessel retrofit, and $14,000 for operating costs per call per vessel). A similar level of NOx reduction could be achieved by replacing six typical older yard tractors with new Tier 2 models, at an approximate cost of $390,000, less than one fifth the cost of cold ironing. Those six yard tractors would also reduce PM emissions by an estimated 0.42 tons, which exceeds the PM reduction achieved by the cold ironing example scenario. There would be no SO2 benefit from the Tier 2 yard tractors, however converting 14 yard tractors (no matter the age) to ultra-low sulfur diesel fuel would match the SO2 reduction benefit of cold ironing, at a cost of less than $15,000 per year. A summary comparison of the alternative emission reduction methods to cold ironing is presented in Table ES-1. The value in parentheses after the emission reduction method refers to the number of affected units, or pieces of equipment. ‘NA’ (not applicable) indicates that there is no emission benefit. These values are taken directly from the calculator tool, and thus there may be rounding errors. VOC stands for volatile organic compounds; CO stands for carbon monoxide.
Table ES-1: Summary Comparison of Emission Reduction Methods
Emissions Reduced, tons per year Emission Reduction Method
NOx PM SO2 VOC CO
Total First Year
Cost Cold Ironing Cold ironing (one shore-side plug, one vessel, nine calls)
3.1 0.26 3.7 0.19 0.45 $2,126,000
Alternative Emission Reduction Methods Yard Tractors with Tier 2 Engines (6) 3.0 0.42 NA NA 1.32 $390,000Yard Tractors with ULSD (14) 1.7 NA 3.78 NA NA $14,658Locomotives with Tier 2 Engines (1) 5.7 0.13 NA 0.86 3.23 $1,200,000Locomotives with Idle Reductions (13) 5.2 0.26 0.66 1.26 4.79 $208,000Locomotives with ULSD (6) 4.0 NA 3.72 NA NA $15,030Towboats with Tier 2 Engines (1) 41.5 0.54 NA NA NA $450,000Towboats with ULSD (1) 6.6 NA 5.9 NA NA $25,718
Total 67.7 1.4 14.1 2.1 9.3 $2,303,406

Analysis of Vessel Dwelling Emissions and Offset Reduction Measures
Starcrest Consulting Group, LLC December 2005
ES-3
As illustrated in this table, for approximately the same cost as cold ironing one vessel, a combination of alternative emission reduction methods can be employed to achieve:
23 times the annual NOx reductions 5 times the annual PM reductions 4 times the annual SO2 reductions 11 times the annual VOC reductions 20 times the annual CO reductions
Cost estimates were adapted from the Port of Los Angeles (POLA) No Net Increase (NNI) Task Force document. (POLA, Report to Mayor Hahn and Councilwoman Hahn by the No Net Increase Task Force, 24 June 2005). Equipment profiles are based on actual operating conditions at marine terminals leased by the PANYNJ. In Table ES-2, the annualized costs are illustrated for the NOx reductions achievable under the scenarios illustrated in Table ES-1. In comparing the annualized cost of cold ironing with the total annualized cost of the other emission reduction scenarios combined, it can be seen that a total of almost 68 tons of NOx can be reduced per year from the alternative measures at a cost of $340,000 per year, for an overall cost of $5,000 per ton of NOx. This contrasts with the cold ironing reduction of three tons per year (for one vessel participating) at an annual cost of $206,000, for a cost per ton over $66,000.
Table ES-2: Comparison of Annualized Costs and Reductions
Reductions,Emission Reduction Strategy Total Cost Number of
YearsAnnual Cost Tons NOx per
YearCost per Ton
1 Vessel Participating in Cold Ironing $5,150,000 25 $206,000 3.1 $66,452
6 Yard Tractors with Tier 2 Engines $390,000 5 $78,000 3.0 $26,00014 Yard Tractors with Clean Fuel $14,658 1 $14,658 1.7 $8,7251 Locomotive with Tier 2 Engines $1,200,000 10 $120,000 5.7 $21,053
13 Locomotives with Idle Reduction $208,000 5 $41,600 5.2 $8,0006 Locomotive with Clean Fuels $15,030 1 $15,030 4.0 $3,7391 Towboat with Tier 2 Engines $450,000 10 $45,000 41.5 $1,0841 Towboat with Clean Fuel $25,718 1 $25,718 6.6 $3,897
Total of Measures other than Cold Ironing $340,006 67.7 $5,022
Analysis of Vessel Dwelling Emissions and Offset Reduction Measures
Starcrest Consulting Group, LLC December 2005
1
INTRODUCTION In this report, various emissions reduction strategies were compared against the use of alternative maritime power (AMP), also known as cold ironing, which reduces emissions associated with vessel dwelling. Dwelling emissions are almost exclusively generated by vessels’ auxiliary engines. Cold ironing is the practice of providing a vessel with shore-side electrical power during the time the vessel is tied up at berth, allowing the auxiliary engines to shut down. This emission control method requires shore-side infrastructure and modifications to the specific vessels that will engage in the practice. Starcrest reviewed the vessel data underlying the 2000 baseline commercial marine vessel emissions inventory (CMV EI)1 and developed profiles of typical vessel calls based on the types of vessels calling at marine terminals leased by the Port Authority of New York and New Jersey (PANYNJ). These profiles include vessel types, average duration of the calls, size and number of auxiliary engines, and types of fuel burned in the auxiliary engines, and were used to develop generalized activity and cost data for cold ironing. Various emissions reduction strategies were then compared against the use of cold ironing, including:
yard tractor modernization locomotive switch engine modernization idling controls for switchers and line haul locomotives retrofits of existing towboat engines use of ultra-low sulfur diesel fuel (ULSD, 15 part per million sulfur) in yard tractors,
locomotives, and tow boat engines Pollutants considered include:
Nitrogen oxides (NOx) Particulate matter (PM) Sulfur dioxide (SO2) Volatile organic compounds (VOC) Carbon monoxide (CO)
The emission reduction and cost estimates are based on actual operating conditions at marine terminals leased by PANYNJ as detailed in the cargo handling equipment (CHE) EI prepared for the 2002 fleet (2002 CHE EI)2 and the update prepared for the 2004 fleet (2004 CHE EI).3
1 Starcrest Consulting Group, LLC (Starcrest), The New York, New Jersey, Long Island Nonattainment Area Commercial Marine Vessel Emissions Inventory, April 2003. This document was prepared in 2002-2003 and surveyed the 2000 calendar year fleet. 2 Starcrest, The Port of New York and New Jersey Emissions Inventory for Container Terminal Cargo Handling Equipment, Automarine Terminal Vehicles, and Associated Locomotives, June 2003. 3 Starcrest, The Port of New York and New Jersey Cargo Handling Equipment Update, January 2005.

Analysis of Vessel Dwelling Emissions and Offset Reduction Measures
Starcrest Consulting Group, LLC December 2005
2
Cost estimates were adapted from the Port of Los Angeles (POLA) No Net Increase (NNI) Task Force document.4, 5 The California Environmental Protection Agency has cited the POLA NNI work in their regulatory planning documents.6 A tool, in the form of a calculator in Microsoft™ Excel, was developed for this report to help compare various strategies to reduce marine-related air emissions. This calculator provides a framework for developing generalized emissions reductions and associated costs; specific projects should be analyzed with respect to operational efficiencies, secondary costs, and other metrics. The method for developing generalized cold ironing costs, as well as costs for each of the emission reduction measures considered, is discussed below. COLD IRONING OF VESSELS Cold ironing involves the use of shore power when a vessel is dockside, as opposed to using onboard diesel generators. Estimates of potential reductions are defined by (1) the number of berths that have dockside power, (2) the number of compatible ships making frequent visits to those same docks (i.e., ships that have been retrofitted or newly built with AMP capability), and (3) the average duration of dockside dwelling time. It is assumed that diesel generators on the ship would be turned off most of the time, thus reducing dwelling emissions to near zero. Many ships continue to use boilers at dockside so as to provide hot water and steam. The average boiler of a motorship is rather small and produces little in the way of emissions, although tanker motorships and cruise liners may have relatively large boilers. The calculator tool assumes that 95% of dockside auxiliary engine emissions would be eliminated by cold ironing (in those cases where the vessel is AMP-capable), in an equation that allows the user to modify the (1) number of shore-side plug installations, (2) number of vessels that can be electrified or modified to accept shore power, and (3) average number of calls per vessel per year. The assumption of 95% was made to account for the short time at berth that auxiliary engines are running before shore power is hooked up and again after it is disconnected. Average dwelling times were extracted from the CMV EI.
4 Port of Los Angeles, Report to Mayor Hahn and Councilwoman Hahn by the No Net Increase Task Force, 24 June 2005. See: http://www.portofla.org/DOC/NNI_Final_Report.pdf. 5 The NNI document cites hydrocarbon (HC) emissions; this document has substituted the term volatile organic compounds (VOCs) for HCs. While they are technically different, they are similar enough that such usage is consistent with the generalized nature of this application, and VOC is the more commonly used term outside California. 6 Business, Transportation and Housing Administration, and California Environmental Protection Agency, Goods Movement Action Plan, September 2005. See: http://www.arb.ca.gov/gmp/docs/finalgmpplan090205.pdf.

Analysis of Vessel Dwelling Emissions and Offset Reduction Measures
Starcrest Consulting Group, LLC December 2005
3
The POLA NNI cost estimates for cold ironing are based on funding agreements between POLA and participating shipping lines, on POLA records on the differential cost between the electricity used during cold ironing and the diesel fuel that would have been used if not for the shore-side electrical power, and on the cost of shore-side labor needed to attach and detach the electrical connections. The cost of retrofitting a vessel to accommodate cold ironing should be similar whether the vessel calls at POLA or at the Port of New York and New Jersey, while the costs of electricity and labor may differ between the west and east coasts. However, no adjustments have been made to the power or labor cost data because the differences would not significantly affect the generalized comparisons the calculator is designed to illustrate. Cold ironing costs are estimated to be:
Shore-side infrastructure - $1,000,000 per plug Vessel retrofitting - $1,000,000 per vessel Operating (labor and electricity) costs - $14,000 per vessel per call
These are very general cost estimates, and specific applications could cost more or less depending on site-specific and vessel-specific conditions. In the calculator, the cost of cold ironing is defined by the following equation:
Total Cost = Capital Cost + Operating Cost
Where,
Capital Cost = (Shore-side Infrastructure Cost x Number of Installations) + (Vessel Retrofitting Cost x Number of Vessels)
Operating Cost = Shore-side Labor and Electricity Cost x
Number of Vessel Calls per Vessel per Year ALTERNATIVE EMISSION REDUCTION METHODS The emission reduction methods to be compared to cold ironing include those related to yard tractor and locomotive switch engine modernization, retrofits of towboat engines, and the use of ULSD in yard tractors, locomotives, and towboats. Yard Tractors Yard tractors are a commonly used equipment type found at container terminals. The strategy is to replace older pieces of equipment that have unregulated engines with new equipment having cleaner engines certified to Environmental Protection Agency (EPA) Tier 2 standards.7 The cost for replacement of a yard tractor is estimated to be $65,000.
7 For a table showing EPA Tier 1 and 2 standards, see the Code of Federal Regulations (CFR) at 40 CFR 89.112(a).

Analysis of Vessel Dwelling Emissions and Offset Reduction Measures
Starcrest Consulting Group, LLC December 2005
4
Average hours for several marine terminals were extracted from the 2002 CHE EI as shown in Table 1; the names of the terminals have been kept confidential based on earlier agreements with these PANYNJ tenants. Many of the yard tractors used by these tenants have been upgraded to Tier 1 standards, hence the comparison of Tier 2 standards to Tier 1 standards, rather than the baseline emissions. The average was selected so as to reflect a typical yard tractor. For NOx, the average reduction would be approximately 0.5 ton per year (tpy), or 2.5 tons over a 5-year yard tractor life.
Table 1: Annual Hour Assumptions and Resulting Emissions, Yard Tractors
TerminalHours /
YearBaseline NOx, tpy
Tier 1 NOx, tpy
Tier 2 NOx, tpy
Tier 1 - Tier 2 Benefits, tpy
Terminal A 2,388 3.4 2.1 1.5 0.6Terminal B 2,300 3.3 2.1 1.5 0.6Terminal C 1,800 2.6 1.6 1.1 0.5Terminal D 992 1.4 0.9 0.6 0.3
average 1,870 2.7 1.7 1.2 0.5 Locomotives This analysis is concentrated on Elizabeth Port Authority Marine Terminal and Port Newark rail facilities as documented in the 2002 CHE EI. Two strategies are included:
Replacement of switch engines with EPA Tier 2 locomotives at a cost of $1,200,000 per engine
Use of idle control technology for older, unregulated locomotives at a cost of $16,000 per engine
Data was averaged in order to profile a typical train engine in terms of annual hours of use. The hourly estimates were based on data from the trainmaster and are shown in Table 2. Crew number 0700 has a split shift of morning and evening use of approximately four hours a shift. Each 0700 shift spends 50% of its time outside the terminal area.

Analysis of Vessel Dwelling Emissions and Offset Reduction Measures
Starcrest Consulting Group, LLC December 2005
5
Table 2: Development of Switch Engine Profile
Crew No. Assignment % In AreaDays / Week
Hours / Shift
Hours / Year County NOx, tpy
0630 Elizabethport CSXT 100% 5 11 2,860 Union 11.10700 Oak Island Transfer 50% 7 4 728 Union 2.80700 Oak Island Transfer 50% 7 4 728 Essex 2.80730 Dockside Placement 100% 7 10 3,640 Union 14.21300 Dockside Pull 100% 5 11 2,860 Union 11.11430 Northside, FAPS 100% 7 9 3,276 Essex 12.81600 Southside 100% 6 12 3,744 Union 14.61600 Port Newark 100% 5 10 2,600 Essex 10.12230 Dockside 100% 6 10 3,120 Union 12.22300 Southside & Huston 100% 5 9 2,340 Union 9.12330 Port Newark 100% 3 8 1,248 Essex 4.9
total 27,144 105.7average 2,468 9.6
Baseline emissions and cleaner Tier 2 standards were then adjusted to show reductions based on this average of 2,468 hours per year. Idle reduction estimates are based on the POLA NNI document. The technology relies on a small auxiliary diesel engine to provide electrical, air brake power, and engine readiness (lube oil and cooling water circulation) while the main engine is turned off. While idling emissions are very low they can account for up to 60% of the operating time. The NNI analysis estimated reductions of NOx and PM to be on the order of 7-8%, using the assumption that any idling over 30 minutes would be eliminated. Towboats New engine costs were estimated to be $450,000 per average towboat. Profiles of towboat engine operations were developed from the CMVEI. A set of representative vessel parameters was developed for two size groups of towboats and for assist tugs that includes engine size and annual hourly usage profiles. These parameters are identified in Table 3, where HP stands for horsepower, kW stands for kilowatt, and auxiliary is abbreviated as ‘Aux’.
Table 3: Towboat Engine Profiles
Towboat Type Main HP Main kW Aux kWMain Hours
Aux Hours
Inland Towboat 2,000 2,682 50 2,000 2,400Average Assist Tug 3,900 5,230 85 3,000 3,600Large Towboat 5,000 6,705 125 1,000 1,200
average 3,633 4,872 87 2,000 2,400
Analysis of Vessel Dwelling Emissions and Offset Reduction Measures
Starcrest Consulting Group, LLC December 2005
6
Auxiliary engines were included for the sake of completeness even though the selected measure is to replace the main engine(s); this was to account for the time when main engines were expected to be turned off but the towboat remains on duty with the auxiliary engine(s) running (from the assist vessel profile developed for marine terminals leased by the PANYNJ). Ultra-Low Sulfur Diesel Fuel The cost differential for reformulated diesel as compared to onroad diesel is estimated at approximately seven cents per gallon.8 Yard tractors, locomotives, and towboats were independently modeled as having the ability to switch from on-road diesel (350 ppm sulfur) to ULSD. The nominal value for the sulfur content of ULSD is 15 ppm, but the maximum value, especially during the transition from traditional diesel, could be as high as 30 ppm. The main impact of this change is to significantly lower SO2 emissions, although there are some reductions in PM, also. In addition, the ULSD fuel formulation assumes lower aromatic and higher cetane as prescribed by the California Air Resources Board.9 The result of this formulation is to reduce NOx emissions by approximately 7%. Estimation of fuel consumption was provided by calculations of brake specific fuel estimates. COMPARISON OF EMISSION REDUCTION METHOD COST EFFECTIVENESS Cost effectiveness is defined as the total money invested in the control technology divided by the amount of air emissions reduced. This yields a measure of dollars per ton of removed emissions. Some cost effectiveness calculations involve multi-year assessments and some are considered to be instantaneous. For example, the purchase of a new Tier 2 engine can be expected to continue to reduce emissions for several years during the engine’s useful life, typically in the range of five to ten years; fuel-related strategies only work for the period of time the fuel is in use because when the fuel is consumed it is burned and has no continuing effect. While an expenditure on new equipment in one year will have an effect lasting into subsequent years, an expenditure on a fuel measure for a year will reduce emissions only in that year – continuing expenditures would be required to continue the reduction.
8 This cost differential is based on the wide availability of low sulfur diesel fuel once it becomes mandated in the northeast in the latter part of 2006 and beginning of 2007. The cost differential used reflects the current pricing differential in the West Coast where this fuel is readily available. 9 California Air Resources Board, Staff Report: Initial Statement of Reasons - Proposed Amendments To The California Diesel Fuel Regulations Including Reduction of the Maximum Permissible Sulfur Content of Motor Vehicle Diesel Fuel, 6 June 2003.

Analysis of Vessel Dwelling Emissions and Offset Reduction Measures
Starcrest Consulting Group, LLC December 2005
7
The calculation spreadsheet that accompanies this report can be used to compare the cost effectiveness of various combinations of emission reduction strategies. For example, retrofitting one vessel that calls nine times per year with cold ironing capability would, over a 25-year project life, reduce approximately:
77 tons of NOx 6 tons of PM 92 tons of SO2 5 tons of VOC 11 tons of CO
at a first-year cost of approximately $2,126,000 (assuming $1,000,000 for shore-side infrastructure, $1,000,000 for vessel retrofit, and $14,000 per vessel call for operating costs; and an ultimate cost, over a 25-year project lifespan, of $5,150,000, based on nine vessel calls per year).10 This equates into annual reductions of approximately:
3.1 tons of NOx 0.26 tons of PM 3.7 tons of SO2 0.19 tons of VOC 0.45 tons of CO
A similar annual level of NOx reduction could be achieved by replacing six typical older yard tractors with new Tier 2 models, at an approximate cost of $390,000, less than one fifth of the cost of cold ironing. Those six yard tractors would also reduce PM emissions by an estimated 0.42 tons, which exceeds the PM reduction achieved by cold ironing. There would be no SO2 benefit from the Tier 2 yard tractors, but converting 14 yard tractors (no matter the age) to ULSD would match the SO2 reduction benefit of cold ironing, at a cost of less than $15,000 per year. In terms of cost per ton of reductions, this analysis indicates that cold ironing one vessel that makes nine calls per year reduces NOx for a cost of $66,000 per ton (e.g., $5,150,000 divided by a total reduction of 77 tons), PM at a cost of $792,000 per ton, and SO2 at a cost of $56,000 per ton. The yard tractor replacements, in contrast, cost $26,000 per ton of NOx and $186,000 per ton of PM. The use of ULSD reduces SO2 for approximately $4,000 per ton. These comparisons are illustrated in Table 4, which shows that CO emissions are also reduced more cost effectively by yard tractor replacements, although no VOC benefit is achieved. Table 4 is copied from the calculator tool; the gray shaded areas are changeable user inputs in the tool.
10 The actual cost would be highly variable, depending on whether a vessel is retrofit for AMP after being placed in service or while under construction, and on design features of the vessel’s existing electrical infrastructure.

Analysis of Vessel Dwelling Emissions and Offset Reduction Measures
Starcrest Consulting Group, LLC December 2005
8
The total costs are based on the following projected useful equipment lives:
Cold ironing – 25 years Yard tractor replacement with Tier 2 engine upgrade – 5 years Locomotive replacement with Tier 2 engine upgrade – 10 years Locomotive with idling reduction mechanism installed – 5 years Towboat with Tier 2 engine installed – 10 years ULSD fuel change – 1 year
Cost effectiveness for cold ironing is derived from the following equation:
Cost Effectiveness = [(Number of Vessels x Number of Vessel Calls x Useful Life, years x Operating Costs per Vessel Call) + Capital Costs]/Lifetime Emissions Reduced, tons

Analysis of Vessel Dwelling Emissions and Offset Reduction Measures
Starcrest Consulting Group, LLC December 2005
9
Table 4: Cost Effectiveness Comparison: Cold Ironing of Vessels vs. Alternative Measures
Cold Ironing of Vessels # of Units1Total Cost
tpy cost/ton tpy cost/ton tpy cost/ton tpy cost/ton tpy cost/tonNumber of Shore-Side Plugs 1 $2,126,000 (initial cost first year)Number of Vessels Retrofit 1 3.1 $66,452 0.26 $792,308 3.7 $55,676 0.19 $1,084,211 0.45 $457,778Calls per Year per Vessel 9 $5,150,000 (overall cost for project life shown on "Cost" worksheet)
Alternative Measures # of Units1Total Cost
tpy cost/ton tpy cost/ton tpy cost/ton tpy cost/ton tpy cost/ton
Yard Tractors with Tier 2 Engines 6 $390,000 3.0 $26,000 0.42 $185,714 NA4 NA4 NA5 NA5 1.32 $59,091Yard Tractors with Clean Fuel 14 $14,658 1.7 $8,725 NA3 NA3 3.78 $3,878 NA5 NA5 NA5 NA5
Locomotives with Tier 2 Engines 1 $1,200,000 5.7 $21,053 0.13 $923,077 NA4 NA4 0.86 $139,535 3.23 $37,152Locomotives with Idle Reduction 13 $208,000 5.2 $8,000 0.26 $160,000 0.66 $63,492 1.26 $33,058 4.79 $8,677Locomotive with Clean Fuels 6 $15,030 4.0 $3,739 NA3 NA3 3.72 $4,040 NA5 NA5 NA5 NA5
Towboats with Tier 2 Engines 1 $450,000 41.5 $1,084 0.54 $83,333 NA4 NA4 NA5 NA5 NA6 NA6
Towboats with Clean Fuel 1 $25,718 6.6 $3,897 NA3 NA3 5.9 $4,330 NA5 NA5 NA5 NA5
$2,303,406 67.7 1.4 14.1 2.1 9.3Notes to table:1 The number of units can be altered to evaluate the effect on emission reductions2 For equipment replacements, cost/ton based on cumulative reduction over the life of the equipment3 A small PM reduction might be achieved by switching to lower sulfur fuel, but cannot be estimated at present.4 No reduction of SO2 from these replacements.5 VOC or CO Benefit from fuels or emission standards not found (may be small VOC benefit6 Tier 2 standard is higher than the baseline emission factors for CO; therefore, there would be no CO reduction from this replacement
NOx Reduction PM Reduction SO2 Reduction
NOx Reduction PM Reduction SO2 Reduction
VOC Reduction
VOC Reduction
CO Reduction
CO Reduction

Analysis of Vessel Dwelling Emissions and Offset Reduction Measures
Starcrest Consulting Group, LLC 10 December 2005
In the preceding example, yard tractor replacements and a shift to ULSD, even on a modest scale (six and 14 tractors, respectively), appears to provide emission reduction benefits equivalent to or better than cold ironing at a lower cost per year and a lower cost per ton. Locomotive replacements are not as attractive as yard tractors as sources of emission reductions – while the cost per ton of NOx reduced is lower than that of cold ironing ($21,000/ton vs $68,000/ton), the PM emissions are approximately 13% more costly ($905,000/ton vs $803,000/ton). However, locomotive idling limiters and low sulfur fuel for locomotives (that operate in the nonattainment area) can be more cost effective. Thirteen locomotives with idling controls may be able to reduce more NOx, VOC, and CO than the cold ironing scenario, and as much PM, at a substantially lower cost. The addition of ULSD to half as many locomotives would eliminate as much SO2 as the cold ironing scenario at a fraction of the cost. Tugs and towboats appear to provide a very attractive source of emission reductions. As indicated by the example developed using the emission calculator, a single towboat with an older, unregulated engine operating a typical duty cycle may provide a substantial reduction on being repowered with a new Tier 2 engine, at an initial cost of less than one fourth that of cold ironing. Cost per ton of NOx is potentially an even smaller fraction of the cost of cold ironing. This table also shows a significantly greater PM reduction from repowering a towboat, at a cost approximately 10% that of cold ironing. While a Tier 2 engine will not provide any benefit in terms of SO2, VOC, or CO, the use of a low sulfur fuel can cut SO2 emissions for less than 10% of the cost of reductions from cold ironing. CONCLUSION Cold ironing may not be a practical emission reduction strategy at marine terminals leased by PANYNJ due to the fact that it requires costly shore-side modifications, and changes to existing long-term lease agreements. More importantly, there is currently no national and/or international regulation that would prompt the spectrum of independently owned vessel holders to invest in the considerable costs of conversion to AMP. Finally, other emission reduction methods that could be employed are much more cost effective. For approximately the same amount of funds required to implement cold ironing for just one vessel, far greater emission reductions could be achieved using a combination of alternative emission reduction methods. As an example, Tables 5 and 6 illustrate the costs of scenarios entered into the calculator tool for various emission control options. In Table 5, the annualized costs are illustrated for the NOx reductions achievable under the scenarios illustrated in Table 4. In comparing the annualized cost of cold ironing with the total annualized cost of the other emission reduction scenarios combined, it can be seen that a total of almost 68 tons of NOx can be reduced per year from the alternative measures at a cost of $340,000 per year, for an overall cost of $5,000 per ton of NOx. This contrasts with the cold ironing reduction of three tons per year (for one vessel participating) at an annual cost of $206,000, for a cost per ton over $66,000.

Analysis of Vessel Dwelling Emissions and Offset Reduction Measures
Starcrest Consulting Group, LLC December 2005
11
Table 5: Comparison of Annualized Costs and Reductions
Reductions,Emission Reduction Strategy Total Cost Number of
YearsAnnual Cost Tons NOx per
YearCost per Ton
1 Vessel Participating in Cold Ironing $5,150,000 25 $206,000 3.1 $66,452
6 Yard Tractors with Tier 2 Engines $390,000 5 $78,000 3.0 $26,00014 Yard Tractors with Clean Fuel $14,658 1 $14,658 1.7 $8,7251 Locomotive with Tier 2 Engines $1,200,000 10 $120,000 5.7 $21,053
13 Locomotives with Idle Reduction $208,000 5 $41,600 5.2 $8,0006 Locomotive with Clean Fuels $15,030 1 $15,030 4.0 $3,7391 Towboat with Tier 2 Engines $450,000 10 $45,000 41.5 $1,0841 Towboat with Clean Fuel $25,718 1 $25,718 6.6 $3,897
Total of Measures other than Cold Ironing $340,006 67.7 $5,022 In Table 6, the value in parentheses after the emission reduction methods refers to the number of affected units, or pieces of equipment. ‘NA’ (not applicable) indicates that there is no emission benefit. These values are taken directly from the calculator tool, and thus there may be rounding errors.
Table 6: Summary Comparison of Emission Reduction Methods
Emissions Reduced, tons per year Emission Reduction Method
NOx PM SO2 VOC CO
Total First Year
Cost Cold Ironing Cold ironing (one shore-side plug, one vessel, nine calls)
3.1 0.26 3.7 0.19 0.45 $2,126,000
Alternative Emission Reduction Methods Yard Tractors with Tier 2 Engines (6) 3.0 0.42 NA NA 1.32 $390,000Yard Tractors with ULSD (14) 1.7 NA 3.78 NA NA $14,658Locomotives with Tier 2 Engines (1) 5.7 0.13 NA 0.86 3.23 $1,200,000Locomotives with Idle Reductions (13) 5.2 0.26 0.66 1.26 4.79 $208,000Locomotives with ULSD (6) 4.0 NA 3.72 NA NA $15,030Towboats with Tier 2 Engines (1) 41.5 0.54 NA NA NA $450,000Towboats with ULSD (1) 6.6 NA 5.9 NA NA $25,718
Total 67.7 1.4 14.1 2.1 9.3 $2,303,406 In summary, for approximately the same initial cost as cold ironing one vessel, a combination of alternative emission reduction methods can be employed to achieve:
23 times the annual NOx reductions 5 times the annual PM reductions 4 times the annual SO2 reductions 11 times the annual VOC reductions 20 times the annual CO reduction

Analysis of Vessel Dwelling Emissions and Offset Reduction Measures
Starcrest Consulting Group, LLC December 2005
APPENDIX – CALCULATOR TOOL A calculator tool comparing yard tractor, locomotive, and towboat engine upgrades, and the use of ultra-low sulfur diesel fuel in these pieces of equipment, to cold ironing of vessels accompanies this document. To use the calculator, prepared in Microsoft™ Excel, enter the number of shore-side plugs to be installed, the number of vessels to be fitted for cold ironing, and the number of ship calls per vessel per year that will use cold ironing. Then, enter the number of pieces of equipment for the alternative emission reduction strategies that are being considered. Enter ‘0’ if a strategy is not being considered, and enter a number from ‘1’ and up for the number of units to be retrofitted with the specified technology or to use cleaner fuel. In this manner, the general cost effectiveness of reductions in emissions from cold ironing can be compared to a selected mix of emission reduction alternatives.