analysis of value added cassava-based products and
TRANSCRIPT

ANALYSIS OF VALUE ADDED CASSAVA-BASED PRODUCTS AND
PROFITABILITY OF HIGH QUALITY CASSAVA FLOUR BAKERY
PRODUCTS IN ATEBUBU
BY
STANISLAUS GANYO YAW AMEGASHIE
THIS THESIS IS SUBM ITTED TO THE UNIVERSITY OF GHANA, LEG O N, IN
PARTIAL FULFILLMENT OF THE REQUIREMENT FOR THE AW ARD OF
MASTER OF PHILOSOPHY DEGREE IN AGRICULTURAL ADM INISTRATION
DEPARTMENT OF AGRICULTURAL ECONOMICS
AND AGRIBUSINESS
FACULTY OF AGRICULTURE,
UNIVERSITY OF GHANA
LEGON.
OCTOBER 2004
University of Ghana http://ugspace.ug.edu.gh

<$37445• L ^
c , , t> »
University of Ghana http://ugspace.ug.edu.gh
DECLARATION
I Stanislaus Ganyo Yaw Amegashie, the author o f this thesis, “Analysis of Value
Added Cassava-Based Products and the Profitability of High Quality Cassava
Flour Bakery Products in Atebubu” was done entirely by me in the Department
o f Agricultural Economics and Agribusiness, University o f Ghana, Legon. This
work has never been presented either in whole or in part for any degree at this
University or elsewhere.
Works by other authors, which served as sources o f information, have duly been
acknowledged by reference to the author.
(Student)
This thesis has been presented for examination with our approval as supervisors:
Ganyo S.Y. Amegashie
(Major Supervisor)
Dr. Akwasi Mensah- Bonsu
(Co-Supervisor)
University of Ghana http://ugspace.ug.edu.gh

This work is dedicated to
• My parents Mr. C.K. Amegashie and the late Mrs N.I. Amegashie o f blessed
memory.
• My dear wife Diana
• My children, Wendy, Jude and Lemuel
DEDICATION
University of Ghana http://ugspace.ug.edu.gh

ACKNOW LEDGEMENT
I wish first o f all, to offer sincere thanks to the Almighty God for granting me
the health, and tenacity o f purpose that sustained me throughout the course. I
would like to express my gratitude to all my course mates and all my lecturers
whose input during the course were o f enormous help to me in writing this
thesis.
Special thanks go to Dr. G T-M. Kwadzo, my major supervisor under whose
careful supervision, critical and constructive advice and direction this
dissertation was completed. I wish to record my sincere thanks to Mr. John
Baptise Jato for his immense contribution during the brief period he served as a
co-supervisor. I wish to express my heartfelt appreciation to Dr. Mensah Bonsu
who took over as co-supervisor for his valuable inputs and advise.
To N. Dziedzoave, kudos for the pecuniary assistance without which meeting
the financial demands o f this work would have been difficult. Again, thank you
for the invaluable services rendered in providing relevant information which
contributed enormously in writing this thesis. Not forgetting the immense role
played by Krampa and M. Aduko o f the Ministry o f Food and Agriculture. My
sincere thanks go to my dear sister Mildred for printing the entire thesis work.
Grateful acknowledgement is also made to various authors whose work and
material provided valuable information and experiences without which this work
would not have been completed.
University of Ghana http://ugspace.ug.edu.gh

ABSTRACT
The aim o f this study among others, was to analyse the value additions o f three cassava-
based products namely, High Quality Cassava Flour (HQCF), gari and kokonte and to
determine the profitability o f HQCF bakery products in Atebubu.
A value added analysis was used to determine the profitablity o f the three cassava-based
products. Three profitability measures were used to determine the profitability o f HQCF
bakery products. These were, operating profit, profit per unit product and return on
investment. A bar chart o f output levels was used to represent the trend in production o f
HQCF. Finally, the Kendal’s Coefficient o f Concordance (W) was used to analyse the
ranking o f the constraints affecting the production o f HQCF.
Only HQCF had positive values for the two prices seasons that were considered, that is, the
lean price season and high price season. Production o f dough nut (“bo/rot"), and “sweet
bad”, chips and meat pie with 50% HQCF composite flour yielded better financial returns
than that o f 100% wheat flour. Similar results were obtained from the production o f bread
and cake with 12% HQCF, and 100% HQCF respectively. However the use o f 22% HQCF
composite flour for bread yielded lower profit than the use o f 100% wheat flour.
The rankings o f the identified constraints affecting HQCF production were subjected to the
Coefficient o f Concordance analysis. The results were that farmers did not collectively agree
to the rankings o f the identified constraints, which included, drying space, distance from the
University of Ghana http://ugspace.ug.edu.gh

mill, frequent breakdown o f the screw presser storage room, harvesting o f cassava, distance
from the farm, the absence o f a micro finance scheme among others.
HQCF bakery products competed favourably with wheat flour bakery products in all the
profitability measures used. The promotion and use o f HQCF bakery products must be
pursued by serving HQCF bakery products at state functions and institutions like the
secondary schools that receive subvention for feeding This w ill go a long way to popularize
HQCF bakery products and reduce the foreign exchange used for the importation o f wheat
and wheat flour into the country.
v
University of Ghana http://ugspace.ug.edu.gh

TABLE OF CONTENTS
CONTENTS Page
DECLARATION i
DEDICATION ii
ACKNOWLEDMENT iii
ABSTRACT IV
TABLE OF CONTENTS VI
LIST OF TABLES IX
LIST OF FIGURES X
LIST OF ACRONYMS XI
CHAPTER ONE: INTRODUCTION
1 Background 1
1.2 Problem Statement 4
1.3 The Objective o f the Study 6
1.4 Relevance o f the Study 7
1.5 Organization o f the Study 8
CHAPTER TWO: LITERATURE REVIEW 9
2.1 Introduction 9
2.2 Importance o f Cassava in Ghana 9
2.3 Evolution o f Cassava Production in Ghana 11
2.4 Development o f Improved Varieties 11
2.4.1 The National Root and Tuber Improvement Project (NRTCIP) 13
2.5 Government Policies on the Agricultural Sector 14
vi
University of Ghana http://ugspace.ug.edu.gh

2.5.1 Immediate Post Independence Period 14
2.5.2 Five-Year Development Plan (1975/76 -79/80) 15
2.5.3 The Economic Recovery Programme and Structural Adjustment 15
2.6 Post Harvest Issues 16
2.6.1 Status o f Cassava Research 17
2.7 Processing 18
2.8 Interventions for Processing 19
2.9 Profitability o f Cassava-Based Products 19
2.10 Cassava Based Products with Export Potential 20
2.11 Use o f HQCF for Bakery and Industrial Use 22
2.12 The Conversion o f Cassava Roots into Kokonte 25
2.13 Conversion o f Cassava Roots into Gari 26
2.14 Conversion o f Cassava Roots into HQCF 26
2.14.1 Production o f HQCF in Watro 27
2.15 Value Added Analysis 28
2.16 Coefficient o f Concordance Analysis (W) 29
2.17 Conclusion 30
CHAPTER THREE: M ETHODOLOGY 31
3.1 Introduction 31
3.2 The Study Area 31
3.2.1 Atebubu 31
3.2.2 Watro 32
3.3 Data Requirement 33
vii
University of Ghana http://ugspace.ug.edu.gh

3.4 Method o f Analysis 33
CHAPTER FOUR: RESULTS AND DISCUSSIONS 39
4.1 Introduction 39
4.2 Value Added Analysis 39
4.3 Estimation o f Profits o f HQCF Bakery and
Wheat Flour Bakery Products 42
4.4 Production and Growth Rates o f HQCF 2000 - 2003. 50
4.5 The Success Drivers 54
4.6 Constraints Affecting the Production o f HQCF 56
CHAPTER FIVE: CONCLUSIONS AND RECOM M ENDATIONS 63
5.1 Introduction 63
5.2 Conclusion % 63
5.3 Recommendation 64
Reference 67
APPENDIX 71
viii
University of Ghana http://ugspace.ug.edu.gh

3.4 Method o f Analysis 33
CHAPTER FOUR: RESULTS AND DISCUSSIONS 39
4.1 Introduction 39
4.2 Value Added Analysis 39
4.3 Estimation o f Profits o f HQCF Bakery and
Wheat Flour Bakery Products 42
4.4 Production and Growth Rates o f HQCF 2000 - 2003 . 50
4.5 The Success Drivers 54
4.6 Constraints Affecting the Production o f HQCF 56
CHAPTER FIVE: CONCLUSIONS AND RECOM M ENDATIONS 63
5.1 Introduction 63
5.2 Conclusion 63
5.3 Recommendation 64
Reference 67
APPENDIX 71
viii
University of Ghana http://ugspace.ug.edu.gh
LIST OF TABLES
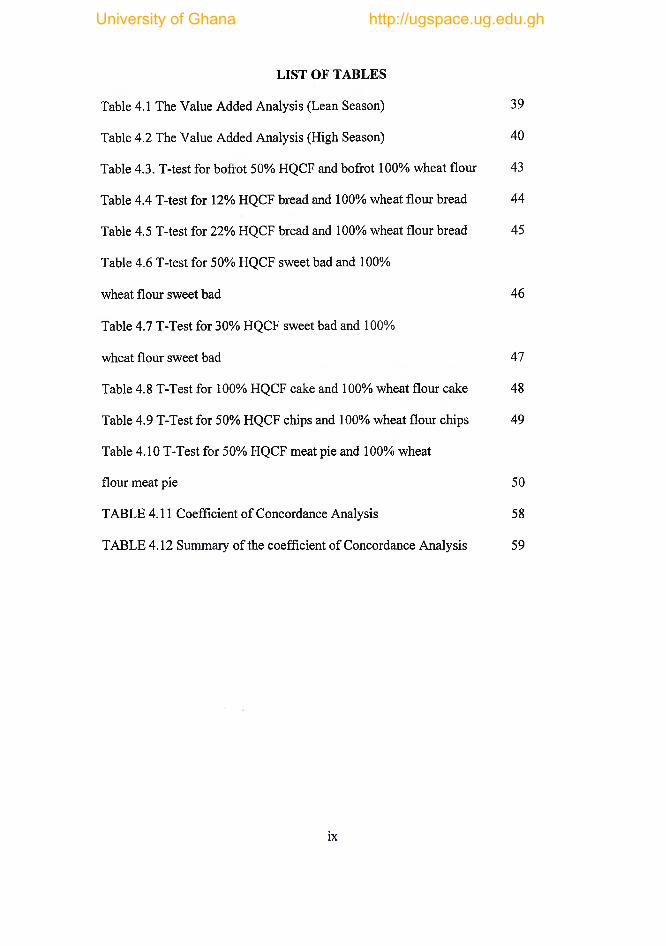
Table 4.1 The Value Added Analysis (Lean Season) 39
Table 4.2 The Value Added Analysis (High Season) 40
Table 4.3. T-test for bofrot 50% HQCF and bofrot 100% wheat flour 43
Table 4.4 T-test for 12% HQCF bread and 100% wheat flour bread 44
Table 4.5 T-test for 22% HQCF bread and 100% wheat flour bread 45
Table 4.6 T-test for 50% HQCF sweet bad and 100%
wheat flour sweet bad 46
Table 4.7 T-Test for 30% HQCF sweet bad and 100%
wheat flour sweet bad 47
Table 4.8 T-Test for 100% HQCF cake and 100% wheat flour cake 48
Table 4.9 T-Test for 50% HQCF chips and 100% wheat flour chips 49
Table 4.10 T-Test for 50% HQCF meat pie and 100% wheat
flour meat pie 50
TABLE 4.11 Coefficient o f Concordance Analysis 5 8
TABLE 4.12 Summary o f the coefficient o f Concordance Analysis 59
ix
University of Ghana http://ugspace.ug.edu.gh

LIST OF FIGURES
Figure 4.1: HQCF Production (2000-2003)
Figure 4.2: Growth in HQCF Production (2000-2003)
Figure 4.3: Success Drivers
University of Ghana http://ugspace.ug.edu.gh
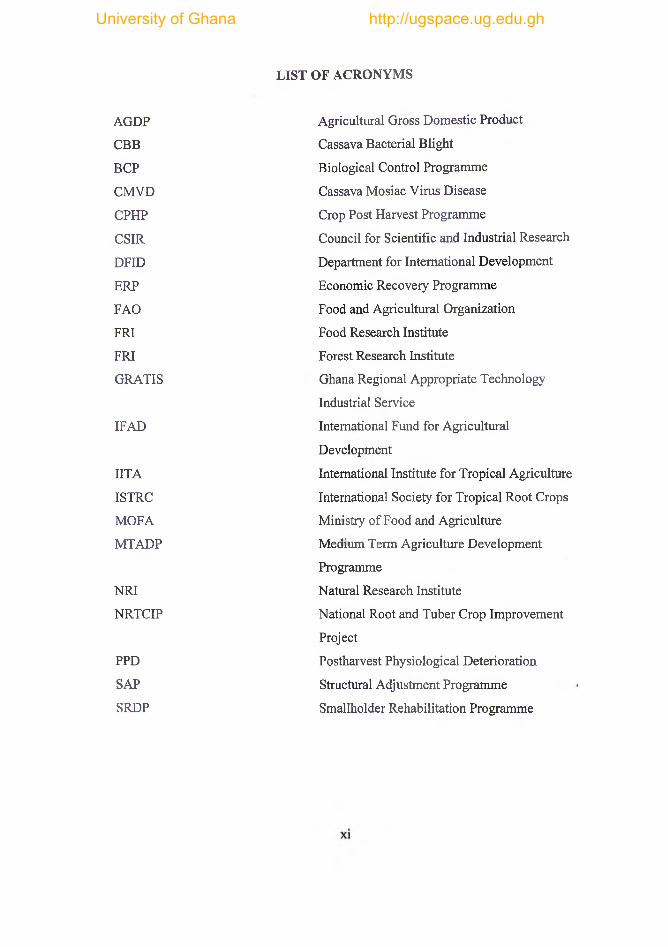
LIST OF ACRONYMS
AGDP Agricultural Gross Domestic Product
CBB Cassava Bacterial Blight
BCP Biological Control Programme
CMVD Cassava Mosiac Virus Disease
CPHP Crop Post Harvest Programme
CSIR Council for Scientific and Industrial Research
DFID Department for International Development
ERP Economic Recovery Programme
FAO Food and Agricultural Organization
FRI Food Research Institute
FRI Forest Research Institute
GRATIS Ghana Regional Appropriate Technology
Industrial Service
IFAD International Fund for Agricultural
Development
IITA International Institute for Tropical Agriculture
ISTRC International Society for Tropical Root Crops
MOFA Ministry o f Food and Agriculture
MTADP Medium Term Agriculture Development
Programme
NRI Natural Research Institute
NRTCIP National Root and Tuber Crop Improvement
Project
PPD Postharvest Physiological Deterioration
SAP Structural Adjustment Programme
SRDP Smallholder Rehabilitation Programme
University of Ghana http://ugspace.ug.edu.gh

CHAPTER ONE
INTRODUCTION
1.1 Background
Cassava (Manihot esculenta) is probably the most important root crop in Ghana. Annual
production has been rising consistently over the last decade and currently is estimated at
ten million tonnes of fresh roots per annum. Cassava is a major source of daily
carbohydrate intake to majority o f Ghanaians and also serves as an important food
security crop due to its ability to grow on marginal lands and its tolerance to drought
(DFID, CPHP.1999).
Cassava is eaten from the fresh form, boiled, pounded to make fufu, fried, roasted or
processed into a range o f traditional products including agbelima and gari. Cassava is
also cut into chips, sun dried and pounded or milled into flour known as kokonte. Cassava
is also used on a small scale for industrial purpose and as source o f carbohydrates in
livestock feed. Cassava starch has varied uses in the paper, textile, pharmaceutical, oil
drilling and petrochemical industries. It is also used extensively in the food industry. The
by-products are pulp and juice. The pulp produced is a valued cattle fodder while the
juice is used as fertiliser
There are many small-scale processors, mostly women engaged in transforming cassava
roots into traditional cassava products like gari, cassava dough, kokonte among others.
All over Ghana, however, wherever cassava is grown, pockets o f processors can be
identified. These processors produce basically to meet local demands and to some extent
1
University of Ghana http://ugspace.ug.edu.gh

export to neighbouring countries such as Togo. In Watro (a village in the Atebubu
district) the most important cassava products into which cassava root is processed are
cassava chips, gari and kokonte. In order to exploit the industrial potential o f cassava in
the area, the Department for International Development (DFID), funded a collaborative
project executed by the Natural Resource Institute (NRI) UK, and the Food Research
Institute (FRI) Ghana to train farmers to process fresh cassava roots into High Quality
Cassava Flour (HQCF).
Most people refer to cassava flour as kokonte, which is a relatively low-grade fermented
and milled traditional product. The product can be of poor quality because drying times
are typically long allowing microbial growth. Apart from the physical description of
kokonte there is no known standard chemical composition analysis of this traditional
product according to the Food Research Institute of Ghana and so can be said about gari
another traditional cassava based product. Non-fermented “kokonte " flour in this study
is however referred to as “High Quality Cassava Flour”(HQCF). HQCF is white in
colour. It is free from extraneous matter including peel fragments and sand particles.
Acidity, is less than 0.25 per cent, the ph is between 6-7. The average particle size ranges
between 115-120 (am. The starch content is less than 70 percent. And viscosity (BU) is
less than 750. The processing of cassava roots into high quality cassava flour involve
peeling, washing grating/slicing/chipping, pressing, disintegration, sifting, drying,
milling, screening, packaging and storage. In the production HQCF, the first eight stages
o f the process must be completed within 12 hours of harvesting the fresh cassava roots
otherwise fermentation will set in which will affect the quality of the final product.
2
University of Ghana http://ugspace.ug.edu.gh

Bakery products like bread, pie, cake, and doughnuts, among others have become
important convenient food items for the average Ghanaian. These products are prepared
from wheat flour, which is imported. Research has shown that HQCF can be used wholly
or in various proportions, substituting wheat flour in the preparation o f bakery products.
Imported wheat flour currently dominates the market for flour in Ghana. Ghana imports
approximately 250,000- 300,000 tonnes of wheat equivalent (wheat grain and flour) per
annum (Dziedzoave et al, 1998). Most of the wheat is used in the food industry in the
preparation of bread and snacks food such as biscuits, cakes, pies, and doughnuts. The
food sector is an attractive market for HQCF because of its consumption o f imported
wheat flour. Research carried out in Ghana and many parts o f the world has demonstrated
that HQCF can be used to substitute for 50 per cent of wheat flour in many products
(Dziedzoave et al, 1998).
Research in Peru has shown that HQCF can be used to substitute for wheat flour in
plywood glues up to 46% by volume (Jones, 1994). Plywood manufacturers in Peru
have successfully used HQCF to save cost. Similarly, glues containing cassava starch
have been successfully tested by the timber industry in the Philippines (Fidel et al, 1992).
Preliminary technical and economic evaluation in Ghana indicated the potential for
locally produced HQCF to substitute for imported materials in the areas of plywood glue
extenders, paperboard adhesives and as a partial substitute for wheat flour in a range of
snacks foods. (Day et al, 1994). The exploitation of these market outlets offer the
potential to improve the standard of living and income levels of farmers, primary
processors and end users as well as intensify the integration of agriculture with industry.
3
University of Ghana http://ugspace.ug.edu.gh
Cassava is a key food security crop in Ghana, and is o f particular importance to low-
income farmers (including many women) because it can provide reasonable yields on
marginal soils with little inputs even under drought conditions (Al-Hassan, 1989). In 1998
the International Fund for Agricultural Development committed $10 million towards
increased production of cassava in Ghana. However, increasing production can only
contribute to improving livelihoods if farmers have markets for their produce. Need
assessment studies funded under the Regional Africa Project (Kleih et al, 1994)
highlighted farmers’ concern to expand market opportunities for cassava and improved
producer prices. Studies under the Crop Post-Harvest Programme (CPHP) have
demonstrated that market opportunities exist in Ghana that will enable cassava contribute
significantly to poor people’s livelihoods (Day et al, 1996) The starting point for these
markets is the conversion o f fresh cassava roots into stable, dried form (chips, gari, flour)
that can be stored until required for sale, further processing or consumption.
The NRI, FRI, and the University of Ghana in collaboration, carried out commercial trails
o f HQCF as substitute for wheat flour and soft and hard dough biscuits with a major
biscuit manufacturer and two bakeries in Accra. In soft and hard dough biscuits, HQCF
replaced 35% and 60% of wheat flour respectively without reducing product quality. The
potential, therefore, exist for the utilization o f processed cassava as an industrial input.
1.2 Problem Statement
Cassava roots are perishable, spoiling starts within 3-4 days after harvest. They are also
bulky containing 70% moisture by weight. In addition, they contain cyanogenic
glucosides which breakdown to form hydrocyanic acid (HCN), a toxic compound
4
University of Ghana http://ugspace.ug.edu.gh

(ISTRC, 2000). Processing is necessary to reduce the moisture content and weight,
improve product storage, enhance flavour, and reduce the HCN content to safe levels.
Cassava is one of the most important root crops in Ghana, and is of great importance for
resource poor farmers. The contribution that cassava can make to sustainable livelihoods
is constrained by the range of economic stability o f current market outlets, and the highly
perishable nature of fresh cassava.
The main market for fresh cassava for farmers in Watro is the Atebubu market which is
about 14.5 Km from the village. Although the village has no market structure in the
community, buyers from all over the country often come to the village to purchase fresh
cassava roots. According to a baseline survey carried out by the FR1 and other
collaborative agencies, all cassava produced in Watro is sold. This was adduced, because
farmers are not willing to lock up their lands with old cassava roots. The reason being that
cassava root is a low value crop and storing or leaving it in the ground does not add to its
value, rather it deteriorates. As a result when the growing season comes to an end,
farmers dispose o f their cassava roots at any price. To make some meaningful income
from cassava roots, some farmers resorted to processing the fresh cassava roots to various
cassava-based products, such as cassava chips, kokonte, and to a lesser extent gari. The
DFID and CPHP added another dimension to the cassava-based products in Watro, by
training fanners to process cassava roots into HQCF. Bakers in Atebubu use HQCF in
various combinations for a variety of bakery products.
The questions to be asked are, what are the benefits in using HQCF for bakery products?
If the use of HQCF is cost saving for the baker, are there any incentives for the supply of
5
University of Ghana http://ugspace.ug.edu.gh

the commodity? What other product options are available for the processor (farmer) so far
as other cassava-based products are concerned? What are the value additions to the
various cassava based products? How sustainable is the commercial production of
HQCF?
Answering these questions will help make an effective comparison between the
production of HQCF and other cassava-based products in terms of profitability.
1.3 The Objective of the Study
The study aims at conducting value addition analysis on HQCF production and the
production of other cassava-based products, and how the uses of HQFC by the bakeries
affect their financial performance.
Specific Objectives
The specific objectives of the study are:
> To estimate the value added in processing fresh cassava roots into three cassava-
based products (HQCF, gari and kokonte) to derive information for the analysis
of value addition.
> To estimate the profit margins obtained by bakers in the use of HQCF compared
with wheat flour to establish the comparative advantage.
> To assess the production figures of HQCF over the 2000- 2003 period to gather
information for analysing the growth rate in production
> To identify the constraints and success drivers in processing fresh cassava roots
into high quality cassava flour.
6
University of Ghana http://ugspace.ug.edu.gh

1.4 Relevance of the Study
Cassava roots account for about 22% of agricultural GDP and have the lowest entry
barriers to production compared to other major crops in Ghana. Over 90% of Ghanaian
farmers cultivate cassava either as a main crop or mixed with other crops. In spite of its
dominance as the most widely cultivated food crop in Ghana, the full benefit of cassava
roots in terms o f the varied industrial use to which they can be put, are yet to be realised.
Ghana has the capacity to transform her cassava industry into a major economic growth
pole, on account of the potential of cassava as an industrial raw material. HQCF has
varied uses in the bakery, paper, plywood and pharmaceutical industry. There is therefore
the need to investigate the operations involved in the processing o f the various cassava-
based products of industrial potential. The evaluation of the value added along the value
chain will help identify the beneficial effect of each activity to the rural processor (the
farmer). The study will also give more insight into which cassava based product
generates more revenue and has linkages with other economic activities at the rural level.
HCQF production is relatively new. The awareness of the uses o f HQCF in the bakery
industry has been created through Agricultural Fairs in Accra. This study will seek to
gather more information and weigh up the advantages and disadvantages of using HQCF
in the bakery industry. The information gathered will inform future research work and
donor agencies in the replication of similar projects in other cassava producing areas of
the country.
7
University of Ghana http://ugspace.ug.edu.gh

Processing and packaging of primary agricultural produce are major issues o f concern for
the Ministry of Food and Agriculture. A study in this sector is therefore important to feed
into government policy process on food and agriculture.
1.5 Organisation of the Study
Chapter Two reviews relevant literature on the study, the third chapter throws light on
the area of study, methodology and method of data analysis. The forth chapter covers the
results and discussions and finally the last chapter draws the, conclusions and
recommendations.
University of Ghana http://ugspace.ug.edu.gh

CHAPTER TW O
LITERATURE REVIEW
2.1 Introduction
In this Chapter an in depth review of literature has been made on the importance of
cassava roots in the economy of Ghana in relation to the contribution to Agricultural
Gross Domestic Product (AGDP) and the production of the crop over the years. The
Chapter also discusses the evolution of the crop in Ghana and the development of
improved varieties of the crop in the country. A further searchlight is thrown on
government policy on agriculture and how these policies have influenced developments
in the cassava sub-sector o f the Ghanaian economy. The concluding part o f this Chapter
looks at post harvest issues in the cassava sub-sector of the economy, the industrial
potential of cassava roots and a review on value added analysis and the Coefficient of
Concordance Analysis (W)
2.2 Importance of Cassava in Ghana
The importance of cassava is measured in terms of cropped area, total production, and
contribution to Agricultural Gross-Domestic Product (AGDP) and food expenditure
shares of citizens (Alderman and Higgens, 1992). The area planted to cassava, which was
about 387,000 ha in 1986 increased to 590,000 ha in 1996. Over the same period, cassava
production also increased from about 2.9 million mt to 7.11 million mt. Again from 1997
to 2003, cassava production rose from 6.9 million mt to 10.2 million mt. Cassava is by
far the largest agricultural commodity produced in Ghana by weight, and represents 22
per cent of AGDP compared to 5 percent contribution from maize, 2 percent for rice,
9
University of Ghana http://ugspace.ug.edu.gh

sorghum and millet, 14 percent for cocoa, 11 percent for forestry, 7 percent for fisheries
and livestock (Al-Hassan, 1989).
The number of households engaged in cassava production also measures its importance.
According to the 1987 / 88 Ghana Living Standard Survey (GLSS) 1.73 million sampled
household (83%) were engaged in cassava production. By 1988 / 89, the GLSS recorded a
one percent decline in the number of sampled household engaged in cassava production.
The presentation of data from the 1991 / 92 GLSS 3 survey differs slightly from the
earlier survey so it is not possible to track the trend in numbers o f households engaged in
the production of cassava. (Ofori et al, 1997). The GLSS survey according to (Ofori et al,
1997) appears to be recording a decline percentage, albeit small, of households growing
cassava.
Nevertheless, according to the GLSS 3 report, cassava is grown extensively in all the
ecological zones in Ghana. Earlier data sources however indicated negligible cassava
production in the two Upper Regions (Al-Hassan, 1989). The apparent negligible spread
of cassava into the Upper Regions, especially Upper West, is the reflection o f the growing
trend in cassava production through area expansion (Ofori et al, 1997). The Medium
Term Agricultural Development Programme reports o f a rapid spread of cassava in the
Guinea Savannah Zones since the famine of 1983 (MOFA. 1990).
In addition, survey data on farmers’ perception of trends in cassava production in their
villages presented in Prudencio and Al-Hassan work (1994) shows a growing trend in
cassava in 93 percent o f the 30 villages in the survey. The common reason given for
increasing production according to Ofori et al (1997) is population growth. This suggests
10
University of Ghana http://ugspace.ug.edu.gh

that farmers are using cassava to improve long-term food security as well as hedge
against intermittent food shortages.
2.3 Evolution of Cassava Production in Ghana
Cassava (Manihot esculenta Crantz) was introduced from Brazil, its country o f origin, to
the tropical areas of Africa, the Far East and the Caribbean Islands and specifically to the
Gold Coast now Ghana by the Portuguese between the 16th and 17th centuries (Jones,
1959). The Portuguese grew the crop around their trading ports, forts, and castles and it
was a “principal” food eaten by both the Portuguese and slaves. By the second half o f the
18th century, cassava had become the most widely grown and used crop of the people of
the coastal plain (Adams, 1957). According to Ofori et al (1997) the Akan name for
cassava “Bankye”could most probably be a contraction of “Aban kye”(Gift from the
castle).
The spread of cassava from the coast into the hinterland was very slow. It reached
Ashanti (and Brong Ahafo) and northern Ghana, mainly Tamale in 1930 (Ofori et al,
1997). Until the early 1980’s the Akans of the forest belt preferred plantain and cocoyam,
and sorghum and millet were preferred in the north. Cassava became firmly established in
most areas after the serious drought of 1982 / 83 when all other crops failed completely
(Krong-Amoaku, Cudjoe and Adams, 1987). Cassava and its various preparations
including/w/i/, gari and kokonte are now very popular foods through out Ghana.
2.4 Development of Improved Varieties
Between 1928 and 1962, the Department of Agriculture was responsible for cassava
research and extension in Ghana. Since 1962, research institutions under the CSIR and
11
University of Ghana http://ugspace.ug.edu.gh

the Universities have been responsible for cassava research. In contrast to the
unconscious selection by “farmers,” systematic breeding and selection, which started in
1930, have been carried out mainly to improve pest and disease resistance and yields of
the local varieties (Ofori et al, 1997)
The Cassava Mosiac Virus Disease (CMVD) was first observed around 1930 and was
considered serious enough to merit attention, as all existing local varieties were severely
affected. This first government intervention involved the introduction o f varieties from
other West Africa countries, East Africa, the Caribbean and the Far East. Several crosses
were carried out between the local and the improved varieties. Four outstanding varieties
namely Queen, Gari, Williams, and Ankra, were released in 1935. These were high
yielding (7-10t/h) o f good taste, highly resistant to CMVD, and were grown widely
through the country. However, by the late 1950s either due to increased virulence of the
virus, a breakdown in varietal resistance or purity, all the newly released varieties except
Ankra become highly susceptible, necessitating a second breeding intervention for
CMVD resistance (Ofori et al, 1997).
The second intervention involved crosses between the local varieties and four other
species closely related to M. esculenta, since it has been shown that no resistance could
be found in any M.esculenta variety. Work with the interspecific crosses went on through
out the mid 1950s to the mid 1960, out of which four selections K357, K162, K680, and
K491 were released to farmers. The best, K680 yielded around 19t/h, had moderate
resistance to CMVD with good payability and cooking quality. These varieties were
cultivated and maintained their good characteristics until the late 1970s and the beginning
of the late 1980s when a third intervention had to be sought to obtain varieties resistant to
12
University of Ghana http://ugspace.ug.edu.gh

two new pest (cassava mealy bug and cassava green spider mites) and new disease,
Cassava Bacterial Blight (CBB) in addition to CMVD (Ofori et al, 1997)
In 1984, an FAO-financed programme to release available beneficial agents from the
International Institute of Tropical Agriculture (IITA), through a biological control
programme (BCP), was initiated. The programme focused on control o f the cassava
mealy bug and green spider mite through introduction of a parasitiod wasp (Epidinocarsis
lopezi) and predatory insects (Diomns sp. and two Hyperdspis spp). In March 1985, a
second batch of the natural enemies with one more predatory lacewing insect
(Sympherobius sp) and predatory insects mites (Neoseiulus idaeus and N. anonymns)
were introduced. Due to the effect of the BCP, three improved varieties of cassava (TMS
50395, TMS 4(2) 1425) and TMS 30572) have been released in Ghana that are largely
tolerant to these pest and disease. The National Root and Tuber Crop Improvement
Project (NRTCIP) released three high yielding, pest and disease resistance in 1996. These
varieties namely Afisiafi, Gblemo Duade, and Abata Fitaa yield in excess o f 200 percent
per hectare of local varieties (Ofori et al, 1997).
2.4.1 The National Root and Tuber Improvement Project (NRTCIP)
The increasing importance of root crops, cassava in particular, in the economy of Ghana
led government to enter into bilateral agreement with International Fund for Agricultural
Development (IFAD) leading to the implementation of the Ghana Smallholder
Rehabilitation and Development Programme (SRDP). The SRDP was to ensure food
security by providing the needed inputs, resuscitating essential infrastructure and
strengthening institutional capacity for research and delivery of essential production
13
University of Ghana http://ugspace.ug.edu.gh
services. The NRTCIP, which took off in 1988, was a component of SRDP (Ofori et al,
1997).
2.5 Government Policies on the Agricultural Sector
2.5.1 Immediate Post Independence Period
The development strategy adopted by Ghana after independence in 1957 was o f rapid
industrialization with strong bias for import substitution. The rapid industrialisation
policy aimed to shift employment away from agriculture. This was to be achieved by
raising the productivity o f farming to such levels that large number o f farmers could be
released to work in other occupation (GoG, 1964). As the productivity o f those who
remained in agriculture increased, their earning would also increase leading to further
growth of the industrial sector through consumption linkages. Within this strategy,
government was to maintain a high level of participation to support its socialist policies
with respect to distribution and utilisation of national income.
The policy of the agricultural sector was to concentrate on a limited number of
commodities, and to supply to them all available agricultural knowledge and technology.
The development o f research manpower was to be specific to the development o f these
commodities. The selected commodities were cereals and fish to fill the nutritional
requirement, cocoa to improve the balance of payment situation, and rice and sugar for
domestic consumption and export. Clearly the strategy at that time had no role for cassava
as a crop; neither did the crop benefit from the general interventions in relevant farming
systems because of lack o f support to the farming sector.
14
University of Ghana http://ugspace.ug.edu.gh

2.5.2 Five-Year Development Plan (1975/76 -79/80)
By the mid 1970s there was concern over the “openness of the economy” because of a
high marginal propensity to import as expressed in the 5-year Development Plan (GoG,
1977). Other issues of concern in the 5-year Development Plan were the high rates of
unemployment and inflation. The thrust o f policy at the time was the management o f the
balance of payments. The strategy was to cut back imports o f raw materials and capital
inputs (GoG, 1977). This resulted in the birth of the “Operation Feed Yourself “ and
operation Feed Your Industries” programmes).
This is probably the first official expression of recognition of a role o f cassava in
Ghanaian economy (Ofori et al, 1997) Unfortunately, the plans did not materialise
because of the economic crisis of the late 1970s and political instability.
2.5.3 The Economic Recovery Programme and Structural Adjustment Programme
More recent changes in Ghana’s economy and agricultural polices have favoured the
development of the cassava sub-sector. The Economic Recovery Programme (ERP)
followed by the Structural Adjustment Programme (SAP) that were initiated in 1983 and
1986, respectively introduced macroeconomics policies to favour trade and private
enterprise. A flexible exchange rate system, and trade liberalization are the major
macroeconomic policies that have affected the development o f the cassava sub-sector.
The advantage of the trade and exchange rates reforms for cassava have been the entry of
Ghana into the cassava chips export markets, particularly to the European Union. Ghana’s
export of chips export increased from less than 3,000 mt in 1994 to about 20,000 mt in
1996. Unfortunately this export potential could not be sustained. This was consequently
due to poor institutional framework and uncompetitive prices offered to the farmers.
15
University of Ghana http://ugspace.ug.edu.gh

Ghana’s inability to meet its quotas led to an eventual collapse of the trade (pers.com.
Nanam Dziedzoave). Until her entry into the cassava chips market, formal trade in
cassava was only gari to Europe and North America. The average recorded trade volume
was 50 metric tonnes over the period 1985 to 1988 (Al Hassan, 1989). However there has
been unrecorded informal cross-border trade of cassava between Ghana and her
neighbours. A study of the effect of the CFA devaluation on cassava in Ghana shows that
the flexibility exchange policy of Ghana limited the competitiveness o f cassava product
from Togo even with the CFA devaluation thereby resulting in increased export o f gari
and cassava dough by traders (Al-Hassan et al, 1996).
2.6 Post Harvest Issues
Cassava (Manihot esculenta Crantz) is grown throughout the humid tropics from Latin
America to Africa and Asia, principally for its large starch storage root. The root provides
the staple for over 500 million people and in 1991, world production was 162 million
tonnes; it is of particular importance to populations in sub-Saharan African (Wenham,
1995)
Within 48 hours of harvesting, the roots of cassava suffer an abiotic stress-response
known as post-harvest physiological deterioration (PPD) (Beeching et al, 1998). This
response renders the root unpalatable and unmarketable. With increasing distance
between farmers and markets due to urbanization, PPD has become a major constraint to
the development of cassava root for farmers, processors and consumers. To reduce the
effect of PPD, mechanized cassava processing is now a fairly well established activity
and there are several cassava processing plants in the country.
16
University of Ghana http://ugspace.ug.edu.gh

Despite the steady increase in the rate of adoption of cassava processing technology, there
are factors that mitigate the adoption of the technology. According to Ofori et al, (1997),
mechanised cassava processing is often not viable a venture, because the products have to
compete with traditional products, which are under priced, because traditional processors
rely on family labour, which is not perceived as cost.
Cassava processors have usually, either little capital or no access to capital to enable them
afford cassava-processing equipment. Most operators in traditional and small-scale
cassava processing plants also have limited managerial capabilities and training due to
little formal education, and these mitigate the successful management o f a cassava
enterprise.
2.6.1 Status of Cassava Research
The major thrust o f research on cassava by the FRI, has been in the area o f post harvest
management including storage, processing, and utilisation. Studies conducted on storage
of fresh cassava roots at the institute aim at improving the traditional methods o f cassava
processing (Ankra et al, 1980; Ankra 1980; Ankra and Osei-Yaw, 1981; Ankra, 1984).
Most of the post harvest research efforts in cassava processing in the past have been in the
development of dry cassava products to replace fresh roots in the preparation o f fiifu and
akple. However this research did not catch up well with Ghanaians because o f the cost of
the new product and the delicacy associated with the traditional methods of preparing
these Ghanaian dishes. In more recent times, in collaboration with the NRI (UK) the FRI
with sponsorship from DFID, researched into promoting cassava as an industrial
17
University of Ghana http://ugspace.ug.edu.gh
commodity. Considerable work has been done in promoting HQCF for use in the
bakeries, the timber industry and lately in the confectionary industry.
2.7 Processing
Processing cassava into various shelf-stable and semi-stable products are widespread
activities carried out by traditional cassava processors and small-scale commercial
processing unit. The traditional methods for processing cassava involve combinations of
different stage processes including peeling, grating, dewatering, sifting, and fermentation,
milling and roasting. The major products are agbelima, gari, and kokonte. During the
processing, the cassava tuber is transformed from a highly perishable root crop into a
convenient, easily marketable, shelf-stable product, which meets consumer demand for a
staple food. Processing may improve palatability of the product and also reduces the level
of cyanogenic glucosside in the tuber thereby detoxifying the product. Products fermented
by some species of lactic acid bacteria such as agbelima and gari may attain anti
microbial properties
Several problems are encountered during traditional processing which have created an
urgent need for mechanization and upgrading o f processing. Operations are often
uneconomical because the products are not properly costed. For instance there is heavy
reliance on family labour, which is not perceived as cost. Even though this assertion may
be true there are no empirical evidence to attest to this claim. Operations are carried out
on very small scale and the areas of manufacture may be unorganised and scattered. The
processing procedures are labour intensive and time consuming and mostly carried out
manually. Operations are not adequately mechanised because processors cannot afford
equipment and do not have access to capital. Processing is often carried out under
18
University of Ghana http://ugspace.ug.edu.gh
unhygienic conditions and some unsanitary practices for example improper effluent
disposal during the watering o f mash cassava, have adverse effect on the environment.
2.8 Interventions for Processing
The major intervention in cassava processing was the introduction of a medium scale
motorised cassava grater by the Agricultural Engineers Ltd in 1966. The cassava grater
presented a great innovation in cassava since grating is central to traditional processing o f
cassava in Ghana. Since then, several equipment manufacturers, including engineering
firms, research institutions; University departments, small-scale artisanal shops,
blacksmith and mechanics, developed and produced various types o f cassava processing
equipment. Cassava processing machinery manufactured locally are drums graters,
horizontal disc graters, cassava chipper, screw press, hydraulic press, cassava dough
disintegrators, sieving machines, grading machines, plates mills hammer mills and
mechanical dryers.
Over the past three decades there have been a gradual but steady increase in the adoption
of cassava processing equipment in the industry. The adoption of mechanised cassava
processing appears to have escalated in recent years through the assistance of Non-
Governmental Organisation to various localities. Even though the introduction of
processing equipment has to a large extent removed the tedium and drudgery associated
with the processing of traditional based cassava products, the economic return o f the use
of processing equipment to the processor has not been investigated.
2.9 Profitability of Cassava Based Products
Al-Hassan and Egyir (2002) carried out a study where returns on investment were used as
an indicator o f the relative incentive to processing a cassava based product. The cassava
19
University of Ghana http://ugspace.ug.edu.gh

based-products used in the study were, chips, kokonte and gari. The budgets for cassava
production and processing o f gari, kokonte and chips were estimated under two scenarios.
Scenario (i) was farmers’ process cassava with hired labour and (ii) farmers’ process their
own cassava with family labour.
In the first scenario, net earnings from cassava processing were estimated at 31,000 Cedis
for chips (per mt) giving approximately 60 percent return on investment. Kokonte had
40,000 Cedis (per mt) giving 23 percent and 122,000 Cedis (per mt) for gari giving 32
percent. In the second scenario, the returns on investment were uniformly higher than the
returns using hired labour for all the products. Net earnings from cassava processing were
estimated at 59,000 Cedis (per mt) for chips giving approximately 240 percent return on
investment. Kokonte had 55,000 Cedis (per mt) giving 100 percent and 268, 233 Cedis
(per mt) for gari giving 115 percent.
2.10 Cassava Based Products with Export Potential
Cassava Chips
Following the pioneering activity, by a private company in developing an export led
industry in cassava chips in 1993, there has been improvement in the contribution of
cassava to employment generation, additional income and the livelihood o f participating
rural producers. This was followed by a tremendous interest and response to the new
industry. Other private individuals showed interest and became more active in the
marketing of cassava chips and worked to access the export market and explored the
utilization of cassava chips in livestock feed and industrial alcohol production.
20
University of Ghana http://ugspace.ug.edu.gh
Cassava Starch
The local market for starch is about 5,000 mt per annum (Ofori et al 1997). In the context
o f annual cassava production of about 7 million metric tonne, the industrial starch market
offers relatively little potential to expand the market for cassava (Day et al 1996).
Although the starch market in Ghana is very small, major opportunities for cassava starch
lie in sub-regional and regional export.
In South Africa the annual consumption of cassava starch is about 300,000 mt per annum
with an annual growth rate of 12,000 metric tonnes. A keen interest is currently being
shown by investors from South Africa to invest in starch production in Ghana. A local
company, GLUCOSET, which plans to produce high quality starch for both domestic and
export market, is not sufficiently large to attract potential investment. It is estimated that,
the Ayensu Starch Factory will export 380,000 ton o f starch in the next four years. Total
earning expected is US$95 million. It is worthy to note that even at this level of
production, only 6.7 per cent o f total cassava production in Ghana would have been
processed into starch. The potential for further processing o f cassava into other cassava-
based products with industrial potential is therefore high.
The market potential for starch within Ghana comprises a number o f end users who make
use of maize, cassava, and potato starch which is mostly imported, (Day et al 1996). A
survey carried out by NRI/ UoG indicated that the current market size is approximately
4,200 tonnes per annum, which compares well with figures in a survey carried out by
Glucoset Limited of Ghana. (Anon, 1994).
21
University of Ghana http://ugspace.ug.edu.gh

2.11 Use of HQCF in Bakery Products and Industrial Uses
There is market potential for HQCF as a partial or total replacement for wheat flour in
food and for the manufacturing of plywood and paperboard industry (Day et al 1996).
HQCF could replace wheat flour in plywood production as glue extenders, and possibly
in paperboard production.
The largest market potential for HQCF in the medium to long term in Ghana lies in food
application (Day et al 1996). HQCF could potentially substitute for the large amount of
wheat flour currently used in bread, snacks, and other food items. The market o f wheat
flour imported into the country is estimated at between 250,000 to 300,000 mt per annum.
The possibility o f replacing up to 20 percent imported wheat flour with cassava flour
imply an annual demand of 60,000 mt or 14 times current demand.
A marketing survey conducted at an Industry and Technology Fair dubbed INDUCTECT
’97 held in Accra from 28th February to 10th March 1997 clearly showed that composite
flour inclusive of 20 percent HQCF was widely accepted by the public as comparable to
100 percent wheat flour. Glucose syrup, which is derived from further processing of
HQCF, has a potential in the confectionary and pharmaceutical industry in Ghana; but the
high quality specifications demanded by the end users, is making the market potential for
glucose syrup (from HQCF) uncompetitive. (Pers.comm Nanam T.Dziedzoave.) Again
some local processors in Kokofu (a village in the Atebubu district) were trained to further
process HQCF to glucose syrup for some confectionary industry in Accra. However, the
high price of fresh cassava at Kokofu made the end product, glucose syrup expensive
relative to the imported price. As a result the local processors resorted to buying cassava
starch from the Ayensu Starch Factory for processing the glucose syrup. It is more
22
University of Ghana http://ugspace.ug.edu.gh

economical to use the cassava starch from Ayensu due to the relatively lower price at the
factory.
There is inadequate data on the size of the non-bread wheat flour market in Ghana (Day et
al 1996). Factors likely to contribute to the market expansion with the possibilities for
inclusion of HQCF are urbanization, population growth and rising incomes (Ofori et al
1997). On the evidence o f public response to snacks made from cassava composite flour
presented at the INDUCTECH ’97 Fair, the prospects look good. Research on the
adoption process has demonstrated clearly the extensive delays, which occur between the
time people, first hear or see a favourable innovation and the time they take to adopt
them. The time o f adoption is further worsened in the absence of the required institutions
to seek further information about the innovation, weigh up the advantage and
disadvantage of using it and the required market linkages. It is doubtful if any
institutional arrangement was put in place after the INDUCTECH ’97 Fair.
The use of HQCF in the Bakery Industry.
Besides the traditional use of HQCF, various investigations have been carried out on the
use of HQCF for bread and biscuit manufacture. Cookies and bread are popular
convenience foods. The rising cost of wheat flour is a constraint in the baking industry.
To reduce the cost of bread and other bakery products, flour from roots and other tuber
crops present an alternative. (Defloor et al 1994, 1995) have shown that the bread making
potential o f HQCF was much more dependent on the age of the cassava at harvest time,
the season of planting and the time of harvesting, than on the effects of genotype.
23
University of Ghana http://ugspace.ug.edu.gh

Use of HQCF in the Plywood Industry
In the plywood industry, imported food grade wheat flour is used as an extender for
expensive formaldehyde resin-based adhesive. Industrial trails of HQCF as an extender
for plywood glue were carried out by NRI, FRI and Forest Research Institute o f Ghana in
collaboration with two commercial timber-processing companies in Kumasi. Cassava
flour (prepared from peeled roots) at a substituting 50 percent o f wheat flour has the
potential to reduce plywood production cost by 35 per cent. Industry representatives have
expressed the desire to purchase HQCF but stressed the need o f quality, reliability and
price competitiveness and the development of sustainable market.
Use of HQCF in the Paper Industry
Adhesives for paperboard manufacturing have traditionally been prepared from
cornstarch or corn dextrin and other cornstarch derivatives. This choice has principally
been based on availability, but the higher viscosity of the cooked cornstarch tended to
make it more favoured than cassava starch. However the low gelatinisation o f cassava
starch and flour enhances their potential as substitute for cornstarch, but it will be
necessary to increase the viscosity to appreciably higher levels. Sodium hydroxide and
borax are normally used to modify the pasting temperatures and viscosity respectively of
starch used in the manufacture of paperboard adhesives.
Research conducted by NRI and FRI indicated that HQCF could completely replace
imported starches in the formulation of non-waterproof paperboard adhesives, with
potential cost saving o f up to 60 per cent.
24
University of Ghana http://ugspace.ug.edu.gh
2.12 The Conversion of Cassava roots into Kokonte
Kokonte is a partially fermented and dried cassava product. The production stages,
include the following, harvesting of cassava, peeling the tubers, drying pounding of
tubers / slicing, milling and bagging. The peeled tubers are not normally washed either
because of the non-availability of water in the farms where the processing is normally
done, or it is not considered necessary since the peeling is so carefully done as to keep the
peel tubers sufficiently clean.
Pounding of the fresh cassava is preferred to slicing since it is faster and it helps the
drying to proceed faster. However, some people do slice the tubers after peeling and
before drying. Two types o f kokonte are produced at the village level. These are sun-dried
kokonte and fire-dried kokonte. As the names suggest the differences arise from the mode
of drying. Spreading the pounded or sliced tubers in the sun for a period o f between 3-4
days normally does the drying. The dried chips are whiter, and contain free starch that is
desirable. Sun-dried chips are normally sliced or pounded and therefore comprise smaller
pieces which dry faster.
Spreading whole tubers on platform over smouldering fire on the farm to dry produces
fire-dried kokonte. The tubers are covered at night and fired every 4-5 days. Due to the
size of tubers it takes a longer time to dry and because of the heat, the starch is partially
gelatinised and does not produce sticky enough dough when cooked. The final product is
dark in colour. Even though it is less preferred, its production continues because o f the
advantage of being able to work on it on the farm, whilst doing other work, and bringing
home a less bulky final product.
25
University of Ghana http://ugspace.ug.edu.gh

2.13 Conversion of Cassava roots into Gari
Gari is a fermented product, unlike kokonte; it is partially gelatinised, and is very popular
in Ghana (Al-Hassan, 1992) and in other African countries like Nigeria and Sierra Leone
(Blanshard, 1994). The production of gari involves the following steps, harvesting of the
cassava tubers, peeling o f the tubers, washing of the tuber, grating o f the cassava tubers,
draining o f grated mash, disintegration, sifting, roasting, sieving and packaging.
The washed tubers are grated manually in Watro, since there are no cassava graters in the
community. The grated mash is loaded into baskets and left for 12hrs to drain. This
draining step is designed to facilitate the next processing; dewatering. Dewatering is
achieved by loading the drained mash into polypropylene sacks and placing very heavy
stones on the sacks to press out the water or using the manual press to squeeze out the
water.
The dewatered mash is disintegrated and sifted in one operation using the bamboo cane
sieve after which it is roasted on the traditional roasting pan. It is allowed to cool and
sifted again on the bamboo cane sieve packed and stored.
2.14 Conversion of Cassava roots into HQCF
The primary processing technique of converting fresh cassava roots into flour basically
involve peeling and washing of fresh roots, and chipping, or grating of the peeled roots.
The grated roots may either be pressed before drying or dried straight away, after which
they are ground or milled and sieved to obtain fine flour. The chips may also be washed
before drying or dried without further washing, after which they are milled and sieved to
give fine flour (Orias and Calub, 1986). Depending on the procedure adopted different
flour recovery rate may be obtained
26
University of Ghana http://ugspace.ug.edu.gh
According to Orias and Calub (1986) production of flour from chips is a more favoured
technique in terms of production rate, flour recovery and processing cost, compared with
the grates. Grating roots prior to drying results in considerable loss of free starch, higher
labour cost, and a slower flour production process. Investigation has shown that using a
pedal operated hammer mill, flour recovery from the chips is about 25-29 per cent at a
production rate of 4.41-4.85 kg/hr.
Drying of cassava chips to a moisture level o f 10-12 percent w.b was found to be ideal for
easy grinding and longer shelf life of flour and chips (Weber et al, 1978). Emilia et al
(1983) found that parboiling of cassava prior to drying marginally changed the pasting
characteristics by reducing the pasting temperature and hot paste viscosity and by slightly
increasing the paste stability. Parboiling and subsequent open pan roasting of cassava
flour were therefore found to be the most effective method for upgrading the cooking
characteristics of cassava flour.
2.14.1 Production of HQCF in Watro
The production HQFC was introduced to the community (Watro) through an IFAD-
funded project implemented through collaboration between the International Institute of
Tropical Agriculture (IITA), Ibadan and the Food Research Institute (FRI) o f Ghana, in
Feb; 1999. The project was aimed at promoting HQCF, for bread and other pastiy
products. The production process for HQCF is, harvesting of cassava tubers, peeling of
the tubers, washing of the tubers, grating of the washed tubers, dewatering of grated
mash, disintegration of mash, sifting of the disintegrated mash drying o f sifted mash,
milling and packaging.
27
University of Ghana http://ugspace.ug.edu.gh

It is similar to the production process for gari. However in the production o f high quality
cassava flour, the first eight units of processes must be completed within 12hrs.
Dewatering of the grated mash is done immediately after grating and is completed within
15-30 mins. Fermentation is not allowed to take place. The disintegration o f the
dewatered mash is carried out to facilitate drying within a maximum period o f seven (7)
hours.
It is done together with sifting as a single operation using the traditional bamboo cane
sieve. Sifting o f the mash prior to drying helps to remove as much of the fibre as possible
from the mash so that it is no longer necessary to sieve after milling. Drying is normally
targeted to start between 9.30 a.m. and 10.00 a.m. and to end about 4.30 p.m. or any time
before the sun goes down. Drying is carried out on black polypropylene sheets on raised
platform. The dried material is stored in polyethylene-lined polypropylene sacks until
sufficient quantities have been produced. The milling is done using the hammer mill.
2.15 Value Added Analysis
The value added is the market price of the commodity less the cost o f raw materials and
services purchased from other firms. (Gittenger, 1982). This definition is consistent with
that of Baumol and Blinder (1970) in whose work it was revealed that, the value added is
the revenue from selling a product minus the amount paid for goods and services
purchased from other firms. The value added includes payment of taxes, interest, rent,
profit, reserves for depreciation and compensation to management and other employees.
The value added is the returns to the processors from the use of the capital, labour, and
management and it is an appropriate economic measure in comparing enterprises by size
(Baumol and Blinder, 1991). In a wider sense the value added shows the economic impact
28
University of Ghana http://ugspace.ug.edu.gh
of resources used in production in the form of returns to these resources. The value added
measures the share of output that remains in the export and processing sector to reward
those who contributed labour, capital and managerial skills, (Gittenger, 1982).
Whilst details o f estimation differ moderately in size or amount, the value added can be
recognised as the residual after the deduction inputs during the production process.
In this study the three cassava based products i.e. gari, kokonte, and HQCF are produced
locally and used locally, local market price was used to evaluate all tangible activities
identified in the processing of fresh cassava roots to the three selected cassava based
products.
2.16 Coefficient of Concordance Analysis (W)
The Kendall’s Coefficient of Concordance Analysis (W) is the measure o f the degree of
agreement among “m” sets of “n” ranks. “W” is an index that measures the ratio o f the
observed variance of the sum of ranks to the maximum possible variance of sum o f ranks.
The idea behind this index is to find the sum o f the ranks for each thing being ranked and
then to examine the variability of this sum if the ranking are in perfect agreement, the
viability among these sums will be a maximum (Mattson, 1986).
This analysis is a statistical procedure to identify and rank a given set o f constraints /
problems in the most pressing one up to the least pressing using numerals; l,2 ,3,4...n in
that order. Computing the total rank score for each problem, the problem with the least
score is ranked as the most pressing whilst the one with the highest score is ranked as the
least the pressing problem. The total rank score computed is then used to calculate the
Coefficient o f Concordance (W) to measure the degree of agreement in the rankings.
29
University of Ghana http://ugspace.ug.edu.gh
The limits for “W” cannot exceed 1.00 and cannot be negative. That is it can only be
positive in sign and ranges from 0 to 1. It will be 1.00 when the ranks assigned by each
judge (farmers) are the same as those assigned by other judges (farmers) and will be 0.00
when there is a maximum disagreement among the judges (farmer).
2.17 Conclusion
Cassava roots have contributed significantly to the economy o f the country as regards its
share o f Agricultural Gross Domestic Product. (AGDP) and the production o f the crop
over the years. Since its introduction by the Portuguese during the 16th and 17th century,
cassava roots have had a rather chequered historical development in terms of government
policy. It took the country nearly twenty years after independence to recognise the role of
cassava roots in the economy of this country. It can be argued that the country has not
fully tapped the potential o f cassava roots. Besides the widely used traditional cassava
based products namely gari, kokonte and cassava dough, the country has not made any
significant strides in the use of cassava based export potential products like, cassava chips
and cassava starch. In the case of cassava based industrial products like, HQCF, glucose
syrup, industrial alcohol (from cassava roots) and glues for the plywood most o f the work
done are still at the research level and on pilot basis. With the enormous industrial
potential of cassava roots, it is now time for policy makers to initiate realistic, pragmatic
and demand driven programmes for the country to tap the full potential o f cassava roots.
30
University of Ghana http://ugspace.ug.edu.gh

CHAPTER THREE
METHODOLOGY
3.1 Introduction
The chapter presents, information on the area of study, the choice o f farmers and bakers
for the study. The theoretical framework for the main object, the analytical techniques
employed to address the solutions to the research problem that have been raised. The
research hypotheses amenable to statistical test have been provided; description o f the
classificatory variables identified and the sources of data for the study.
3.2 The Study Area
3.2.1 Atebubu
The study was conducted in the Watro and Atebubu communities all situated in the
Atebubu District. Sixteen small-scale bakers were involved in the study. All the bakers
reside in the Atebubu town. Three other groups, a gari processing group made up of eight
farmers, a kokonte processing group made up of ten farmers and twelve farmers, who
produce HQCF were also involved in the study. All the three groups (gari, kokonte, and
HQCF) reside in Watro. The HQCF processors in Watro benefited from the training
under the Department for International Development (DFID). According to the project,
the farmers were selected based on their willingness to participate in the project, interest
and the hectares of land under cassava cultivation. Watro was selected on the basis of
attested levels of cassava production and again having previous experience as a pilot
village in the testing of a technology (Yam mini-set technology)
The Atebubu is situated in the northern part of the Brong-Ahafo Region. The total area of
Atebubu is equivalent to 15.54% of the Brong-Ahafo Region. The vegetation is
31
University of Ghana http://ugspace.ug.edu.gh

predominantly wooded guinea savannah. Soils are inherently low in fertility. Population
density is comparatively low. Shifting cultivation is practiced with relatively longer (2-3
years) fallow periods as a major land use pattern.
Atebubu is an old commercial town. It harbours the district administrative capital. The
town has pipe bom water, electricity and telecommunication facilities. These facilities
have greatly enhanced commercial activities in the area. Recently constructed in the area
(Atebubu) is a modem market complex through the Ghana, German government co
operation.
Bread baking is one o f the major commercial activity in the area. The bakery products
range from bread, cakes, meat pie, doughnut, sweet bud and other cookies. Through a
collaborative effort, the Food Research Institute (FRI), the National Board for Small
Scale Industries, Ministry o f Food and Agriculture and the Natural Research Institute
(UK) trained some selected bakers in the area to use HQCF, wholly or in various
proportions to prepare popular bakery products based on tested recipes by food scientist
and professional bakers.
3.2.2 Watro
Watro is located about 14 .6 km to the east of Atebubu. The total area is about (600 x 250
Sqm), with an estimated population of about 900 persons. This number is made up of
about 170 children, 500 women and 230 men. It has 62 households. In Watro, the total
land under cassava cultivation about 6,000 hectares. Each farmer in the community
cultivates on the average between 5-9 hectares of cassava. Yields are however very low,
the average yield per hectare being about 2.5 tons per hectare. This implies a total
production level of 30,000 tons, which is equivalent to about 30 percent o f the district
32
University of Ghana http://ugspace.ug.edu.gh

output. The different varieties o f cassava planted in the village in order o f preference are,
Togo, Akosua Tuntum, Katawire and Ampenkyene, which are all local varieties. Gblemo
Duade is least preferred because of its high moisture content.
The production o f HQCF was introduced to the community through an IFAD- funded
project implemented in collaboration with the Institute of Tropical Agriculture (IITA),
Ibadan and the Food Research Institute (FRI) of Ghana, in 1999. The project was aimed
at promoting the utilisation o f HQCF for bread and other pastry products. Farmers in
Watro produced HQCF for sale to bakers at Atebubu, who have been trained in the
utilisation of HQCF for various bakery products.
3.3 Data Requirement
Data was collected on one cycle of production of a cassava-based product using a
structured questionnaire. Information was gathered on resource requirement for the
production of HQCF based bakery products, and wheat flour based bakery products. Data
collected include quantity, price of all ingredients used in one batch and price of the final
products using a structured questionnaire. Secondary data was collected from the Atebubu
District Directorate of Agriculture on the monthly production o f HQCF from 2000- 2003.
3.4 Method of Analysis
Theoretical Framework
The central concept that constitutes the framework of this study is the measure of
profitability. Profit is defined as revenue minus cost. Suppose that the firm produces “n”
outputs (y\ . ) and uses m inputs {x\ xm). Let the price of the output goods be (p\
.p „) and the price of the inputs be {w\.. ,wm).
The profit the firm receives, n can be expressed as :
33
University of Ghana http://ugspace.ug.edu.gh

n = E ^ - E V r - : .................................................................................. (3J)> i
The first term is the revenue and the second term is the cost.
Computation of Value Added
Components that were involved in the computation o f the value added in this study
included, the price o f the raw material (fresh cassava roots at the farm gate price) and the
price of the final product of the cassava based product. One cycle of production was used
as common denominator for the computation of the three selected cassava-based
products.
For HQCF, the first eight steps in the process must be completed in 12 hours. The study
considered the quantity of fresh cassava roots that were processed through the first eight
processes and quantity of the final product generated in one cycle o f production.
Appendix I presents the flow chart of HQCF production. To achieve an ideal product in
the production of gari the process should be completed in twenty-four hours. Appendix II
presents the flow chart for gari processing. Appendix III presents the flow chart for
kokonte. The process takes between three to four days.
The following was used to compute the value added for the three selected cassava-based
products.
Value Added (VA) = Price of the final commodity less the cost of raw materials used to
produce a unit of the product.
VA = P c b p - P rmcbp ............................................................................................................ (3 .2 )
Where
P cbp = Price o f X kg of the cassava based product produced.
P r m c b p = Cost o f the raw material to produce X kg of a cassava based product
34
University of Ghana http://ugspace.ug.edu.gh

Estimation of Profit
All the small-scale bakers interviewed were engaged in other kinds o f commercial
activity, example petty trading and dressmaking, besides baking. Baking was not done on
a daily basis. However all the respondents did bake on market days. In Atebubu, the
market days are observed in a five-day cycle. Baking on a market day was used as the
common denominator for the bakers and thus constituted one cycle of production for the
bakers.
The following were used to compute the five profit variables (Revenue, Operating profit,
Cost per unit product, Profit per unit product, and Return on investment)
(i) Revenue Estimation
TR = SQiPi .................................................................................................................(3.3)
Where,
TR = Total Revenue (Sale of bakery product)
Qi = Quantity sold of final product, (numbers)
Pi = Price per unit of final product i (cedis)
(ii) Operating Profit Estimation
OP = TR - TC ...................................................................................................................(3.4)
Where
OP = Operating profit
TR = Total revenue (Sales)
TC = Total cost. (Cedis)
(iii) Cost Per Unit Product Estimation
= Zj Wy X j / Qi
35
University of Ghana http://ugspace.ug.edu.gh
Where the numerator is total cost in cedis and the denominator is final output o f bakery
products (numbers).
(iv) Profit Per Unit Product Estimation
= OP IQ;
Where the numerator is operating profit in cedis and the denominator is final output o f
bakery products (numbers)
(v) Return On Investment (for every thousand cedis) Estimation
= [(OP) n W, Xi ]* 1000 (cedis)
A paired sample t- test, using the software SPSS, was used to compare the mean levels of
operating profit, cost per unit product, profit per unit product and the return on
investment, of the various HQCF composition bakery products with 100% wheat flour
bakery products. Five and ten percent significance levels were used.
Statement of the hypothesis
Ho: there is no significant difference between the means o f operating profit of 50%
HQCF product and 100% wheat flour product.
H : there is significant difference between the means o f operating profit of 50%
HQCF product and 100% wheat flour product.
The statement o f the hypothesis was repeated for the means o f cost per unit product,
profit per unit product and return on investment estimated for the various proportions of
HQCF bakery products and 100% wheat flour products.
HQCF production and growth rate
A bar chart of output levels was used to analyse the trend in production of HQCF in the
forty-eight months between 2000 and 2003
36
University of Ghana http://ugspace.ug.edu.gh
The following formula was used to calculate the monthly production growth rate of
HQCF.
Where
GR = Denotes growth in production of HQCF.
Ft = Quantity of HQCF produced in the current month
F t-i = Quantity o f HQCF produced in the previous month
Success Drivers
A bar chart was used to analyse the success drivers associated with the processing of
fresh cassava roots into high quality cassava flour.
The Kendal’s Coefficient o f Concordance (W) was used to analyse the ranking o f the
constraints affecting the production of HQCF.
The formula for the Coefficient of Concordance (W) is given by:
This is simplified to the computational formula for W as:
12T / nm2 (n2 -1 )
Where; T = sum o f ranks for each item being ranked,
M = number of ranking (farmers)
N = number of factors being ranked (constraints affecting the production HQCF)
The coefficient o f Concordance (W) is tested for significance in terms of the F
distribution. The F-ratio is given by: (m-1) Wc / (1-Wc), with ((n-1) - (2/m)), degree of
freedom for the numerator and (m-l)[(n-l)-(2/m)] degrees o f freedom for the
denominator (Allen Edwards, 1964) Wc is the calculated W.
GR = [(F T — F t-i)/ F T-i] 100 (3-5)
(3.6)
37
University of Ghana http://ugspace.ug.edu.gh

Statement of the hypothesis
H0: there is no agreement between the ranking of the constraints that influence the
production of HQCF in the Watro area.
Hi! there is agreement between the ranking of the constraints that influence the
production o f HQCF in the Watro area.
38
University of Ghana http://ugspace.ug.edu.gh

CHAPTER FOUR
RESULTS AND DISCUSSIONS
4.1 Introduction
This chapter presents the discussions of empirical results o f the study. The chapter seeks
to address the research questions that prompted this study.
4.2 Value Added Analysis
The value added analysis was done for the three cassava-based products namely HQCF,
gari and kokonte. There is a high seasonal variability in fresh cassava prices in the study
area. Therefore, the value added analysis took into account this seasonality by estimating
value added in the low price season and the high price season. Table 4.1 below presents
estimates o f value added and the components of value added.
Table 4.1 The Value Added Analysis (Lean Season)
CASSAVA PRODUCTS
Value added components HQCF GARI KOKONTE
Number of bags o f fresh Cassava roots
6 5 5
Price of a bag (35 kg) (Fresh cassava roots)
<2 20,000 c2 20,000 (2 20,000
Cost o f raw materials used in one cycle o f production
c2 120,000 <2 100,000 c2 100,000
Quantity o f output generated From a cycle of production
100 kg 30 bowls (one bowl is 2.5kg)
90 kg (one bag)
Price per unit of output <2 2,000 c2 2,500 <Z 60,000
Total Value of product (2 200,000 <Z 75,000 <2 60,000
Value Added (<x) (2 80,000 -<2 25,000 -(2 40,000
% Share of cassava roots in total cost of production
70.59 71.43 76.92
Source: Field Survey Data (2004)
39
University of Ghana http://ugspace.ug.edu.gh

Table 4.2 below gi ves an account of the value added analysis of the three cassava-based
products for the high price season.
Table 4.2 The Value Added Analysis of The Three Cassava-Based Products (High
Price Season)
CASSAVA PRODUCTS
Value added components HQCF GARI KOKONTE
Number of bags o f fresh Cassava roots
6 5 5
Price of a bag (35kg) Fresh cassava roots
<2 30,000 <t 30,000 <2 30,000
Cost of raw materials used in one cycle o f production
cx 180,000 <2 150,000 <Z 150,000
Quantity of output generated From a cycle of production
100 kg 30 bowls (one bowl is 2.5kg)
90 kg (one bag)
Price per unit product cz 2,000 c2 6,000 (2 100,000
Total Value o f product <2 200,000 <t 180,000 c2 100,000
Value Added (<z) <2 20,000 <2 30,000 -<2 50,000
% Share o f cassava roots in total cost o f production
78.26 78.95 83.33
Source: Field Survey Data (2004)
From tables 4.1 and 4.2 above only HQCF recorded positive values of value addition for
both the low price season and the high price season. Gari recorded a positive value of
value addition for the high price season and negative value for the low price season. For
kokonte, negative values were registered for both the low and high price seasons. Even
though value added estimates for HQCF were positive in both seasons, the high price
season estimate was 75% lower than the low season estimate. This is because output price
remained unchanged as cassava price increased by 20%.
The value added for gari rose from a negative value for the low price season to a positive
value, for the high price season. This was so because in the case of gari as the price of the
University of Ghana http://ugspace.ug.edu.gh

raw material went up by 50%, there was a corresponding hike in the price per unit
product by 140%. Kokonte registered negative values for both price seasons.
The price of the raw material for any commodity with industrial potential is very
important. If the price of the raw material accounts for the largest percentage share of the
total cost, it negates the value o f processing the raw material into another product.
The Ayensu Starch Factory is a case in point, where there was a disagreement between
the farmers and factory management, over the price o f cassava roots offered by the
factory management to the farmers. Whiles the factory was prepared to offer <z 150,000
for a tonne o f cassava, the farmers, based on the prevailing market price of the raw
material (cassava roots) demanded <£ 500,000 for a ton.
In a case study of cassava development in Ghana, Ofori et al (1997) sated that processing
o f cassava roots to various traditional products such as gari, kokonte etc are often
uneconomical. They further stated that in all these processing activities, there is a heavy
reliance on family labour, which is not perceived as cost.
The observations made in the area of study are that all the processing activities relied
heavily on family labour and the raw material (cassava root) came directly from their
farms. For most o f the processors, their immediate concern is to halt the deterioration of
the cassava roots. Value is therefore not put on the activities involved. Once the storage
life is secured, the economic value of the product becomes a concern to the farmer at the
time of sale of the commodity, when very little or nothing is gained.
41
University of Ghana http://ugspace.ug.edu.gh
4.3 Estimation of Profits of HQCF Bakery Products and Wheat Flour Bakery
Products
The study worked with sixteen small-scale bakers all based in the Atebubu area. The
number of HQCF bakery products by the small-scale bakers ranged from one to four,
with majority of the respondents (10) working with two bakery products. The HQCF
bakery products that were identified in the study area included, bread, bofrot, sweet bad,
cake, chips and meat pie.
Forty three percent o f respondents produced bofrot. The proportions of HQCF used for
bofrot was 30% and 50%, with majority (57%) of those producing bofrot using 50%
HQCF. About 43% o f the respondents traded in bread. The compositions o f HQCF used
were 12%, 22% and 6%. Again about 43% of the bakers traded in sweet bad the
composition o f HQCF used were 30%, 40% and 50%. Only 25% o f the respondents
baked cake with HQCF only. Twenty-nine percent o f the respondents baked chips and
they used flour with 30%, and 50% HQCF. Finally 12% of the respondents traded in
meat pie, and they all used flour with 50% HQCF composition.
The paired sample T-Test could not be done for operating profit for bofrot 30% HQCF
and for meat pie with 30% HQCF, because the standard error o f the difference was zero.
42
University of Ghana http://ugspace.ug.edu.gh

Table 4.3 Paired Samples T-test for Bofrot 50% HQCF and Bofrot 100% Wheat Flour
Variables 50%
HQCF
100% W.F t Significance
Operating profit (<z) 40,589.50 37,644.50 3.468 0.040**
Cost per unit product (ct) 291.56 311.99 -5.413 0.012**
Profit per unit product (<z) 208.42 187.99 5.411 0.012**
Return on investment (<z) 740.62 617.10 3.549 0.038**
Source: Field Survey Data (2004)NB *** 1% Significance level ** 5% Significance level * 10% Significance level
From Table 4.3 the production of bofrot with 50% HQCF yielded better financial returns
than it did for bofrot with 100% wheat flour. Comparing the mean operating profits of the
two products, bofrot with 50% HQCF made a 7.8 percent more gain. Similar results were
obtained for other variables that were considered. For example, for the mean cost per unit
product for bofrot with 50% HQCF, there was a 6.5 percent reduction when compared to
bofrot, with 100% wheat flour.
The aim o f every entrepreneur is to maximise profit and minimise cost. The use of HQCF
therefore satisfies the aspiration of the small-scale baker.
43
University of Ghana http://ugspace.ug.edu.gh
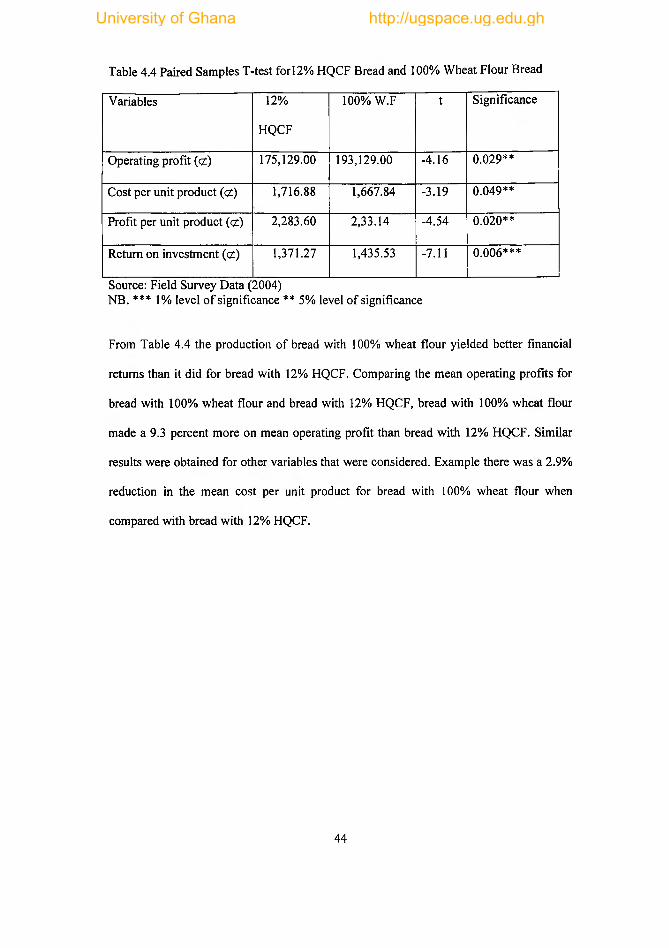
Table 4.4 Paired Samples T-test for 12% HQCF Bread and 100% Wheat Flour Bread
Variables 12%
HQCF
100% W.F t Significance
Operating profit (<x) 175,129.00 193,129.00 -4.16 0.029**
Cost per unit product (<2) 1,716.88 1,667.84 -3.19 0.049**
Profit per unit product (<z) 2,283.60 2,33.14 -4.54 0.020**
Return on investment (d) 1,371.27 1,435.53 -7.11 0.006***
Source: Field Survey Data (2004)NB. *** 1% level o f significance ** 5% level of significance
From Table 4.4 the production of bread with 100% wheat flour yielded better financial
returns than it did for bread with 12% HQCF. Comparing the mean operating profits for
bread with 100% wheat flour and bread with 12% HQCF, bread with 100% wheat flour
made a 9.3 percent more on mean operating profit than bread with 12% HQCF. Similar
results were obtained for other variables that were considered. Example there was a 2.9%
reduction in the mean cost per unit product for bread with 100% wheat flour when
compared with bread with 12% HQCF.
44
University of Ghana http://ugspace.ug.edu.gh
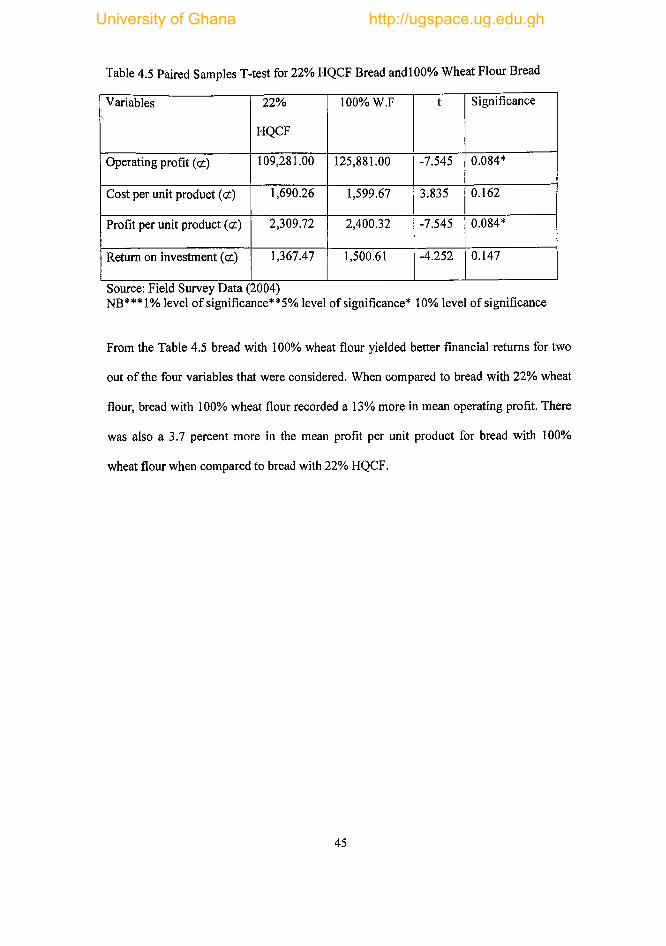
Table 4.5 Paired Samples T-test for 22% HQCF Bread and 100% Wheat Flour Bread
Variables 22%
HQCF
100% W.F t Significance
Operating profit (<z) 109,281.00 125,881.00 -7.545 0.084*
Cost per unit product (<2) 1,690.26 1,599.67 3.835 0.162
Profit per unit product (<2) 2,309.72 2,400.32 -7.545 0.084*
Return on investment (<2) 1,367.47 1,500.61 -4.252 0.147
Source: Field Survey Data (2004)NB***1% level of significance**5% level o f significance* 10% level o f significance
From the Table 4.5 bread with 100% wheat flour yielded better financial returns for two
out o f the four variables that were considered. When compared to bread with 22% wheat
flour, bread with 100% wheat flour recorded a 13% more in mean operating profit. There
was also a 3.7 percent more in the mean profit per unit product for bread with 100%
wheat flour when compared to bread with 22% HQCF.
45
University of Ghana http://ugspace.ug.edu.gh

Table 4.6 Paired Samples T-test for 50% HQCF Sweet Bad and 100% Wheat Flour Sweet
Variables 50%
HQCF
100% W.F t Significance
Operating profit (cz) 58,580.00 57,580.00 3.468 0.040**
Cost per unit product (<z) 265.68 276.99 -60.04 0.000***
Profit per unit product (cz) 234.32 222.99 60.10 0.000***
Return on investment (cz) 883.77 806.77 18.47 0.000***
Source: Field Survey Data (2004)NB. ***1% level of Significance* *5% level of Significance* 10% level o f significance
From Table 4.6 sweet bad with 50% HQCF yielded better financial returns than it did for
sweet bad with 100% wheat flour. Sweet bad with 50% HQCF recorded 1.7% more in
mean operating profit when compared to sweet bad with 100% wheat flour. For mean
cost per unit product, there was a 4.1 percent reduction for sweet bad with 50%HQCF
when compared to sweet bad with 100% wheat flour. Similarly, the mean profit per unit
product for sweet bad with 50% HQCF registered a 5 percent more when compared to
sweet bad with 100% wheat flour.
46
University of Ghana http://ugspace.ug.edu.gh
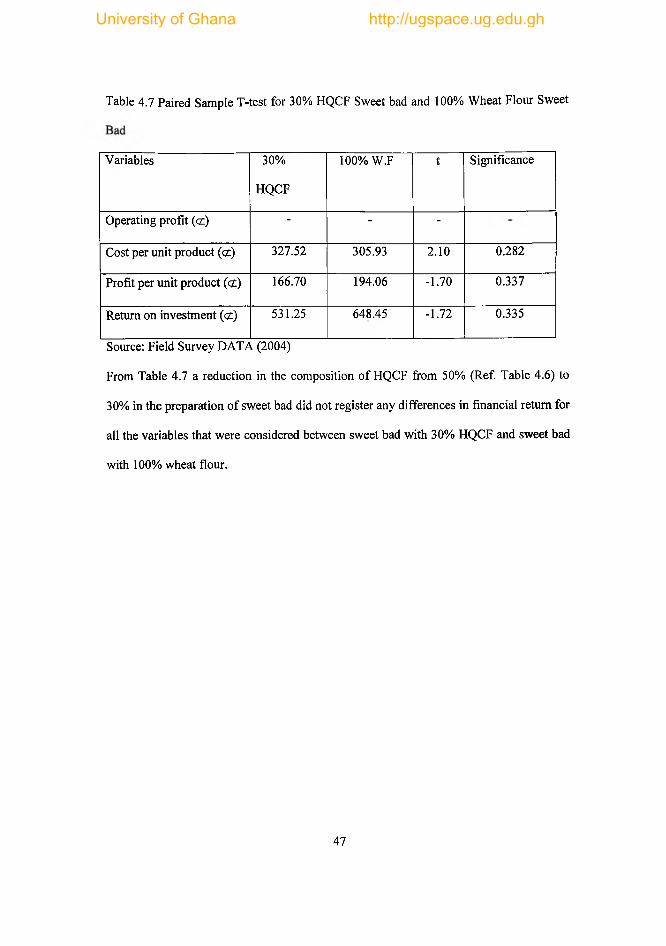
Table 4.7 Paired Sample T-test for 30% HQCF Sweet bad and 100% Wheat Flour Sweet
Variables 30%
HQCF
100% W.F t Significance
Operating profit (<z) " - -
Cost per unit product (cz) 327.52 305.93 2.10 0.282
Profit per unit product (ct ) 166.70 194.06 -1.70 0.337
Return on investment (<z) 531.25 648.45 -1.72 0.335
Source: Field Survey DATA (2004)
From Table 4.7 a reduction in the composition of HQCF from 50% (Ref. Table 4.6) to
30% in the preparation of sweet bad did not register any differences in financial return for
all the variables that were considered between sweet bad with 30% HQCF and sweet bad
with 100% wheat flour.
47
University of Ghana http://ugspace.ug.edu.gh

Table 4.8 Paired Samples T-test for 100% HQCF Cake and 100% Wheat Flour Cake
Variables 100%
HQCF
100% W.F t Significance
Operating profit (<2) 60,500.25 54,510.75 1.01 0.384
Cost per unit product (<£) 1,136.85 1,250.20 -3.21 0.049**
Profit per unit product (cj) 863.14 749.79 3.21 0.049**
Return on investment (q£) 761.03 600.46 3.12 0.052*
Source: Field Survey Data (2004)NB. ** 5% level o f significance * 10% level of significance.
From Table 4.8 cake with 100% HQCF yielded better financial returns than cake with
100% wheat flour for all the variables that were considered. Cake with 100% HQCF
recorded 10.9 percent more in mean operating profit than it did for cake with 100% wheat
flour. Again cake with 100% HQCF recorded a reduction of 9 percent in mean cost per
unit product when compared to cake with 100% wheat flour. Similarly there was a 15.1
percent increase on the mean profit per unit product for cake with 100% HQCF when
compared to cake with 100% wheat flour.
48
University of Ghana http://ugspace.ug.edu.gh

Table 4.9 Paired Samples T-test for 50% HQCF Chips and 100% Wheat Flour Chips
Variables 50%
HQCF
100% W.F t Significance
Operating profit (<z) 31,480 28,297 66.03 0.000***
Cost per unit product (cz) 290.12 317.43 -34.59 0.000***
Profit per unit product (<z) 209.86 182.55 34.66 0.000***
Return on investment (cz) 736.92 584.37 8.18 0 004***
Source: Field Survey Data (2004) NB*** 1% level o f significance
From Table 4.9 chips with 50% HQCF yielded better financial returns than chips with
100% wheat flour. From the Table above chips with 50% HQCF recorded 11.24 percent
more in mean operating profit than chips with 100% wheat flour. In terms of mean cost
per unit product for both products, chips with 50% HQCF recorded an 8.6 percent
reduction when compared to chips with 100% wheat flour. Similar results were obtained
for mean profit per unit product. As a result o f the 50% reduction in wheat flour in the
preparation o f chips with 50% HQCF, there was a corresponding 14.9 percent more gain
in profit per unit product.
The initial cost of investment into a bakery product like chip is relatively low there by
affording a wide range o f entrance into the business especially at the rural level. The
consumers of such product (HQCF Chips) in most rural settings are school children. The
analysis of 50% HQCF chips and 100% wheat flour chips clearly demonstrates that 50%
HQCF chips has better economic returns in all the variables that were considered. The
vigorous promotion of HQCF in making chips will catch the consumers at an early age
there by influence their taste and preference for the product.
49
University of Ghana http://ugspace.ug.edu.gh
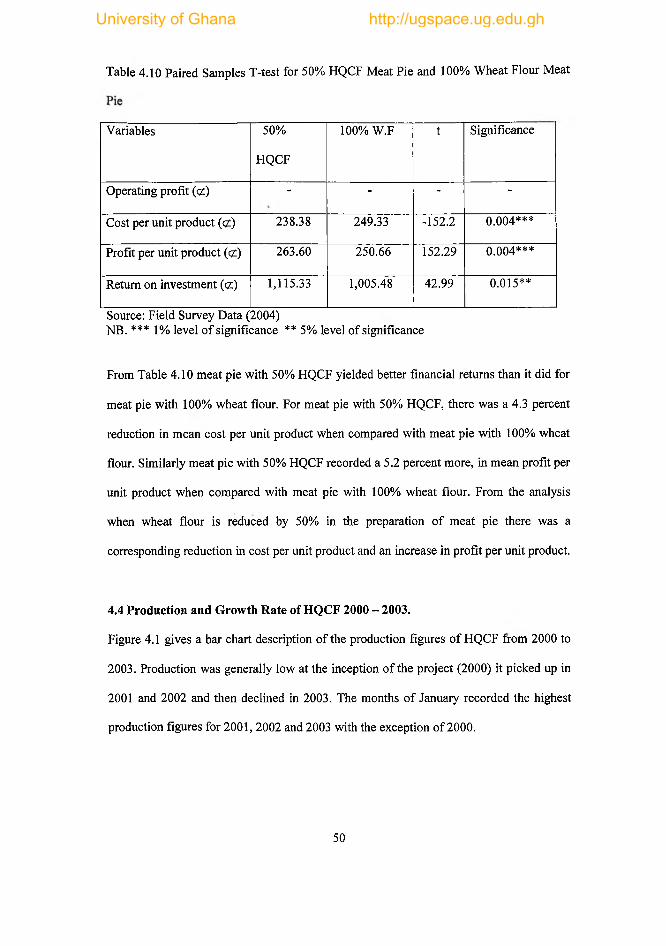
Table 4.10 Paired Samples T-test for 50% HQCF Meat Pie and 100% Wheat Flour Meat
Variables 50%
HQCF
100% W.F t Significance
Operating profit (cz) " “ - “
Cost per unit product (tz) 238.38 249.33 -152.2 0.004***
Profit per unit product (<x) 263.60 250.66 152.29 0.004***
Return on investment (<z) 1,115.33 1,005.48 42.99 0.015**
Source: Field Survey Data (2004)NB. *** 1% level o f significance ** 5% level of significance
From Table 4.10 meat pie with 50% HQCF yielded better financial returns than it did for
meat pie with 100% wheat flour. For meat pie with 50% HQCF, there was a 4.3 percent
reduction in mean cost per unit product when compared with meat pie with 100% wheat
flour. Similarly meat pie with 50% HQCF recorded a 5.2 percent more, in mean profit per
unit product when compared with meat pie with 100% wheat flour. From the analysis
when wheat flour is reduced by 50% in the preparation of meat pie there was a
corresponding reduction in cost per unit product and an increase in profit per unit product.
4.4 Production and Growth Rate of HQCF 2000 - 2003.
Figure 4.1 gives a bar chart description of the production figures of HQCF from 2000 to
2003. Production was generally low at the inception of the project (2000) it picked up in
2001 and 2002 and then declined in 2003. The months of January recorded the highest
production figures for 2001, 2002 and 2003 with the exception of 2000.
50
University of Ghana http://ugspace.ug.edu.gh

Figure 4.1: HQ CF PRODUCTION (2000-2003)
31
Year
Source: Atebubu District Directorate (MOFA 2003)
From the figure 4.1 in the year 2000 the highest production was recorded in the month o f
October (610 kg) with September recording the least (305kg). The production figures for
HQCF for 2001 Fig 4.1 shows a remarkable increase in production o f HQCF. From
January to July with the exception o f the month o f May, production figures were above
51
University of Ghana http://ugspace.ug.edu.gh

the 600kg mark on a monthly basis. These production figures were not achieved for the
same period last year (2000) when production figures fell below the 600kg on a monthly
basis. Again for the second half of the year 2001, production figures except for August
did not fall below the 400kg mark on a monthly basis. For the same period the previous
year (2000) except for October and December, production fell below the 400kg. The
increase in the production of HQCF could be attributed to the experience gained in the
previous year in the production of HQCF and the economic benefits that were achieved.
Referring to Fig 4.1 the first half of year 2002 performed better in the production of
HQCF as compared to the previous year’s production (2001). Five out of the six months,
for the first part of the year (2002), hit production figures above the 800kg mark. The
same story cannot be said for the first half of the previous year (2001).
The second half o f the year had only two months hitting above the 400kg and the
remaining recording below the 400kg mark. The previous year had three months hitting
above the 400kg in the last half o f the year.
In the year 2003 Fig 4.1 production of HQCF was available for only tens months, with the
month of August and September having no production figures. The production trend
followed a similar trend as the preceding years, with January recording the highest
production figure of 405kg with 105kg being the least for the year 2003.
Production figures for 2003 were the worst for all the years since the inception of the
project. The sustainability issue comes to the fore again. For the first seven months, only
one month hit above the 400kg mark, with the rest recording low figures. For the months
of August and September, no production was recorded. When production was restored, it
barely managed to hit above the 250kg mark as the highest for the latter half of the year.
52
University of Ghana http://ugspace.ug.edu.gh

Fig 4.2: Growth in HQCF Production (2000-2003)
Years
SOURCE: ATEBUBUB DISTRICT DIRECTORATE (MOFA)-2003
53
University of Ghana http://ugspace.ug.edu.gh

Fig 4.2 depicts the trend in percentage growth in the production of HQCF from the year
2000 to 2003.
Generally, there was an inconsistency in percentage growth in the production of HQCF
for the period (2000-2003). Only sixteen out of the forty-eight months recorded positive
values in percentage growth. There was a preponderance of negatives values in
percentage growth, month by month for the first five months of every year for the period
2000 to 2003.
All the respondents were farmers, a fall in percentage growth in HQCF for the first
quarter o f every year, could be attributed to the workload on the farm. Normally during
the first quarter o f the year, farmers devote more time to land preparation and other
farming activities. Since their main occupation is farming that need (farming) would be
satisfied first before other off-farm activities, hence the negative values in percentage
growth in HQCF production in the first quarter of the respective years.
4.5 The Success Drivers
Seven factors were given as the success drivers for the production of HQCF. (Fig 4.3)
gives an account of these factors. All the respondence attributed more stable price as the
major success driver for the project. Other factors mentioned amongst others were
forward linkages, ready market, unstable prices of other cassava-based products, the
relatively less tedium associated in the processing of HQCF, and the relatively higher out
put in the production of HQCF as compared to other cassava-based products in the study.
54
University of Ghana http://ugspace.ug.edu.gh
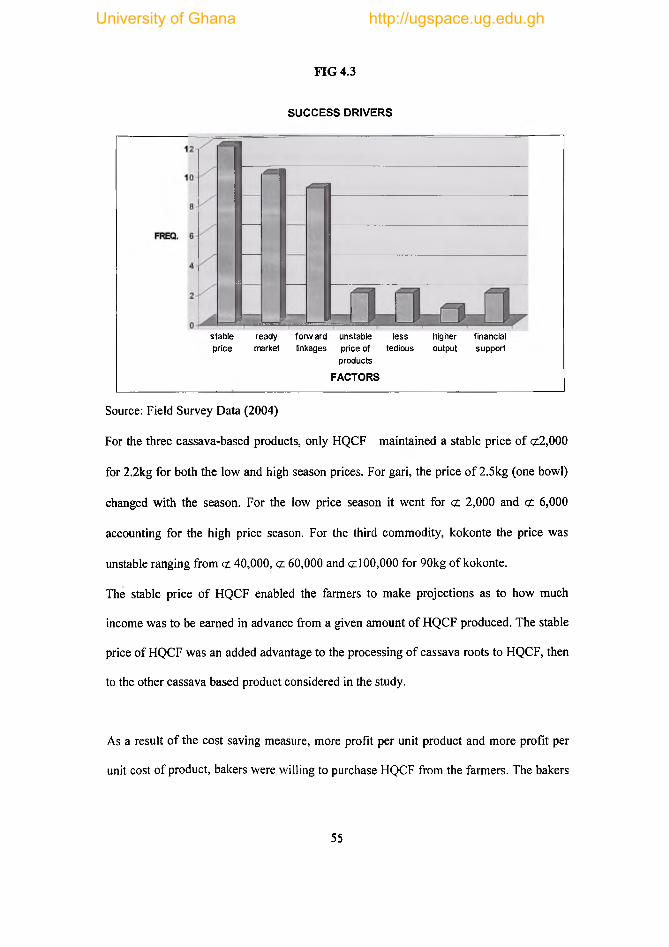
FIG 4.3
SUCCESS DRIVERS
stable ready forw ard unstable less higher financialprice market linkages price of tedious output support
products
FACTORS
Source: Field Survey Data (2004)
For the three cassava-based products, only HQCF maintained a stable price of cz2,000
for 2.2kg for both the low and high season prices. For gari, the price of 2.5kg (one bowl)
changed with the season. For the low price season it went for <2 2,000 and ct 6,000
accounting for the high price season. For the third commodity, kokonte the price was
unstable ranging from <z 40,000, <z 60,000 and <z 100,000 for 90kg of kokonte.
The stable price of HQCF enabled the farmers to make projections as to how much
income was to be earned in advance from a given amount of HQCF produced. The stable
price of HQCF was an added advantage to the processing of cassava roots to HQCF, then
to the other cassava based product considered in the study.
As a result of the cost saving measure, more profit per unit product and more profit per
unit cost of product, bakers were willing to purchase HQCF from the farmers. The bakers
55
University of Ghana http://ugspace.ug.edu.gh

therefore served as a source of ready market by which the farmers readily disposed of
their commodity (HQCF).
The HQCF is further processed into assorted bakery products, thereby satisfying the
desire of linking agriculture to medium and small-scale enterprises at the micro level. The
sustainability o f this linkage has an enormous benefit to the farmer (the primary
producer). It is an assurance that whatever quantity of the commodity (HQCF) is
produced, there is a high tendency o f the product (HQCF) to be absorbed by the
secondary processor (the baker).
The baker will employ some labour in the preparation of the various bakery products
using composite flour, thus implying that the production of HQCF generates some kind of
employment at the micro enterprise level.
For one cycle of production of HQCF, six bags (each weighing 35kg) of fresh cassava
roots were used. While for the other cassava based products (gari and kokonte) five bags
(each weighing 35kg) were used. According to the processors, the tedium, associated with
the processing of the cassava-based product, determined the amount of bags of fresh
cassava roots that can be conveniently handled in a cycle of production. The ease of an
operation therefore plays an important role in the adoption of an innovation.
4.6 Constraints Affecting the Production of HQCF
In this study “n” includes factors such as drying space, distance from the mill, frequent
breakdown of the screw-presser, storage room, harvesting o f cassava, distance from the
56
University of Ghana http://ugspace.ug.edu.gh

farm, lack of washing tools, lack of tools for peeling, packaging materials, micro-finance
and lack of processing equipment.
Hypothesis and Significant Test for W: (F-Test)
H0: there is no agreement between the ranking of the constraints that influence the
production o f HQCF in the Watro area.
H : there is agreement between the ranking o f the constraints that influence the
production o f HQCF in the Watro area.
Constraints that affected the production of high quality cassava flour identified in the
study area were as follows;
A - Drying Space
B- Distance from mill.
C- Frequent breakdown o f the screw-presser
D- Storage room
E- Harvesting of cassava
F- Distance from the farm
G - Lack of washing tools
H - Lack of tools for peeling
I - Packaging materials
J - Micro-finance
K - Lack o f processing equipment.
Table 4.11 on the next page is a summary of the coefficient o f Concordance analysis. It
outlines the constraints that were identified in the study area and the ranks that were
57
University of Ghana http://ugspace.ug.edu.gh

scored for the constraints by the respondents. It also shows that total weight scored for the
identified constraints.
Table 4.11 Coefficient of Concordance Analysis: Response from Survey.
Farmer A B C D E F G H I J K
1 1 5 3 2 10 7 8 9 11 4 6
2 1 5 3 2 8 4 11 10 9 6 7
3 4 6 3 1 8 5 11 10 9 2 7
4 1 5 3 2 10 7 11 9 8 4 6
5 2 3 1 6 8 5 11 10 9 4 7
6 3 6 4 2 7 8 11 10 9 1 5
7 1 7 3 2 8 5 9 10 11 4 6
8 1 2 3 4 8 6 11 10 9 5 7
9 2 5 4 7 9 1 10 11 8 3 6
10 1 3 7 2 8 6 9 5 11 4 10
11 1 4 3 2 9 6 10 11 8 5 7
12 1 5 2 4 8 7 10 9 11 3 6
Total 19 56 39 36 101 64 122 114 113 45 80
Ranking 1 5 3 2 8 6 11 10 9 4 7
Source: Field Survey Data (2004)
58
University of Ghana http://ugspace.ug.edu.gh

Table 4.12 Summary of the coefficient o f Concordance Analysis
Constraints Rank TWS 1 2 3 4 5 6 7 8 9 10 11
Dryingspace.
1 19 8 2 1 1 0 0 0 0 0 0 0
Storageroom
2 36 1 7 0 2 0 1 1 0 0 0 0
Breakdownof
screwpresser
3 39 1 1 7 2 0 0 1 0 0 6 0
Micro-Finance
4 45 1 1 2 5 2 1 0 0 0 0 0
Distancefromhammer-mill
5 56 0 1 2 1 5 2 1 0 0 0 0
Distance from Farm
6 64 1 0 0 1 3 3 3 1 0 0 0
Lackprocessingequipment.
7 80 0 0 0 0 1 5 5 0 0 1 0
Harvesting 8 101 0 0 0 0 0 0 1 7 2 2 0
Packaging 9 113 0 0 0 0 0 0 0 3 5 0 4
Lack. Tool for peeling
10 114 0 0 0 0 1 0 0 0 3 6 2
Lack tools for washing
11 122 0 0 0 0 0 0 0 1 2 3 6
Source: Field Survey Data (2004)
NB: TWS is the Total Weight Score
V arT = 13092.2, m = 12 n = l l
Coefficient o f Concordance (W) = 12T/ nm2 (n2 - 1)
= 12(13092.2) / 11(12)2 ((11))2- 1)
= 0.075
= 7.5%
The low value of 0.075 (7.5%) is indication that, the farmers interviewed do not
collectively agree to the constraints affecting the production of HQCF. However, the
farmers perceive the drying space (with the lowest value of 19) as the most pressing
59
University of Ghana http://ugspace.ug.edu.gh

constraint affecting the production of HQCF and the lack of tools for washing as the least
constraint having the highest score of 122.
Hypothesis and Significant Test for W: F-Test
H0: there is no agreement between the rankings o f the constraints that affect the
production o f HQCF
Hi: there is agreement between the rankings of the constraints that affect the production
of HQCF.
F-ratio = ((m-1) Wc) / (1 -W c)
( (12- 1) 0 .075 / ( 1- 0 .075)
= 0.891
Degree of freedom for the numerator (dfl) = (n-1) - (2/m)
= 11-0.16
= 10.84
Degree of freedom for the denominator (df2) = (m -1 ) * ((n -1 ) - (2/m))
= 11* (10 -0 .16 )
= 108.24
F-ratio (Fcal) = 0.891
The calculated F. ratio, 0.89 is not statistically significant at 5% level. It is therefore,
conclude that there is no agreement among the farmers in the rankings of the constraints
that affect HQCF production in the Watro area.
Even though when the identified constraints were ranked and subjected to the Kendal
Coefficient of Concordance analysis, the alternate hypothesis (Hi) was rejected, the
identified problems were institutional based rather than economic based. In introducing
60
University of Ghana http://ugspace.ug.edu.gh

an innovation, there is the need for the formation o f institutions that will nurture, nourish,
encourage and sustain the adoption of the innovation. The processing o f HQCF was an
entirely new activity for the farmers.
The drying space was ranked first because it determined the amount of sifted mash to be
dried and consequently the amount of HQCF to be produced. The farmers hitherto were
used to drying on their farms or any available space irrespective of hygienic condition.
They were used to the production of cassava-based products that did not require or have
any standard quality measure. As stated by Ofori et al (1997) “processing o f cassava roots
to traditional cassava based products is often carried out under unhygienic conditions and
some unsanitary practices, such as improper effluent disposal”. They went on again to
say, “Products may be of inconsistent organoletic and microbiological quality, because no
formal quality system is applied during processing to assure the quality o f the product”.
The processing of HQCF requires certain standard measures to meet required quality
standard. The conditions under the various stages of the processing activities therefore
mattered. The farmers from the onset of the project strived to meet the quality standard
with whatever tools and equipment that were available to them. The enthusiasm to
produce HQCF was high because it offered a viable economic alternative. Expectation
were that, as the years progressed all the necessary institutional arrangement would be put
in place for sustained growth in production.
The drying space or place, the storage room, processing tools and equipment all play
important roles in producing HQCF on sustainable basis, without altering quality
standard. The afore mentioned constraints therefore suggest that the institutional
61
University of Ghana http://ugspace.ug.edu.gh
arrangement that were necessary to produce HQCF on a sustainable basis were not
properly prioritised, not adequate or were completely absent.
62
University of Ghana http://ugspace.ug.edu.gh

CHAPTER FIVE
CONCLUSIONS AND RECOMMENDATIONS
5.1 Introduction.
This Chapter forms the concluding part of the study. It draws its conclusions from the
empirical results o f the study. The chapter offers recommendations and the way forward
for the production and promotion o f HQCF in the country.
5.2 Conclusions
The results from the study indicate that the price o f the raw material is important as it
affects the value addition that consumers can take. Ghana, as a producer o f primary
agricultural produce needs to add value to her primary agricultural produce to derive
optimal benefit. This will strengthen the link between agriculture and industry.
For the rural processor and investor to be encouraged to add value to our agricultural
produce, the prices o f primary agricultural produce of industrial potential must be
moderate. When the price of the primary agricultural produce, takes a very high
percentage o f the total cost o f production, it reduces the benefits o f value addition. In
spite of the high price o f fresh cassava in the study area, only HQCF registered positive
financial returns in both high and lean seasons prices in the analysis o f value addition.
The cost saving measures o f HQCF made HQCF bakery products more profitable in all
the variables that were considered for all the bakery products except HQCF bread. Ghana
imports all her wheat requirements. The bulk of wheat flour imports is used for assorted
pastry products like bread, biscuits, chips, bofrot, meat pie and more. The increase in the
o f price of wheat on the world market, calls for the vigorous pursuit o f policy to
63
University of Ghana http://ugspace.ug.edu.gh

encourage the substitution o f HQCF partially or in full in the preparation o f popular
pastry products in the country. This will save the country some foreign exchange and
enhance the integration o f our agriculture with industry.
The lack o f processing tools and equipment and the necessary institutional arrangement
had an adverse effect on the sustainability of HQCF production. The production o f HQCF
holds an enormous economic advantage in the cassava sub sector o f the economy. To step
up and popularise the production of the commodity, the basic infrastructure and
equipment must be set up in other potential cassava producing areas in Ghana. The rural
processor cannot benefit from the advantages of the economics o f scale if he is to rely on
rudimentary equipment with high downtime.
Ready market, stable price and forward linkages among others contributed immensely to
the success o f HQCF production. From the study it was established that there was ready
market for the commodity (HQCF). The bakers needed the commodity because o f the
economic benefit they derived from its usage. The farmers readily produced HQCF
because o f the competitive advantage it has in terms o f financial returns o f value addition
as compared to the other cassava-based products that were considered in this study.
5.3 Recommendations
There is the need to institute some pricing mechanism for primary agricultural produce
with industrial potential based on quality and weight. In Ghana the only agricultural
commodity with such pricing mechanism is cocoa. With the government policy to
encourage value addition o f primary agricultural produce, the issue of pricing o f primary
agricultural produce with industrial potential must be established. For example, cassava
64
University of Ghana http://ugspace.ug.edu.gh

varieties with high starch content suitable for industrial purposes only, must be priced
such that it will be attractive for the industrialist to buy for value addition purposes.
There are various end users o f fresh cassava in Ghana; the chop barkeeper, the foodstuff
trader, the rural processor and industrialist. How much should a kilogram o f cassava be
sold to make it attractive to both the farmer and other users? This is an issue that policy
makers must address if we are to add value to our primary agricultural produce and link
agriculture to industry. For the rural processor, a contractual arrangement (contract
farming) between the seller o f fresh cassava and the buyer o f HQCF is recommended.
To expand farms and meet the quantity requirements o f rural processors (the farmers)
require financial assistance. Future projects should incorporate a micro finance scheme to
meet the financial services need of beneficiary. Such a scheme will offer short-term loans
for farmers to expand their farms and employ more farm hands for the maintenance of
their farms. Such a scheme will also help mobilise funds from the community and
encourage saving habits in the community.
The farmers combined their farming work with the production o f HQCF. When labour
demand was high it had an adverse effect on the production o f HQCF. For smooth
running o f a rural enterprise of this nature, there is need for specialization, where farmers
will solely supply the raw material (cassava roots) for processing into HQCF. Combining
farming with processing may result in inefficiency. The other option is to provide the
farmers with financial assistance to employ more labourers on their farms, so that the
fanner assumes a supervisory role on the farm thereby leaving the farmer with more time
to concentrate on the processing activities.
65
University of Ghana http://ugspace.ug.edu.gh

With the escalating price of wheat flour at both the local and international markets the
promotion o f HQCF becomes relevant. In all the analysis that were done to determine the
profitability of HQCF bakery products, with the exception o f bread, the other bakeiy
products yielded better results in terms of all the profitability variables considered. There
is the need to go beyond the awareness level and set the necessary institutions to
vigorously pursue the promotion of the use of HQCF. The Ghana Regional Appropriate
Technology Industrial Service (GRATIS) must be proactive in the manufacture o f tools
and equipment for the processing of cassava roots into HQCF. The availability o f funds
for interested rural processors for their work will go a long way to promote the production
and utilisation o f HQCF. This can be achieved by the District Assemblies providing some
guarantee for the lending institutions when they credit available to processors. Another
strategy is the serving of HQCF bakery products at state functions as a means of
popularising HQCF bakery products.
This study revealed that HQCF bakery products compete favourably with wheat flour
bakeiy products in both consumer acceptance and financial terms. It is time for policy
makers to institute the necessary measures through food policy, trade policy, promotional
campaigns, the utilisation of HQCF bakery based products in our educational institutions
and the hospitality industry in the country. This will enable the country to fully tap the
industrial potential o f cassava roots.
66
University of Ghana http://ugspace.ug.edu.gh

Reference
Adams, C.D. (1960) Activities of Danish Botanists in Guinea 1738 - 1850. Transactions of the Historical Society o f Ghana 111. Part 1
Alderman, H. and Higgens, P. (1992). Food and Nutrition Adequacy in Ghana. Cornell Food and Nutrition Policy Program, Woking Paper 27.
AI-Hassan, R. (1989). Cassava in the Economy of Ghana: In Status of Cassava Research in Africa, COSCA Working Paper No.3, Eds, F.I. Nweke, J.Lynam and C.Y. Prudencio, International Institute of Tropical Agricultural, Ibandan, Nigeria.
AI-Hassan, R. (1992) Industrial Demand for Cassava in Ghana: Prospects and problems. In: Proceeding, 4th Triennial Symposium o f the International Society for Tropical Crops - Africa Branch held in Kinshasha, Zaire 5th - 8th December 1998 pp 239- 273
AI-Hassan R., and Egyir,I.S., (2002) FAO Publication; Promoting Farm/Non Farm Linkages for Rural Development. Case Studies from Africa and Latin American. Ed. Benjamin Davis, Thomas Reardon, Kostas Stamoulis and Paul Winters Pp 189-190.
AI-Hassan, R.,. Kwadzo T.M and Amegashie.D.P.K. (1996) The Effect o f the CFA Devaluation on Investment, Productivity and Competiveness in the Cassava Sub-Sector in Ghana. Draft report o f the PRISAS/INSAH/MSU Research Project.
Ankra, E.K. (1980) Studies in Postharvest Weight Losses in Stored Cassava (Manihot esculenta) Roots Tuber. Food Research Institute. Accra, Ghana.
Ankra, E.K. and Osei-Yaw, A. (1981). The Storage o f Cassava roots tubers in sawdust medium contained in matted coconut palm fronds. Food Research Institute.
Anon F.K (1994) A Review of Markets Survey: Glucoset to process cassava into starch for the Ghanaian market and export, Glucoset Ltd. Technical Report. Accra, Ghana.
Antwi, V. (1994). Feasibility Report on Cassava Chips Enterprise in Ghana. Technoserve Ghana Report. Accra, Ghana
Baumol, W.J. and Blinder, A. (1991) A.S. Economic: Principles and Policies. 5th Edition, Harcout Brace Savanovic Inc.
Beeching, J. R., .Han, Y.,.Gomez-Vasquez, R,. Day, R.C., and Cooper,R.M,. (2000) Wound and Defence Response on Cassava as Related to Post Harvest Physiological Deterioration. Recent Adv. Phytochem.32: 231-248
Chandra Shekera, S. and Shurpalekar, S.R. (1983) Some Chemical, Pasting Rheological and Textural Characteristics of Composite Flour Based on Wheat and Tubers. Journal of Food Science and Technology. 20, 308-312
67
University of Ghana http://ugspace.ug.edu.gh

Day, G., Graffham, A., Ababio, J. and Amoako, M. (1994). Market Potential For Cassava Flour and Starches in Ghana. NRI Project Report, Project A0423/A0496, R2333 (S). 28pp
Defloor, I., Leijsken, R., Bokanga, K., and Delcour, J.A. (1994). Impact o f Genotype and Crop Age on the Breadmaking and Physico-Chemical Properties o f Flour Produced from Cassava (Manihot esculenta Crantz) Planted in the Dry Season. J.Sci. Fd. Agric. Pp 66, 193-202.
Department for International Development (DFID) (1999) Crop Post-Harvest Programme (CPHP) Newsletter Publication; Summary of the Results of DFID, CHCP Funded Cassava Research Work in Ghana.
Dosoo, E. and Amoa-Awua, W.K.A. (1992). Cassava in Ghana; Its Cultural, Utilisation, Limitations, Plans and Prospective. First Afro-Brazilian Seminar on Cassava. Maputo, Mozambique. July 27th -31st.
Dziedzoave, N.T., (1992) Effects of Cassava Variety and Sources of Cassava on the Processing Losses and Product Yield in a Pilot Cassava Processing Plant: An Evaluation o f the Production Statistics of the CSSIR/ARCT Cassava Demonstration Unit at Pokuase, Accra between June 1990 and May 1991. FRI, Technical Report 1992, 59pp.
Dziedzoave,N.T.,. Osei-Yaw. A., Gyato. C., and Mensah, B,. (1998) Studies On Cassava Flour Production and Utilisation In Composite Flours For Biscuit Manufacture. FRI/NRI CASSAVA FLOUR PROJECT PHASE 1 REPORT. Accra, Ghana.
Dziedzoave, N.T., Gyato. C., Larwerh. P., Krampah. L., Aduko.M,. and Fiasidey.K., (2000) A Particpatory Rapid Appraisal Of The Status O f Cassava and Various Cereals In Watro - A Farming Community In The Atebubu District O f The Brong Ahafo Region Of Ghana. NRI/FRI COLLABORATIVE PROJECT on “New Market For Cassava. Report on Project Activity l.l(MILESTONE MF 1.8) Accra, Ghana
Edwards A.L.(1964) Statistical Methods For The Behavioural Science. Holt Rienehart and Winston, New York. Pp 402,410.
Emilia Abraham T., Raja K.C.M., Manoham, E.P., and Mathew A.G. (1983).Effect of Moisture Treatment on Textural Characteristics o f Cassava Flour. Cereal Chem. Pp 60(1): 7-8
Euro-Africa Development Co.Ltd. (1996). Feasibility Study On Cassava Pellets Production in Ghana.
Fernandez, A (1986). Testing Cassava Flour Milling System. Cassava Newsletter, (1984), 11,7-10
Fidel, M.M., Dolores, H.C., Bauza, E.B. and Dionglay, M.S. (1992) Phenol Formaldehyde-Fortified Starch Adhesive for Plywood, FPRDI J, 21 1-19.
68
University of Ghana http://ugspace.ug.edu.gh
Ghana Statistical Service. (1989). Ghana Living Standard Survey Report on the First Round (GLSS 1) September (1987) - August (1988)
Ghana Statistical Service.(1995). Ghana Living Standards Survey Report on the Third Round (GLSS 3) September (1991) - September (1992).
Ghana Statistical Service.(1996). Ghana Living Standards Survey Report on the second Round (GLSS 2) September (1988) -September (1989).
Government of Ghana (1964). Seven year plan for National Reconstruction and Development (1963/64) to (1969/70). Office for the Planning Commission, Accra.
Government o f Ghana.(1977). Five Year Development Plan (1975/76) - (1979/80), Part1. Ministry of Economic Planning, Accra.
Hudson, B.J. and Ogunswa, A.O. (1976) The Effect O f Fibre, Starch Damage and Surfactants On The Baking Quality of Wheat- Cassava Composite Flour. J.Fd. Tech. 11: 12 9 - 136.
Jones, W.O. (1959) Manioc in Africa. Stanford University Press.
Jones, D.M. (1994) Report On a Visit to Peru to Evaluate the IIAP Cassava Flour Plant NRI Technical Report.
KB Consultant^ 1996). Supply Analysis of Starch in Nigeria and Cote d’Ivoire. Prepared for Danida Private Sector Programme by KB Consultant, Lome Togo. 16pp.
Kleih, U., Crenstil, D., Gailat, S., Gogoe, D. and Yeboah, D. (1994) Assessment of Postharvest Needs in non-grain Starch Staple Food Crop Systems in Ghana. Joint Report of the Natural Resource Institute and the Post Harvest Development Unit of the Ministry of Food and Agricultural. NRI Report R2261 (R) Accra, Ghana
Korang-Amoakoh, S., Cudjoe, R.A. and Adams, E. (1987) Biological Control o f Cassava Pest in Ghana. Prospects For the Integration of Other Strategies. Hahn S.K. and F.E. Caveness (Eds) Integrated Pest Management for Tropical Root and Tuber Crops.IITA, p 164-169.
Gittinger, J.P., (1982) Economic Analysis of Agricultural Projects 2nd Edition, JohnHopkins University Press. Baltimore.
Mattson D.E., (1986) “Statistics - Difficult Concept Understandable Explanations” Bolchazy - Carducci Piblishers. Inc. pp. 281, 283, 361, 423.
National Agricultural Research Strategy Plan.(1994). Final Report 266p.
Ministry o f Agriculture. (1990). Medium Term Agricultural Development Programme (MTADP) 1991-2000: An Agenda For Sustained Agricultural Growth and Development.
69
University of Ghana http://ugspace.ug.edu.gh

Ministry of A g r ic u l tu re (1 9 9 5 ) . Facts and Figures of Ghana s Agriculture.
National Agricultural Research Strategic Plan, Ghana,(1994). Final Report.
National Cassava Task Force (1996). Final Report On the Promotion o f Cassava Production , Processing and Marketing in Ghana. 39p
Ofori, F., AI-Hassan, R., Afuakwa J.J., and Noamesi R.K., (1997) A Case Study Of Cassava Development in Ghana; A report submitted to the International Fund For Agricultural Development (IFAD), Rome, Italy.
Orias, R.R. and Calub, F.C. Jr. (1986) Evaluation O f Primary Processing Techniques On Local Cassava Flour Production using the Pedal Operated Hammer Mill. Annals o f Trap. Research (Phillipines), 8:61-71
Potential of Roots For Food and Industrial Resources (2000) Makoto, N., and Katsumi, K., (Eds) 12th Symposium o f the International Society for Tropical Root Crops (ISTRC) Sep 10th-16th Tsukuba Japan.
Prudencio, C.Y. and AI-Hassan R. (1994) The Food Security Stabilization Roles of Cassava in Africa Food Policy.
Raja, K.C.M., Sreedharan, V.P., Emilia, T., Sreemulanthan, H. and Matthew, A.G.(1978). Effect o f Fractional Sieving on Some Quality Aspect o f Cassava Flour. Journal on Root Crops.
Roots and Tuber Improvement Programme (1997) Appraisal Report MOFA Accra.
Stryker, D.J., (1990) Trade Exchange Rate and Pricing Policies in Ghana. The Political Economy o f Agricultural Pricing Policy, World Bank Comparative Studies, World Bank Washing D.C.
Weber, E.J., Cock, J.H and Chounard, A. (1978). Cassava Harvesting and Processing. Cassava Harvesting and Processing Workshop Report CIAT Coloombia 24th -28 th April.
Wenham J.E (1995) Post-Harvest Deterioration o f Cassava. A Biotechnological Perspective, FAO, Rome.
Zschekel.W., F. Afful.F,. and Atta-Agyepong. K. (1998) Baseline Survey on Farming Systems in the Brong-Ahafo Region. Sedentary Farming Systems Project Publication. GTZ MOFA Sunyani.
70
University of Ghana http://ugspace.ug.edu.gh

APPENDIX I FLOW CHART FOR HQCF PRODUCTION
RAW CASSAVA
~ !PEELING
WASHING
V
_V ____SIFTING
_v__DRYING
V
MILLING
1PACKAGING
V
HQCF
71
University of Ghana http://ugspace.ug.edu.gh

a p p e n d ix II FLOW CHART FOR GARI PROCESSING
72
University of Ghana http://ugspace.ug.edu.gh
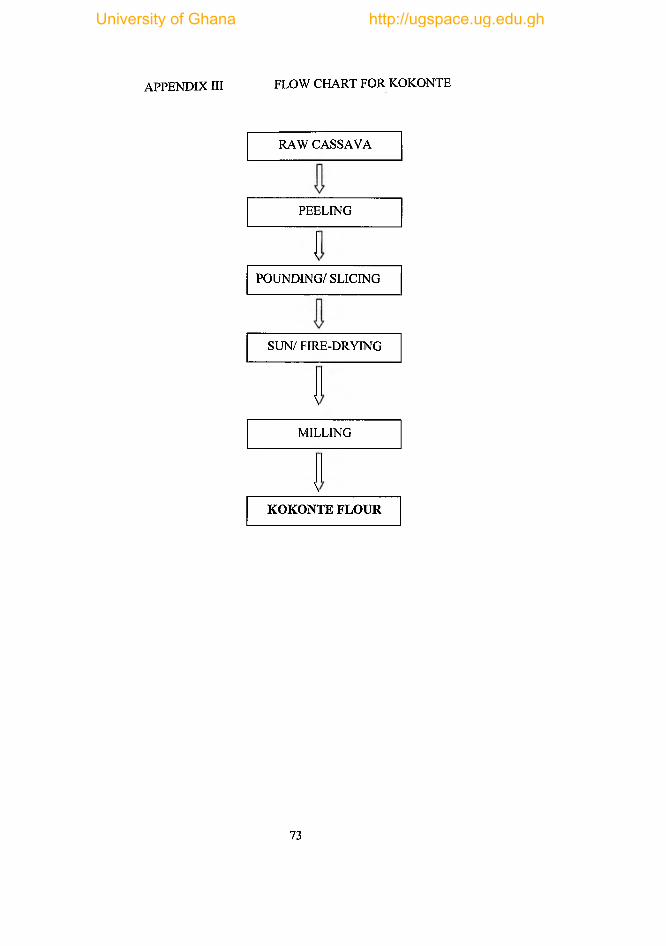
APPENDIX III FLOW CHART FOR KOKONTE
RAW CASSAVA
PEELING
!
POUNDING/ SLICING
SUN/ FIRE-DRYING
\
MILLING
\
KOKONTE FLOUR
73
University of Ghana http://ugspace.ug.edu.gh
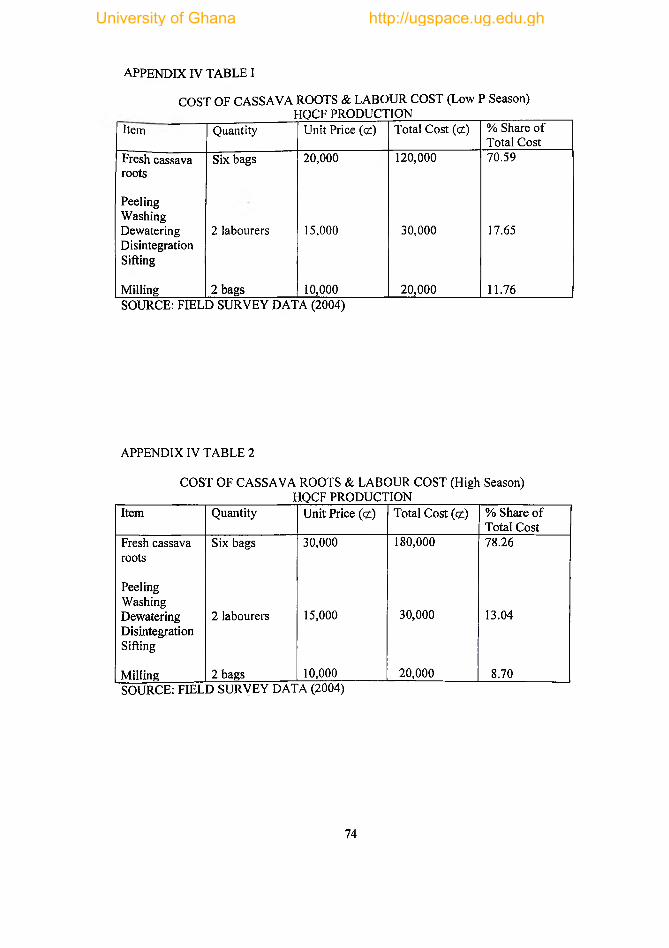
APPENDIX IV TABLE I
COST OF CASSAVA ROOTS & LABOUR COST (Low P Season)HQCF PRODUCTION
Item Quantity Unit Price (ex) Total Cost (cz) % Share of Total Cost
Fresh cassava roots
Six bags 20,000 120,000 70.59
PeelingWashingDewateringDisintegrationSifting
2 labourers 15,000 30,000 17.65
Milling 2 bags 10,000 20,000 11.76SOURCE: FIELD SURVEY DATA (2004)
APPENDIX IV TABLE 2
COST OF CASSAVA ROOTS & LABOUR COST (High Season)HQCF PRODUCTION
Item Quantity Unit Price (<£) Total Cost (<£) % Share of Total Cost
Fresh cassava Six bags 30,000 180,000 78.26roots
PeelingWashingDewateringDisintegrationSifting
2 labourers 15,000 30,000 13.04
Milling 2 bags 10,000 20,000 8.70SOURCE: FIELD SURVEY DATA (2004)
74
University of Ghana http://ugspace.ug.edu.gh

APPENDIX V TABLE 3
COST OF CASSAVA & LABOUR COST (Low Season) GARI PRODUCTION_______________
Item Quantity Unit Price (<z) Total Price (z ) %Share of Total Cost
Fresh cassava roots
5 bags 20,000 100,000 71.43
PeelingWashingGratingDewateringDisintegrationSiftingPatching
2 labourers 10,000 20,000 14.29
Fuel One bundle 10,000 10,000 7.14
Patching Pan (Hiring) One 10,000 10,000 7.14SOURCE: FIELD SURVEY DATA (2004)
APPENDIX V TABLE 4
COST OF CASSAVA ROOTS & LABOUR COST (High Season) GARI PRODUCTION
Item Quantity Unit Price (<z) Total Price (cz) %Share of Total Cost
Fresh cassava roots
5 bags 30,000 150,000 78.95
PeelingWashingGratingDewateringDisintegrationSiftingPatching
2 labourers 10,000 20,000 10.53
Fuel One bundle 10,000 10,000 5.26
Patching Pan (Hiring) One 10,000 10,000 5.26SOURCE: FIELD SURVEY DATA (2004)
University of Ghana http://ugspace.ug.edu.gh

APPENDIX VI TABLE 5
COST OF CASSAVA ROOTS & LABOUR COST (Low Season)KOKONTE PRODUCTION
Item Quantity Unit Price Total Cost (<z) % Share of Total Cost
Fresh cassava roots
5 bags 20,000 100,000 76.92
PeelingPounding
2 labourers 10,000 20,000 15.38
Milling One bag 10,000 10,000 7.70SOURCE: FIELD SURVEY DATA (2004)
APPENDIX VI TABLE 6
COST OF CASSAVA ROOTS & LABOUR COST (High Season) KOKONTE PRODUCTION
Item Quantity Unit Price Total Cost (cf) % Share of Total Cost
Fresh cassava roots
5 bags 30,000 150,000 83.33
PeelingPounding
2 labourers 10,000 20,000 11.11
Milling One bag 10,000 10,000 5.56SOURCE: FIELD SURVEY DATA (2004)
76
University of Ghana http://ugspace.ug.edu.gh
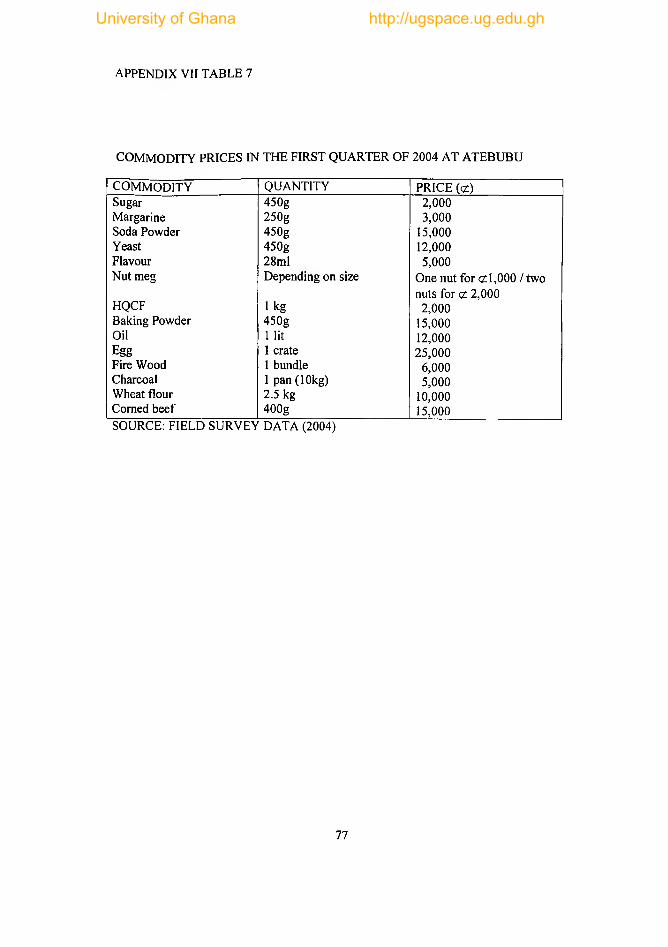
APPENDIX VII TABLE 7
COMMODITY PRICES IN THE FIRST QUARTER OF 2004 AT ATEBUBU
COMMODITY QUANTITY PRICE (<z)Sugar 450g 2,000Margarine 250g 3,000Soda Powder 450g 15,000Yeast 450g 12,000Flavour 28ml 5,000Nut meg Depending on size One nut for c21,000 / two
nuts for (2 2,000HQCF 1 kg 2,000Baking Powder 450g 15,000Oil 1 lit 12,000Egg 1 crate 25,000Fire Wood 1 bundle 6,000Charcoal 1 pan (10kg) 5,000Wheat flour 2.5 kg 10,000Corned beef 400g 15,000SOURCE: FIELD SURVEY DATA (2004)
77
University of Ghana http://ugspace.ug.edu.gh

QUANTITY OF INGREDIENT & PRICES OF 50%HQCF (BOFROT) & 100%WHEAT FLOUR BOFROT
APPENDIX VIII TABLE 8PERCENTAGE HQCF: 50% WHEAT FLOUR: 100%
Ingredients Quantity Cost (cz) Ingredients Quantity Cost (<z)Sugar 787.5g 3,500 Sugar 900g 4,000Margarine 337.5g 4,208.5 Margarine 237.5g 3,028.25S.P. 5g 166 S.P. 5g 166Yeast 7.5g 266 Yeast 6.25g 166.25Oil 2.25 lit 25,000 Oil 2.37 lit 27,500Flavour 5 ml 1,120 Flavour 5 ml 1120Nut meg 1.5 nuts 1,500 Nut meg - -
W.F. 2.5 kg 10,000 W.F. 5kg 20,000HQCF 2.2 kg 4,400 Labour 3,000Labour 3,000 Fuel 4,000Fuel 4,000Output: 195.5 pieces Unit price: cz 500 Sales revenue: c1 97,750 Total cost: cz 57,160.5 Operating profit: <£ 40,589.50 Cost per unit product: cz 291.56 Profit per unit product: cz 208.42 Return on investment: cz 740.62
Out put: 201.25 pieces Unit price: cz 500 Sales revenue: cz 100,625 Total cost: <z 62,980.50 Operating profit: cz 37,644.50 Cost per unit product: cz 311.99 Profit per product: cz 187.99
Return on investment: cz 617.10SOURCE: FIELD SURVEY DATA (2004)
78
University of Ghana http://ugspace.ug.edu.gh

QUANTITY OF INGREDIENTS & PRICES OF 12% HQCF (BREAD) & 100%WHEAT FLOUR BREAD
APPENDIX IX TABLE 9PERCENTAGE HQCF: 12% WHEAT FLOUR: 100%Ingredient Quantity Cost (<2) Ingredient Quantity Cost (<2)Sugar 3.7kg 16,500 Sugar 3.7kg 16,500B.P. 8.75kg 291.25 B.P. 8.75g 291.25Nut meg 4.5kg 4,000 Nut meg 4.5 nuts 4,000Yeast 11.5* 299.50 Yeast 11.25g 299.50Margarine 437.5g 5,250. Margarine 437.5 5,250Flavour 1.25 ml 280 Flavour 1.25 ml 280HQCF 2.75kg 5,500 W.F. 21.86kg 87,500W.F. 18.75 75,000 Labour 6,000Labour 6,000 Fuel 6,750Fuel 6,750Out put: 73.75 pieces Out put: 80 piecesUnit price: cz 4,000 Unit price: <2 4,000Total cost: <z 119,870.75 Total cost: c£ 126,870.75Sales revenue: <x 295,000 Sales revenue: cr 320,000Operating profit: qr 175,129 Operating profit: <Z 193,129Cost per unit product: 1,716.88 Cost per unit product: <2 1,667.84Profit per unit product: <z 2,283.60 Profit per unit p ro d u c ts 2,332.14Return on investment: <t 1,371.27 Return on investment: (t 1,435.53SOURCE: FIELD SURVEY DATA (2004)
79
University of Ghana http://ugspace.ug.edu.gh
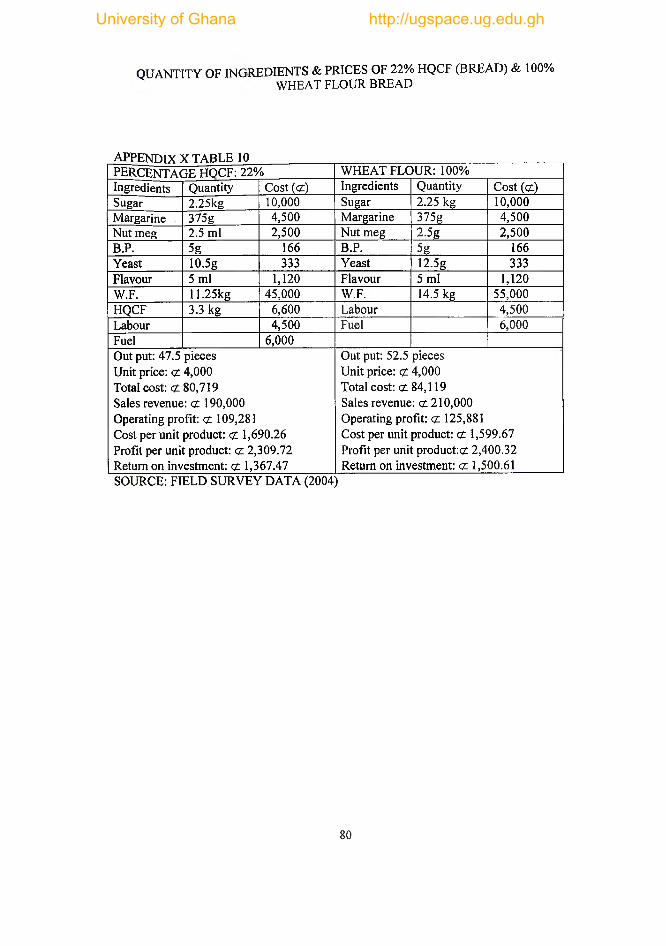
QUANTITY OF INGREDIENTS & PRICES OF 22% HQCF (BREAD) & 100%WHEAT FLOUR BREAD
APPENDIX X TABLE 10PERCENTAGE HOCF: 22% WHEAT FLOUR: 100%Ingredients Quantity Cost (<2) Ingredients Quantity Cost (c2)Sugar 2.25kg 10,000 Sugar 2.25 kg 10,000Margarine 375g 4,500 Margarine 375g 4,500Nut meg 2.5 ml 2,500 Nut meg 2.5g 2,500B.P. 5g 166 B.P. 5g 166Yeast 10.5g 333 Yeast 12.5g 333Flavour 5 ml 1,120 Flavour 5 ml 1,120W.F. 11.25kg 45,000 W.F. 14.5 kg 55,000HQCF 3.3 kg 6,600 Labour 4,500Labour 4,500 Fuel 6,000Fuel 6,000Out put: 47.5 pieces Unit price: <2 4,000 Total cost: <2 80,719 Sales revenue: <2 190,000 Operating profit: <z 109,281 Cost per unit product: <t 1,690.26 Profit per unit product: <2 2,309.72 Return on investment: <2 1,367.47
Out put: 52.5 pieces Unit price: <£ 4,000 Total cost: <2 84,119 Sales revenue: <2 210,000 Operating profit: <2 125,881 Cost per unit product: (2 1,599.67 Profit per unit p ro d u c ts 2,400.32 Return on investment: <2 1,500.61
SOURCE: FIELD SURVEY DATA (2004)
80
University of Ghana http://ugspace.ug.edu.gh

QUANTITY OF INGREDIENT & PRICES FOR 50% (HQCF) SWEET BUD & 100%WHEAT FLOUR SWEET BUD
APPENDIX XI TABLE 11PERCENTAGE HQCF: 50% WHEAT FLOUR: 100%Ingredient Quantity Cost cz) Ingredients Quantity Cost (cz)Sugar 900g 4,000 Sugar 900g 4,000Margarine 45 Og 5,400 Margarine 450g 5,400Oil 2.51it 30,000 Oil 2.5 lit 30,000B.P. 15g 500 B.P. 15g 500Nut meg 2 nuts 2,000 Nut meg 2nuts 2,000Flavour 5ml 1,120 Flavour 5ml 1,120W.F 2.5kg 10,000 W.F 3.75kg 15,000HQCF 2.2kg 4,400 Eggs 2 2,000Eggs 2 2,000 Labour 6,000Labour 3,000 Fuel 6,000Fuel 4,000Out put: 250 pieces Unit price: <2 500 Total cost: cz 66,420 Sales revenue: cz 125,000 Operating profit: cz 58,580 Cost per unit product: cz 265.68 Profit per unit product: cz 234.32
Return on investment: cz 883.77
Out put: 260 pieces Unit price: cz 500 Total cost: cz 72,020 Sales revenue: cz 130,000 Operating profit: cz 57,980 Cost per unit product: cz 222.99 Profit per unit p ro d u c ts 226.84 Return on investment: cz 806.52
SOURCE: FIELD SURVEY DATA (2004)
University of Ghana http://ugspace.ug.edu.gh

QUANTITY OF INGREDIENTS & PRICES OF 100% HQCF CAKE & 100% WHEATFLOUR CAKE
APPENDIX XII TABLE 12PERCENTAGE HOCF: 100% WHEAT FLOUR: 100%Ingredient Quantity Cost c2) Ingredients Quantity Cost (2 )Sugar 1.35kg 6,000 Sugar 1.65kg 7,333Margarine 1.37kg 16,500 Margarine 1.25kg 15,000Egg 1.25 crates 31,250 Egg 1.25 crates 31,250Flavour 12.5 ml 2,800 Flavour 10ml 2,240B.P. 11.25g 374.75 B.P. 8.75g 291.25HQCF 6.6kg 13,200 W.F. 7.5kg 30,000Labour 3,750 Labour 3,750Fuel 3,125 Fuel 3,125Out put: 68.75 pieces Out put: 73.75 piecesUnit price: <22000 Unit price: <2 2,000Total cost: <2 76,999.75 Total cost: c2 92,989.25Sales revenue: <2 137,500 Sales revenue: c2 147,500Operating profit: (2 60,500.25 Operating profit: c2 54,510.75Cost per unit product: <2 1,136.85 Cost per unit product: <2 1,250.20Profit per unit put: <2 863.14 Profit per unit product:<2 749.79
Return on investment: <2 761.03 Return on investment: <2 600.46SOURCE: FIELD SURVEY DATA (2004)
82
University of Ghana http://ugspace.ug.edu.gh
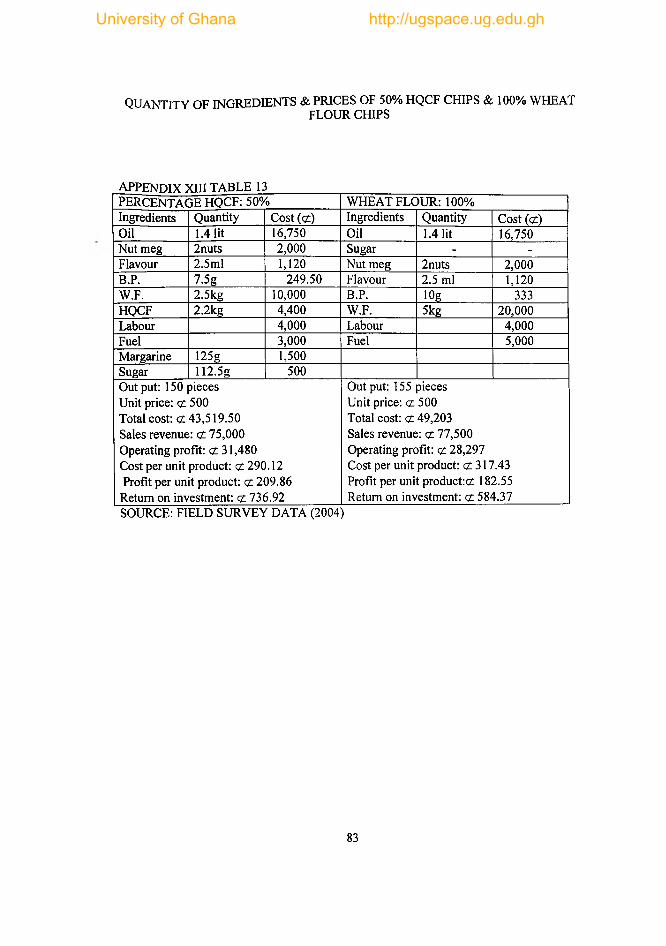
QUANTITY OF INGREDIENTS & PRICES OF 50% HQCF CHIPS & 100% WHEATFLOUR CHIPS
APPENDIX XIII TABLE 13PERCENTAGE HQCF: 50% WHEAT FLOUR: 100%Ingredients Quantity Cost (ct) Ingredients Quantity Cost (<z)Oil 1.4 lit 16,750 Oil 1.4 lit 16,750Nut meg 2nuts 2,000 Sugar - -
Flavour 2.5ml 1,120 Nut meg 2nuts 2,000B.P. 7.5g 249.50 Flavour 2.5 ml 1,120W.F. 2.5kg 10,000 B.P. 10g 333HQCF 2.2kg 4,400 W.F. 5 kg 20,000Labour 4,000 Labour 4,000Fuel 3,000 Fuel 5,000Margarine 125g 1,500Sugar 112.5g 500Out put: 150 pieces Unit price: cz 500 Total cost: cz43,519.50 Sales revenue: <z 75,000 Operating profit: <z 31,480 Cost per unit product: ct 290.12 Profit per unit product: cz 209.86 Return on investment: c,1736.92
Out put: 155 pieces Unit price: ct 500 Total cost: cz 49,203 Sales revenue: cz 77,500 Operating profit: cz 28,297 Cost per unit product: cz 317.43 Profit per unit product: cz 182.55 Return on investment: ct 584.37
SOURCE: FIELD SURVEY DATA (2004)
83
University of Ghana http://ugspace.ug.edu.gh

QUANTITY OF INGREDIENTS OF 50% HQCF MEAT PIE & 100% WHEAT FLOURMEAT PIE
APPENDIX XIV TABLE 14PERCENTAGE HOCF: 50% WHEAT FLOUR: 100%ingredients Quantity Cost (<z) Ingredients Quantity Cost (<2)Margarine 500g 6,000 Margarine 500g 6,000B.P. 10s 333 B.P. 10g 333Nut meg 4nuts 2,000 Nut meg 4 nuts 2,000Corned beef 200g 7,500 Corned beef 200g 7,500Oil 1.3 lit 16,000 Oil 1.51it 16,000W.F. 2.5kg 10,000 W.F. 5kg 20,000HQCF 2.2kg 4,400 Fuel 4,500Fuel 4,500 Labour 6,000Labour 6,000Out put: 240 pieces Unit price: <2 500 Total cost: a 56,733 Sales revenue: £120,000 Operating profit: c1 63,267 Cost per unit product: <2 238.38 Profit per unit product: <2 263.60
Return on investment: <z 1,115.33
Out put: 250 pieces Unit price: c2 500 Total cost: <z 62,333 Sales revenue: c2 125,000 Operating profit: a: 62,667 Cost per unit product: <2 246.33 Profit per unit product-.cz: 250.66 Return on investment: <2 1,005.48
SOURCE: FIELD SURVEY DATA (2004)
84
University of Ghana http://ugspace.ug.edu.gh

APPENDIX XVI
STRUCTURED QUESTION FOR THE HIGH QUALITY CASSAVA FLOUR PROCESSOR
1 ■ Which area do you receive cassava supply from?
2. In what units do you purchase your cassava?
3. For one cycle of production / one operation what quantity of cassava is used?
4. How much is the price o f this quantity?
5. In what units do you sell the final products?
6. How many units are produced from one operation?
7. How much do you sell the final product from one operation?
8. Please list the tools/ equipment used in performing the following activities.
a) Peeling;.............................................................
b) Washing;...............................................................
c) Dewatering;.............................................................
d) Disintegration;............................................................
e) S ifting;..,...................................................................
f) Drying;........................................................................
g) Milling;.........................................................................
85
University of Ghana http://ugspace.ug.edu.gh
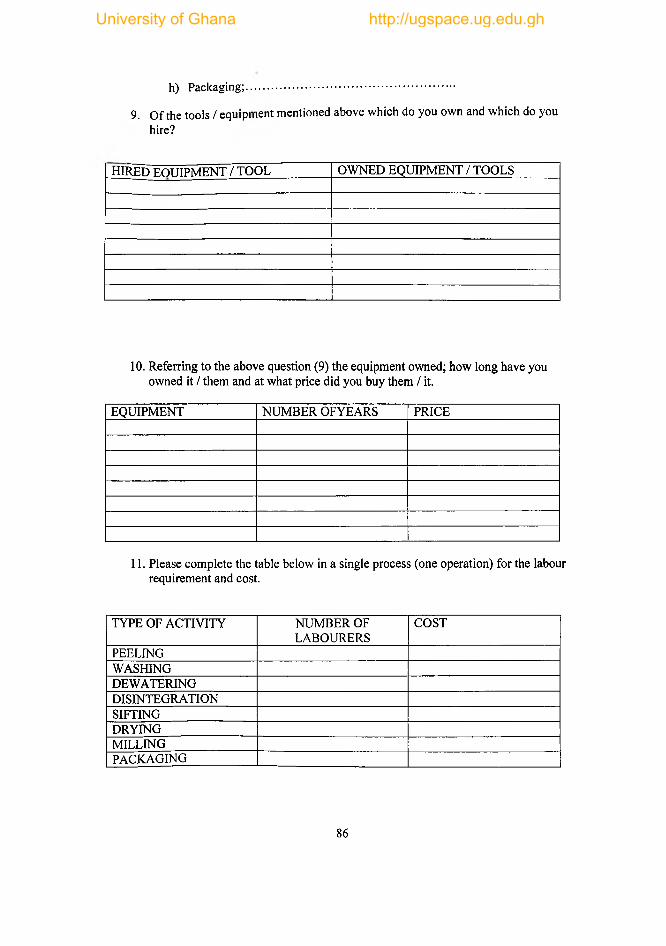
h) Packaging;.....................................................................
9. Of the tools / equipment mentioned above which do you own and which do you hire?
h ir e d EQUIPMENT / TOOL OWNED EQUIPMENT / TOOLS
10. Referring to the above question (9) the equipment owned; how long have you owned it / them and at what price did you buy them / it.
EQUIPMENT NUMBER OFYEARS PRICE
11. Please complete the table below in a single process (one operation) for the labour requirement and cost.
TYPE OF ACTIVITY NUMBER OF LABOURERS
COST
PEELINGWASHINGDEWATERINGDISINTEGRATIONSIFTINGDRYINGMILLINGPACKAGING
86
University of Ghana http://ugspace.ug.edu.gh

12. How long have you been producing HQCF?
13. Why do you prefer to process cassava into HQCF but not any other cassava-based product?
SUCCESS DRIVERS AND CONSTRAINTS
14. Is processing of cassava roots into HQCF profitable?
15. If yes give reasons; if no give reasons.
YES.
Reasons......................................................................................
NO.
Reasons
16. Do you consider the following as some of the major problems affecting the production of HQCF in this area?
a) Distance from the mill
87
University of Ghana http://ugspace.ug.edu.gh

b) Storage roomc) Frequent breakdown of the screw presserd) Harvesting of cassavae) Distance from the farmf) Micro-financeg) Lack o f washing toolsh) Lack of processing materialsi) Lack o f tools for peeling j) Drying spacek) Packing materials
17) Yes / No
18) If yes how do you rank them?
IDENTIFIED PROBLEMS RANKING
19.What are your reasons for the rankings?
IDENTIFIED PROBLEM RANKING REASON
University of Ghana http://ugspace.ug.edu.gh
20.What suggestions will you offer for the identified problems?
IDENTIFIED PROBLEM SUGGESTIONS
21. Referring to question (17) if no what are the problems?
89
University of Ghana http://ugspace.ug.edu.gh

APPENDIX XVII
STRUCTURED QUETIONNAIRE FOR THE GARI PROCESSOR
1. Which area do you receive cassava supply from?
2. In which units do you purchase your cassava?
3. For one cycle of production / one operation what quantity of cassava is used?
4. How much is the price of this quantity?
5. In what unit do you sell the final product?
6. How many units are produced from one operation?
7. How much do you sell the final product from one cycle o f production?
8. Please list the tools / equipment used in performing the following activities.
a) Peeling;...................................................
b) Washing;...................................................
c) Grating;......................................................
d) Draining;...................................................
e) Dewatering;................................................
f) Disintegrating;............................................
g) Sifting;........................................................
h) Roasting;.......................................................
90
University of Ghana http://ugspace.ug.edu.gh

i) Sieving;..........................................................
j) Packing;.......................................................................
9. Of the tools / equipment mentioned above which do you own, and which do you hire?
h ir e d e q u ip m e n t OWNED EQUIPMENT
10. Referring to the above question (9) the equipment owned, how long have you owned them / it, what price you bought them / it.
EQUIPMENT NUMBER OF YEARS PRICE
11. Please complete the table below in a single processing / operation for labour requirement and cost.
TYPE OF ACTIVITY NUMBER OF LABOURERS
COST
12. How long have you been producing gari?
91
University of Ghana http://ugspace.ug.edu.gh

13. Why do you prefer to process cassava into gari but not any other cassava-based product.
92
University of Ghana http://ugspace.ug.edu.gh
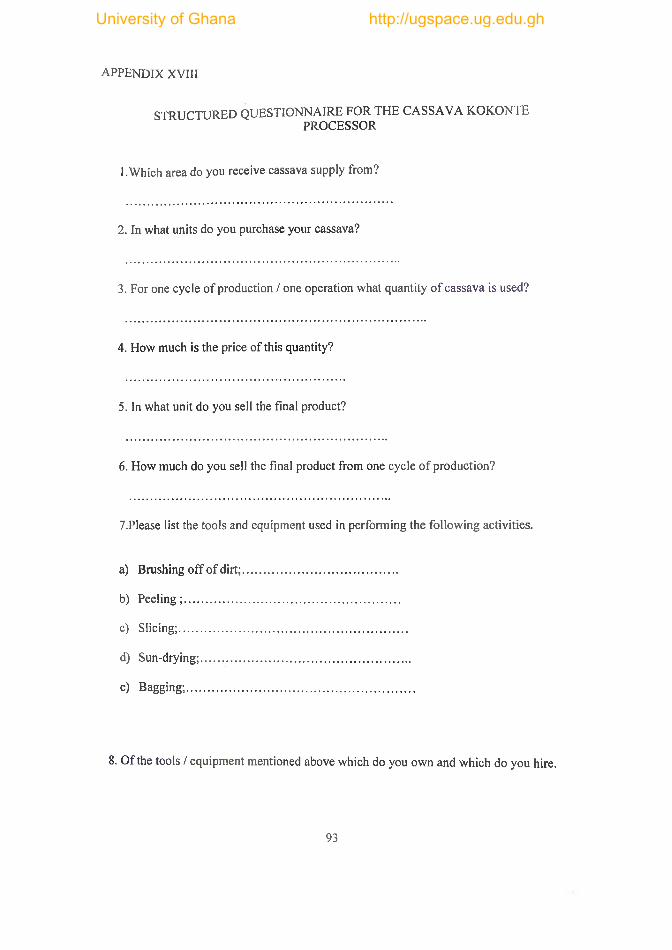
a p p e n d ix XVIII
STRUCTURED QUESTIONNAIRE FOR THE CASSAVA KOKONTEPROCESSOR
1.Which area do you receive cassava supply from?
2. In what units do you purchase your cassava?
3. For one cycle of production / one operation what quantity of cassava is used?
4. How much is the price of this quantity?
5. In what unit do you sell the final product?
6. How much do you sell the final product from one cycle o f production?
7.Please list the tools and equipment used in performing the following activities.
a) Brushing off o f dirt;...................................................
b) Peeling;........................................................................
c) Slicing;............................................................................
d) Sun-drying;......................................................................
e) Bagging;............................................................................
8. Of the tools / equipment mentioned above which do you own and which do you hire.
93
University of Ghana http://ugspace.ug.edu.gh

h ir e d e q u ip m e n t OWNED EQUIPMENT
9.Referring to the above question (8); equipment / tools owned and how long you have owned them / it and what price you bought it.
EQUIPMENT/TOOLS NUMBER OF YEARS PRICE
10. Please, complete the following table below in a single processing (one operation) for labour requirement and cost.
TYPE OF ACTIVITY NUMBEROFLABOURERS
COST
Brushing off o f dirtPeelingSlicingSun-dryingBagging
11 .How long have you been producing cassava chips?
12. Why do prefer to process cassava into chips but not any other cassava-based product.
94
University of Ghana http://ugspace.ug.edu.gh

APPENDIX XIX
STRUCTURED QUESTIONNAIRE FOR THE BAKERIES.
1. Where do you get your supply of HQCF from?
2. Do your suppliers always meet your demand?
3. How long have you been in the bakery business?
4. How long have you been using HQCF?
5. Please list the bakery product that uses composite flour.
6) Please complete the following table below in a single processing (one operation).
Name of Product;............................................
PERCENTAGE HQCF: WHEAT FLOURIngredients Quantity Cost Ingredient Quantity Cost
Out put:Unit price:Sales Revenue: Operating Profit
Out put:Unit price Sales Revenue: Operating Profit
95
University of Ghana http://ugspace.ug.edu.gh

.7.Please can you state any other cost that you incur in your production activity cycle of production?
a) Labour;.......................................................b) Kneading / Milling cost;................................................
University of Ghana http://ugspace.ug.edu.gh