analysis of the vibration modes in the diverter switch of ... · pdf filefunction is to...
TRANSCRIPT

Contemporary Engineering Sciences, Vol. 10, 2017, no. 20, 973 - 986
HIKARI Ltd, www.m-hikari.com
https://doi.org/10.12988/ces.2017.7996
Analysis of the Vibration Modes in the Diverter
Switch of Load Tap Changer
Edwin Rivas
Universidad Distrital Francisco José de Caldas, Bogotá, Colombia
José Ignacio Rodríguez
Universidad Distrital Francisco José de Caldas, Bogotá, Colombia
Cesar Hernández
Universidad Distrital Francisco José de Caldas, Bogotá, Colombia
Copyright © 2017 Edwin Rivas, José Ignacio Rodríguez and Cesar Hernández. This article is
distributed under the Creative Commons Attribution License, which permits unrestricted use,
distribution, and reproduction in any medium, provided the original work is properly cited.
Abstract
In this article, the vibration modes of a load tap changer are analyzed along with
their application coordinates their implication in the response of an experimental
temporary signal acquired from the changer, the natural and resonance frequencies
and the proportions in the displacements of the charger’s commuter. They are
simulated and analyzed with the finite element calculation software Algor™. The
experimental data are obtained by measuring vibration signals in an on-load tap
changer (OLTC) at the moment of changing taps; with a mono-axial accelerometer
located over the vertical axe (head of the regulator). The acquired experimental data
are analyzed with MATLAB™ software with the Wavelet discrete transform and
the Fast Fourier Transform.
Keywords: CTC, selector, commuter, change of tap, frequencies, and vibration
modes
1. Introduction
An on-load tap changer (OLTC) is the only part that moves in a transformer [1]. Its
function is to perform the change operation from one tap to another in the regulation

974 Edwin Rivas et al.
winding. It is a response mechanism to a voltage variation in the network due to
load variations. The OLTC keeps the transformer’s output voltage constant by
modifying the number of spirals in one of the windings without interrupting the
load’s current.
The OLTC is submitted to mechanical efforts and important electrical events.
Hence, the OLTC is one of the transformer elements with the highest failure index:
according to an international poll [2], 40% of the failures in a transformer are
produced in the CTC.
The state of some elements of the changer (commutation resistances, contacts, etc.)
can be evaluated with periodical inspections. However, these inspections require
that the transformer is discharged, i.e. out of service for a relatively long time. This
supposes a considerable expense and hiring qualified technicians and operators.
Additionally, some of the parts of an OLTC (contacts, pre-selector, etc.) cannot be
inspected due to their location within the transformer’s tank.
The purpose of this work is to implement a methodology to determine the range of
frequencies where a commuter’s contacts should be when they are in good shape.
Hence, the vibration modes of an OLTC have been correlated with the vibration
frequencies coming from real signals of an operational OLTC.
The OLTC was implemented by modeling the commuter and performing
simulations with the finite element calculation software Algor™ of commercial use.
The real OLTC signals were processed with a Hilbert transform (envelope of the
vibration signal) to then apply the Wavelet discrete transform.
With the purpose of determining diagnosis identifiers such as the number of
vibration impulses, amplitude, time between impulses and frequency ranges where
these impulses lie, the Fast Fourier transform was applied to the vibration signal in
order to corroborate the frequency range. This work pretends to determine if the
system’s excitation frequency is very close to the OLTC’s natural frequency since
there could be a resonance phenomenon causing damages in the OLTC’s structure
and even collapse.
2. General Structure of an OLTC
A basic OLTC’s structure (Figure 1) has these elements [3]:
1. Activation and control closet.
2. Transmission mechanism.
3. Theme selector (Switch selector) y pre-selector.
4. Regulator head.
5. Commuter or rupter (Diverter switch).
1. Activation and control closet: It is located in one of the transformer’s side

Analysis of the vibration modes 975
exteriors and contains the control and maneuvering elements of the OLTC
(engine start contacts, control push-buttons, electric engine, etc.)
2. Transmission mechanism: To change one tap to another, the OLTC is moved
by a motorized driving mechanism through the vertical and horizontal
transmission axes and angle redirection boxes. Any anomaly in the operation of
any of the transmission mechanism can cause a deregulation, i.e. a situation in
which the real position of the OLTC does not correspond to the indicated
position in the control closet.
3. Tap selector: Conduces the load’s current from the tap in use and selects the
next tap. It may include a pre-selector or inverter that connects the main winding
with the regulation winding in an additive or subtractive way allowing the
duplication of the n positions.
4. Head of the OLTC: It has inside the energy accumulation mechanisms as well
as the activation of the selector.
5. Commuter or rupter: It performs the commutation, i.e. passes from one tap to
another without interrupting the service. It does so by using transitional
resistances that limit the current when it operates short-circuiting two taps
temporarily during change. The commuter is immersed in an oil deposit that is
independent from the transformer’s tank.
Figure 1. Basic structure of an OLTC.
3. Vibration Signals of an OLTC
The OLTC’s vibration signal (Figure 2) while changing a tap have been registered
with an accelerometer located in the head of the commuter calculating the vertical
vibrations (axis y).
3.1 Signal treatment
The vibration signal has normalized and generated an envelope (Fig. 2) through the
application of the Hilbert transform [3]. Posteriorly, the discrete Wavelet transform
976 Edwin Rivas et al.
(DWT) has been applied; a bi-orthogonal mother Wavelet 3.3 to find the main
diagnosis indicators.
The DWT acts over the signal similarly to a bank of low-pass and high-pass filters
decomposing the signal into an approximation function with the low-pass filter and
a detailed signal with the high-pass filter which reduces the operation frequencies
of the operator (Figure 3).
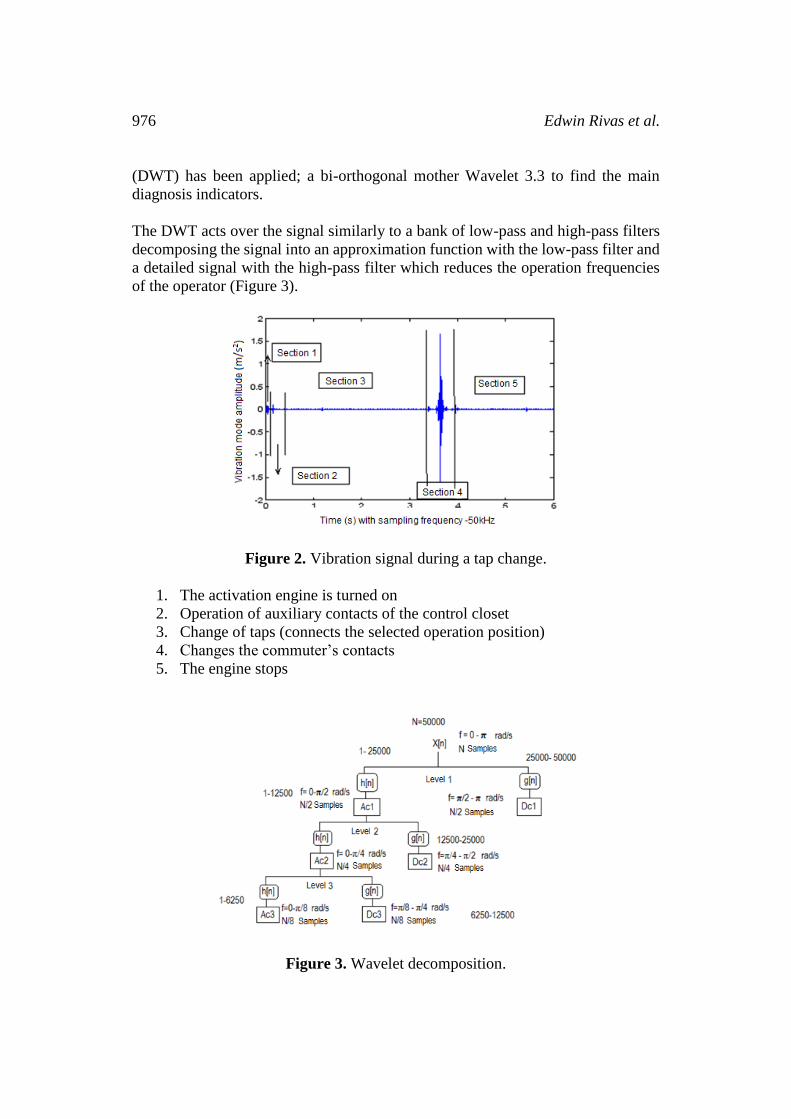
Figure 2. Vibration signal during a tap change.
1. The activation engine is turned on
2. Operation of auxiliary contacts of the control closet
3. Change of taps (connects the selected operation position)
4. Changes the commuter’s contacts
5. The engine stops
Figure 3. Wavelet decomposition.

Analysis of the vibration modes 977
By applying the reverse DWT and smoothing the signal with splines, the amplitude,
the temporary location and the vibration pulses’ frequency band are obtained [3]
(Figure 4).
Figure 4. Impulses of the vibration signal.
Table 1. Location and amplitude of the vibration signal impulses.
Impulses detected in signal 4-5-1 (red)
Location (s) Amplitude (m/s2)
Impulse 1 3,78684 0,1463021
Impulse 2 3,80944 0,085213
Impulse 3 3,8259 0,0500932
Impulses detected in signal 4-5-2 (blue)
Location (s) Amplitude (m/s2)
Impulse 1 3,78678 0,1281312
Impulse 2 3,81164 0,0642687
Impulse 3 3,82576 0,0471563
For the detected impulses, their respective frequencies are obtained (Table 2) which
are located in the 0 – 6250 Hz frequency range that corresponds to the third level
of decomposition in the vibration signal.
Table 2. Frequencies of the vibration signal.
Impulse F1 F2 F3
1 552.427 Hz 3716.27 Hz 4419.417 Hz
2 602.426 Hz 3716.27 Hz 4052.62 Hz
3 444.839 Hz 3558 Hz 4052.62 Hz
978 Edwin Rivas et al.
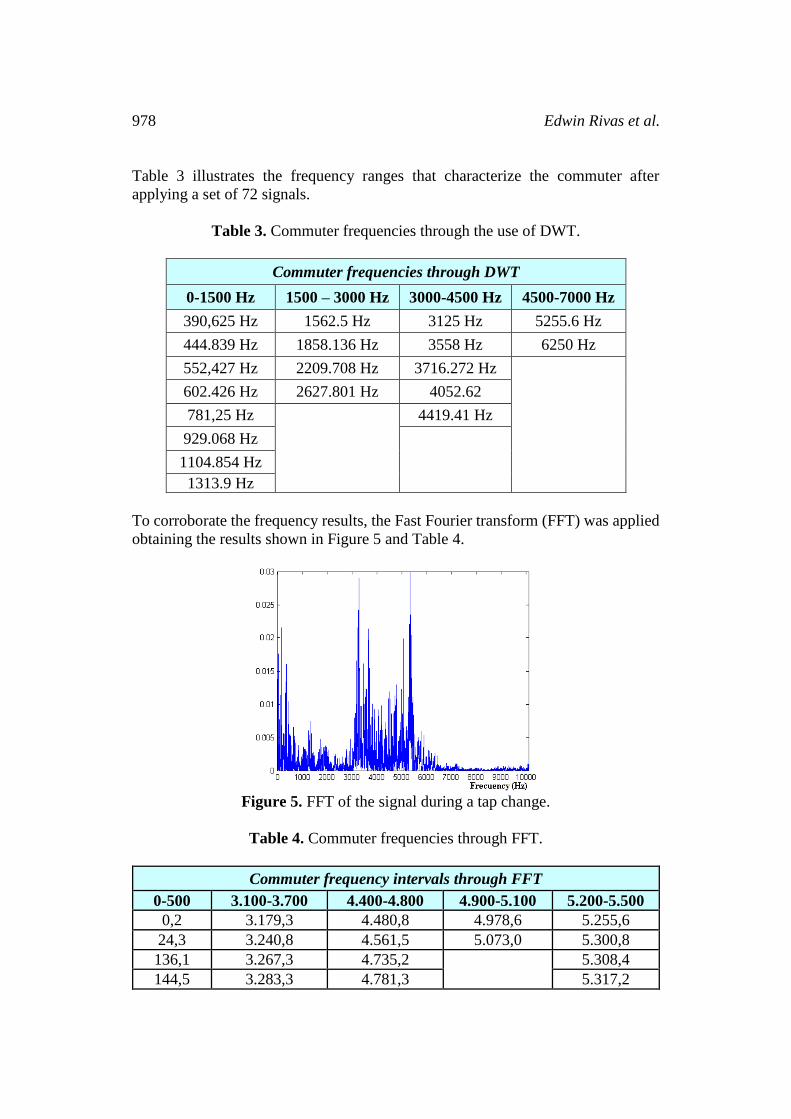
Table 3 illustrates the frequency ranges that characterize the commuter after
applying a set of 72 signals.
Table 3. Commuter frequencies through the use of DWT.
Commuter frequencies through DWT
0-1500 Hz 1500 – 3000 Hz 3000-4500 Hz 4500-7000 Hz
390,625 Hz 1562.5 Hz 3125 Hz 5255.6 Hz
444.839 Hz 1858.136 Hz 3558 Hz 6250 Hz
552,427 Hz 2209.708 Hz 3716.272 Hz
602.426 Hz 2627.801 Hz 4052.62
781,25 Hz
4419.41 Hz
929.068 Hz
1104.854 Hz
1313.9 Hz
To corroborate the frequency results, the Fast Fourier transform (FFT) was applied
obtaining the results shown in Figure 5 and Table 4.
Figure 5. FFT of the signal during a tap change.
Table 4. Commuter frequencies through FFT.
Commuter frequency intervals through FFT
0-500 3.100-3.700 4.400-4.800 4.900-5.100 5.200-5.500
0,2 3.179,3 4.480,8 4.978,6 5.255,6
24,3 3.240,8 4.561,5 5.073,0 5.300,8
136,1 3.267,3 4.735,2
5.308,4
144,5 3.283,3 4.781,3 5.317,2

Analysis of the vibration modes 979
Table 4. (Continued): Commuter frequencies through FFT.
149,5 3.455,0 4.788,9
5.337,2
298,8 3.472,0
5.372,0
323,0 3.535,5 5.394,5
335,3 3.568,3 5.402,0
347,2 3.653,1 5.410,3
442,7 3.683,3 5.455,5
Given that DWT is capable of determining the frequency range of the impulses
without losing temporary resolution, the results obtained with this method were the
ones used.
4. Commuter Modeling
The OLTC commuter has been modeled in SolidWorks™ and has been divided into
three sections to facilitate its simulation and posterior analysis: Support cylinder
(Figure 6), energy accumulator (Figure 7) and mobile contact disc (Figure 8).
Screws and junction items were not considered due to their irrelevance in the
simulation process.
Figure 6. Support cylinder with
OLTC head.
Figure 7. Energy accumulators.
Figure 8. Disc for mobile contacts.

980 Edwin Rivas et al.
5. Simulation and Modal Analysis of the Commuter
With the purpose of determining the best surrounding condition to find the
frequencies or vibration modes that the commuter is subjected to, two types of
simulations were performed with the Algor™ software:
a) Without fixating the set’s bases (as a rigid body)
b) Fixating the bases of the cylinder
The different vibration modes were compared to the frequencies for the scenarios
of rigid body and fixed bases (Figure 9). It was concluded that frequencies coincide
for different modes so that surrounding condition of the commuter is not a
determining factor. Hence, the simulation process considers the bases as being
fixed.
Figure 9. Natural frequencies for the contour conditions.
For the cylinder support, the energy accumulator and the disc for mobile contacts,
70, 70 and 150 simulation modes were carried out respectively. The results are
shown in this section.
5.1 Support cylinder
Table 5, corresponding to Figure 10, shows the most significant modes (with the
highest modal displacement in the y axis). These modes are the ones that pick up
the most energy.
Table 5. The most significant modes for the cylinder.
Support cylinder
Mode Frequency (Hz) Modal Mass (%)
X Axis Y Axis Z Axis
4 1,16E+03 0,92 2,36 1,07
6 1,30E+03 1,64 4,23 1,82
7 1,52E+03 0,02 38 0,02
12 2,17E+03 0,28 33,7 0,22
62 5,79E+03 0.03 2.30 0.04

Analysis of the vibration modes 981
Figure 10. Percentage of mass displaced in the y axis.
In Figure 11 and 12 the modes 7 and 12 are shown which produce the highest
displacements in the cylinder.
Figure 11. Modal mass displacement
in mode 7.
Figure 12. Modal mass displacement
in mode 12.
5.2 Energy accumulator
The mode with the highest modal mass displacement is mode 1 (Table 6) as the
other modes have an almost null displacement (Figure 13). The modal mass
displacement is shown in Figure 14.
Table 6. Significant mode (mode 1) to the accumulator.
Energy accumulator
Mode Frequency (Hz) Modal Mass (%)
Axis X Axis Y Axis Z
1 1,10E+03 0.00 5.34 0.04
5.3 Disc of mobile contacts
For this element, 100% of the modal displacement is almost reached between modes
60 and 73 (Figure 15), Table 7. The modal mass displacement of these modes is
shown in Figure 16 and 17.

982 Edwin Rivas et al.
Figure 13. Percentage of mass displaced in the energy accumulator.
Figure 14. Modal mass displacement in mode 1 of the energy accumulator.
Table 7. Most significant modes for the disc of mobile contacts.
Disc of mobile contacts
Mode Frequency (Hz) Modal Mass (%)
Axis X Axis Y Axis Z
60 2,12E+03 0.00 22.82 0.00
73 2,34E+03 0.00 73.27 0.00

Analysis of the vibration modes 983
Figure 15. Percentage of mass displaced in the y axis.
Figure 16. Modal mass displacement
in mode 60.
Figure 17. Modal mass displacement
in mode 73.
6. Correlation: Operation Frequencies – Natural Frequencies
For the cylinder (Figure 18), the energy accumulator (Figure 19) and disc of mobile
contacts (Figure 20), the natural frequencies that are closest to the OLTC operation
frequencies were correlated. These natural frequencies do not represent a danger to
the commuter since they have an almost null or null displacement.
Figure 18. Correlation of
frequencies for the support cylinder.
Figure 19. Correlation of
frequencies for the energy
accumulator.

984 Edwin Rivas et al.
Figure 20. Correlation of frequencies for the disc of mobile contacts.
For the support cylinder (Figure 21, Table 7), the energy accumulator (Figure 22,
Table 8) and the disc of mobile contacts (Figure 23, Table 9), the frequencies
(operation frequencies versus natural frequencies) that produce large displacements
in the commuter were correlated. If it operates during a certain time at this
frequency, the resonance phenomenon can occur, as long as it has the same module
and direction than the natural frequency.
Figure 21. Correlation of frequencies for the support cylinder.
Table 7. Coinciding frequencies for the support cylinder.
Operation
Frequency (Hz)
Natural
Frequency (Hz)
Frequency range
(Hz)
1 1104.854 1160 0-1500
2 1313.9 1300 0-1500
3 1562.5 1520 1500-3000
4 2209.708 2170 1500-3000
5 6250 5790 4500-7000

Analysis of the vibration modes 985
Figure 22. Correlation of frequencies for the energy accumulator
Table 8. Coinciding frequencies for the energy accumulator.
Frecuencia de
Operación(Hz)
Frecuencia
Natural(Hz)
Rango
Frecuencia(Hz)
1 1104.854 1100 0-1500 Hz
Figure 23. Correlation of frequencies for the disc of mobile contacts
Table 9. Coinciding frequencies for the disc of mobile contacts.
F. Operation F. Natural Section
1 1104.854 1160 0-1500 Hz
2 1313.9 1300 0-1500 Hz
The natural frequency that is closest to the operation frequency is 1300 Hz, which
belongs to mode 6 (1300 Hz, 4.23 %). The natural frequency of 1100 Hz (Table 8)
corresponds to mode 1 with a 5.34% displacement. For the disc of mobile contacts,
986 Edwin Rivas et al.
natural frequencies are slightly away from the commuter’s operation frequencies so
there would be no danger if resonance occurred.
7. Conclusions
The frequency modes are not exactly obtained in a dynamic system so the OLTC’s
own vibration modes can be identified in the experimental vibration signal. Once
the vibration modes’ interval of frequencies is identified, a defect, an anomaly or
malfunction can be detected when comparing two vibration signatures. The
amplitude related to the frequency of one of the signatures increases or changes
abruptly in its frequency interval.
To obtain the natural frequencies with finite element program, the adequate
selection of the material’s rigidity and mass are determining factors in the
simulation process. At higher rigidity and lower mass, the resulting frequencies are
more elevated.
The selected contour condition during the simulation is not a determining factor in
the analysis since the obtained frequency values for different conditions are almost
the same. The only variation was in the mode number containing that frequency
which varies due to a different fixation of the pieces.
In the vibration modes whose natural frequencies are very close to the operation
frequencies, a null displacement (or almost null) in the y axis was registered which
would imply no energy accumulation, hence no danger for the functioning of the
commuter’s components.
For the commuter, the modes with large modal displacements where the natural
frequency is close to the operation frequency had a frequency of 1300 Hz in mode
6 (4.23%) corresponding the support cylinder and 1100 Hz in mode 1 (5.34%)
corresponding to the energy accumulator. During the tap change, the commuter
could enter in resonance mode and produce a vibration state where it could not
evacuate the stored energy and eventually collapse.
References
[1] C. Bengtsson, Status and trends in transformer monitoring, IEEE Trans. Power
Delivery, 11 (1996), 1379-1384. https://doi.org/10.1109/61.517495
[2] CIGRE SC 12 WG 12.05, An international survey on failures in large power
transformers in service, Electra, 88 (1983), 21-47.
[3] E. Rivas, Valoración del Estado de un OLTC Mediante Vibraciones: Análisis
en Tiempo-Frecuencia, M.S. Thesis, Dep. Electrical, Carlos III de Madrid Univ.,
Madrid, Spain, 2007.
Received: September 18, 2017; Published: November 1, 2017