analysis of the impact of a tag recommendation system in a
TRANSCRIPT

Analysis of the impact of a tag recommendation
system in a real-world folksonomy
Frederic Font∗1, Joan Serra2, and Xavier Serra1
1Universitat Pompeu Fabra2Artificial Intelligence Research Institute (IIIA-CSIC)
1Universitat Pompeu Fabra
Abstract
Collaborative tagging systems have emerged as a successful solu-tion for annotating contributed resources to online sharing platforms,facilitating searching, browsing, and organising their contents. To aidusers in the annotation process, several tag recommendation methodshave been proposed. It has been repeatedly hypothesized that thesemethods should contribute to improve annotation quality as well as toreduce the cost of the annotation process. It has been also hypoth-esized that these methods should contribute to the consolidation ofthe vocabulary of collaborative tagging systems. However, to date, noempirical and quantitative result supports these hypotheses. In thiswork, we deeply analyse the impact of a tag recommendation systemin the folksonomy of Freesound, a real-world and large-scale onlinesound sharing platform. Our results suggest that tag recommendationeffectively increases vocabulary sharing among users of the platform.Also, tag recommendation is shown to contribute to the convergenceof the vocabulary as well as to a partial increase in the quality of anno-tations. However, according to our analysis the cost of the annotationprocess does not seem to be effectively reduced. Our work is relevantto increase our understanding about the nature of tag recommendationsystems, and points to future directions for the further development ofthose systems and their analysis.
∗This work has been supported by BES-2010-037309 FPI from the Spanish Min-istry of Science and Innovation, TIN2009-14247-C02-01 from the Spanish Government(F.F.), 2009-SGR-1434 from Generalitat de Catalunya (J.S.), JAEDOC069/2010 fromCSIC (J.S.), FSE2007-2013 E. U. Social funds (J.S.), and FP7-2007-2013 / ERC grantagreement 267583 (CompMusic; F.F. and X.S.). Author’s addresses: F. Font, Music Tech-nology Group, Universitat Pompeu Fabra, Barcelona, Spain; email: [email protected];J. Serra, Artificial Intelligence Research Institute (IIIA-CSIC), Spanish National ResearchCouncil, Bellaterra, Spain; email: [email protected]; X. Serra, Music Technology Group,Universitat Pompeu Fabra, Barcelona, Spain; email: [email protected].
1

1 Introduction
Online sharing platforms make extensive use of semantically-meaningful tex-tual labels, called tags, to describe and annotate its contents. The use ofthese tags provides a means for searching, browsing and organising the re-sources of the platform. Systems that provide the functionality for makingthese annotations are normally referred to as collaborative tagging systems.In collaborative tagging systems, users of the online platform have the re-sponsibility of annotating the content. Every relation between a tag and acontent resource performed by a user of the system can be identified as atag application (Sen et al., 2006). We refer to the set of all distinct tagsthat are assigned to a particular resource as the tagline of the resource. Theaggregate of all tag applications, which relate tags, resources and users ofan online sharing platform, is normally known as the folksonomy (VanderWal, 2007).
In general, tags introduced using collaborative tagging systems are notrestricted in its form, and users can freely create new tags at any time (Mar-low et al., 2006; Sen et al., 2006; Wagner et al., 2014). This provides a greatflexibility to collaborative tagging systems as opposed to other systems thatmake use of pre-defined vocabularies, and in which users are not allowedto annotate content using terms that are not included in these vocabular-ies (Robu et al., 2009; Wagner et al., 2014). With non-restricted vocabular-ies, users introduce new tags when the annotation of a particular resourcerequires it. Hence, they easily adapt to the evolution of the platform’s con-tent. Furthermore, it has been suggested that users feel more comfortableduring the annotation process when they are not restricted to the use of apre-defined vocabulary (Robu et al., 2009).
Collaborative tagging systems suffer from a number of well-known prob-lems including tag scarcity, the use of different tags to refer to a single con-cept (synonymy), the ambiguity in the meaning of certain tags (polysemy),typographical errors, the use of user-specific naming conventions, or the useof different languages (Halpin et al., 2006). It is often discussed whether thefolksonomy of a collaborative tagging system, after a certain time of beingin use, reaches a point of implicit consensus. In that point of consensus,the vocabulary is supposed to converge to a certain set of tags and taggingconventions that are widely adopted by all users of the system (Halpin et al.,2006; Sen et al., 2006; Sood et al., 2007; Robu et al., 2009; Wagner et al.,2014). Such a consensus implies more coherent resource annotations andbetter opportunities for searching, browsing, and organising content (Spi-teri, 2013). Additionally, it leverages the value of the folksonomy as a sourceof knowledge mining (Wagner et al., 2014). Some studies have analysed thisaspect, and the emergence of a consensus has been highlighted in several oc-casions (Robu et al., 2009; Wagner et al., 2014). According to these studies,the emergence of consensus depends on several factors, one of them being
2

the way in which users are exposed to the annotations performed by otherusers. In general, the more users are exposed to the tagging conventions ofother users, the fastest should the consensus emerge.
In order to try to overcome some of the issues of collaborative taggingsystems, tag recommendation systems can be employed to suggest poten-tially relevant tags during the annotation process of a resource (Jaschkeet al., 2007). These systems are generally based on the analysis of the con-tent of the resources being annotated, or in the folksonomy of a collaborativetagging system. Former systems normally use feature extraction techniquesto analyse content resources, and further training of machine learning mod-els that can predict tags based on the extracted features (e.g., Li and Wang2008, Turnbull et al. 2008, Toderici et al. 2010). Folksonomy-based sys-tems normally take advantage of tag co-occurrence information in previouslyannotated resources in order to provide relevant tag recommendations fornewly annotated resources (e.g., Sigurbjornsson and Zwol 2008, Garg andWeber 2008, De Meo et al. 2009, Ivanov et al. 2010, Font et al. 2013b).
It can be intuitively hypothesized that a tag recommendation system,independently of its nature, should have an impact on the folksonomy ofa collaborative tagging system. In fact, this has been suggested by manyauthors. Golder and Huberman 2006 hypothesize that a tag recommen-dation system should help consolidating the tag vocabulary across users.The same idea is suggested by Jaschke et al. 2007 and Marlow et. al. 2006.Jaschke et al. 2007; 2012 also hypothesize that tag recommendation shouldsimplify the process of finding good tags for the resources being describedand thus increases the chances of getting resources annotated. Similarly,Sood et al. 2007 hypothesize that by using a tag recommendation system,users can see how other users tag resources and better choose when to reusealready existing tags or when to create new ones. Therefore, tag recom-mendation should help alleviate synonymy problems and help vocabularyconvergence (Sood et al., 2007). These authors also hypothesize that the useof a tag recommendation system fundamentally changes the tagging processfrom being a generation process, where users must create tags from scratch,to being a recognition process, where users have to recognise valid tags froma list of suggestions. Zangerle et al. 2011 perform a study on hashtag rec-ommendation for Twitter1, a microblogging site, and hypothesize that theuse of hashtag recommendation should help homogenising hashtags. Finally,Wang et al. 2012 hypothesize that tag recommendation can improve boththe quality of tags and the efficiency of the tagging process, by clarifyingthe semantics of tags and reducing the manual cost of tagging.
Taking into consideration the previous statements, we can summarisethe expected impact of a tag recommendation in the folksonomy of a col-laborative tagging system in the following three hypotheses:
1http://www.twitter.com
3

1. Vocabulary convergence. A tag recommendation system should con-tribute to the convergence and consolidation of a shared vocabularyacross the users of a collaborative tagging system (Golder and Huber-man, 2006; Marlow et al., 2006; Jaschke et al., 2007; Sood et al., 2007;Zangerle et al., 2011).
2. Quality of annotations. A tag recommendation system should improvethe quality of annotations of the resources in an online sharing plat-form (Jaschke et al., 2012; Wang et al., 2012).
3. Cost of the annotation process. A tag recommendation system shouldreduce the cost of tagging, changing from a tag generation process toa tag recognition process (Sood et al., 2007; Jaschke et al., 2007; Wanget al., 2012).
As mentioned, there have been many studies proposing different tagrecommendation methods. Some of them evaluate the quality of the recom-mendations using data from real-world folksonomies (e.g., Sigurbjornssonand Zwol 2008, Jaschke et al. 2009, De Meo et al. 2009, Font et al. 2014b).Other studies are focused on analysing the characteristics of collaborativetagging systems (e.g., Marlow et. al. 2006, Halpin et. al. 2006, Golder andHuberman 2006, Farooq et. al. 2007, De Meo et. al. 2013). Nevertheless,we are not aware of any study performing a deep analysis of the impact ofa tag recommendation system into a real-world and large-scale folksonomy.Thus, the three previous hypotheses remain unverified and lack empiricalevidence.
In this work, we analyse the impact of a tag recommendation systeminto the folksonomy of Freesound, a sound sharing site with more than 3.7million registered users and 200,000 uploaded sounds (Font et al., 2013a). InFreesound, users upload sounds and then annotate them, yielding a narrowfolksonomy in which only the authors of the sounds can annotate them (Van-der Wal, 2005). The Freesound folksonomy features 1.5 million tag appli-cations involving 70,000 distinct tags and 10,000 different users (i.e., onlya small fraction of registered users do upload sounds and thus generate tagapplications). In 2013, eight years after Freesound was started, a tag rec-ommendation system was introduced. That tag recommendation system isa folksonomy-based system described in previous work by the authors (Fontet al., 2013b, 2014a,b). Here, we analyse the impact that this system hashad in the folksonomy of Freesound. For each one of the three hypothesesthat we summarised above, we define a series of metrics to illustrate them.Then, we compute these metrics for an extensive period of time comprising2.5 years of analysis data, and analyse the results putting special emphasison the changes observed before and after the introduction of tag recom-mendation. Our results give, for the first time, empirical and quantitativeevidence of the validity of some of the previous hypotheses. Specifically, our
4

Candidate tagselection
Classdetection
Aggregation ofcandidate tags
Selection of tagsto recommend
Figure 1: Block diagram of the tag recommendation system implemented inFreesound.
results show that the tag recommendation system effectively contributes tothe vocabulary convergence of the folksonomy, partially contributes to animprovement of annotation quality, but does not seem to significantly reducethe cost of the annotation process. Despite our evaluation methodology isonly applied to analyse the impact of a tag recommendation system in thecontext of Freesound, we believe that our results are indicative of the impactthat tag recommendation systems can potentially have in other collabora-tive tagging systems. In closing, some suggestions are made regarding howcould our analysis be extended, and tag recommendation systems be im-proved to further increase the impact on some of the analysed aspects suchas the quality of the annotations. Both the definition of the metrics and theanalysis of its results are also relevant contributions of the present work.
The rest of the paper is organised as follows. In Sec. 2, we briefly de-scribe the implemented tag recommendation system and define the proposedevaluation metrics and analysis methodology. The results for all evaluatedmetrics, along with discussions about their implications, are reported inSec. 3. In Sec. 4 we summarise our findings and discuss about the limita-tions of our analysis. We end this work in Sec. 5 by drawing some possiblefuture directions.
2 Methodology
2.1 Tag recommendation system
The tag recommendation system implemented in Freesound is based on tag-tag similarity matrices derived from the folksonomy of the same platform. Inthis section, we briefly describe its main components. Exhaustive descriptionand evaluation of the system can be found elsewhere (Font et al., 2013b,2014a,b).
Given a set of input tags TI, the system is able to output a set of rec-ommended tags TS. With that purpose, the system performs the followingsteps (Fig. 1):
5

1. Class detection: The first step consists in the classification of the inputtags TI into a set of H predefined audio classes. We defined H = 5audio classes (SoundFX, Soundscape, Sample, Music and Speech), andbuilt a ground truth by manually annotating 1,200 Freesound soundsper class (Font et al., 2014a). Using this ground truth, we traineda multivariate Bernoulli naive Bayes classifier, feeding it with thetaglines of the sounds. Then, given a set of input tags TI, the classifiercan predict which category Ch better fits the input. Accuracies rangebetween 75 and 95%, depending on the length of TI.
2. Candidate tag selection: Given the set of input tags TI, this stepselects a pool of candidate tags T l
C for each input tag TIl . We doso by choosing the top 100 most similar tags according to a tag-tagsimilarity matrix MCh
, which depends on the predicted class Ch ofthe previous step. Matrices MCh
are computed offline and consider-ing a model of the folksonomy of Freesound F , which is representedas a tripartite hypergraph G(F) = 〈V,E〉 (Mika, 2007; Font et al.,2013b). In this model, vertices are given by three finite sets of objects,V = U ∪T ∪R (users, tags and resources, respectively), and each edgeE = {{u, t, r}|(u, t, r) ∈ F} represents a tag application, embeddingthe relation between a tag t, a resource r (a sound), and the useru that performed that tag application. Given G, we derive a sparseassociation matrix D = {Di,j}, i = 1, . . . |R|, j = 1, . . . |T |, which rep-resents the associations between the |R| sounds and the |T | distincttags available in Freesound (di,j = 1 if sound ri is labeled with tag tj ,and di,j = 0 otherwise). We use the same classifier used in the classdetection step to predict the class of all sounds in the association ma-trix given their tag applications. Then, given D and the list of soundswe predicted for every class Ch, we can compute the different tag-tagsimilarity matrices by filtering out all columns from D correspondingto sounds which do not belong to a particular class and then perform-ing a matrix multiplication so that MCh
= DD′ (′ indicates matrixtransposition). Applying a simple normalisation to the elements ofMCh
, we obtain a matrix whose elements{Mti,tj
}correspond to the
cosine similarity between tags ti and tj on the context of a particularaudio class Ch (Font et al., 2013b, 2014b).
3. Aggregation of candidate tags: Given the sets T lC from the first step,
candidates are assigned a score ε and aggregated into a single listof tags with scores TA. Such score is determined by the candidatesimilarity-based ranking so that ε = 1 for the most dissimilar candidateto a given input tag and ε = N for the most similar one. The scoresof tags that are present in different sets of candidates T l
C are addedwhen aggregated to the final set TA (Font et al., 2013b).
6

Sound description
Name:Water stream calmed 3
river water
Tags:Separate tags with spaces. Join multi-word tags with dashes. For example: field-recording is a popular tag.
Suggested tags: (click on the tags to add them, click here to clear the recommendation)
stream creek brook flow waterfall trickle liquid
Figure 2: Screenshot of the interface of the tag recommendation systemimplemented in Freesound. The interface used in Freesound before the in-troduction of the tag recommendation system was exactly the same withoutthe list of tag suggestions at the bottom.
4. Selection of tags to recommend: Considering the scores in TA, thisstep determines a threshold ε to select the tags that are finally recom-mended. The threshold ε is set to be the 85% of the maximum scorein TA. Tags in TA are sorted by their score and those that satisfy ε ≥ εare outputted as TS, the final set of recommended tags (Font et al.,2013b).
2.2 Tag recommendation interface
Fig. 2 shows a screenshot of the interface for the tag recommendation sys-tem implemented in Freesound. In it, we can see the set of input tagsTI ={river, water} and the set of suggested tags TS ={stream, creek,brook, flow, liquid, waterfall, trickle}. The list of suggested tags ap-pears at the bottom of the text area that users use to type their tags. Onaverage, the recommendation system produces lists of 4 suggested tags (Fontet al., 2014b). However, if the recommendation system produces a list withmore than 30 tags (|TS| ≥ 30), only the first 30 are shown in the interface.This list of suggestions is automatically refreshed each time that users typea new tag (i.e., every time that TI changes). This means that during theannotation process of a particular sound, several lists of suggested tags canbe presented to the user. To introduce tags from the list of suggestions,users can either click on the elements of the list or type them manually asthey would do to introduce tags that are not in the list. Freesound does notprovide any kind of autocomplete functionality when manually typing tags.
7

Proposed metrics and expected observations to evaluate hypotheses. Forthe case the tag frequency distribution metric, we expect it to be moreevenly distributed across the frequency range after the introduction of tagrecommendation, specially reinforcing agreement on tags with less frequency.Hypothesis Metric Expectation
Vocabulary Percentage of new tags Decreaseconvergence Average user vocabulary size Increase
User vocabulary sharing IncreaseSound vocabulary sharing Increase
Quality of Average tagline length Increaseannotations Percentage of misspelled tag applications Decrease
Tag frequency distribution Even (see table caption)Subjective annotation quality Increase
Cost of the Average tag application time Decreaseannotation process Average percentage of correctly predicted tags Similar to (Font et al., 2014b)
2.3 Analysis metrics
To assess the impact that the tag recommendation system has on the folkson-omy of Freesound, we define a series of metrics which are meant to illustratethe three hypotheses presented in Sec. 1. We illustrate each hypothesis withmore than one metric, as we believe the relevance of the analysis partic-ularly remains on the observation of changes simultaneously happening inseveral metrics, rather than the observation of a single metric being affectedafter the introduction of the tag recommendation system. Table 2.3 showsa list of the defined metrics, along with the changes we expect to observewhen comparing data before and after the introduction of the tag recom-mendation system. Formal metric definitions subsequently follow, groupedby hypothesis.
2.3.1 Vocabulary convergence
• Percentage of new tags: This metric represents the percentage of tagapplications performed during a given day of our analysis period whichinvolve tags that were never used before in the folksonomy (i.e., tagapplications that introduce previously non-existing tags in the folkson-omy). Thus, this metric is computed on a daily basis (see Sec. 2.4).Considering the folksonomy model defined in Sec. 2.1, the percentageof new tags can be defined as
ηn =|T new
n ||En|
· 100,
where T newn is the set of tags that appeared for the first time in the
n-th day of our analysis data, and En is the set of all tag applica-tions performed during that same day (note that T new
n cannot contain
8

duplicates, i.e., a particular tag cannot be considered as being “new”more than once). High values of η indicate that many new tags arebeing created and that, therefore, the vocabulary is not converging toa finite set of terms. Our expectation for this metric is that it shouldbe reduced after the introduction of tag recommendation, as users willtend to reuse tags from the list of suggestions rather than creating newones.
• Average user vocabulary size: This metric is also computed on a dailybasis, and we define it as the total number of tag applications involvingdistinct tags that a user performed during a given day (i.e., the numberof unique tags that a user assigned during a given day). Consideringthe folksonomy model defined in Sec. 2.1, the average vocabulary sizecan be expressed as
ςn =1
|Un|∑u∈Un
|Eun|,
where Eun is the set of tag applications involving distinct tags that user
u has performed during the n-th day of our analysis data, and Un isthe set of users that performed at least one tag application during thatsame day. High values of ς indicate that users employ a wide varietyof tags for annotating their sounds, whereas low values indicate thatusers tend to employ always the same tags they have already usedbefore. We believe that, using the tag recommendation system, userswill be exposed to a wider variety of tags than the ones they wouldhave thought of. Hence, we expect to observe a ς increase after theintroduction of tag recommendation.
• User vocabulary sharing : This metric quantifies to which extent usersemploy tags that have also been employed by other users. To analysethis aspect we build a weighted network U where nodes represent usersand edges represent the amount of tags shared between two users.Edge weights w between nodes i and j of U are normalised usingstandard Jaccard similarity. Given an arbitrary period of time k forwhich a network Uk can be constructed, the weight between two nodescan be computed as
wij =
∣∣∣T ik ∩ T
jk
∣∣∣∣∣∣T ik ∪ T
jk
∣∣∣ ,where T i
k is the set of distinct tags that the user corresponding tothe i-th node has annotated during the time period comprised in k(similarly for T j
k and node j). In such a network, two users will bestrongly connected if they use the same tags when annotating theirsounds. Notice that, according to the definition above, every node in
9

Uk has a self-loop, i.e., for i = j we have wi,j = 1. Having definedUk, node strength (Barrat et al., 2004) acts as a basic indicator of thelevel of vocabulary sharing across users. The more strength the nodeshave, the more tags users are sharing. Let L be the total number ofnodes in Uk, and ϑi be the node strength for the i-th node of Uk suchthat
ϑi =L∑
j=1
wij ,
we define user vocabulary sharing as the average node strength overthe network so that
µ(Uk) =1
L
L∑i=1
ϑi.
In our analysis, we build two networks Uk as defined above, one con-sidering all the data after the introduction of tag recommendation andthe other considering data from a reference time window before theintroduction of tag recommendation (see below). We compare thesetwo networks by computing the difference between user vocabularysharing (average node strength) in both networks. We asses the sta-tistical significance of that comparison by taking the series of nodestrengths of both networks (i.e., without computing the average) andusing the Kolmogorov-Smirnov two-sample test (Corder and Foreman,2009) for evaluating the null hypothesis that the two samples of nodestrengths belong to the same distribution (we use a significance levelof p = 0.01). After the introduction of tag recommendation, we ex-pect to observe an increase in µ, as users will be highly exposed to theinfluence of tags used by other users, and therefore more links will becreated in U .
• Sound vocabulary sharing : Similar to the previous metric, we can alsostudy the vocabulary sharing across sounds instead of users. In thisway, sound vocabulary sharing represents the tags that sounds havein common. To analyse sound vocabulary sharing we build a weightednetwork S where nodes represent sounds and edges represent the num-ber of tags that are common to the pairs of sounds linked by them.As in U , edge weights are normalised using the Jaccard similarity, sothat the weight w between nodes i and j of a network Sk computedfrom data for a time period k can be defined as
wij =
∣∣T i ∩ T j∣∣
|T i ∪ T j |,
where T i is the set of tags assigned to the sound represented by thei-th node (similarly for T j and node j). Notice that, in this case,
10

the definition of wij does not include the time period k in any of itsterms. This is because all tag-tag applications for a given sound aredone at once. Therefore, if the sound was uploaded in the time periodk (and thus is represented by a node in the network Sk), all its tagapplications will have also been performed during that time periodk. In Sk, two sounds will be strongly connected if they are annotatedwith the same tags, and we consider node strength as a basic indicatorof the vocabulary sharing across sounds. Thus, we can define soundvocabulary sharing ν for a network Sk as the average node strengthover that network, and compute it in the same way as described foruser vocabulary sharing.
For analysis purposes, we again build two networks with data beforeand after the introduction of tag recommendation. The two networksare compared in terms of their node strength following the same pro-cess described above for analysing user vocabulary sharing. After theintroduction of tag recommendation, we expect to observe a ν increase,as users will be highly exposed to the influence of tags used by otherusers. Therefore, sound annotations will include these tags and morelinks will be created in the network S.
2.3.2 Quality of annotations
• Average tagline length: This metric is computed on a daily basis, andwe define it as the average number of tags assigned to sounds thathave been uploaded during a given day. Considering the folksonomymodel defined in Sec. 2.1, the average tagline length can be expressedas
τn =1
|Rn|∑r∈Rn
|Er|,
where Er is the set of tag applications involving a resource r and Rn
is the set of sounds uploaded and annotated during the n-th day ofour analysis data. High values of τn indicate that sounds are beingannotated with many tags, with potentially more comprehensive de-scriptions. Our expectation for this metric is to observe an increaseafter the introduction of tag recommendation, as the provided list ofrecommendations will help users to add more tags during the annota-tion process. In fact, even if recommendations are not correct, theymay serve as a guide for users, and convey which kinds of informationshould be annotated about the sounds being described. For instance,the recommendation system could suggest a tag like 120bpm to a soundsample corresponding to a music loop of different tempo. However, thistag might suggest the user to describe tempo information and in thisway generate a longer tagline (Font et al., 2014b).
11

• Percentage of misspelled tag applications: This metric represents thepercentage of tag applications performed during a given day of ouranalysis period that contain tags with misspellings or typographicalerrors. Considering the folksonomy model defined in Sec. 2.1, thepercentage of misspelled tag applications can be defined as
ωn =|Emiss
n ||En|
· 100,
where En is the set of all tag applications performed during the n-thday of our analysis data, and Emiss
n is the set of tag applications per-formed during that same day which involve tags with misspellings. Inorder to estimate Emiss
n , we use a simple approach in which we check,for each individual tag, whether it exists or not in an English dictio-nary2 (similarly to Guy and Tonkin 2006). We consider that these tagswhich do not appear in the English dictionary contain misspellings ortypographical errors. Using such a simple approach, tags consistingof proper nouns, compound words, or written in other languages, aremost likely considered to be misspellings. However, we assume that thepresence of these kind of tags is not affected by the introduction of thetag recommendation system and thus our defined metric is meaningfulenough for comparison purposes. High values of ω indicate that manyof the tags assigned to sounds contain misspellings. Our expectationfor this metric is that it should be reduced after the introduction oftag recommendation, as users will manually type fewer tags and choosethem from the list of recommendations instead.
• Tag frequency distribution: One useful indicator of the impact of thetag recommendation system is the observation of changes in the fre-quency distribution of existing tags. Intuitively, tags that are verypopular (i.e., that have high frequency) tend to correspond to broadersemantic concepts, while less popular tags usually correspond to nar-rower ones. Looking at the tag frequency distribution we can thushave an idea of users’ tagging behaviour and observe if it is influencedby the tag recommendation system. To do that, we compute the fre-quency of tags over a period of time k such that the frequency υ of atag t can be expressed as
υt,k = |Etk|,
where Etk is the set of all tag applications involving tag t during the
time period k. We consider two time periods, one with data before
2For that purpose we use the open-source Enchant spellchecking library, with BritishEnglish and American English dictionaries (http://www.abisource.com/projects/enchant/).
12
the introduction of tag recommendation and the other with data af-ter tag recommendation, and compute the complementary cumulativedistribution of tag frequencies over the two periods. These kind ofplots are common within the collaborative tagging literature (Bischoffet al., 2008; Robu et al., 2009), and indicate the probability that thenumber of occurrences of a particular tag is above a certain level. Byqualitatively comparing the resulting distribution over two periods oftime, we can have an idea of in which tag frequency ranges the tagrecommendation system has a bigger impact. Our expectation for thismetric is that the tag recommendation system will make the distribu-tion more even by reinforcing the usage of tags with less frequency.
Additionally, we compare the distribution of tag frequencies before andafter the introduction of tag recommendation in terms of their fit into apower law distribution. It has been suggested that folksonomies whosedistribution of tag frequencies can be fitted by a power law, exhibitmature vocabularies that lead to better quality descriptions (Mathes,2004; Cattuto, 2006; Halpin et al., 2006; Wagner et al., 2014). Hence,we check if we observe any difference regarding this matter after theintroduction of tag recommendation. This analysis is also directly re-lated with the hypothesis that tag recommendation should contributeto the convergence and consolidation of the vocabulary of the folkson-omy.
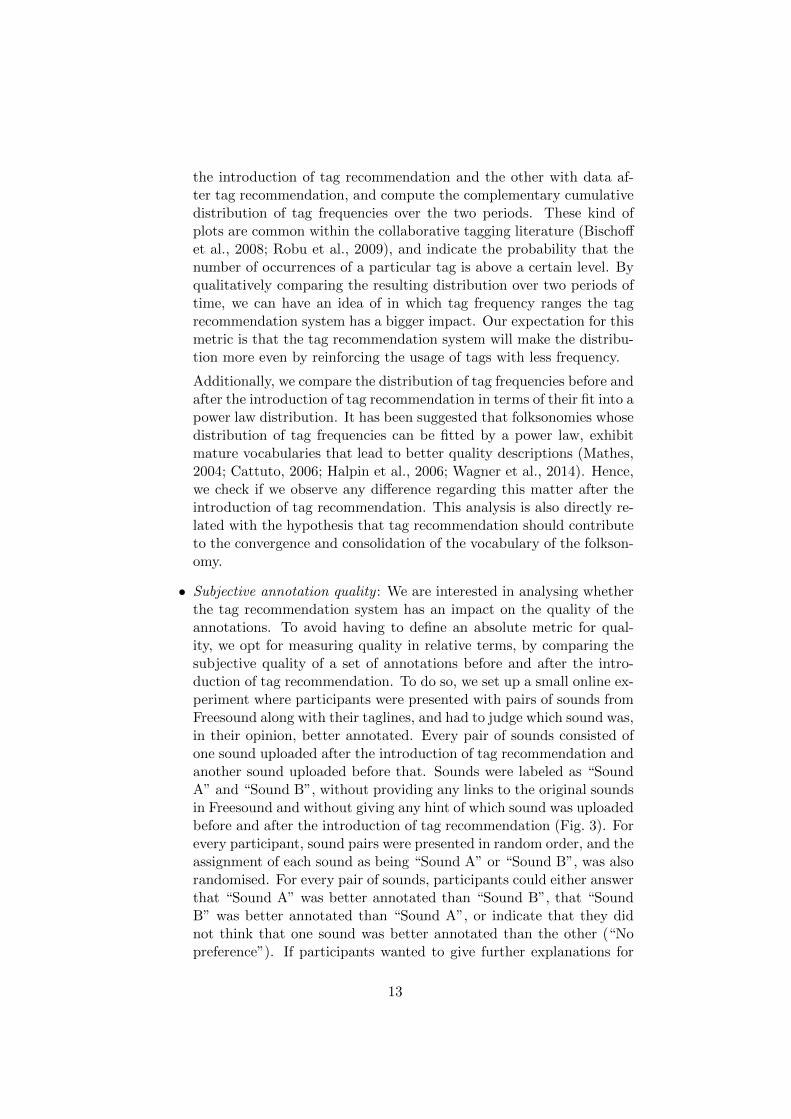
• Subjective annotation quality : We are interested in analysing whetherthe tag recommendation system has an impact on the quality of theannotations. To avoid having to define an absolute metric for qual-ity, we opt for measuring quality in relative terms, by comparing thesubjective quality of a set of annotations before and after the intro-duction of tag recommendation. To do so, we set up a small online ex-periment where participants were presented with pairs of sounds fromFreesound along with their taglines, and had to judge which sound was,in their opinion, better annotated. Every pair of sounds consisted ofone sound uploaded after the introduction of tag recommendation andanother sound uploaded before that. Sounds were labeled as “SoundA” and “Sound B”, without providing any links to the original soundsin Freesound and without giving any hint of which sound was uploadedbefore and after the introduction of tag recommendation (Fig. 3). Forevery participant, sound pairs were presented in random order, and theassignment of each sound as being “Sound A” or “Sound B”, was alsorandomised. For every pair of sounds, participants could either answerthat “Sound A” was better annotated than “Sound B”, that “SoundB” was better annotated than “Sound A”, or indicate that they didnot think that one sound was better annotated than the other (“Nopreference”). If participants wanted to give further explanations for
13

Comparison of sound annotations (4 of 40)
Sound ANOTE: please do not refresh the page. If sounds are not displayed properly, click here.
Which sound do you think is better annotated?
Next sound!
-00:04:676
-00:07:338
Sound AIf you want, you can add some comments about why you think onesound is better annotated than the other:
Sound BNo preference
Loop Piano stab piano Music
Ambient music sample Ambiance
Screen stabs Loading atmosphere
voice surprise female shock
fright human
your comments here...
Sound B
Figure 3: Screenshot of the online experiment interface to judge quality ofannotations.
their answers, they also had the option to introduce a textual commentfor every comparison.
Participants had to compare the annotation quality of a total of 40sound pairs. To select the sounds for the experiment, we first ran-domly chose a set X of 40 sounds among those uploaded after theintroduction of tag recommendation. The random selection was onlyconstrained in such a way that all selected sounds had to be uploadedby different users. Then, we built another set Y of 40 sounds up-loaded before the introduction of tag recommendation. In order tobuild Y and make it as similar as possible to X (i.e., containing simi-lar kinds of recordings), we used the “similarity search” functionalityof Freesound (Font et al., 2013a). For each sound Xi, we retrieveda list of candidate similar sounds taking into account their acousticproperties represented by low level audio descriptors (note that thesimilarity search functionality does not take into account any meta-data like tags or textual descriptions). Then, we pruned the lists ofcandidates by removing those sounds that were uploaded after the in-troduction of tag recommendation and by not allowing to have morethan one sound uploaded by the same user. Finally, for each soundXi, we listened to the remaining candidates and selected the candi-date that, in our opinion, was more acoustically similar to Xi. Set Ywas thus constructed with all selected candidates. Having the sets Xand Y , we formed the final pairs of sounds used in the experiment byiteratively selecting a random sound from each set until we got the 40
14

pairs determined.
We asked the team of Freesound moderators3 to participate in theexperiment, and collected data from a total of 7 completed experiments(i.e., obtaining a total 7 judgements for every sound pair comparison).Considering the collected data, we assign numerical values to the i-thquality judgement ιi performed by every participant such that
ιi =
1 if Xi is better than Yi
−1 if Yi is better than Xi
0 if no preference.
Then, qualitative annotation quality φ is computed as the average overthe union of all quality judgements ιi performed by all participants inthe experiment. Let κ be the union of all quality judgements ιi, then
φ =1
|κ|∑j∈κ
κj .
A value of φ close to 1 indicates a preference for the annotations ofsounds from X (i.e., sounds uploaded after the introduction of tagrecommendation), while a value close to −1 indicates a preference forsounds from Y (i.e., sounds uploaded before tag recommendation). Avalue close to 0 indicates no preference. Our expectation for this met-ric is to obtain a positive value, indicating a tendency of consideringsounds uploaded after tag recommendation as being better annotatedthan sounds uploaded before tag recommendation. This would suggestan increase in annotation quality.
2.3.3 Cost of the annotation process
• Average tag application time: An important indicator of how difficultit is for users to annotate sounds is the observation of the time theyspend annotating them (Wang et al., 2012). For that purpose, wedefine the average time per tag application as
γA =1
|A|∑a∈A
λa|Ea|
,
where λa is the duration of an annotation session a (in seconds), Ea isthe set of tag applications performed during an annotation session a,and A is a set of annotation sessions. Low γA values indicate that the
3All sounds that are uploaded to Freesound are manually moderated by a small teamof people (all of them long-term Freesound users) that ensure the appropriateness of theuploaded sounds. Hence, Freesound moderators are very familiarised with Freesoundcontent and tagging particularities.
15

time required to add a single tag is lower, therefore it is presumablyeasier for users to describe sounds.
Unfortunately, the Freesound system did not log information about theduration of annotation sessions before the introduction of tag recom-mendation, and therefore no data was available for most of the analy-sis time period. To overcome that issue, during a period of time thatlasted two weeks between the March 24 and April 7, 2014, we alteredthe tag recommendation system so that it only provided recommen-dations to half of the annotation sessions (but logged the annotationprocess in both cases). Therefore, our analysis of γA is carried outwith data gathered during that extra analysis period. This data in-cludes annotation sessions for 562 sounds, one half of them annotatedusing tag recommendation and the other half annotated without tagrecommendation. Note that this new analysis period does not overlapwith the period of the main analysis (see below).
We divide the annotation session data we gathered into two sets: onecontaining data from sessions were tag recommendations were not pro-vided (A−) and the other containing data from sessions with recom-mendations (A+). Next, we compare the average γ for both sets ofannotation sessions and asses the statistical significance of the differ-ence by performing the Mann-Whitney U test with a significance levelof p = 0.01 (Corder and Foreman, 2009). We do not perform any kindof data cleaning or outlier removal over the set of collected annotationsessions. Our expectation for this metric is that sessions which pro-vided tag recommendations will exhibit lower values of γ, as users willadd some tags by clicking on the tag suggestions and this will makethe annotation process faster.
• Average percentage of correctly predicted tags: This metric quantifieshow many of the tags assigned to a sound given an annotation processare actually suggested by the recommendation system (thus correctlypredicted). Given that the logs of the sound annotation sessions wecollected since the introduction of tag recommendation include thelists of all tags that were suggested by the system during the differentannotation sessions, we can define the average percentage of correctlypredicted tags as
ψn =100
|Rn|∑r∈Rn
|T r ∩ T rS |
|T r|,
where T r is the set of tags assigned to sound r, T rS is the union of all
tags suggested by the system during the annotation process of sound r,and Rn is the total number of sounds uploaded and annotated duringthe n-th day of our analysis data. Note that we cannot compute ψ for
16

data before the introduction of tag recommendation. The average per-centage of correctly predicted tags is an indicator of the usefulness ofthe tag recommendation system during the annotation process. Highvalues of ψ indicate that many of the tags that are recommended areactually used to annotate the sounds they are recommended for. Ourexpectation for this metric is to obtain similar results as in a user-basedevaluation of the tag recommendation system we carried out in previ-ous work (Font et al., 2014b). In that case, the average percentage ofcorrectly predicted tags was found to be approximately 33%.
2.4 Analysis methodology
The impact of the tag recommendation system is analysed by looking atthe evolution of the Freesound folksonomy (gathering data directly fromthe Freesound database) and the logs created every time a user annotatesa new sound. Our analysis comprises data between September 21, 2011,and February 28, 2014. The tag recommendation system was introducedon November 20, 2013. The metrics defined in the previous section areeither computed on a daily basis (using data from a particular day of ouranalysis), or over bigger periods of time (using data data gathered fromseveral days of our analysis). To represent daily time periods, let D be avector of time periods where Dn corresponds to the time period of the n-thday since the beginning of our analysis data. In that vector, D0 correspondsto the time period of the first day in our analysis data (September 21,2011), and DN corresponds to the time period of the last day for whichwe have analysis data (February 28, 2014). In addition to what precedes,to represent larger periods of time, we define a series of analysis windowswhich include data from several days of our analysis. On the one hand,let W I be our analysis window of interest, which represents a time periodincluding all the data after the introduction of tag recommendation (i.e., atotal of 100 days from November 20, 2013 to February 28, 2014). On theother hand, let WR be a vector of reference analysis windows where eachelement WR
m corresponds to a time period of the same length as W I (100days), drawn from data before the introduction of tag recommendation. Thewindow WR
0 corresponds to the last 100 days before the introduction of tagrecommendation (from August 12, 2013 to November 19, 2013), and the m-th analysis window corresponds to a time period shifted backwards in time50m days. Figure 4 shows a graphical representation of D and WR, and theanalysis window of interest W I . Notice that W I , as well as each element ofWR, includes a particular range of D time periods (e.g., W I corresponds toDN−100:N ).
As mentioned, we are interested in comparing the results of the definedmetrics for time periods before and after the introduction of tag recom-mendation. In the case of metrics that are computed on a daily basis, we
17

Introduction of tag recommendation
...
......
...
Figure 4: Time period vectors D and WR, and the analysis window ofinterest W I .
perform the comparison by computing the average of each metric over therange of days in D included in the window of interest W I and in each ref-erence window WR
m . Then, the average obtained from W I is compared withthe average obtained for each time period WR
m . This results in a total of Mcomparisons per metric. In our results section, and unless stated otherwise,we always report the results of the comparison between W I and WR
m thatyields the minimum absolute difference. Hence, our results only show thecase in which the tag recommendation system has the least impact. Foreach one of these comparisons, we assess statistical significance by takingthe daily results of the metric corresponding to the compared time periodsW I and WR
m and performing the Mann-Whitney U test with a significancelevel of p = 0.1. For the case of metrics that are not computed on a dailybasis, we follow different approaches for comparing and assessing statisti-cal significance. These approaches have been described for every particularmetric in corresponding subsections of Sec. 2.3.
Our analysis data includes annotations for sounds of very different na-tures and from users with very different levels of expertise. During theanalysis period, some users uploaded only one sound, while others uploadedup to 5,500, with the average being on 12.7 uploaded sounds per user. A finalpoint to note is that, although we do not perform any cleaning of the consid-ered Freesound data, we remove from our consideration all tag applicationsperformed by a specific user that, during a narrow time period within W I
(from January 17, 2014 to January 27, 2014), intensively uploaded and an-notated sounds using three times more tags per sound than the average. Weconsidered this user as being a clear outlier that could potentially bias theresults of our analysis by significantly increasing the average tagline lengthafter the introduction of tag recommendation.
18

3 Results and discussion
3.1 Vocabulary convergence
3.1.1 Percentage of new tags
Fig. 5 shows the evolution of the percentage of new tags η over the consideredtime period. We qualitatively see that it decreases after the introduction oftag recommendation. The minimum difference we observe between W I andall WR
m is a decrease of 1.7%, which is found to be statistically significant(p = 4.01 · 10−6). The maximum difference we observe is a decrease of 5%(p = 1.26 · 10−15).
The depicted evolution suggests an influence of the tag recommendationsystem on the percentage of new tags. However, looking at Fig. 5, a de-creasing global trend can be observed, even before the introduction of tagrecommendation. To compensate for the existence of such a trend, we per-form an extra analysis in which we apply a correction to the η data pointsobtained from W I . The correction consists in computing a linear regressionwith all data points before the introduction of tag recommendation and thensubtracting the linear projection of that trend to the data after the intro-duction of tag recommendation. Once we apply the correction to η overthe window W I , we repeat the comparisons with all reference windows WR
m
and observe, this time, a minimum η decrease of 1.5% which still remainsstatistically significant (p = 5.68 · 10−5).
It could be further argued that during the time period between Septem-ber 15 and December 14, 2012, a localised decreasing pattern can also beobserved with a similar strength to the one we observe after the introductionof tag recommendation. This decreasing pattern might be explained by theapparent local increase that can be observed in the previous months, whichmight be provoked by a particular user uploading a significant number ofsounds with many new tags. Importantly, no relevant patterns can be ob-served in the other studied metrics during that particular period of time (seebelow). Moreover, just by simple observation of Fig. 5, it can be spottedthat the variance of η is smaller after the introduction of tag recommenda-tion, thus giving more relevance to the observed decreasing pattern in W I .As mentioned, it is the consideration of similar results from several differentmetrics that allows us to draw any conclusions regarding the formulatedhypotheses.
3.1.2 Average user vocabulary size
Fig. 6 shows the evolution of the average user vocabulary size ς. In it, a clearimpact of the tag recommendation system can be observed, as ς consistentlyincreases after the introduction of tag recommendation. When comparingresults for the analysis window W I and the other reference windows WR
m ,
19

Figure 5: Evolution of the percentage of new tags η. The shaded line corre-sponds to computed η. The bold line corresponds to a smoothed version ofη. Smoothing is performed by convolution over a moving Hann window of51 days. That particular number of days has been arbitrarily chosen to gen-erate an informative yet visually appealing figure. Unless stated otherwise,the same smoothing strategy is applied in the other figures in this work.
we find a minimum ς increase of 3.46 tags per user (p = 2.303 · 10−11).This demonstrates that, after the introduction of tag recommendation, userstend to use a wider variety of tags as their vocabulary size is significantlyincreased.
3.1.3 User vocabulary sharing
As described in Sec. 2.3, to analyse user vocabulary sharing (µ) we buildtwo networks using data from WR
0 and W I , respectively. The resultingnetwork built with data from WR
0 has a total of 1,148 nodes (i.e., users) and73,240 edges, whereas the network built with data from W I features 1,335nodes and 122,474 edges. Just by looking at these numbers it can alreadybe seen that users in the W I network are much more connected. Fig. 7shows the complementary cumulative node strength distribution of the twonetworks. The distribution shows that, for a given probability, the networkafter the introduction of tag recommendation features nodes with a higherstrength. Comparing the two distributions yields a statistically significantµ increase of 2.12 (p = 8.652 · 10−17). These observations evidence that thetag recommendation system effectively influences users in a way that moretags are shared among them.
20

Figure 6: Evolution of average user vocabulary size ς. The shaded linecorresponds to computed ς. The bold line corresponds to a smoothed versionof ς. The filled area shows the range between the lower and upper quartilesof the original data.
Figure 7: Complementary cumulative node strength (ϑ) distribution of user-user network Uk before and after the introduction of tag recommendation.Networks are built with data from analysis windows WR
0 and W I respec-tively.
21

Figure 8: Complementary cumulative node strength (ϑ) distribution ofsound-sound network Sk before and after the introduction of tag recom-mendation. Networks are built with data from analysis windows WR
0 andW I respectively.
3.1.4 Sound vocabulary sharing
The analysis of sound vocabulary sharing ν reports similar results to those ofuser vocabulary sharing. The resulting network built with data fromWR
0 hasa total of 9,898 nodes (i.e., sounds) and 3,414,449 edges, whereas the networkbuilt with data fromW I features 12,946 nodes and 7,405,037 edges. Again, itcan already be observed that the network after tag recommendation is muchmore connected. Fig. 8 shows the complementary cumulative node strengthdistribution of the two networks. In this case, we also observe an overallincrease in node strengths after the introduction of tag recommendation.Interestingly, this is somewhat more relevant in the range of sounds thatused to be less connected in the network (roughly for νx < 200). Theaverage ν increase is of 34.26 (p = 2.606 · 10−231). This result is consistentwith what we find in the case of user vocabulary sharing.
3.1.5 Discussion
We have seen that the tag recommendation system diminishes the generationof new tags and, at the same time, it increases the size of users’ vocabularyand the number of tags that are shared among users and sounds. Thissuggests that all users receive a common influence that positively affects theconvergence of the vocabulary in the folksonomy by leveraging the reuse oftags, reducing the generation of new ones, and increasing the number ofdistinct tags in users’ personal vocabulary.
We have also found that both user and sound vocabulary sharing are
22

increased after the introduction of tag recommendation. This observation,combined with the increase in users’ vocabulary size, leverages the value ofsound annotations. It reveals a better agreement on the vocabulary of tagsused to annotate sounds, and also an increase of its size. Therefore, soundsare described using a more coherent and complete vocabulary.
3.2 Quality of annotations
3.2.1 Average tagline length
Fig. 9 shows the evolution of the average tagline length τ . We qualitativelyobserve a clear increase after the introduction of tag recommendation. Com-paring results for the analysis window W I and reference windows WR
m , weobserve a minimum τ increase of 1.32 tags per sound (p = 7.553 · 10−6).Similarly to what we noted in Sec. 3.1.1, Fig. 9 seems to show a global in-creasing tendency already before the introduction of tag recommendation.We repeated the same extra analysis of that section (i.e., computing thelinear regression of data before the introduction of tag recommendation andcorrecting τ in W I with the linear projection of the trend) and still ob-served a statistically significant minimum τ increase of 1.22 tags per sound(p = 3.65 · 10−5). Considering the average tagline length for the time peri-ods before and after the introduction of tag recommendation, the observedincrease means that sounds are annotated with approximately 20% moretags when users are influenced by the tag recommendation system. Thisobservation is also supported by looking at the histogram of tagline lengthsbefore and after the introduction of tag recommendation (Fig. 10). Theincrease on the average length of the tagline suggests that annotations usingthe recommendation system are more comprehensive and, presumably, ofbetter quality than annotations without using the recommendation system.
3.2.2 Percentage of misspelled tag applications
Fig. 11 shows the evolution of misspelled tag applications ω. As expected,we qualitatively observe a slight decreasing tendency in ω after the introduc-tion of tag recommendation When comparing results for the analysis windowW I and the other reference windows WR
m , we find a minimum ω decrease of1.4% (not statistically significant), and a maximum decrease of 5% (statis-tically significant, with p = 4.775 · 10−5). Hence, this demonstrates that theintroduction of tag recommendation has a moderate impact on misspelledtags, helping users to generate up to 5% less tags with misspellings.
3.2.3 Tag frequency distribution
Fig. 12 shows the complementary cumulative tag frequency distribution be-fore and after the introduction of tag recommendation. It can be observed
23

Figure 9: Evolution of average length of tagline τ . Shaded line correspondsto computed τ . The bold line corresponds to a smoothed version of τ . Filledarea shows the range between the lower and upper quartiles of the originaldata.
Figure 10: Smoothed normalised histogram of tagline lengths before andafter the introduction of tag recommendation. Data is drawn from theanalysis windows WR
0 and W I , respectively. Smoothing is performed usinga Hann window of 11 points. Dashed vertical lines with attached percentagevalues indicate the percentage of sounds whose tagline length is less or equalthan that indicated in the corresponding line position.
24

21 S
ep 2
011
20 D
ec
2011
19 M
ar
2012
17 Jun 2
012
15 S
ep 2
012
14 D
ec
2012
14 M
ar
2013
12 Jun 2
013
10 S
ep 2
013
9 D
ec
2013
0
10
20
30
40
50
60
70
80
ω
Intr
oduct
ion o
fta
g r
eco
mm
endati
on .
Figure 11: Evolution of the percentage of misspelled tag applications ω.The shaded line corresponds to computed ω. The bold line corresponds toa smoothed version of ω.
that the distribution after the introduction of tag recommendation tends tobe more even, particularly reinforcing the usage of tags in the low and midfrequency ranges (tags with less than 800 occurrences). This means that lesspopular tags gain importance after the introduction of tag recommendation.Less popular tags typically correspond to narrower semantic concepts, whichare used to bring more details to sound annotations. Again, this observationis consistent with previous observations regarding vocabulary convergence.It reflects the increase in both user and sound vocabulary sharing, as tagswith less frequency gain importance and start being more widely used. Italso suggests that annotations after the introduction of tag recommendationare more detailed as usage of tags in the low and mid frequency ranges isreinforced.
To complement these results, we use the method proposed by Clauset etal. 2007 for evaluating how well tag frequency distributions correspondingto the time periods before and after the introduction of tag recommendationfit into a power law distribution4. In both cases, the analysis shows that dis-tributions more closely fit a log-normal distribution rather than a power lawdistribution. However, the tag frequency distribution after the introductionof tag recommendation shows a better fit for the power law than the distri-bution before tag recommendation, which may also suggest the presence ofa better converging vocabulary yielding better quality descriptions (Mathes,2004; Cattuto, 2006; Halpin et al., 2006; Wagner et al., 2014).
4We use an open source implementation as described in Alstott et al. 2014.
25
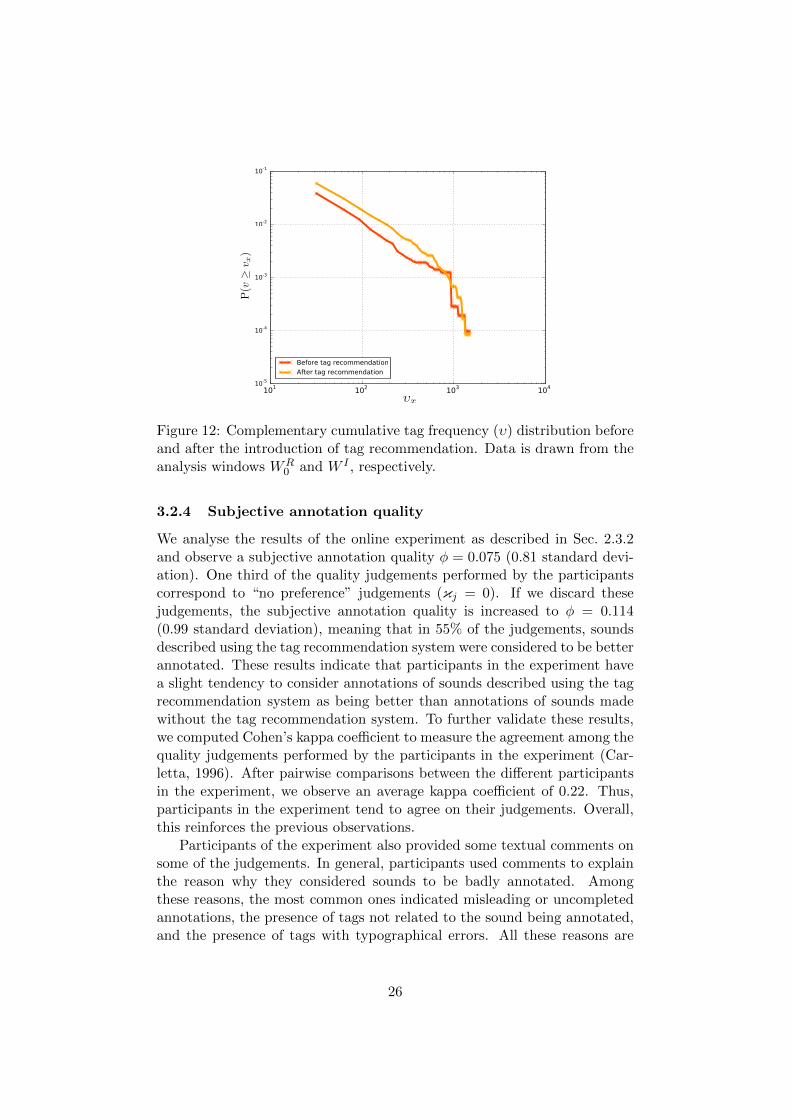
Figure 12: Complementary cumulative tag frequency (υ) distribution beforeand after the introduction of tag recommendation. Data is drawn from theanalysis windows WR
0 and W I , respectively.
3.2.4 Subjective annotation quality
We analyse the results of the online experiment as described in Sec. 2.3.2and observe a subjective annotation quality φ = 0.075 (0.81 standard devi-ation). One third of the quality judgements performed by the participantscorrespond to “no preference” judgements (κj = 0). If we discard thesejudgements, the subjective annotation quality is increased to φ = 0.114(0.99 standard deviation), meaning that in 55% of the judgements, soundsdescribed using the tag recommendation system were considered to be betterannotated. These results indicate that participants in the experiment havea slight tendency to consider annotations of sounds described using the tagrecommendation system as being better than annotations of sounds madewithout the tag recommendation system. To further validate these results,we computed Cohen’s kappa coefficient to measure the agreement among thequality judgements performed by the participants in the experiment (Car-letta, 1996). After pairwise comparisons between the different participantsin the experiment, we observe an average kappa coefficient of 0.22. Thus,participants in the experiment tend to agree on their judgements. Overall,this reinforces the previous observations.
Participants of the experiment also provided some textual comments onsome of the judgements. In general, participants used comments to explainthe reason why they considered sounds to be badly annotated. Amongthese reasons, the most common ones indicated misleading or uncompletedannotations, the presence of tags not related to the sound being annotated,and the presence of tags with typographical errors. All these reasons are
26

reported evenly for sounds uploaded before and after the introduction of tagrecommendation.
3.2.5 Discussion
We have seen that the average number of tags used to annotate a sound islarger after the introduction of tag recommendation. A similar observation ismade in a study by Ames et. al. 2007, in which two mobile phone applicationsfor uploading photos to Flickr5, an online photo sharing site, are compared.One of the applications features a tag recommendation system to aid users inthe tagging process, and an increase in the average tagline length is observedfor those photos uploaded with that application.
The fact that the average tagline length increases after the introductionof tag recommendation also reinforces the previously discussed observationsregarding the convergence of vocabulary. Tag recommendation yields moretag applications and potentially more comprehensive sound annotations, andyet fewer new tags are created while vocabulary sharing is increased. Hence,our results indicate that sound annotations after the introduction of tag rec-ommendation are done using a more coherent and complete vocabulary oftags. This fact seems to be further confirmed by the results of the onlineexperiment we set up to analyse qualitative annotation quality, as partici-pants on this experiment preferred annotations of sounds uploaded after theintroduction of tag recommendation.
The tag frequency distribution we observe after the introduction of tagrecommendation also supports the increase in the convergence of the vocab-ulary. Results indicate that a better agreement is reached specially for thosetags with lower frequencies of occurrence. Thus, we could say that there isa better agreement on the tags users choose to annotate specific concepts,which leverages the value (and thus the quality) of the annotations.
Finally, we also observed that tag recommendation helps users in slightlyreducing misspellings in the tags they introduce, which also supposes an im-provement in the quality of annotations. However, the impact we observe israther small, which may be explained by several factors. Firstly, the way inwhich we estimate misspelled tags is not perfectly accurate and thus somenoise is present in the metric (Sec. 2.3.2). Secondly, the nature of the tagrecommendation system does not prevent itself from actually recommend-ing tags with misspellings. Hence, even if it is intuitively less likely thatmisspelled tags will feature a strong similarity with any of the input tags,it is still possible that these are recommended. Finally, we can only expecttag recommendation to effectively help in reducing misspellings for the tagsthat are actually suggested by the system and correctly predicted. As wedescribe below in Sec. 3.3.2, approximately 19% of the tags of a tagline are
5http://www.flickr.com
27

correctly predicted, and this can be taken as a rough estimate of an upperbound for the decrease in the percentage of misspelled tag applications. Fur-thermore, even when relevant tags are recommended by the system and arecorrectly predicted, many users still prefer to manually type them instead ofclicking on the list of suggestions, which may still lead to misspellings (seeSec. 3.3.2). Overall, our results regarding the quality of annotations suggestthat the introduction of tag recommendation has a moderate yet positiveimpact on this aspect.
3.3 Cost of the annotation process
3.3.1 Average tag application time
Fig. 13 shows the probability density function of the average time per tagapplication γ with and without the use of the tag recommendation system.Although we observe a smaller average decrease in γ for annotation sessionsusing the tag recommendation system, it is found to be not statistically sig-nificant (p = 8.3 · 10−1). This means that there is no substantial differenceon the time needed to perform a tag application either using or not using tagrecommendation. However, if we look at the total amount of time investedin annotating every sound (instead of every tag), we do observe a statisti-cally significant average increase of roughly 35 seconds per sound after theintroduction of tag recommendations (p = 6.2 · 10−3), which represents anincrease of approximately 20%. This is consistent with the 20% increaseof the tagline length we observed in Sec. 3.2.1. In general, we could saythat users need at least the same amount of time to perform a single tagapplication as they needed before using the system. However, annotationsare longer and therefore users spend more time annotating sounds.
3.3.2 Average percentage of correctly predicted tags
As explained in Sec. 2.3, the average percentage of correctly predicted tagsψ can only be computed with data drawn from the analysis window W I .Computing it on a daily basis shows that, on average, approximately 19%(5% standard deviation) of the tags finally assigned to sounds, are suggestedby the recommendation system. That observed percentage is 11% lowerthan the one we found in previous work, where the tag recommendationsystem was evaluated in a controlled experiment which was not integratedinto Freesound (Font et al., 2014b). Hence, we assume this difference isdue to the fact that the current analysis is carried out in the real world.Among the correctly predicted tags, we make a distinction between thosethat are added to the tagline by users clicking on the corresponding tag inthe list of suggestions, and those that are manually typed by users. If weonly consider the tags that are added to the tagline by actively clicking onthe suggestion, we observe an average ψ of approximately 13% (4% standard
28

Figure 13: Probability density function of the average time per tag appli-cation γ with and without the tag recommendation system. Curves aresmoothed using a Hann window of 11 points.
deviation). This means that the tag recommendation system is useful for atleast 19% of the annotated tags, but that in many occasions users still preferto manually type the tags instead of switching to the mouse and clickingon the list of suggestions. In general, these results show that, despite animportant part of the final tagline for a sound can be constructed using tagssuggested by the recommendation system, the majority of these tags haveto be generated by users themselves, and are not necessarily related withthose suggested by the system.
3.3.3 Discussion
Contrary to what we expected, we have observed that the tag recommen-dation system does not seem to have a significant impact on the cost ofthe annotation process. Although we have seen that users need significantlymore time to annotate individual sounds when using the tag recommenda-tion system, we have also seen that this increase can be attributed to theproportional increase of the average tagline length. Hence, the actual timerequired for every individual tag application does not significantly change.Furthermore, we observed that most of the tags assigned to sounds are notdrawn from the list of recommended tags, meaning that most of the anno-tation process still consists of a generation process where users create tagsfrom scratch rather than a recognition process where users validate tagsfrom a list of suggestions.
There are several potential reasons why we do not observe the expectedimpact on the cost of the annotation process. On the one hand, we observedthat only 13% of the tags in taglines are added from the list of suggestions
29

by actually clicking on them. Hence, assuming that it is faster to clickon tags rather than to manually type them (which is probably not alwaystrue), the impact we can expect on the time required for introducing tagsshould be lower than that 13%. Also, it seems intuitively plausible thatusers need more time to generate the tags (or recognise them form a list)than to actually introduce them. Hence, the potential impact of lesseningthe time required for introducing tags is further reduced. On the other hand,the impact of the recommendation system is again limited by the fact thatmost of the introduced tags are not drawn from system recommendations,and thus an important part of the annotation process does not significantlychange after the introduction of tag recommendation. In fact, our resultsmight be suggesting that the cost of the recognition process is not actuallylower than the cost of the generation process. This also seems reasonable asthe union of all recommended tags for a given sound is much larger than thelength of the actual tagline (i.e., new tags are recommended every time thata tag is added to the tagline, see Sec. 2.2), and therefore the recognitionprocess operates over a large set of tags.
Finally, we believe that our metrics regarding the cost of the annotationprocess are highly dependent on the particular interface of the recommen-dation system. Also, the recommendation interface can have different im-pacts according to how users adapt to it. Unfortunately, our analysis doesnot contain data to be compared coming from other recommendation in-terfaces. However, to gain some more insight into that aspect, we repeatedthe calculations of the average tag application time but this time consideringexperienced and non-experienced users separately. We divided users accord-ing to the number of sounds they uploaded during our analysis period. Inparticular, we set the threshold at the third quartile of the distribution ofuploaded sounds per user, which corresponds to 7 uploaded sounds. Whatwe observe is that the average tag application time after the introductionof tag recommendation increases for non-experienced users and decreasesfor experienced users by a similar amount of about 3 seconds per tag ap-plication (p = 2.15 · 10−3 and p = 3.65 · 10−3 respectively). This showsthat experienced users were able to take advantage of the recommendationinterface and generate annotations slightly faster, while the interface hada negative impact on non-experienced users, apparently increasing the costof the annotation process. This could be explained because experiencedusers probably have a better understanding of the tagging process and caneasily interpret and take advantage of tag recommendation. Nevertheless,we think that to draw more consistent conclusions regarding the impact oftag recommendation on the cost of the annotation process, further researchshould be carried out.
30

4 Discussion
In this work we have analysed the impact of a state-of-the-art tag recom-mendation method into the real-world folksonomy of a large-scale system,Freesound. After a conscientious review of current related work, we haveidentified three main hypotheses regarding the impact that such a methodshould have when introduced into a collaborative tagging system, and wehave defined several metrics to evaluate the impact. We have analysed datacomprising of a period from September 21, 2011, to February 28, 2014, thelast three months of which correspond to data after the introduction of thetag recommendation method. To the best of our knowledge, these kind ofquantitative analyses have not been done before using large-scale data froma real-world folksonomy. Hence, no empirical assessment of the three iden-tified hypotheses was available. The definition of several necessary metricsto assess the three hypotheses is also a further contribution of our work.
Our results show a significant impact of tag recommendation into mostof the metrics we defined. However, the result of a single metric in iso-lation is probably not entirely relevant in our analysis. Instead, the factthat we observe how the changes on several metrics can be explained bysome of the outlined hypotheses, gives a particular value to our analysis.Overall, in our scenario, we observe that the first hypothesis (regarding vo-cabulary convergence) is clearly validated, that the second one (regardingthe quality of annotations) only seems to be partially validated, and thethird one (regarding the cost of the annotation process) does not seem to bevalidated. However, we believe the latter is particularly dependent on theannotation interface, and that it could be greatly improved by designing aninterface specifically focused on reducing the cost of the annotation process(e.g., favouring clicking on tags rather than typing them), and with a tagrecommendation system producing more relevant tag recommendations.
Although in this work we only analyse data in the context of Freesound,we believe that our results are, to some extent, indicative of the impact thattag recommendation can potentially have in other collaborative tagging sys-tems. However, collaborative tagging systems of different nature may reactdifferently to the introduction of a tag recommendation system. An im-portant aspect here is to take into account the motivations that users havefor tagging their resources. In narrow folksonomies such as Freesound andFlickr, users typically tag their content so that other users (and also them-selves) can easily find it in the future. However, resources are only annotatedonce, and therefore the tags added by the uploader of a resource must bemeaningful to other users of the platform. Contrarily, in broad folksonomiessuch as Delicious and CiteULike6, resources are tagged multiple times by
6Declicious (http://www.delicious.com) and CiteUlike (http://www.citeulike.org)are two online sharing platforms very popular in the tagging literature, and in which usersshare bookmarks and scholarly references respectively.
31
several users, and thus the main motivation for tagging is users’ self organ-isation of the content, without necessarily considering the global context ofthe sharing platform (Vander Wal, 2005). As a result, very different taggingstyles can arise because of the particularities of these two kinds of taggingsystems. The tag recommendation system that we use here is designed fornarrow folksonomies. It does not try to personalise recommendations toparticular users’ tagging behaviours, but instead it learns from the wholefolksonomy (Font et al., 2014b). Hence, we expect it to have a bigger im-pact in collaborative tagging systems featuring narrow folksonomies, wherethe more uniform a tagging style is across users, the better the platformbecomes in providing content to other users.
Nevertheless, the metrics and analysis methodology described here areapplicable to other collaborative platforms either featuring broad or narrowfolksonomies. To further asses the validity of our results, an analysis withdata coming from other collaborative tagging systems and tag recommenda-tion systems should be performed. The main obstacle for carrying out thisanalysis is the limited availability of comprehensive tagging data, includingannotations performed with and without the use of a tag recommendationsystem, and that comprise user activity for as long a period of time as theone we analysed.
5 Directions for future work
The work presented in this paper points us to several future directions.There are several aspects of the data we already collected that could befurther researched to gain more insight into the impact of the tag recom-mendation system. Firstly, we do not perform any study of the generatedtaglines at the semantic level. By applying techniques for mapping tagsto semantic concepts or categories (e.g., (Cantador et al., 2011)), we couldanalyse the impact of the recommendation system at the semantic level, andsee if it effectively shapes tagging behaviour to a more extensive usage ofparticular kinds of tags such as content-related or self-organisational tags.Similarly, it could be further researched if other typical problems of taggingsystems such as synonymy or polysemy are in fact affected by the use of a rec-ommendation system. Secondly, in the current work we just introduced theconcept of user experience when analysing our results in Sec. 3.3.3. It wouldbe interesting to further investigate this aspect by analysing the impact ofthe recommendation system to other evaluation metrics when consideringusers with different levels of expertise. Thirdly, another way in which thecurrent study could be further developed would be with the use of networkanalysis techniques to inspect the user-user and sound-sound networks builton the basis of shared tags. Using such analysis, it would be interestingto evaluate the existence of community structure in those networks and to
32

see how potential communities in both networks might be related. For ex-ample, we could investigate if there are strongly connected communities ofusers that annotate sounds with a particular tagging style, and then see howthe introduction of tag recommendation would affect these communities.
The present work also points out some aspects of tag recommendationsystems that should be improved to have a bigger impact on the folksonomiesof collaborative tagging systems. In our opinion, the biggest future challengein tag recommendation is the design of systems that have a bigger impacton the quality of annotations. Annotations are very subjective and difficultto evaluate. However, a recommendation system could be designed to par-ticularly focus on that issue by driving recommendations at higher semanticlevels. For example, an intelligent tag recommendation system could analysethe resource being annotated and estimate, on the basis of some domain-knowledge, different information facets that its annotation should cover inorder to be “complete”. Also, synonymy and polysemy problems could betackled in tagging systems by suggesting tags to users in combination withalternative variations or disambiguation terms. To produce such recom-mendations, the recommendation system should probably take advantage ofexternal knowledge bases such as WordNet (Miller, 1995). In order for tagrecommendation systems to have a deeper impact in the tagging behaviourand in the quality of annotations in general, we probably need to evolvethe basic tag recommendation methods and interfaces to a more complete“assistive” process. In such process, we could better guide users by takingadvantage of more knowledge about the semantics of our tags and the par-ticular tagging domain. We foresee that one interesting research directionis the use of ontologies to drive future tag recommendation/assistive tag-ging systems. Such ontologies should embed knowledge about the domainfor which we are recommending tags, including relations between tags andeven organising tags into different categories regarding the kind of semanticinformation they are describing about the resources being annotated.
6 Acknowledgements
The authors would like to thank Perfecto Herrera for his advice during thepreparation of this work and also the team of Freesound moderators forparticipating in the online experiment.
References
Alstott, J., Bullmore, E., and Plenz, D. (2014). Powerlaw: A python packagefor analysis of heavy-tailed distributions. PLoS ONE, 9.
Ames, M. and Naaman, M. (2007). Why we tag: motivations for annotation
33

in mobile and online media. In Proceedings of the SIGCHI Conference onHuman Factors in Computing Systems (CHI 2007), pages 971–980.
Barrat, A., Barthelemy, M., Pastor-Satorras, R., and Vespignani, A. (2004).The architecture of complex weighted networks. Proceedings of the Na-tional Academy of Sciences of the United States of America, 101(11):3747–52.
Bischoff, K., Firan, C. S., Nejdl, W., and Paiu, R. (2008). Can All Tags beUsed for Search? Categories and Subject Descriptors. In Proceedings ofthe 17th ACM Conference on Information and Knowledge Management,pages 203–212.
Cantador, I., Konstas, I., and Jose, J. M. (2011). Categorising social tags toimprove folksonomy-based recommendations. Journal of Web Semantics,9(1):1–15.
Carletta, J. (1996). Assessing agreement on classification tasks: the kappastatistic. Computational linguistics, 22(2):249–254.
Cattuto, C. (2006). Semiotic dynamics in online social communities. TheEuropean Physical Journal C-Particles and Fields, 37:33–37.
Clauset, A., Shalizi, C. R., and Newman, M. E. J. (2007). Power-law distri-butions in empirical data. arXiv:phys, pages 1–26.
Corder, G. W. and Foreman, D. I. (2009). Nonparametric Statistics forNon-Statisticians: A Step-by-Step Approach. Willey.
De Meo, P., Ferrara, E., Abel, F., Aroyo, L., and Houben, G.-J. (2013). An-alyzing User Behavior across Social Sharing Environments. ACM Trans-actions on Intelligent Systems and Technology, 5(1).
De Meo, P., Quattrone, G., and Ursino, D. (2009). Exploitation of semanticrelationships and hierarchical data structures to support a user in his an-notation and browsing activities in folksonomies. Journal of InformationSystems, 34(6):511–535.
Farooq, U., Kannampallil, T. G., Song, Y., Ganoe, C. H., Carroll, J. M.,and Giles, L. (2007). Evaluating Tagging Behavior in Social Bookmark-ing Systems: Metrics and design heuristics. In Proceedings of the ACMInternational Conference on Supporting Group Work, pages 351–360.
Font, F., Roma, G., and Serra, X. (2013a). Freesound Technical Demo. InProceedings of the 21st ACM Conference on Multimedia (ACM MM 13),pages 411–412.
34

Font, F., Serra, J., and Serra, X. (2013b). Folksonomy-based tag recom-mendation for collaborative tagging systems. International Journal onSemantic Web and Information Systems, 9(2):1–30.
Font, F., Serra, J., and Serra, X. (2014a). Audio clip classification usingsocial tags and the effect of tag expansion. In Proceedings of the 53rdAES Conference on Semantic Audio.
Font, F., Serra, J., and Serra, X. (2014b). Class-based tag recommenda-tion and user-based evaluation in online audio clip sharing. Journal onKnowledge Based Systems, 67:131–142.
Garg, N. and Weber, I. (2008). Personalized, interactive tag recommenda-tion for flickr. In Proceedings of the 2nd ACM Conference Recommendersystems (RecSys 08), pages 67–74.
Golder, S. A. and Huberman, B. A. (2006). Usage patterns of collaborativetagging systems. Journal of Information Science, 32(2):198–208.
Guy, M. and Tonkin, E. (2006). Folksonomies: Tidying up Tags? D-LibMagazine.
Halpin, H., Robu, V., and Shepard, H. (2006). The dynamics and semanticsof collaborative tagging. In Proceedings of the 1st Semantic Authoringand Annotation Workshop, pages 1–21.
Ivanov, I., Vajda, P., Goldmann, L., Lee, J.-S., and Ebrahimi, T. (2010).Object-based tag propagation for semi-automatic annotation of images.In Proceedings of the International Conference on Multimedia InformationRetrieval, pages 497–506.
Jaschke, R., Eisterlehner, F., Hotho, A., and Stumme, G. (2009). Testingand evaluating tag recommenders in a live system. In Proceedeings ofthe 3rd ACM Conference on Recommender systems (RecSys 2009), pages369–372.
Jaschke, R., Hotho, A., Mitzlaff, F., and Stumme, G. (2012). Challengesin Tag Recommendations for Collaborative Tagging Systems. In Recom-mender Systems for the Social Web, pages 65–87. Springer Berlin Heidel-berg.
Jaschke, R., Marinho, L., Hotho, A., Schmidt-Thieme, L., and Stumme, G.(2007). Tag Recommendations in Folksonomies. In Proceedings of the 11thEuropean Conference on Principles and Practice of Knowledge Discoveryin Databases, volume 4702 of Lecture Notes in Computer Science, pages506–514.
35

Li, J. and Wang, J. Z. (2008). Real-time computerized annotation of pic-tures. In IEEE transactions on pattern analysis and machine intelligence,volume 30, pages 985–1002.
Marlow, C., Naaman, M., Boyd, D., and Davis, M. (2006). HT06, TaggingPaper, Taxonomy, Flickr, Academic Article, ToRead. In Proceedings ofthe 17th ACM Conference on Hypertext and Hypermedia (ACM Hypertext2006), pages 31–41.
Mathes, A. (2004). Folksonomies Cooperative Classification and Commu-nication Through Shared Metadata. Computer Mediated Communication- LIS590CMC, pages 1–13.
Mika, P. (2007). Ontologies are us: A unified model of social networks andsemantics. Web Semantics: Science, Services and Agents on the WorldWide Web, 5(1):5–15.
Miller, G. A. (1995). WordNet: a lexical database for English.
Robu, V., Halpin, H., and Shepherd, H. (2009). Emergence of consensus andshared vocabularies in collaborative tagging systems. ACM Transactionson the Web, 3(4).
Sen, S., Lam, S., Rashid, A., and Cosley, D. (2006). Tagging, communities,vocabulary, evolution. In Proceeings of the 20th Conference on Commu-nity Supported Cooperative Work, pages 181–190.
Sigurbjornsson, B. and Zwol, R. (2008). Flickr tag recommendation based oncollective knowledge. In Proceedings of the 17th International Conferenceon World Wide Web (WWW 2008), pages 327–336.
Sood, S. C., Owsley, S. H., Hammond, K. J., and Birnbaum, L. (2007).TagAssist: Automatic Tag Suggestion for Blog Posts. In Proceedings ofthe 1st International Conference on Weblogs and Social Media (ICWSM2007), pages 1–8.
Spiteri, L. F. (2013). The structure and form of folksonomy tags: Theroad to the public library catalog. Information Technology and Libraries,26(3):13–25.
Toderici, G., Aradhye, H., Pasca, M., Sbaiz, L., and Yagnik, J. (2010). Find-ing meaning on youtube: Tag recommendation and category discovery. InProceedings of the IEEE Conference on Computer Vision and PatternRecognition (CVPR 2010), pages 3447–3454.
Turnbull, D., Barrington, L., Torres, D., and Lanckriet, G. (2008). SemanticAnnotation and Retrieval of Music and Sound Effects. IEEE TransactionsOn Audio Speech And Language Processing, 16(2):467–476.
36

Vander Wal, T. (2005). Explaining and showing broad and narrow folk-sonomies.
Vander Wal, T. (2007). Folksonomy.
Wagner, C., Strohmaier, M., and Huberman, B. (2014). Semantic Stabilityand Implicit Consensus in Social Tagging Streams. In Proceedings of the23rd International Conference on World Wide Web, pages 735–746.
Wang, M., Ni, B., Hua, X.-S., and Chua, T.-S. (2012). Assistive tagging:A survey of multimedia tagging with human-computer joint exploration.ACM Computing Surveys, 44(4):1–24.
Zangerle, E., Gassler, W., and Specht, G. (2011). Using tag recommen-dations to homogenize folksonomies in microblogging environments. InProceedings of the 3rd International Conference on Social Informatics(SocInfo 2011), volume 6984 LNCS, pages 113–126.
37