analysis of the effect of peer's compliance information on
TRANSCRIPT

133
Analysis of The Effect of Peer's Compliance Information on Tax
Compliance Decisions
Irwan Aribowo
Tax Department of Polytechnic of State Finance STAN, The Ministry of Finance, Indonesia
(email: [email protected])
Nadia Fajriani
Directorate General of Taxation
Laily Rofi’ah
Master of Management Study Program, Pamulang University
Agus Suryono
Faculty of Administrative Science Brawijaya University
Khairul Muluk
Faculty of Administrative Science Brawijaya University
Andy Fefta Wijaya
Faculty of Administrative Science Brawijaya University
Abstract
Taxpayers are an important factor in the self-assessment system. The peer effect is one of the
ways to gain taxpayers’ compliance. This study tries to explore the relationship between
peer’s information and tax decisions on individual taxpayers. This study is based on
experimental methods to determine the effect of information on individual behavior. The
result showed that there was a significant influence between peer’s information and taxpayer
decisions. Moreover, the compliance depends on what information is provided. The statistical
method discovers that both filing and reporting information affect the taxpayer’s decisions.
The Directorate General of Taxes can take advantage of peer’s information in conducting
socialization and counseling in a segmented manner with the help of pillars of social norms.
This action is expected to have an impact on individual taxpayers with the same background
or level and is expected to create constant tax information in the near future.
Keywords:
tax compliance; self-assessment; peer; experimental method
Introduction
The number of individual taxpayers in Indonesia in 2017 reached 31.59 million people,
but the number of individual taxpayers who have an annual Tax Return is only around 14.75
million, based on internal publication data sources of the Directorate General of Taxes (DGT)
(2018). The realization of the compliance ratio in 2016 was only 61% of planned 72.5% target.

134
In 2017, the compliance ratio was 74%, lower than the target of 75%. The low compliance ratio
for individual Indonesian taxpayers, which has not reached 100%, is a challenge for DGT. In
2017 only 31.59 million individuals were registered as individual taxpayers when compared
to the workforce of 121.02 million. This means that not all of the National Workforce have a
Taxpayer Identification Number or have not been registered as individual taxpayers. Of the
31.59 million individual taxpayers, only 14.75 million have the obligation to submit the
Annual Tax Return, while only 74% submitted the Annual Tax Return. This condition causes
the compliance ratio of individual taxpayers less than 10% of workforce population in the
composition of Indonesian population. Tax system in Indonesia adopts a self-assessment
system. Self-assessment focuses on the awareness, willingness and individual compliance in
fulfilling their tax obligations. Harahap (2004:43) states that adopting a self-assessment system
carries the mission and consequences of changing attitudes (awareness) of community
members to pay taxes voluntarily (voluntary compliance). As stated in the general explanation
of the amendments to the three Laws Number 6 of 1983 concerning General Provisions and
Tax Procedures, the state has paved the way by facilitating a self-assessment system. This
system is intended to increase professionalism of the tax apparatus, transparency of tax
administration, and voluntary compliance of taxpayers. The individual's decision to pay or
not to pay taxes involves many related factors. The innate characteristics of the individual
play an important role in decision making, both rationally and intuitively.
Methods
This research is included in the scope of behavioral research in taxation using an
experimental survey method which refers to experimental method in the research of Alm,
Bloomquist and McKee (2017), where hypotheses are proposed and tested through a
quantitative approach. As stated by Jackson and Milliron (1986) that there are demographic
aspects in analyzing peer effect factors in tax compliance, this study re-tests these factors so
that it is expected to show a comparison between the results obtained in this study and the
results of previous studies. Alm, Bloomquist and McKee's (2017, 610) research in Boone, North
Caroline, United States provides a theory that information on what is done by peers will have
a significant impact on a person's tax reporting decisions. Creswell (2014, 3) explains that
quantitative research is an approach to test a theory by analyzing the relationships between

135
variables. This variable is measured through an instrument in order to obtain numerical data
which can be analyzed using statistical procedures. Quantitative research can be generalized
and replicated based on previous findings and theories. Alm, Bloomquist and McKee (2017,
595) use experimental methods in measuring and collecting data on the variables in their
research. Experimental methods are generally accepted as a methodological approach in
economics and have been used to test tax compliance policies widely (Alm, Bloomquist and
McKee 2015, 3). In experimental method, the researcher will identify a sample and generalize
it to the population. The basic objective of an experiment is to examine the impact of a
treatment (treatment or intervention) on the results obtained (Creswell 2014, 155). Research
on the analysis of peer compliance information effect on tax compliance decisions examines
whether giving different treatment to more than one group will lead to different results or test
for the causality effect (cause-and-effect relationship). The effect of causality occurs when
variations in the independent variable are followed by variations in the dependent variable,
in which there is no variation in other variables. Therefore, a tight control is needed over other
variables that may affect this relationship (Sekaran and Bougie, 2016: 168). The experimental
method makes it possible to control the environmental conditions of the study and manipulate
the variables (Neuman, 2014: 283). In terms of sample selection, the experiment in this thesis
is classified as a quasi-experiment, in which the sample selection is not done randomly but is
carried out by convenience (Creswell 2014, 155) as was done by Alm, Bloomquist and McKee
(2017). Therefore, researchers chose the freedom to determine the sample by determining
participants who were easy to find, easy to choose and willing to voluntarily participate in the
experiment. The population in this study is the subject of personal income tax in Indonesia.
To represent this population, research was conducted on students at private universities in
Jakarta using a convenience sampling method, which is the collection of information from
members of the population who are easily found (Sekaran and Bougie 2016, 247). This method
is a nonprobability sampling technique with unequal opportunities for each element or
member of the population to be selected as samples. In some studies, there are conditions
where only the convenience sample method may be used because the researcher has to use
naturally formed groups such as a class, an organization or a family (Creswell 2014, 155).
Research conducted by Alm, Bloomquist and McKee (2017, 595) took samples through a
recruitment mechanism from students at Appalachian State University, North Carolina which

136
is based on a voluntary sample, to represent taxpayer population. This sampling method
needs to be done because the peer concept requires individuals in certain groups (Jackson and
Milliron 1986). Moreover Alm, Bloomquist and McKee (2017) ensure that the selection of
students as experimental subjects can represent the condition of the taxpayer population. This
is based on the results of research by Alm, Bloomquist and McKee (2015, 21) in relation to
external validity of tax compliance experiment which shows that the responses of students to
experiments are mostly the same as those of non-students when faced with a policy treatment.
To get valid results, as many as 200 people were involved in this experiment. According to
Roscoe (1975) as cited by Sekaran and Bougie (2016, 265), if the sample is divided into
subsamples, the minimum number of each category is 30. Of the 200 people, they are divided
into four experimental groups so that each group is 50 people, where one group was not given
treatment (control) while the other three were given treatment (experiment). Referring to the
experiments of Alm, Bloomquist and McKee (2017, 595), 50 people in groups consisting of 10
groups of 5 individuals represent peers, where treatment is given at the group level. The
instruments used in this study are experimental scenarios created on Google Form which can
be accessed by participants via smart phones, tablets or laptops. In certain circumstances
researchers also use paper forms. At the end of the experiment, a questionnaire with closed
questions was prepared to determine the participants' socio-demographic conditions such as
background, age and gender. Participants are required to follow the entire sequence in the
scenario and complete a questionnaire thoroughly, so that the researcher can measure the
compliance decisions taken. The program used for statistical testing is IBM SPSS Statistics 24.
In addition, the Microsoft Office Excel 2013 data processor and Microsoft Office Word 2013
word processor are also used to process raw data and display the results of descriptive
statistical analysis.
Results and Discussion
1. Experimental framework
The experimental design in this study follows the experimental design of Alm,
Bloomquist and McKee (2017) which implements the fundamental elements of self-
assessment system. A participant is given a reward from his willingness to participate in
experiments. He must choose to report or not to report the Tax Return. If he chooses to report

137
his Tax Return, then he must fill in the amount of reported income. Tax is paid on reported
income. If the participant is examined, his income that has not been reported is found and he
must pay taxes that are not reported plus sanctions or fines. As previously mentioned, the
experiment was carried out on a group of five people. These five people are considered peer
to each other in the group (Alm, Bloomquist and McKee 2017, 595). Each group followed two
experimental scenarios plus one session for filling out a demographic data questionnaire. At
the beginning of the experiment, participants were invited to choose Google Form media that
could be accessed through participant-owned devices or using a paper form. Instructions for
following the experiment are available on the selected media. Participants are asked to read
each instruction carefully. Participants are prohibited from interacting with each other during
the experiment and the decisions in each session are personal. Participants are notified that
the responses given are anonymous, while the identification is only used for reward payment
purposes. Participants will be rewarded with the amount of income they generate in the
experiment. In each experimental scenario, participants will receive a maximum income of
200 in dolario units which can be converted into rupiah, where 1 dolario equal to 300 rupiah.
Participants are given the option to report or not report their income (filing decision).
Reporting decisions are marked with the choice "Yes" or "No" on the research instrument
without affixing a signature. If the participant chooses to report his/her income, then there is
a tax that must be paid at a rate of 25 percent. The 25 percent tariff is used based on the upper
quartile of the progressive rate of personal income tax in Indonesia. If the income is reported
in full, after deducting the tax due, only 150 dolario will be earned. Participants are also given
the option to fill in the reporting decision - ranging from 0 to 200 dolario, where taxes are
calculated from the amount of reported income. With this mechanism, the less amount of
income that is reported, the greater the rewards that participants will receive. Maximum
rewards can be obtained if participants do not report their income at all. However,
participants must consider the sanctions or fines that must be paid if the participants are
subject to a tax audit. The probability of being examined is one in every five participants. This
ratio is chosen based on the tax audit ratio in Indonesia and the size of the group in the
experiment. When checked, the participant must pay twice the tax imposed on unreported
income. The amount of the sanction or fine is based on the highest tariff increase sanction
regulated in the Taxation General Provisions. The mechanism for determining the examined
138
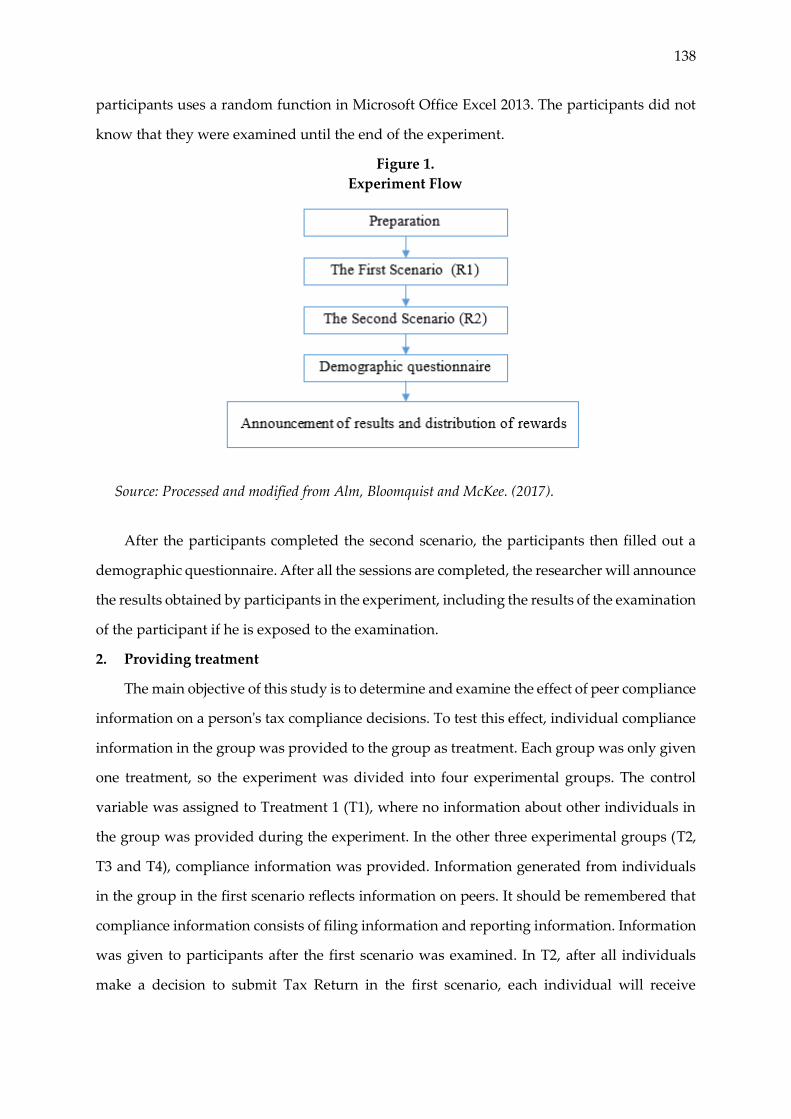
participants uses a random function in Microsoft Office Excel 2013. The participants did not
know that they were examined until the end of the experiment.
Figure 1.
Experiment Flow
Source: Processed and modified from Alm, Bloomquist and McKee. (2017).
After the participants completed the second scenario, the participants then filled out a
demographic questionnaire. After all the sessions are completed, the researcher will announce
the results obtained by participants in the experiment, including the results of the examination
of the participant if he is exposed to the examination.
2. Providing treatment
The main objective of this study is to determine and examine the effect of peer compliance
information on a person's tax compliance decisions. To test this effect, individual compliance
information in the group was provided to the group as treatment. Each group was only given
one treatment, so the experiment was divided into four experimental groups. The control
variable was assigned to Treatment 1 (T1), where no information about other individuals in
the group was provided during the experiment. In the other three experimental groups (T2,
T3 and T4), compliance information was provided. Information generated from individuals
in the group in the first scenario reflects information on peers. It should be remembered that
compliance information consists of filing information and reporting information. Information
was given to participants after the first scenario was examined. In T2, after all individuals
make a decision to submit Tax Return in the first scenario, each individual will receive

139
information on Tax Return submission carried out by each individual in the same group in
that scenario. The information provided is the percentage in the group that submitted Tax
Return, not including the amount of income reported in Tax Return. This information carries
information on compliance behavior with reporting (filing information) on peers, indicating
whether it is compliant or non-compliant, depending on the actual percentage generated.
Figure 2.
Giving treatment at T2, T3 and T4
Source: Processed and modified from Alm, Bloomquist and McKee. (2017).
For T3, however, the information provided to each individual is information regarding
the percentage of individuals in the group that were examined in the scenario, the amount of
taxes they did not report, and the amount of fines they paid. This information carries reporting
information on peers to assess compliance behavior within the group, both positive and
negative. Finally, in T4, each individual will receive both information as in T2 and T3. Table 1
below shows the treatment given.
Table 1.
Experimental Treatment
Treatment / Group T1 T2 T3 T4
Peer information that is checked (reporting information) No No Yes Yes
Peer Tax Return submission information (filing information) No Yes No Yes
Source: Processed from Alm, Bloomquist and McKee. (2017,p 599).
3. Descriptive statistical analysis
In delivering experimental data, descriptive statistical analysis will be used.
Descriptive statistical analysis aims to determine data description, the distribution of samples
that have been collected. Descriptive statistical techniques that can be used include the
presentation of data through tables, graphs, pie charts, pictograms, calculation of mode, mean,

140
median, calculation of deciles, percentiles, calculation of data distribution through calculating
the average and standard deviation, and calculating the percentage (Sugiyono 2010).
4. Normality test
The normality test is carried out to determine data distribution, whether the
independent and dependent variable have a normal distribution or not. The normal
distribution is known based on the regression distribution that is evenly distributed at each
value. The normality test is needed to determine the next type of test to produce an accurate
and consistent predictive value.
The normality test used in this study was the Kolmogorov-Smirnov test (Ruppert 2004,
66). In Kolmogorov-Smirnov test, data is said to be normally distributed if the test result value
is greater than the 0.05 significance level. The data is not normally distributed if the test results
are smaller than the significance level of 0.05 (Vaus, 2002: 77).
5. Hypothesis testing
To test the proposed hypothesis, a statistical test will be carried out. The type of
statistical test that is carried out depends on the results of the data normality test that has been
done previously.
If the data is normally distributed, a parametric statistical test will be carried out,
namely the one-way Analysis of Variance test (One Way ANOVA) and the F test. One Way
ANOVA is used to determine whether there are differences between more than two
independent groups (Vaus, 2002:77). The existence of significant effect of independent
variable on dependent variable is evidenced by the p-value (Sig.) ≤ α. This means that if the
test results are less than significance level of 0.05, there is a significant effect, whereas if the
test results are more than significance level of 0.05, there is no significant effect.
If the data is not normally distributed, a non-parametric statistical test will be carried
out, namely the Kruskal-Wallis test of ranks (Vaus, 2002:77). The Kruskal-Wallis test was
carried out because it fulfilled three assumptions of using this test, namely: 1) the
experimental data was in the form of a continuous variable; 2) the independent variable
consists of two or more groups; and 3) independence of observations, where each participant
is only part of one treatment group in the experiment, there are no participants who follow
more than one experimental group. The existence of significant effect of independent variable
on dependent variable is evidenced by the P-value (Asymp. Sig.) ≤ α. This means that if the

141
test results are less than level of significance of 0.05, there is a significant effect, whereas if the
test results are more than significance level of 0.05, there is no significant effect. Furthermore,
to answer the question of which independent variable has the most influence, further testing
will be carried out, namely comparing the effect of independent variable (T2, T3 or T4) on
control variable (T1). In case the data is normally distributed, a post hoc test will be carried
out. The post hoc (posteriori) test is basically a continuation of One Way ANOVA test. If One
Way ANOVA test statistically shows that there is a significant effect on dependent variable
being tested, then the post hoc test will show in which independent variable the effect occurs.
If the data is not normally distributed, a non-parametric Mann-Whitney U statistical test will
be performed (Vaus, 2002:77). The Mann-Whitney U test is carried out because it fulfills three
assumptions of using this test, namely: 1) the dependent variable is in the form of ordinal or
continuous variable; 2) the independent variables consist of two groups (T1 and T2, T1 and
T3, or T1 and T4); and 3) independence of observations. The amount of influence is
determined based on the results of mean rank test for each experimental variable with control
variable.
6. Implementation of Experiments
The main objective of this study was to determine the significant difference between
untreated (control) and treated (experimental) group of participants. Furthermore, the aim of
the study was to compare between groups of participants with each other to determine the
most effective form of treatment in increasing individual compliance decisions. The
experiment was carried out in several days to meet the number of participants from 17 May
2018 to 8 June 2018. In tax reporting system in Indonesia, a self-assessment is carried out. So,
this experiment uses the same treatment for each individual who will then be referred to as
participants in this thesis. Individuals will receive a certain amount of income from
willingness to participate in this experiment. Then, individuals are required to choose whether
or not to submit the Tax Return. If they choose to submit Tax Return, then they must
determine how much income in dolario is voluntarily reported in Tax Return. The tax
calculation is only paid from reported income. If an audit is carried out on an individual, the
unreported income will be found and all taxes that should have been paid will be billed along
the fine imposed. Individuals are provided with clear and accurate information regarding tax
rates, audit percentages, and penalty rates during the experimental process. The collection of

142
participants was obtained by means of convenience and voluntary sampling. Researchers as
facilitators gathered a number of students who were contacted and willing to participate in
the experiment voluntarily in various places, including on campuses, libraries, shopping
centers, places of worship and residential areas. Experiments were carried out in several days
and several places to meet the quorum number of participants. Researchers closely monitor
each group being tested. Tests conducted using GoogleForm can display percentage data
directly from the number of Tax Return selected to be submitted. For inspection information,
it is processed using Microsoft Office Excel 2013 from downloaded Google Form data or form
data. It took researchers about two minutes to update and display peer data from
GoogleForm, while for manual data, researchers needed about seven minutes to update and
display the data to participants.
Experiments were made with four different treatments in four groups, as was done in
the experiments of Alm, Bloomquist and McKee (2017). Each group consists of different
participants, no participant who gets more than one treatment. Group 1 (T1) as the control
group in the experiment, was not given any information regarding peer compliance. Where
the peer is part of a group in a group of five participants. This study consisted of four groups,
each group consisting of 10 groups consisting of five participants.
The other groups (T2, T3 and T4) were given peer-related information. For example,
in T2, after all participants have made a decision to submit their first Tax Return, participants
will receive information on Tax Return submission conducted by peers in the same group.
The information provided is the percentage of peers who submitted the Tax Return , not
including the number they submitted in Tax Return. Then the second test is carried out, this
test value is taken as peer compliance decision data. Furthermore, in T3, all individuals were
provided with information on the percentage of peers being audited, the amount of taxes they
did not report and the amount of fines they paid. Peer determination is audited using a
random function through the Microsoft Office Excel 2013 application. Finally, in T4,
individuals will receive both information as in T2 and T3.
Technical implementation:
1. Participants are distributed a scenario questionnaire.
2. Participants read the guide and work on the scenario (R1).
3. Participants receive information according to their group (T2 / T3 / T4).

143
4. Participants rework the scenario (R2).
5. Participants collect the questionnaire again and fill out the identity.
6. The determination of the participants to be examined is done randomly according to
the percentage of each peer (5 people).
7. Descriptive Statistical Analysis
All 200 participants were students from seven private campuses in Jakarta. As many
as 84.5% of participants were in the age range 17 to 22 years and the rest were in the range 23
to 28 years. Most of them, or 24%, came from the communication department, while dentistry
was the lowest major at 1.5%. The selection of participants is based on data analysis published
by Alm, Bloomquist and McKee (2015). 56% of participants were women and 44% were men
as shown in table 5. Of all the participants, 97% had not been registered as taxpayers and 3%
were registered as taxpayers with NPWP ownership.
The research was only conducted in the DKI Jakarta area with the consideration of the
diversity of ethnicities, religions and social levels which adequately represent the plurality of
Indonesian society in general. Participants in South Jakarta area dominated data collection as
many as 80 participants. In addition, 44 participants came from East Jakarta, 25 participants
from Central Jakarta, and 26 participants from West Jakarta and North Jakarta 18 participants,
and 7 participants domiciled in Tangerang. In the scenario provided, the amount of income
paid becomes the participant's tendency for compliance decisions. This compliance decision
is measured in dolario units (0 dolario to 200 dolario). The greater the value of earnings
reported by the participants indicates a greater compliance decision. From the results of
experiments that have been carried out, the highest reported income value of 200 dollars is
paid by ten participants, eight of the ten participants are women. The lowest reported income
value was expressed by five male and female participants at 0 dolario. From additional data
on the participant identity section, questions were asked about the possibility of participants
submitting their personal Tax Return obediently. 101 participants chose to comply, 41
participants chose no and 58 participants chose to answer not knowing. Participants were
given information that this data is completely unrelated to the completed scenario. Table 2
contains participant demographic data.

144
Table 2.
Participant Demographics
Source: Processed from primary data.
8. Testing Data
After the experiment is carried out, the primary data will then be processed using the
IBM SPSS Statistics 24 application. In this study, the data normality test was carried out with
the Kolmogorov-Smirnov before the statistical test was carried out. If the Kolmogorov-
Smirnov test states that the data is not normally distributed, the Kruskal-Wallis test is used
for further statistical tests. The Kruskal-Wallis test is a non-parametric test that is used to
determine whether there are differences in treatment groups with various peer information
provided. Meanwhile, to find out which peer information has a significant effect, it must be
tested again with the Mann-Whitney test.
a) Test of normality
The normality test is carried out to know whether the data owned from a limited sample
has a normal distribution, this is needed in the next data processing stage. The normality
test aims to test whether confounding or residual variables have a normal distribution in
regression model, if this assumption is violated, the statistical test will be invalid for a
small sample size, according to Ghozali (2011, 160).

145
In conducting the analysis, the Kolmogorov-Smirnov and Shapiro-Wilk tests were used.
Shapiro-Wilk is considered more accurate when the number of samples it has is less than
50, so this study used Kolmogorov-Smirnov. Following are guidelines for decision
making in determining normality:
1. If Asymp Sig (2-tailed) Kolmogorov-Smirnov and Shapiro-Wilk> 0.05 or equal to 0.05,
the data are normally distributed.
2. If Asymp Sig (2-tailed) Kolmogorov-Smirnov and Shapiro-Wilk <0.05 or equal to 0.05,
the data are not normally distributed.
Table 3.
Test of Normality Results
Source: Processed from primary data using IBM SPSS Statistics 24.
The results of normality test on dolario value are shown in the Kolmogorov-Smirnov
table. Table 3 shows that the probability value (Sig.) with Kolmogorov-Smirnov for
control group without peer information (T1) is 0.008 <0.05, which means that the data is
not normally distributed. In the results of providing information on TAX RETURN
submission (T2) the probability value (Sig.) is 0.002 <0.05, which means that the data is
not normally distributed. Likewise, in the results of providing examination information
(T3) the probability value (Sig.) is 0.005 <0.05, the data is not normally distributed. While
the results of the combination of information (T4) the probability value (Sig.) with
Kolmogorov-Smirnov 0.106> 0.05, which means the data is normally distributed.

146
b) Kruskal-Wallis test
Table 4.
Kruskal-Wallis test results
Source: Processed from primary data using IBM SPSS Statistics 24.
From the Kruskal Wallis test, it can be seen that the Asymp. Sig of 0.006. The test results
were significant when p <0.05. This value indicates a significant effect of giving four
different treatments on compliance decisions that are displayed as dolario reported by
the participants.
c) Mann-Whitney U test
The basic concept in the Mann-Whitney U test is to know whether there is a difference
between two unpaired or independent samples that does not require normally
distributed and homogeneous data. The Mann-Whitney U test was carried out by
comparing each experimental group (T2, T3, and T4) to the control group (T1). The Mann-
Whitney U test was performed using IBM SPSS Statistics 24.

147
Table 5.
Mann-Whitney test results on T1 and T2
Source: Processed from primary data using IBM SPSS Statistics 24.
From the results of the Mann-Whitney U test on T1 and T2 from the Ranks output, we
can see that the mean value for T1 is lower than T2 (Tax Return Information experimental
group) of 53.98. From Mann-Whitney U test value at output "Test Statistic" where the
sig.2-tailed statistical value is 0.230> 0.05, it is known that the test results are not
statistically significant, thus we can state that there is no difference in distribution in
dolario at T1 and T2 due to the provision of Tax Return information to T2.

148
Table 6.
Mann-Whitney test results on T1 and T3
Source: Processed from primary data using IBM SPSS Statistics 24.
The results of the Mann-Whitney test on T1 and T3 from the Ranks output, we can see
that the mean value for T1 is lower than T3 (Examination Information experimental
group). From Mann-Whitney test value at output "Test Statistic" where the sig.2-tailed
statistical value is 0.002 <0.05, it is known that the test results are statistically significant,
thus we can state that there is a difference in the distribution in dolario at T1 and T3 due
to the provision of information.
Table 7.
Mann-Whitney test results on T1 and T4
Source: Processed from primary data using IBM SPSS Statistics 24.

149
The results of Mann-Whitney test on T1 and T4 from the Ranks output, we can see that
the mean value for T1 is lower than T3 (Tax Return Information and Examination
experimental group). From Mann-Whitney test value at output "Test Statistic" where Z
test statistic value is small, namely -2.308 and the sig.2-tailed value is 0.021 <0.05, it is
known that the test results are statistically significant, thus we can state that there are
differences in distribution in dolario on T1 and T4 due to the provision of Tax Return
information and audit carried out as in T4.
9. Research Result
This study has two objectives, the first, to find out the relationship between peer
compliance information and tax compliance decisions and secondly, to determine the peer
information that has the most influence. The results of the Kruskal-Wallis test shows that there
is a statistically significant effect between the control group (T1), the experimental group that
is given peer Tax Return information treatment (T2), peer inspection information (T3) and a
combination of Tax Return information and peer examination. (T4). Therefore, from the
proposed hypothesis, it is concluded that H0 is rejected and H1 is accepted, thus peer
compliance information affects the tax compliance decisions of individual taxpayers.
Table 8.
Conclusions on the First Research Question
Hypothesis Test results
Kruskal-Wallis
Has a
significant
impact? H0 H1
Asymp Value. Sig (p) > 0,05 < 0,05 0,006 Yes
Source: Processed data
The overall Mann-Whitney test shows that there are differences in compliance decision
making seen by displayed dolario value. Treatment of providing peer inspection information
(T3) and providing Tax Return information and peer checking (T4) had a significant effect on
participant compliance decision making compared to the control group (T1). The treatment of
providing peer Tax Return information (T2) did not significantly affect the participants when
compared to the control group (T1). Thus, it can be concluded that peer inspection
information, and Tax Return information and peer inspection are the information that can
effectively improve taxpayer compliance.
Table 9.

150
Conclusions Second Research Question
Treatment Asymp Value. Sig (p) Mann-Whitney test
results for the control group (T1)
Has a significant impact?
(p <0.05)
T2 0,230 No
T3 0,002 Yes
T4 0,021 Yes
Source: Processed data
The results of this study have the same concept with research by Alm, Bloomquist and
McKee (2017) which states that the peer compliance information provided to individuals
before making their compliance decisions has a significant effect on individual tax compliance
decisions. Moreover, individuals are affected by available information regarding what peers
choose to do. However, the provision of information regarding compliance does not always
improve compliance, it depends on what information given. In line with this, this study found
that tax compliance decisions are best influenced by peer inspection information and a
combination of Tax Return submission information and peer inspection.
Conclusion
The research conducted only addresses one of many external factors that influence
individual adherence decisions. The information an individual receives about peer
compliance can influence the decisions that are taken. This research is expected to become one
of the benchmarks for DGT in formulating policies related to tax education so that it can
overcome one of problems in the taxation sector. From 200 participants who participated in
the research experiment and the results of quantitative analysis that had been carried out, the
researchers concluded that:
1. The provision of peer information, which is divided into Tax Return submission
information and audit information, has a significant effect on individual compliance
decisions.
2. Giving peer information regarding audit sanctions becomes a warning that drives or
encourages increased individual compliance. Likewise, the combination of providing peer

151
information in the form of sanctions due to inspection (reporting) and information on Tax
Return submission (filing) is a significant factor that increases compliance decisions.
3. This study proves that not only law enforcement is a factor in increasing compliance
decisions, but also the encouragement of social norms from the surrounding environment
in the form of peer information increases compliance decision making efforts.
In this study, the researcher underlines several limitations that are expected to be
accommodated by future research:
1. The scope that can be expanded even wider, for further research by adding internal factors
from the taxpayer. Because this study only discusses external factors in the form of peer
information. The use of other types of information can also create a broader perspective for
DGT.
2. Limited time, effort and cost of experimentation does not allow for sampling that is evenly
distributed and includes populations throughout Indonesia. In addition, the amount of
income received by participants allows for different perceptions of the feasibility of the
value of money for each individual.
3. This experiment requires a refinement of the research design to better suit the actual
conditions of the taxpayer. Subsequent research can be carried out using taxpayer as a
participant and held regularly, so that time series data will be received which can provide
a more detailed and accurate picture from time to time.
References
Books
Cambridge University Press. (2011). Cambridge Business English Dictionary. Cambridge:
Cambridge University Press.
Cohen, Jacob, Patricia Cohen, Stephen G. West, dan Leona S. Aiken. (2013). Applied Multiple
Regression/Correlation Analysis for the Behavioral Sciences. Third Edition. New Jersey:
Lawrence Erlbaum Associates, Inc.
Creswell, John M. (2014). Research Design: Qualitative, Quantitative, and Mixed Methods
Approaches. Fourth Edition. Los Angeles: SAGE Publications.
Ghozali, Imam. (2011). Aplikasi Analisis Multivariate Dengan Program SPSS. Semarang: Badan
Penerbit Universitas Diponegoro.

152
Harahap, Abdul Asri. (2004). Paradigma Baru Perpajakan Indonesia: Perspektif Ekonomi-Politik.
Jakarta: Integrita Dinamika Press.
Hidayat, Nur. (2015). Corporate Tax RISK Management. Disunting oleh Rayendra L. Toruan.
Jakarta: PT Elex Media Komputindo.
Jones, Gregory Wayne. (2011). A Series of New and Modest Proposals: Political Satire for the 21st
Century. Gregory Jones.
Mardiasmo. (2006). Perpajakan. Edisi Revisi. Yogyakarta: Andi.
Martinez, Mike. (2007). Vault Career Guide to Private Wealth Management. New York: Vault Inc.
Montgomery, Douglas C. (2017). Design and Analysis of Experiments. Ninth Edition. Danvers:
John Wiley & Sons.
Neuman, W. Lawrence. (2014). Social Research Methods: Qualitative and Quantitative Approaches.
8th Edition. London: Pearson Education Limited.
Nurmantu, Safri. (2003). Pengantar Perpajakan. Jakarta: Granit.
Oxford University Press. (2010). Oxford Dictionary of English. Oxford: Oxford University Press.
Pandiangan, Liberti, dan Rayendra L. Toruan. (2008). Modernisasi & Reformasi Pelayanan
Perpajakan: Berdasarkan UU Terbaru. Jakarta: Elex Media Computindo.
Prabowo, Yusdianto. (2004). Akuntansi Perpajakan Terapan: Edisi Revisi. Jakarta: PT Gramedia.
Ratnawati, Juli, dan Retno Indah Hernawati. (2015). Dasar-Dasar Perpajakan. Yogyakarta:
Deepublish CV Budi Utama.
Ruppert, David. (2004). Statistics and Finance: An Introduction. New York: Springer Science &
Business Media.
S.R., Soemarso. (2007). Perpajakan: Pendekatan Komprehensif. Jakarta: Salemba Empat.
Sarwono, Jonathan. (2006). Metode Penelitian Kuantitatif dan Kualitatif. Yogyakarta: Graha Ilmu.
Sekaran, Uma dan Roger Bougie. (2016). Research Methods for Business: A Skill-Building
Approach. Seventh Edition. Chichester: John Wiley and Sons, Inc.
Suandy, Erly. (2008). Perencanaan Pajak. Edisi 4. Disunting oleh Marisa Teresa. Jakarta:
Salemba Empat.
Sugiyono. (2010). Metode Penelitian Kuantitatif Kualitatif dan R&D. Bandung: CV Alfabeta.
Supramono, dan Theresia Woro Damayanti. (2010). Perpajakan Indonesia: Mekanisme dan
Perhitungan. Disunting oleh Rosalina Fiva. Yogyakarta: Andi Offset.

153
Tjahyono, Ahmad, dan Triyono Wahyudi. (2005). Perpajakan Indonesia. Jakarta: Raja Grafindo
Persada.
Vaus, David de. (2002). Analyzing Social Science Data: 50 Key Problems in Data Analysis. London:
SAGE Publications.
Waluyo. (2011). Perpajakan Indonesia. Jakarta: Salemba Empat.
Weiner, B. Irving, dan W. Edward Craighead. (2010). The Corsini Encyclopedia of Psychology,
Fourth Edition, Volume 1. New York: John Wiley and Sons, Inc.
Book chapter
Feld, Lars P., dan Bruno S. Frey. (2007). “Tax Compliance as the Result of a Psychological Tax
Contract: The Role of Incentives and Responsive Regulation.” Laws & Policy 29 (1): 102-120.
Journal article
Alm, James, Kim M. Bloomquist, dan Michael McKee. (2015). “On the External Validity of
Laboratory Tax Compliance Experiments.” Tulane Economics Working Paper Series
(Tulane University) (1512).
Grasmick, H. G., dan W. J. Scott. (1982). “Tax Evasion and Mechanism of Social Control: A
Comparison with Grand Petty and Theft.” Journal of Economic Psychology 2: 213-230.
Grasmick, H. G., dan D. E. Green. (1980). “Legal Punishment, Social Disapproval and
Internalization as Inhibitors.” Journal of Criminal Law and Criminology 71 (3): 325-335.
Hite, Peggy A. (1988). “The Effect of Peer Reporting Behavior on Taxpayer Compliance.” The
Journal of the American Taxation Association (Spring).
Jackson, Betty R., dan Valerie C. Milliron. (1986). “Tax Compliance Research: Findings,
Problems and Prospects.” Journal of Accounting Literature 5 125-65
Kaplan, S. E., dan P. M. J. Reckers. (1985). “A Study of Tax Evasion Judgments.” National Tax
Journal 38: 97-102.
Saad, Natrah. (2012). “Tax Non-Compliance Behaviour: Taxpayers View.” Procedia - Social and
Behavioral Sciences 65: 344-351.
Schwartz, Richard D., dan Sonya Orleans. (1967). “On Legal Sanction.” University of Chicago
Law Review 34: 274-300.

154
Stewart, Miranda. (2003). “Australian stories of tax and fairness: a feminist reading of Peter Carey's
The Tax Inspector.” Australian Feminist Law Journal 18 (1): 1-25.
Journal article with DOI
Alm, James, Isabel Sanchez, dan Ana De Juan. (1995). “Economic and NonEconomic Factors in
Tax Compliance.” Kyklos Vol. 48 (I): 1-18. doi:10.1111/j.1467-6435.1995.tb02312.x.
Alm, James, Kim M. Bloomquist, dan Michael McKee. (2017). “When You Know Your Neighbour
Pays Taxes: Information, Peer Effects and Tax Compliance.” Fiscal Studies Vol. 28 (4): 587-
613. doi:0143-5671.
Chan, Chris W., Coleen S. Troutman, dan David O'Bryan. (2000). “An Expanded Model of
Taxpayer Compliance: Empirical Evidence from the United States and Hongkong.”
Journal of International Accounting, Auditing and Taxation Volume 9 (2): 83-103.
https://doi.org/10.1016/S1061-9518(00)00027-6.
Journal article retrieved from database without DOI
Fischer, Carol M., Martha Wartick, dan Melvin M. Mark. (1992). “Detection Probability and
Taxpayer Compliance: A Review of the Literature.” Journal of Accounting Literature Vol.
11: 1. https://search.proquest.com/openview/
181022c45a0e3880d623df038bc7e494/1?pq-origsite=gscholar&cbl=31366.
Website document
Badan Pusat Statistik. (2018). Laporan Bulanan Data Sosial Ekonomi 2018. Jakarta: Badan Pusat
Statistik.
Krugman, Paul. (2003). The tax-cut con. New York: New York Times Magazine.
OECD. (2017). The Changing Tax Compliance Environment and the Role of Audit. Paris: OECD
Publishing.
Okello, Andrew. (2014). “Managing Income Tax Compliance through Self-Assessment.” IMF
Working Paper WP/14/41.