analysis of the determinants of stock …chss.uonbi.ac.ke/sites/default/files/chss/nancy nyaguthii...
TRANSCRIPT

ANALYSIS OF THE DETERMINANTS OF STOCK PRICE VOLATILITY AT
NAIROBI SECURITIES EXCHANGE
NANCY NYAGUTHII WAWERU
D61/75501/2012
A RESEARCH PROJECT REPORT SUBMITTED IN PARTIAL FULFILLMENT OF
THE REQUIREMENTS FOR THE AWARD OF THE DEGREE OF MASTER OF
BUSINESS ADMINISTRATION, UNIVERSITY OF NAIROBI
OCTOBER 2013

ii
DECLARATION
I declare that, this Research Project is my original work and has not been presented for any
academic award in any university.
Signed ………………………………………Date…………………………………………………
NANCY WAWERU
REG. NO D61/75501/2012
This Research Project has been submitted for examination with my approval as the University
Supervisor.
Signed………………………………………….Date………………………………………………
MR. IRAYA
Lecturer,
Department of Finance and Accounting

iii
ACKNOWLEDGEMENTS
Many people assisted and contributed in different ways in this project. I would like to express
my gratitude to my supervisor who guided me through the research. I would also like to thank
my class mates and colleagues for their encouragement.

iv
DEDICATION
To my late dad, Joseph Waweru, my lovely mum Lucy Wangui and my entire family.
v
ABSTRACT
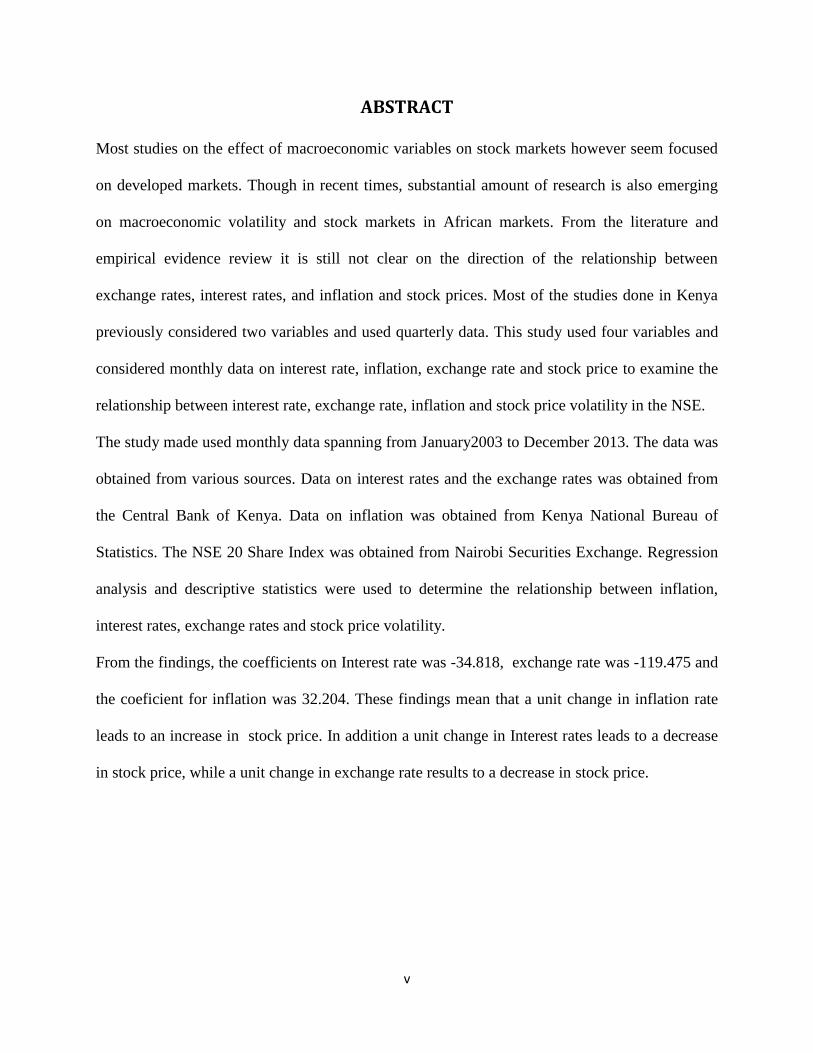
Most studies on the effect of macroeconomic variables on stock markets however seem focused
on developed markets. Though in recent times, substantial amount of research is also emerging
on macroeconomic volatility and stock markets in African markets. From the literature and
empirical evidence review it is still not clear on the direction of the relationship between
exchange rates, interest rates, and inflation and stock prices. Most of the studies done in Kenya
previously considered two variables and used quarterly data. This study used four variables and
considered monthly data on interest rate, inflation, exchange rate and stock price to examine the
relationship between interest rate, exchange rate, inflation and stock price volatility in the NSE.
The study made used monthly data spanning from January2003 to December 2013. The data was
obtained from various sources. Data on interest rates and the exchange rates was obtained from
the Central Bank of Kenya. Data on inflation was obtained from Kenya National Bureau of
Statistics. The NSE 20 Share Index was obtained from Nairobi Securities Exchange. Regression
analysis and descriptive statistics were used to determine the relationship between inflation,
interest rates, exchange rates and stock price volatility.
From the findings, the coefficients on Interest rate was -34.818, exchange rate was -119.475 and
the coeficient for inflation was 32.204. These findings mean that a unit change in inflation rate
leads to an increase in stock price. In addition a unit change in Interest rates leads to a decrease
in stock price, while a unit change in exchange rate results to a decrease in stock price.

vi
TABLE OF CONTENTS
DECLARATION ............................................................................................................................. i
ACKNOWLEDGEMENTS ........................................................................................................... iii
DEDICATION ............................................................................................................................... iv
ABSTRACT .................................................................................................................................... v
CHAPTER ONE ............................................................................................................................. 1
INTRODUCTION .......................................................................................................................... 1
1.1Background………………………………………………………………………………...…..1
1.1.1 Stock Price Volatility...................................................................................................... 2
1.1.2 Determinants of Stock Price Volatility ........................................................................... 2
1.1.3 Relationship between Stock Price Volatility and Its Determinants ................................ 5
1.1.4 Nairobi Securities Exchange .......................................................................................... 7
1.2 Research Problem ..................................................................................................................... 9
1.3 Objectives of the Study ........................................................................................................... 12
1.4 Value of the Study .................................................................................................................. 12
CHAPTER TWO:LITERATURE REVIEW ................................................................................ 13
2.1 Introduction ............................................................................................................................. 13
2.2 Theoretical Framework ........................................................................................................... 13
2.2.1 Liquidity Preference Theory ................................................................................................ 13
2.2.2 Portfolio Balance ................................................................................................................. 14

vii
2.2.3 Purchasing Power Parity Theory ......................................................................................... 15
2.2.4 Fisher Effect Theory ............................................................................................................ 16
2.3 Empirical Literature ................................................................................................................ 17
2.4 Summary of Literature Review ............................................................................................... 20
CHAPTER THREE:RESEARCH METHODOLOGY ................................................................ 21
3.1 Introduction ............................................................................................................................. 21
3.2 Research Design .................................................................................................................... 21
3.3Population………………………………………………………………………….…………21
3.4 Sample and Sampling Design ................................................................................................. 22
3.5 Data Collection Techniques .................................................................................................... 22
3.6 Data Analysis .......................................................................................................................... 22
CHAPTER FOUR: DATA ANALYSIS AND FINDINGS……………………………………..24
4.1 Introduction ............................................................................................................................. 24
4.2 Descriptive Statistics ............................................................................................................... 24
4.3.1 Relationship between Interest rate and stock price .............................................................. 27
4.3.2 Relationship between Inflation and stock price ................................................................... 27
4.3.3 Relationship between Exchange rate and stock price .......................................................... 27
4.3.4 Relationship between Interest rate, Inflation and Exchange rate ......................................... 27
4.3 Inferential Statistics ................................................................................................................ 28
4.4 Regression Analysis………………………………………………………………………….30

viii
CHAPTER FIVE:SUMMARY CONCLUSION AND RECOMMENDATIONS ...................... 32
5.1 Introduction ............................................................................................................................. 32
5.2 Summary of findings .............................................................................................................. 32
5.4 Limitations of the study .......................................................................................................... 34
5.5 Recommendations ................................................................................................................... 34
5.6 Suggestion for further study ................................................................................................... 35
REFERENCES ............................................................................................................................. 36
APPENDICES .............................................................................................................................. 43

ix
LIST OF TABLES
4.1Descriptive statistics ................................................................................................................ 25
4.2 Correlations ............................................................................................................................. 26
4.3Analysis of predictorvariables ................................................................................................. 28
4.4 Analysis of interest rate .......................................................................................................... 29
4.5Coefficients .............................................................................................................................. 30
4.6 Hypothesis testing ................................................................................................................... 31
x
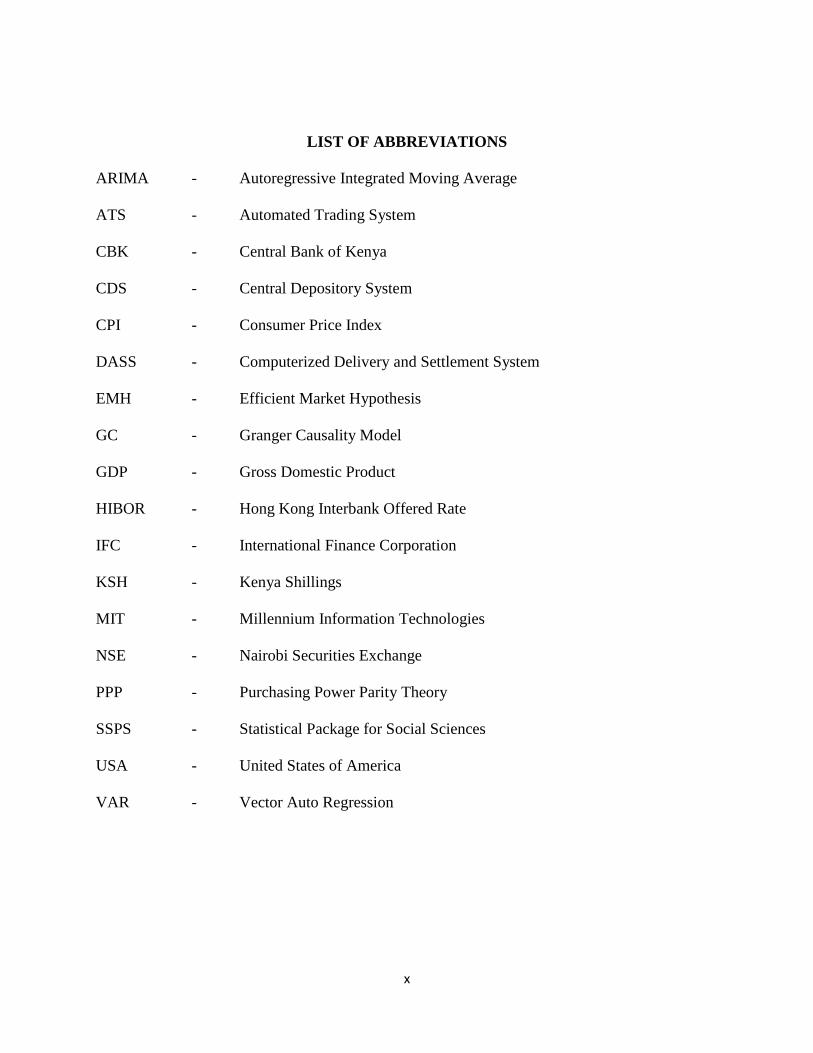
LIST OF ABBREVIATIONS
ARIMA - Autoregressive Integrated Moving Average
ATS - Automated Trading System
CBK - Central Bank of Kenya
CDS - Central Depository System
CPI - Consumer Price Index
DASS - Computerized Delivery and Settlement System
EMH - Efficient Market Hypothesis
GC - Granger Causality Model
GDP - Gross Domestic Product
HIBOR - Hong Kong Interbank Offered Rate
IFC - International Finance Corporation
KSH - Kenya Shillings
MIT - Millennium Information Technologies
NSE - Nairobi Securities Exchange
PPP - Purchasing Power Parity Theory
SSPS - Statistical Package for Social Sciences
USA - United States of America
VAR - Vector Auto Regression

1
CHAPTER ONE
INTRODUCTION
1.1 Background of the Study
With the advent of information technology, especially the internet-based applications in the
capital markets at the global level, information describing the macro and microenvironment of
economies is readily accessible. This flow of information has perhaps, made the capital markets
relatively more efficient as the stakeholders are better placed to access and act in accordance
with the changing dynamics of environment (Pal and Mittal, 2011).
According to the efficient-market hypothesis (EMH) theory (Fama, 1970), an efficient capital
market is one in which stock prices change rapidly as the new information becomes available
(Maysami et al., 2004). Several studies have found a correlation between changes in world
economy and macroeconomic variables. These studies also suggest that the movement of stock
market indices is highly sensitive to the changes in the fundamentals of the economy, to the
changes in the expectation about future prospects (Ahmed, 2008) and may even serve as a proxy
for the pervasive risk factors (Brown and Otsuki, 1990)
Conducive macroeconomic environment promotes the profitability of business, which propels
them to a stage where they can access securities for sustained growth. Generally,the barometers
for measuring the performance of the economy include, among others,real GDP growth rate, rate
of inflation, the exchange rate, fiscal position, the debt position and many other factors. These
2
macroeconomic factors are the major determinants of the growth of an economy. Further, as the
stock prices accurately reflect the underlying fundamentals, they should be employed as leading
indicators of future economic activities (Pal and Mittal, 2011)
1.1.1 Stock Price Volatility
According to Ambrosio (2007) stock market volatility is the fluctuation in the price of broad
stock market indexes over a defined period. When people associated with the investment
industry talk about stock market volatility, often they are referring to the standard deviation of a
stock market index‟s returns.
Investors are by nature risk averse, and the volatility of their investments is of importance to
them because it is a measure of the level of risk they are exposed. The common stock‟s volatility
is a benchmark for measuring risk. It indicates the changing pace in the stock‟s price over a
determined period; the more considerable volatility implies that the possibility of gain or loss is
higher in short-term. So the price of volatile stock would differ considerably over time and it is
very difficult to predict the future price of this stock. Investors usually choose less risky
investment and less risky investments are better than those with higher risk (Kinder, 2002).
1.1.2Determinants of Stock Price Volatility
The determinants of stock price volatility include inflation rate, interest rate and exchange rate.
Tucker (2007) refers to inflation as an increase in the general price level of goods and services in
the economy. Inflation is an increase in the overall average level of prices and not an increase in
any specific product.Sloman and Kevin (2007) explain that inflation may be either demand pull

3
inflation or cost push inflation. Demand pull inflation is caused by persistent rises in aggregate
demand thus the firms responding by raising prices and partly by increasing output. Cost push
inflation is associated by persistent increase in the costs experienced by firms. Firms respond by
raising prices and passing the costs on to the consumer and partly cutting back on production.
Hendry (2006) agrees that inflation is the resultant of many excess demands and supplies in the
economy.
Tucker (2007) observed that there are many measures of inflation, because there are many
different price indices relating to different sectors of the economy. Two widely known indices
for which inflation rates are reported in many countries are the CPI, which measures prices that
affect typical consumers, and the GDP deflator, which measures prices of locally-produced
goods and services.
Exchange rate is the price at which one country‟s currency exchanges for another country‟s
currency. The exchange rate plays a pivotal role in determining the price of a nation‟s product in
the rest of the world and domestic price of goods imported from abroad. Today world trade is
conducted in a floating exchange rate system, where exchange rate changes continuously
throughout the day (Thomas, 2006). Samuelson and Nordhaus (2010) define exchange rate as
prices of one currency expressed in terms of another, they can be expressed in two ways, direct
and indirect quotation.
The role of exchange rate in an open economy frame work is important in the monetary
transmission mechanism. Real exchange rates affect aggregate demand channel of the monetary
4
transmission of monetary policy. It affects the relative prices between domestic and foreign
goods and foreign demand for domestic goods (Ncube and Ndou 2011). Changes in foreign
exchange rates can be measured in nominal and real terms. Most previous studies on the
relationship between stock returns and changes in exchange rates have used nominal exchange
rates. Khoo (1994) argues that if the changes in exchange rates are measured in real terms, then
all variables in the regression equations must also be adjusted for inflation for consistency
purposes. Mark (1990) claims that the contemporaneous movements in nominal and real foreign
exchange rates are almost perfectly correlated for the seven countries used in his study.
According to Thomas (2006) interest rate is the cost of borrowing expressed as a percentage per
year. It is a key economic variable that plays an important role in consumer‟s decision to
purchase. The real interest rate, the interest adjusted for expected inflation is particularly
significant. Samuelson and Nordhaus (2010) define interest as the price paid for borrowing
money over a period of time; they add that there are many interest rates depending upon the
maturity, risk, tax status, and other attributes of loan. Howells and Bain (2008) define interest as
payment from borrowers to lenders which compensates the latter for parting with funds for a
period of time at some risk.
The real interest rate influences consumption and investment expenditures and the way in which
wealth is redistributed between borrowers and lenders. If real interest rates are unusually high
lenders benefit at the expense of borrowers. If real interest rates are abnormally low, borrowers
benefit at the expense of the lenders (Thomas, 2006). Interest rates rank among the most crucial
variables in macroeconomics and in the practical world of finance. Interest rate changes

5
influence many economic phenomena, including the level of consumer expenditures on durable
goods, investment expenditures on plants, equipment and technology and the way wealth is
redistributed between borrowers and lenders. Interest rates influence the prices of key financial
assets such as stocks, bonds, and foreign currencies (Thomas, 2006)
1.1.3 Relationship between Stock Price Volatility and Its Determinants
It is argued that inflation andstock prices are inversely related (Jaffe and Mandelker, 1976;
Bodie, 1976; Nelson, 1976; Fama and Schwert, 1977). This is contrary to prior expectations by
the Fisher hypothesis of a one to one increasing relationship between stock returns and inflation.
Further empirical tests on the response of stock returns to inflation, in the 1980s by Fama (1981),
Gertler and Grinols (1982), and Solnik (1983), amongst others, also yielded similar results of a
negative relationship. Empirical works however continue toproduce mixed results (Gultekin,
1983; Solnik, 1983; Ely and Robinson, 1994; Groenewold et al., 1997; Caporale and Jung, 1997;
Barnes et al., 1999; Boyd et al., 2001).
Two portfolio models of exchange rate transmission mechanism explain the link between
exchange rates and stock returns. According to the Flow-Oriented model (Dornbusch and
Fischer, 1980; Gavin, 1989) a reduction in stock prices reduces wealth of local investors and
further reduces liquidity in the economy. The reduction in liquidity also reduces interest rates,
which in turn induces capital outflows and causes currency depreciation.
In the case of the Stock-Oriented (Branson, 1983; Frankel, 1983) model, the exchange rate
equates demand and supply for assets (bonds andstocks). Therefore, expectations of relative
6
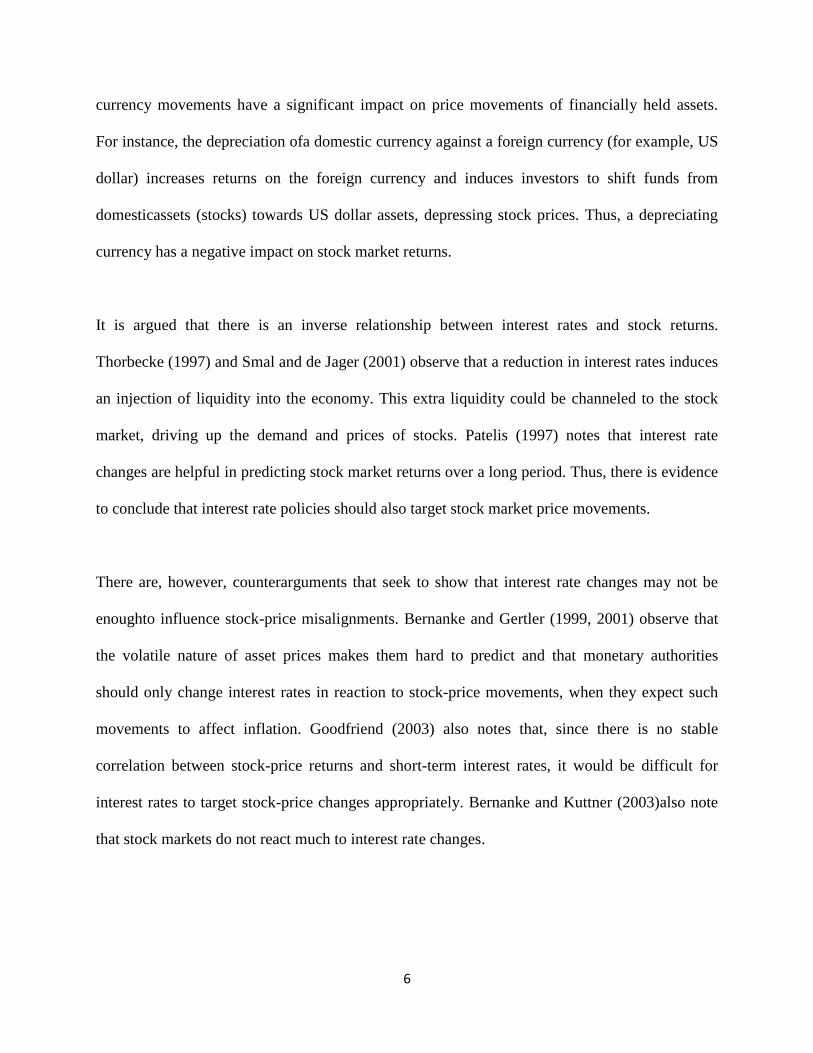
currency movements have a significant impact on price movements of financially held assets.
For instance, the depreciation ofa domestic currency against a foreign currency (for example, US
dollar) increases returns on the foreign currency and induces investors to shift funds from
domesticassets (stocks) towards US dollar assets, depressing stock prices. Thus, a depreciating
currency has a negative impact on stock market returns.
It is argued that there is an inverse relationship between interest rates and stock returns.
Thorbecke (1997) and Smal and de Jager (2001) observe that a reduction in interest rates induces
an injection of liquidity into the economy. This extra liquidity could be channeled to the stock
market, driving up the demand and prices of stocks. Patelis (1997) notes that interest rate
changes are helpful in predicting stock market returns over a long period. Thus, there is evidence
to conclude that interest rate policies should also target stock market price movements.
There are, however, counterarguments that seek to show that interest rate changes may not be
enoughto influence stock-price misalignments. Bernanke and Gertler (1999, 2001) observe that
the volatile nature of asset prices makes them hard to predict and that monetary authorities
should only change interest rates in reaction to stock-price movements, when they expect such
movements to affect inflation. Goodfriend (2003) also notes that, since there is no stable
correlation between stock-price returns and short-term interest rates, it would be difficult for
interest rates to target stock-price changes appropriately. Bernanke and Kuttner (2003)also note
that stock markets do not react much to interest rate changes.

7
1.1.4 Nairobi Securities Exchange
In Kenya, dealing in shares and stocks started in the 1920's when the country was still a British
colony. However the market was not formal as there were no rules and regulations to govern
stock broking activities. Trading took place on a „gentleman's agreement.‟ Standard
commissions were charged with clients being obligated to honor their contractual commitments
of making good delivery, and settling relevant costs. At that time, stock broking was a sideline
business conducted by accountants, auctioneers, estate agents and lawyers who met to exchange
prices over a cup of coffee. Because these firms were engaged in other areas of specialization,
the need for association did not arise (www.nse.co.ke).
In 1951, an Estate Agent by the name of Francis Drummond established the first professional
stock broking firm. He also approached the then Finance Minister of Kenya, Sir Ernest Vasey
and impressed upon him the idea of setting up a stock exchange in East Africa. The two
approached London Stock Exchange officials in July of 1953 and the London officials accepted
to recognize the setting up of the Nairobi Stock Exchange as an overseas stock exchange
(www.nse.co.ke).
In 1954 the Nairobi Stock Exchange was then constituted as a voluntary association of stock
brokers registered under the Societies Act. Since Africans and Asians were not permitted to
trade in securities, until after the attainment of independence in 1963, the business of dealing in
shares was confined to the resident European community. At the dawn of independence, stock
market activity slumped, due to uncertainty about the future of independent Kenya
(www.nse.co.ke).

8
1988 saw the first privatization through the NSE, of the successful sale of a 20% government
stake in Kenya Commercial Bank. The sale left the Government of Kenya and affiliated
institutions retaining 80% ownership of the bank. Notably, on February 18, 1994 the NSE 20-
Share Index recorded an all-record high of 5030 points. The NSE was rated by the International
Finance Corporation (IFC) as the best performing market in the world with a return of 179% in
dollar terms. The NSE also moved to more spacious premises at the Nation Centre in July 1994,
setting up a computerized delivery and settlement system (DASS). For the first time since the
formation of the Nairobi Stock Exchange, the number of stockbrokers increased with the
licensing of 8 new brokers (www.nse.co.ke).
In 1996, the largest share issue in the history of NSE, the privatization of Kenya Airways, came
to the market. Having sold a 26% stake to KLM, the Government of Kenya proceeded to offer
235,423,896 shares (51% of the fully paid and issued shares of Kshs. 5.00 each) to the public at
Kshs. 11.25 per share. More than 110,000 shareholders acquired a stake in the airline and the
Government of Kenya reduced its stake from 74% to 23%. The Kenya Airways Privatization
team was awarded the World Bank Award for Excellence for 1996 for being a model success
story in the divestiture of state-owned enterprises (www.nse.co.ke).
In September 2006 live trading on the automated trading systems (ATS) of the Nairobi Stock
Exchange was implemented. The ATS was sourced from Millennium Information Technologies
(MIT) of Colombo, Sri Lanka, who is also the suppliers of the Central Depository System
(CDS). MIT have also supplied similar solutions to the Colombo Stock Exchange and the Stock
Exchange of Mauritius. The NSE ATS solution was customized to uphold the spirit of the Open
Outcry Trading Rules in an automated environment (www.nse.co.ke).
9
In July 2011, the Nairobi Stock Exchange Limited changed its name to the Nairobi Securities
Exchange Limited. The change of name reflected the strategic plan of the Nairobi Securities
Exchange to evolve into a full service securities exchange which supports trading, clearing and
settlement of equities, debt, derivatives and other associated instruments (www.nse.co.ke).
In September 2011 the Nairobi Securities Exchange converted from a company limited by
guarantee to a company limited by shares and adopted a new Memorandum and Articles of
Association reflecting the change (www.nse.co.ke).
In Kenya,sixty (60) companies are listed in the NSE, which is the only stock exchange firm in
the country. Listed companies fall into two main segments, the main market segment and the
alternative investment market segment. The NSE has classified these companies into ten sectors.
These are; agriculture, commercial and services, telecommunication and technology,
automobiles and accessories, banking, insurance, investment, manufacturing and allied,
construction and allied, energy and petroleum. (www.nse.co.ke).
1.2 Research Problem
It is argued that inflation andstock prices are inversely related (Jaffe and Mandelker, 1976;
Bodie, 1976; Nelson, 1976; Fama and Schwert, 1977). This is contrary to prior expectations by
the Fisher hypothesis of a one to one increasing relationship between stock returns and inflation.
Further empirical tests on the response of stock returns to inflation in the 1980s byFama (1981),
Gertler and Grinols (1982), and Solnik (1983), amongst others yielded similar results of negative
relationship.

10
It is argued that there is an inverse relationship between interest rates and stock returns.
Thorbecke (1997) and Smal and de Jager (2001) observe that a reduction in interest rates induces
an injection of liquidity into the economy. This extra liquidity could be channeled to the stock
market, driving up the demand and prices of stocks. Patelis (1997) notes that interest rate
changes are helpful in predicting stock market returns over a long period. Thus, there is evidence
to conclude that interest rate policies should also target stock market price movements. There
are, however, counterarguments that seek to show that interest rate changes may not be enough
to influence stock-price misalignments. Bernanke and Gertler (1999, 2001) observe that the
volatile nature of asset prices makes them hard to predict and that monetary authorities should
only change interest rates in reaction to stock-price movements, when they expect such
movements to affect inflation.
According to the Flow Oriented model (Dornbusch and Fischer, 1980; Gavin, 1989) a reduction
in stock prices reduces wealth of local investors and further reduces liquidity in the economy.
The reduction in liquidity also reduces interest rates, which in turn induces capital outflows and
causes currency depreciation. In the case of the Stock-Oriented (Branson, 1983; Frankel, 1983)
model, the exchange rate equates demand and supply for assets (bonds and stocks). Therefore,
expectations of relative currency movements have a significant impact on price movements of
financially held assets. For instance, the depreciation of a domestic currency against a foreign
currency increases returns on the foreign currency and induces investors to shift funds from
domestic assets (stocks) towards foreign assets, depressing stock prices. Thus, a depreciating
currency has a negative impact on stock market returns.

11
Most studies on the effect of macroeconomic variables on stock markets however seem focused
on developed markets. Though in recent times, substantial amount of research is also emerging
on macroeconomic volatility and stock markets in emerging markets, these are largely
concentrated on markets in Eastern Europe, South America and Asia, with very few (Jefferis and
Okeahalam, 2000; Osei, 2006) on African markets.
In Kenya, Sifunjo (1999) sought to establish the causal relationship between exchange rate and
stock prices at NSE between 1993 and May 1999. The results showed a unidirectional causality
from exchange rate to stock prices. Nyamute (1998) studied the relationship between stock prices
and other financial variables like money supply, interest rates, inflation rates and exchange rates
in Kenya. He found a positive relationship between stock prices and exchange rates However
results from Sifunjo andNyamutecould have been obsolesced by passage of time owing to stock
automation at NSE and introduction of the Central Depository System.
Seile (2009) studied the relationship between stock market and selected macroeconomic
variables in the NSE which included GDP growth rate, inflation, interest and Treasury bill rates.
Results of the study reveal that market share index is positively related to inflation rate, Treasury
bill rate and gross domestic product while it is negatively related to interest rate. However Siele
(2009) used quarterly time series data this study will use monthly data.
From the literature and empirical evidence review it is still not clear on the direction of the
relationship between exchange rates, interest rates, and inflation and stock prices. Most of the
studies done in Kenya have considered two variables for example Sifunjo and Mwasaru (2012)

12
which considered only two variables, exchange rates and share prices. Seile (2009) considered
four variables but used quarterly time series data. This study will use four variables and consider
monthly data to answer the question, is there a relationship between interest rate, exchange rate,
inflation and stock price volatility in the NSE?
1.3 Objectives of the Study
To examine the determinants of stock price volatility in the Nairobi Securities Exchange.
1.4 Value of the Study
The findings of the study are important in understanding inflation, interest rate and exchange rate
and their impact on share prices in Kenya. The study is important in the formulation of policies
by the government with regard to control of inflation, interest rate and exchange rate and
promotion of investment in the stock market.
The use of information on interest rates, inflation and exchange rate will help market traders and
money market analysts manage better their portfolios. Similarly policymakers are also better
placed to manage the economy and further help develop stock markets more efficiently by
managing these variables that impact on stock markets

13
CHAPTER TWO
LITERATURE REVIEW
2.1 Introduction
This chapter discusses other studies that have been conducted in the area of study. The areas
covered include the theoretical framework empirical literature and summary.
2.2 Theoretical Framework
The theories include liquidity preference theory, portfolio balance, purchasing power parity,
fisher effect theory, the theory of cost push and demand pull inflation.
2.2.1 Liquidity Preference Theory
Liquidity preference theoryconsists in the statement that the rateof interest at any time, being the
reward for parting with liquidity, is a measure of the unwillingness of those who possess money
to part with their liquid control over it. The rate of interest is the price which equilibrates the
desire to hold wealth in the form of cash, with the available quantity of cashone needs money
because one has expenditure plans to finance, or is speculating on the future path of the interest
rate, or, finally, because one is uncertain about what the future may have in store so it is
advisable to hold some fraction of one‟s resources in the form of pure purchasing power.
(Keynes, 1964).
These motives became known as transactions, speculative and precautionary motives to demand
money. On the other hand, in the world of the quantity of money in existence one of the ultimate

14
independent variables is determined by the action of the central bank. Accordingly, most of the
Keynesian literature took liquidity preference to mean demand for money and liquidity
preference theory as a theory whereby the rate of interest is determined by demand andsupply of
money. This narrow interpretation of liquidity preference theory is debatable though. An
alternative view is that it is a theory of asset choice. In fact, as Keynes emphasized in his debate
withOhlin in 1937, liquidity preference was a theoryof choice between holding money idle and
Holding loans, being the role of the rate of interest to equalize the attractions of both (Keynes,
1937).
2.2.2 Portfolio Balance
Portfolio balance model is also known as stock oriented model. Unlike goods market models,
portfolio balance models put much more stress on the role of capital account transactions
Portfolio balance model assumes a negative relationship between stock prices and exchange
rates. A rise in domestic stock prices would attract capital flows, which increase the demand for
domestic currency and causes exchange rate to appreciate. A rising stock market leads to the
appreciation of domestic currency through direct and indirect channels. A rise in prices
encourages investors to buy more domestic assets simultaneously selling foreign assets to obtain
domestic currency indispensable for buying new domestic stocks. The described shifts in
demand and supply of currencies cause domestic currency appreciation (Tahir and Ghani, 2004).
The indirect channel grounds in the following causality chain. An increase in domestic assets
prices results in growth of wealth that leads investors to increase their demand for money, which

15
in turn raises domestic interest rates. Higher interest rates attract foreign,demand for domestic
currency and its subsequent appreciation (Stavarek, 2004).
2.2.3 Purchasing Power Parity Theory
The starting point of exchange rate theory is purchasing power parity (PPP), which is also
Called the inflation theory of exchange rates. PPP can be traced back to sixteen-century Spain
and early seventeen century England, but Swedish economist Cassel (1918) was the first to name
the theory PPP. Cassel once argued that without it, there would be no meaningful way to discuss
over-or-under valuation of a currency. Absolute PPP theory was first presented to deal with the
price relationship of goods with the value of different currencies. The theory requires very strong
preconditions. Generally, Absolute PPP holds in an integrated, competitive product market with
the implicit assumption of a risk-neutral world, in which the goods can be traded freely without
transportation costs, tariffs, export quotas, and so on. However, it is unrealistic in a real society
to assume that no costs are needed to transport goods from one place to another. In the real
world, each economy produces and consumes tens of thousands of commodities andservices,
many of which have different prices from country to country because of transport costs, tariffs,
and other trade barriers (Kanamori& Zhao, 2006).
Absolute PPP is generally viewed as a condition of goods market equilibrium. Under absolute
PPP, both the home and foreign market are integrated into a single market. Since it does not deal
with money markets and the balance of international payments, we consider it to be only a partial
equilibrium theory, not the general one. Perhaps because absolute PPP require many strong

16
impractical preconditions, it fails in explaining practical phenomenon, and signs of large
persistent deviations from Absolute PPP have been documented (Kanamori& Zhao, 2006).
2.2.4 Fisher Effect Theory
Fisher effect theory states that nominal interest rates in two or more countries should be equal to
the required real rate of return to investors plus compensation for the expected amount of
inflation in each country (Dimand, 2003). That is the relationship that exists between interest
rates and exchange rate movements. Fisher (1930) hypothesized that the expected nominal
return on common stocks consists of a “real” return plus one expected rate of inflation (Dimand,
2003). Results of empirical studies have shown that expected inflation, changes in expected
inflation, and unexpected inflation are negatively correlated to stock returns (Kaul, 1987).
Fama and Schwert (1977) explain the generalized fisher effect such that the market, if it is
efficient and reflects all the available information at time t-1, will set the price of common stocks
so that the expected nominal return from t-1 to t is the sum of the appropriate equilibrium
expected real rate and the market‟s assessment of expected inflation rate for the same time
period. When expected inflation is high, investors move out of financial assets into real assets.
According to this hypothesis equities serve as hedges against inflation because they represent
claims to real assets, which suggest a positive stock price is correlated to expected inflation and
appreciation in stock price (Dimand, 2003).
17
2.3Empirical Literature
Pal and Mittal (2011) conducted a study on the relationship between Indian Capital Markets and
key macroeconomic variables such as interest rates, inflation rate, exchange rates and gross
domestic savings of India economy. The study was carried from January 1995 to December
2008. Unit root test, the co-integration test and error correction mechanism (ECM) were used.
The findings of the study established that capital markets indices are dependent on
macroeconomic variables even though the same may not be statistically significant in all the
areas.
Gultekin (1983) tested the Fisher Hypothesis in a sample of 26 countries using time series and
cross-sectional analyses. His time series results were not favorable to the Fisher Hypothesis,
while the cross-sectional study finds that countries with high inflation rates are associated with
high nominal stock returns and this appears to be in contrast to the time series results.
Kullapom and Lalita (2010) conducted a study on the relationship between inflation and stock
prices in Thailand. The study was carried out in the period January 2000 to March 2010. The
statistical method vector auto regression (VAR) was used to find and analyze the association.
Interview was also conducted to gather opinions of investors in stock exchange of Thailand on
how inflation affects equity value. The findings demonstrate that movement to stock prices is
irrelevant to inflation.
In Kenya, Sifunjo (1999) sought to establish the causal relationship between exchange rate and
stock prices at NSE between 1993 and May 1999. He studied the monthly average stock price

18
index and nominal dollar exchange rates by employing co-integration and error-correction
methodology. Sifunjo found the exchange rate and stock prices are co-integrated, non-stationary
in first difference and integrated of order one. The results showed a unidirectional causality from
exchange rate to stock prices. However results from Sifunjo could have been obsolesced by
passage of time owing to stock automation at NSE and introduction of the Central Depository
System.
Anene (2011) studied the relationship between exchange rate and stock prices in Kenya. He used
Granger Causality (GC) model. The study showed that there is a unidirectional causal
relationship between exchange rates (Ksh /US $) for the five year period, that is Granger causes
stock prices at NSE. The study was strong and significant at 90% confidence level.
Nyamute (1998) studied the relationship between stock prices and other financial variables like
money supply, interest rates, inflation rates and exchange rates in Kenya. He found a positive
relationship between stock prices and exchange rates. However, his research performed data
analysis on non-stationary series which may adversely affect the validity of the results.
Sifunjo and Mwasaru (2012) analyzed the casual relationship between NSE stock prices and
foreign exchange rate using monthly data from November 1993 to May 1999. Johansen
consideration procedure and error correction model were used for analysis. The empirical results
indicate that in Kenya, nominal exchange rate of shillings per dollar Granger causes stock price.
The study also found out a unidirectional causality from exchange rates to stock prices.

19
Therefore, the movements in exchange rates exert significant influence on stock price
determination in Kenya.
Seile (2009) studied the relationship between stock market and selected macroeconomic
variables in the NSE which included GDP growth rate, inflation, interest and Treasury bill rates.
Quarterly time series data for the period 1999 to 2008 was analyzed using summary statistics,
correlation and regression analysis to ascertain the relationships. Results of the study reveal that
market share index is positively related to inflation rate, Treasury bill rate and gross domestic
product while it is negatively related to interest rate.
In Africa, Jefferis and Okeahalam (2000) examine the effect of macroeconomic factors on stock
markets in South Africa, Zimbabwe, and Botswana. They found that stock prices have a positive
long-run relationship with real GDP, and real exchange rate in South Africa and Zimbabwe and a
short-run relationship with exchange rate and interestrates in Botswana. Stock prices are also
negatively related to interest rates in SouthAfrica.
Mok(1993) by ARIMA approach and verified by Granger causality test examined the causality
of daily interest rate, exchange rate and stock prices in Hong Kong for the period 1986 to 1991.
The result concluded that the HIBOR (Hong Kong Interbank offered rate) and the price indices
are independent series. As a further extension to the study the relationship between exchange rate
and stock price was examined, the research concluded that those series are independent.

20
2.4Summary of Literature Review
The literature has tackled the concepts of inflation, interest rates, exchange rates and stock price
volatility of firms listed in the NSE. Understanding the inflation, interest rates, exchange rate and
stock price volatility will help advocate for intervention by government through fiscal and
monetary policies to control inflation and interest rates. Empirical review has been provided
with studies on macroeconomic variables being evaluated. As it can be noted, the debate on the
relationshipbetween inflation, interest rate, exchange rate and stock price volatility is not yet
settled. Further, most of these studies were done in different environments which cannot be
generalized to developing countries especially Kenya. Hence, the present study seeks to bridge
the gap.

21
CHAPTER THREE
RESEARCH METHODOLOGY
3.1 Introduction
This chapter outlines how the research was conducted. It contains the research design, population
of the study, sample and sampling design, data collection and data analysis techniques.
3.2 Research Design
Research design refers to the way the study is planned and conducted, the procedures and
techniques employed to answer the research problem or question (McMillan& Schumacher,
1984). The research design used was causal study design that sought to study causal relationship
between variables also referred to as interrelationship because they trace relationship among the
facts obtained to gain a deeper insight into the situation
3.3 Population
A population is a well defined or set of people, services, elements, events, groups of things or
households that are being investigated (Ngechu, 2006). The target population for this study was
all the companies listed in the Nairobi Stock Exchange (NSE). In Kenya, sixty (60) companies
were listed in the NSE by 31st December 2012, which is the only stock exchange firm in the
country. Listed companies fall into two main segments, the main market segment and the
alternative investment market segment (NSE, 2013)

22
3.4 Sample and Sampling Design
A sample size should be chosen in a way that it gives a wide scope for the aim of the study
(Ngechu, 2006). Sampling design is a definite plan for obtaining a sample from a given
population. It refers to the technique or the procedure the researcher would adopt in selecting
item for the sample (Kothari, 2004).It should be representative of the whole target population.
This study used NSE 20 Share Index companies.
3.5 Data Collection Techniques
The study used monthly data on inflation rate, interest rates, and exchange rate and stock prices
for the period January 2003 to December 2012. The study used secondary data which was readily
available from authentic sources and also suitable and adequate. Data for the stock market price
was obtained from the NSE whilst inflation, consumer price index (proxy for inflation) was
obtained from Kenya National Bureau of Statistics while interest rate and exchange rate was
obtained from Central Bank of Kenya. .
3.6 Data Analysis
Data wasanalyzed using regression model to establish the relationship between inflation, interest
rate, exchange rate and stock price volatility. The study applied the following regression model:
Y =a+b1x1 + b2x2+ b3x3+ε
Where;
Y = Stock Price Volatility; measured standard deviation/variance
X1 = Interest Rate; measured by nominal interest rate
X2 = Exchange Rate; measured by nominal exchange rate
23
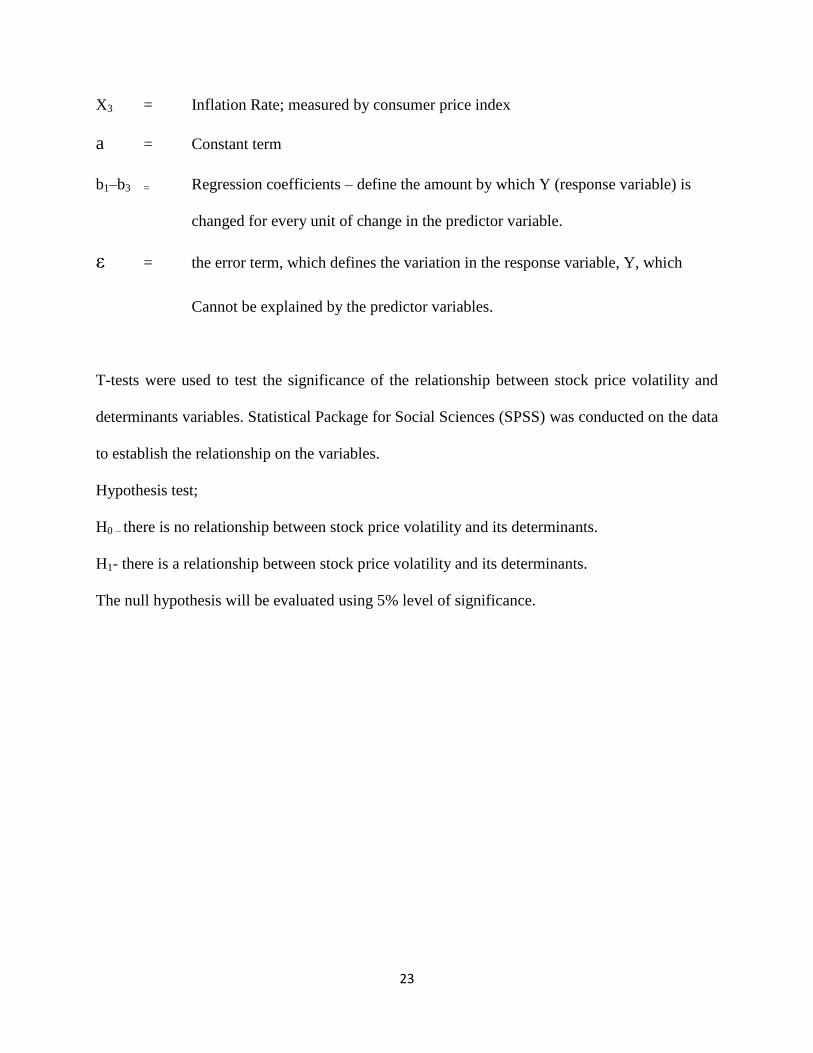
X3 = Inflation Rate; measured by consumer price index
a = Constant term
b1–b3 = Regression coefficients – define the amount by which Y (response variable) is
changed for every unit of change in the predictor variable.
ε = the error term, which defines the variation in the response variable, Y, which
Cannot be explained by the predictor variables.
T-tests were used to test the significance of the relationship between stock price volatility and
determinants variables. Statistical Package for Social Sciences (SPSS) was conducted on the data
to establish the relationship on the variables.
Hypothesis test;
H0 – there is no relationship between stock price volatility and its determinants.
H1- there is a relationship between stock price volatility and its determinants.
The null hypothesis will be evaluated using 5% level of significance.

24
CHAPTER FOUR
DATA ANALYSIS RESULTS AND DISCUSSIONS
4.1 Introduction
This chapter presents the data findings on interest rates, exchange rates, inflation rates and NSE
20 Share Index performance and analysis aimed at determining the relationship between the
variables. The monthly data for NSE 20 Share index was collected from Nairobi Securities
exchange while data on exchange rate and interest was collected from the Central Bank of
Kenya, inflation data was collected from Kenya National Bureau of Statistics.
Data analysis was carried out using both descriptive and quantitative analysis.The results of the
analyses were as follows:
4.2 Descriptive Statistics
Descriptive analysis shows the average and standard deviation of the differentvariables of
interest in the study. It also presents the minimum and maximumvalues of the variables which
help in getting a picture about the maximum andminimum values a variable can achieve.

25
4.1 Descriptive statistics of interest rate, inflation (CPI), exchange rate and stock price.
Variables N Minimum Maximum Mean Standard deviation
Interest 120 .83 20.56 6.8906 3.77161
Inflation 120 55.91 134.25 90.9263 23.26413
Exchange 120 61.90 101.27 76.9153 6.92450
Share 120 1510.63 5774.27 3771.2487 986.49004
Source: (Waweru, 2013)
The study conducted a descriptive analysis on the data collected from secondary sources which is
presented in appendix II. Table 4.1 represents descriptive statistics for NSE 20 Share Index,
interest rate, inflation and exchange rate. The average monthly interest rate, inflation rate,
exchange rate, and NSE 20 share index for the period 2003 to 2012 was 6.8906, 90.9263,
76.9153 and 3771.2487 respectively. The highest value for the interest rate, inflation rate, and
exchange rate and NSE 20 share index for the 10 years was 20.56, 134.25, 101.27, and 5774.27
respectively. The minimum value of interest rate, inflation, exchange rate and NSE 20Share
Index is 0.83, 55.19, 61.90, and 1510.63 respectively. The deviation from the mean value is
3.77161, 23.26413, 6.92450 and 986.49004 for interest rate, inflation, exchange rate and stock
price respectively

26
4.2 correlations for interest rate, inflation, exchange rate and NSE 20 share index
Interest
rate Inflation
Exchange
rate NSE
Interest rate Pearson Correlation 1
Sig. (2-tailed)
N 120
Inflation Pearson Correlation .526**
1
Sig. (2-tailed) .000
N 120 120
Exchange
rate
Pearson Correlation .258**
.570**
1
Sig. (2-tailed) .004 .000
N 120 120 120
NSE Pearson Correlation .050 .211* -.440
** 1
Sig. (2-tailed) .585 .021 .000
N 120 120 120 120
Correlation is significant at the 0.01 level (2-tailed).
Correlation is significant at the 0.05 level (2-tailed).
Source: (Waweru, 2013)

27
4.3.1 Relationship between Interest rate and stock price
Results from the table 4.2 reveal that there is positive relationship between Interest and stock
price (r = 0.050). This implies that there is a very weak association between interest and NSE 20
Share Index which is not significant.
4.3.2 Relationship between Inflation and stock price
The findings also disclosed a significant positive relationship between inflation and NSE 20
Share Index (r = .211**, P-value < 0.05), thus implying that inflation has a positive and
significant relationship with stock price.
4.3.3 Relationship between Exchange rate and stock price
The findings indicated a significant negative relationship between Exchange rate and NSE 20
Share Index (r = .-440**, P-value < 0.01) thus, depicting that exchange rate has a significant
negative relationship to stock price.
4.3.4Relationship between Interest rate, Inflation and Exchange rate
The results in the table above 4.2 indicate that there was a significant positive relationship
between interest rate and inflation (r = .526**, P-value < 0.01). A significant positive
relationship was observed between interest rate and exchange rate (r = .258**, P-value < 0.01).
This implies that exchange rate influences interest rates. In addition, there is a significant
relationship between Inflation and Exchange rate (r = . 570**, P-value < 0.01).

28
4.3 Inferential Statistics
Regression analysis is the statistical technique that identifies the relationship between two or
more quantitative variables: a dependent variable, whose value is to be predicted, and an
independent or explanatory variable (or variables), about which knowledge is available. The
technique is used to find the equation that represents the relationship between the variables.
Multiple regressions provide an equation that predicts one variable from two or more
independent variables. The study adopted multiple regression guided by the following model:
Y= β0+ β1X1+β2X2+ β3X3 +ε
Where:
Y is the dependent variable (NSE 20 Share Index)
β0 is the regression constant
β1, β2, β3, β4, and β5 are the coefficients of independent variables,
X1 is Interest rate
X2 is Inflation
X3 is Exchange rate
ε is the Error Term.
4.3 Analysis of the predictor variables
Model
R R Square
Adjusted R
Square
Std. Error of the
Estimate
d
i
m
e
n
s
1 .723a .522 .510 690.58310
a. Predictors: (Constant), Exchange, Interest, Inflation
Source: Waweru, 2013)

29
In this study, the coefficient of determination (the percentage variation in the dependent variable
being explained by the changes in the independent variables) R2 equals .522, that is, interest rate,
inflation and exchange rate explain 52.2 percent of the variance in stock price.
4.4 Analysis of Variance of exchange rate, interest rate and inflation.
Model Sum of
Squares df
Mean
Square F Sig.
1 Regression 6.049E7 3 2.016E7 42.276 .000a
Residual 5.532E7 116 476905.023
Total 1.158E8 119
a. Predictors: (Constant), Exchange, Interest, Inflation
b. Dependent Variable: NSE
Source: (Waweru, 2013)
In this case, the significance value of the F statistic is 0.00indicating that all the predictor
variables (interest rate, inflation and exchange rate) explain a variation in stock price and that the
overall model is significant

30
4.5 Coefficients of interest rate, inflation and exchange rate.
Model Unstandardized
Coefficients
Standardized
Coefficients
t Sig. B Std. Error Beta
1 (Constant) 10272.371 730.793 14.056 .000
Interest -34.818 19.777 -.133 -1.761 .081
Inflation 32.204 3.772 .759 8.538 .000
Exchange -119.475 11.152 -.839 -10.714 .000
a. Dependent Variable: NSE
Source: (Waweru, 2013)
4.4Regression Equation for interest rate, inflation, exchange rate and stock price
From the above table 4.5 the analysis the Equation becomes;
Y= 10272.371-34.818X1+32.204X2-119.475X3 +ε
From the findings, the coefficients on Interest rate and exchange rate are negative while that of
inflation rate is positive. These findings mean that a unit change in inflation rate leads to an
increase in stock price by 32.204 units. In addition a unit change in Interest rates leads to a
decrease in stock price by 34.818 units, while a unit change in exchange rate results to a decrease
in stock price by 119.475 units.
31
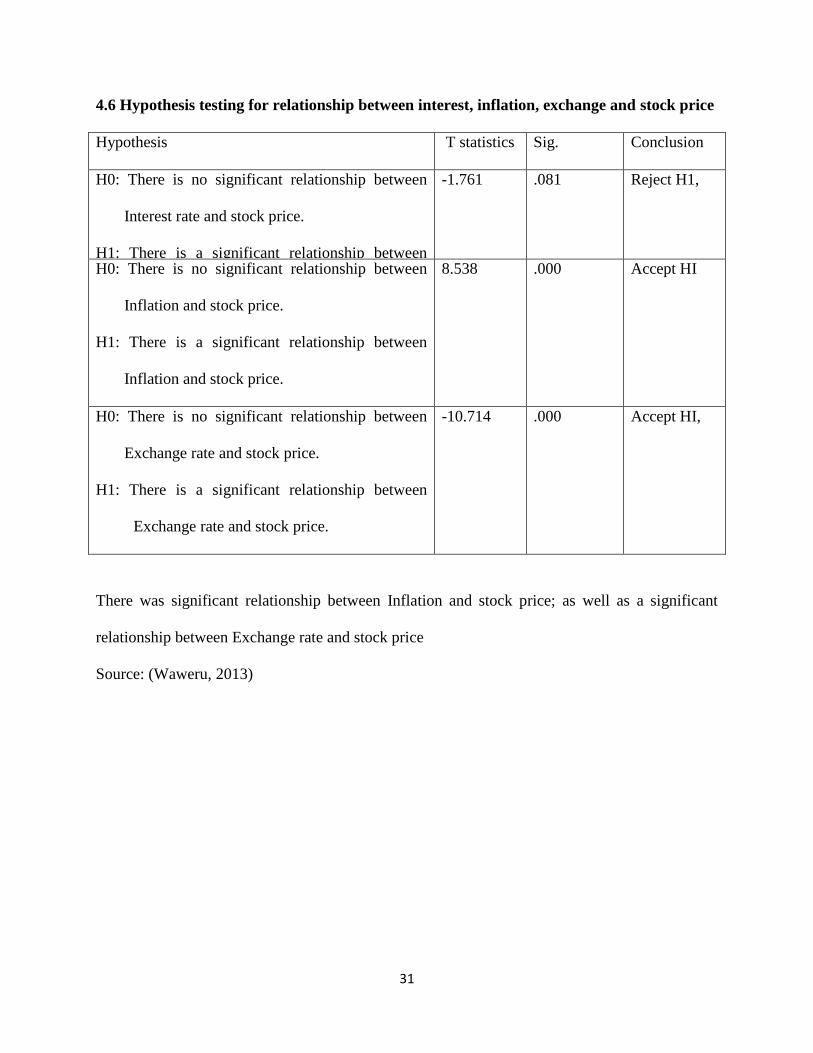
4.6 Hypothesis testing for relationship between interest, inflation, exchange and stock price
Hypothesis T statistics Sig. Conclusion
H0: There is no significant relationship between
Interest rate and stock price.
H1: There is a significant relationship between
Interest rate and stock price.
-1.761 .081 Reject H1,
H0: There is no significant relationship between
Inflation and stock price.
H1: There is a significant relationship between
Inflation and stock price.
8.538 .000 Accept HI
H0: There is no significant relationship between
Exchange rate and stock price.
H1: There is a significant relationship between
Exchange rate and stock price.
-10.714 .000 Accept HI,
There was significant relationship between Inflation and stock price; as well as a significant
relationship between Exchange rate and stock price
Source: (Waweru, 2013)

32
CHAPTER FIVE
SUMMARY CONCLUSION AND RECOMMENDATIONS
5.1 Introduction
This chapter presents summary, conclusion and recommendations. The objective of the study
was to examine the determinants of stock price volatility of firms listed at Nairobi Securities
Exchange.The results of the study were presented in tables. Regression analysis was used to
determine the relationship between interest rate, inflation, exchange rate and stock price.
Descriptive statistics was used to get the minimum, maximum, mean and standard deviation of
the variables.
5.2 Summary of findings
Most studies on the effect of macroeconomic variables on stock markets seem focused on
developed markets. Though in recent times, substantial amount of research is also emerging on
macroeconomic volatility and stock markets in African markets.From the literature and empirical
evidence review it is still not clear on the direction of the relationship between exchange rates,
interest rates, and inflation and stock prices. This study sought to examine the relationship
between interest rate, exchange rate, inflation and stock price volatility in the NSE.
From the findings, the coefficients on Interest rate and exchange rate are negative while that of
inflation rate is positive. These findings mean that a unit change in inflation rate leads to an
increase in stock price by 32.204 units. In addition a unit change in Interest rates leads to a

33
decrease in stock price by 34.818 units, while a unit change in exchange rate results to a decrease
in stock price by 119.475 units.
The results from table 4.2indicate that there was a significant positive relationship between
interest rate and inflation (r = .526**, P-value < 0.01). A significant positive relationship was
observed between interest rate and exchange rate (r = .258**, P-value < 0.01). This implies that
exchange rate influences interest rates. In addition, there is a significant relationship between
Inflation and Exchange rate (r = . 570**, P-value < 0.01).
In this study, the coefficient of determination (the percentage variation in the dependent variable
being explained by the changes in the independent variables) R2 equals .522, that is, interest rate,
inflation and exchange rate explain 52.2 percent of the variance in stock price. The significance
value of the F statistic is 0.00indicating that all the predictor variables (interest rate, inflation and
exchange rate) explain a variation in stock price and that the overall model is significant
5.3 Conclusion
A number of studies have tried to find out whether a relationship exists between Macroeconomic
factors and stock returns for both developed and emerging markets. It is important to understand
the influence of macroeconomic factors on stock prices, because variables such as interest rate,
inflation are used to estimate intrinsic value of financial instruments. In this study, the
relationship between stock prices and macroeconomic variables such as inflation, interest rate,
exchange rate are investigated over the period from January 2003 to December 2012. According
to the findings of the study, the results in the table 4.2 indicate that there was a significant

34
positive relationship between interest rate and inflation, significant positive relationship was
observed between interest rate and exchange rate this implies that exchange rate influences
interest rates. In addition, there is a significant relationship between Inflation and Exchange rate.
Further, there was little evidence of multicollinearity among the predictor variables since the
correlations among them are so strong.
The interest rate variable was found to have a positivebut statistically weak effect on the
performance NSE 20 share index. The lending rate which is avery important determinant when it
comes to the direction of the flow of funds in acountry showed it has considerable effect on the
performance of stock price. From the studyhighlending rate impact negatively on stock prices.
Inflation was found to have adverse effect on the performance of the stock.
5.4 Limitations of the study
The study was restricted only to companies listed in the Nairobi Stock Exchangeand therefore
caution should be taken in generalizing the findings of the study.The analysis has also been
constrained by the sample size which could haveaffected the results.Correlation measures the
linear association between two variables, but it may not always be reliable. Two variables can
have a strong nonlinear relation and still have a very low correlation.
5.5 Recommendations
It is important to highlight that there is the need to implement prudent macroeconomic policies in
order for a country to derive maximum benefits from stock markets. In order to enable the capital
market in general and stock market in particular to take full advantage of the various

35
opportunities and cope with challenges, interest rates, inflation, must be reduced. This must be
done in relation to appropriate monetary policies to ensure macroeconomic stability.
5.6 Suggestion for further study
This research considered four variables; exchange rates, interest rates, inflation and share prices.
In addition, the study considered the exchange rates between Kenya shilling and the US dollar.
Other studies may bedone using additional variables. Future research should not be restricted to
the exchange rates between Kenya shillings and the US dollar, but can consider other major
exchange rates. Significance of the results could possibly be improved upon by applying weekly
data. The use of more frequent observations may better capture the dynamics of stock price and
its determinants.

36
REFERENCES
Ahmed, S. (2008). Aggregate economic variables and stock market in India.International
Journal of Finance & Economics, 14, 144-64.
Ambrosio, F. J. (2007). An Evaluation of risk metrics. Valley Forge, Investment Counseling
And Research, the Vanguard Group.
Anene, J. (2011). Relationship between exchange rate and stock prices in Kenya. Unpublished
MBA Project, University of Nairobi.
Barnes, M.L., Boyd, J.H. and Smith, B.D. (1999). Inflation and asset returns. European
Economic Review, 43, 737-54.
Bernanke, B. and Gertler, M. (1999).Monetarypolicy and asset price volatility. Federal
Reserve Bank of Kansas City Economic Review, 84, 17-50.
Bernanke, B. and Gertler, M. (2001). Should central banks respond to movements in asset?
Prices? American Economic Review Papers and Proceedings, 91, 253-7.
Bernanke, B. and Kuttner, K.N. (2003). What explains the stock market‟s reaction to federal?
Reserve policy? Journal of Finance, 60 (3), 122-157.
Bodie, Z. (1976).Common stocks as a hedge against inflation. Journal of Finance, 31, 459-70.
Boyd, J.H., Levine, R. & Smith, B.D. (2001). Theimpact of inflation on financial sector
Performance.Journal of Monetary Economics, 47, 221-48.
Branson, W.H. (1983). Macroeconomic determinants of real exchange risk, in Herring, R.J.
Managing Foreign Exchange Risk, Cambridge University Press, Cambridge,
37
Brown, S.J. and Otsuki, T. (1990).Macroeconomic factors and the Japanese equity markets:
The CAPMD project, in Elton, E.J. and Gruber, M.J.Japanese Capitals Markets, Harper
& Row, New York, NY.
Caporale, T. and Jung, C. (1997).Inflation and real stock prices.Applied Financial
Economics, 7, 265-6.
Chang, H.J. (2006). Understanding the Relationship between institutions and economic
Development.Some Key Theoretical Issues, Working Papers DP2006/05, World Institute
for development Economic Research.
Dimand, R.W. (2003). Irvin Fisher on the International Transmission of booms and depression
Through monetary standards.Journal of money, credit and banking.35 (1), 49.
Dornbusch, R. and Fischer, S. (1980). Exchange rates and the current account.American
Economic Review, 70(5), 960-71.
Ely, D. P. and K. J. Robinson. (1997). are stocks a hedge against inflation: International evidence
Using along-run approach.Journal of International Money and Finance16, 141-67.
Fama, E.F. &Schwert, G.W. (1977).Asset Return and Inflation.Journal of Financial
Economics, 5, 115-146.
Fama, E.F. (1970). Efficient capital markets: a review of theory and empirical work. Journal
Of Finance, 25, 383-417.
Fama, E. F. (1981). Stock Returns, Real Activity, Inflation, and Money. American
Economic Review, 71(4), 545-65

38
Fisher, I. (1930. TheTheory of Interest, Macmillan, New York.
Frankel, J. (1983). Monetary and portfolio-balance models of exchange rate determination, in
Bhandari, J.S. and Putnam, B.H. (Eds), Economic Interdependence and Flexible
Exchange Rates, MIT Press, Cambridge, MA.
Gavin, M. (1989). The stock market and exchange rate dynamics. Journal of International
Money and Finance, 8(2), 181-200.
Gertler, M. and Grinols, E.L. (1982).Unemployment, inflation and common stock returns.
Journal of Money Credit and Banking, 14 (2), 216-33.
Goodfriend, M. (2003).Interest rate policy should not react directly to asset prices, in Hunter,
W., Kaufman, G. and Pomerleano, M. (Eds), Asset Price Bubbles: The Implications for
Monetary Policy and Regulatory Policies and International Policies, MIT Press,
Cambridge,
Groenewold, N., O‟Rouke, G. and Thomas, S. (1997). Stock returns and inflation: a macro
Analysis. Applied Financial Economics, 7, 127-36.
Gultekin, N. B. (1983). Stock Market Returns and Inflation: Evidence from Other Countries.
Journal of Finance 38(1)49-65.
Hendry, D.F. (2006). Modeling UK Inflation, 1875-1991. Economics Department, Oxford
University, UK.
Howells, P. & Bain, K (2008). Economics of Money Banking and Finance (4th Ed). Prentice
Hall.

39
Jaffe, J. and Mandelker, G. (1976). The Fisher effect for risky assets: an empirical Investigation.
Journal of Finance, 31, 447-58.
Jefferis, K.R and Okeahalam, C.C. (2000). The impact of economic fundamentals on stock
Markets in Africa.Development Southern Africa, 17(1), 23-51.
Kaul, G. (1987). Stock returns and inflation. The role of the monetary sector.Journal of
Financial economics, Elsevier, 18(2), 253-276
Kanamori, T. & Zhao, Z. (2006). The Renminbi Exchange Rate Revaluation: Theory,
Practice and Lessons from Japan, ADBI policy papers, 9.
Keynes, J.M. (1964).TheGeneral Theory of Employment, Interest and Money, New York:
Harcourt, Brace, Jovanovich.
Keynes, J.M. (1937). The General theory of Employment.Journal of Economics. 51(2), 209-223
Khoo, A. (1994). Estimation of foreign exchange exposure: an application to mining
Companies in Australia.Journal of International Money and Finance, 13, 342-63.
Kinder, C. (2002). Estimating Stock Volatility: mimeo.
Kothari, C.R. (2004). Research Methodology Methods and techniques (2nd
Ed.). New Age
International (P) Limited, New Delhi.
Kombo, D.and Tromp, L.A. (2006). Proposal and Thesis Writing. Pauline‟s Publication

40
Africa.
Kullapom, L. and Lalita, R. (2010).Relationship between Inflation and Stock Prices in Thailand.
Master’s Thesis, Umea University, Sweden.
Mark, N.C. (1990). Real and nominal exchange rates in the long run: an empirical investigation.
Journal of International Economics, 28, 115-36.
Maysami, R.C., Howe, L.C. and Hamaz, M.A. (2004). Relationship between macroeconomic
Variables and stock market indices: co-integration evidence from stock exchange of
Singapore’s All-S Sector Indices. Journal Penguruson, 24, 47-77.
McMillan, J. H. and Schumacher,S. (1984). Research in Education: A Conceptual
Introduction Boston.Little Brown and Company.
Mok, M.K. (1993). Causality of Interest rate, exchange rate and stock prices at market
Open and close in Hong Kong. Asia Pacific Journal of Management, 10(2), 123-143.
Ncube N. and Ndou E. (2011). Inflation targeting, exchange rate shocks and output Evidence
From South Africa.African Development Bank Group working paper no. 134.
Nelson, C.R. (1976). Inflation and asset prices in a monetary economy.Journal of Finance,
31, 471-83.
Ngechu.M. (2004), Understanding research process and Methods. An introduction to research
Methods. Acts Press, Nairobi.
NSE. (2013).History of Nairobi Securities Exchange. Retrieved August 16, 2013, from NSE
Website: www.nse.co.ke.

41
Nyamute, M. (1998). The relationship between stock prices and exchange rate, Interest rates,
Money Supply, inflation rate Unpublished MBA Project, University of Nairobi.
Osei, K.A. (2006). Macroeconomic factors and the Ghana stock market. African Finance
Journal, 8(1), 26-38.
Pal, K. and Mittal, R. (2011).Impact of Macroeconomic indicators on Indian Capital Markets.
The Journal of Risk Finance, 12(2), 84-97.
Patelis, A.D. (1997). Stock return predictability: the role of monetary policy. Journal of
Finance, 52, 1951-72.
Samuelson, P.A. andNordhaus W.D. (2010).Economics.McGraw Hill, Newyork.
Siele, W. (2009). An Empirical investigation of the relationship between selected Macro
Economic variables and the Nairobi Stock Exchange 20 Share Index.Unpublished MBA
Project, University of Nairobi.
Sifunjo, E. andMwasaru, A. (2012). The causal relationship between stock prices and exchange
Rates in Kenya.Research Journal of Finance and Accounting, 3(7), 121-130.
Sifunjo, K. (1999). The causal relationship between exchange rates and stock prices in Kenya.
Unpublished MBA Project, University of Nairobi.
Sloman, J. & Kevin, H. (2007).Economics for Business. Prentice Hall, Financial Times.
Smal, M.M. and de Jager, S. (2001). The monetary transmission mechanism in South Africa.
South African Reserve Bank Occasional Paper, No. 16.
Solnik, B. (1983). The relation between stock prices and inflationary expectations: the

42
International evidence.Journal of Finance, 39(1), 35-48.
Stavarek, D. (2005). Stock prices and Exchange Rates in the EU and the USA. Evidence of their
Mutual interactions.Czech Journal of Economics and Finance, 55, 3-4.
Tahir, R. and Ghani, A. A. (2004).Relationship between Exchange Rates and Stock Prices:
Empirical Evidence from Bahrain‟s Financial Markets, EcoMod2004 International
Thorbecke, W. (1997).On stock market returns and monetary policy. Journal of Finance, 76,
635-54.
Thomas,D.B. (2006). Money, Banking and Financial Markets.Thomson- South Western.
Tucker, I.B. (2007). Economics, for Today’s World.Thomson South Western.

43
APPENDICES
Appendix I: Companies listed on the NSE as at 30th December 2012
Agriculture
Eaagads Ltd
Kapchorua Tea Co. Ltd
Kakuzi Ltd.
Limuru Tea Co. Ltd
Rea Vipingo plantationsLtd.
Sasini Tea Ltd
Williamson Tea Kenya Ltd
Commercial and Services
Express Ltd.
Kenya Airways Ltd.
Nation Media Group Ltd.
Standard Group Ltd.
TPS East Africa (Serena) Ltd
Scan Group Ltd
Uchumi Supermarkets Ltd
Hutchings Biemer Ltd
Longhorn Kenya Ltd

44
Telecommunication and Technology
Access Kenya Group Ltd
Safaricom Ltd
Automobiles and Accessories
Car and General (K) Ltd
CMC Holdings Ltd
Sameer Africa Ltd
Marshalls (E.A.) Ltd
Banking
Barclays Bank Ltd.
CFC Stanbic Holdings Ltd.
I & M Holdings Ltd
Diamond Trust Bank of Kenya Ltd
Housing Finance Co. Ltd
Kenya Commercial Bank Ltd
National Bank of Kenya Ltd
NIC Bank Ltd
Standard Chartered Bank Ltd
Equity Bank Ltd
The Co-operative Bank of Kenya Ltd

45
Insurance
Jubilee Holdings Ltd
Pan Africa Insurance Holdings Ltd
Kenya Re-Insurance Corporation Ltd
Liberty Kenya Holdings Ltd
British American Investments Company (Kenya) Ltd
CIC Insurance Group Ltd
Investment
Olympia Capital Holdings Ltd
Centum Investment Co. Ltd
Trans-Century Ltd
Manufacturing and Allied
B.O.C Kenya Ltd
British American Tobacco Kenya Ltd
Carbacid Investments Ltd
East Africa Breweries Ltd
Mumias Sugar Co. Ltd
Unga Group Ltd
Eveready East Africa Ltd
Kenya Orchards Ltd
Baumann and Company Ltd

46
Construction and Allied
Athi River Mining Ltd
Bamburi Cement Ltd
Crown Berger Ltd
East Africa Cables Ltd
East Africa Portland Cement Ltd
Energy and Petroleum
KenolKobil Ltd
KenGen Ltd
Kenya Power and Lighting Co. Ltd
Umeme Ltd

47
Appendix II – Data for NSE 20 Share Index, interest rate, exchange rate and Consumer
Price Index
NSE 20 Share
Month/Year 2003 2004 2005 2006 2007 2008 2009 2010 2011 2012
JANUARY
1,510.63
3,157.88
3,094.30
4,171.80 5,774.27 4,712.71 3,198.90 3,565.28
4464.92 3224.18
FEBRUARY
1,557.74
3,175.36
3,212.81
4,056.63 5,387.28 5,072.41 2,474.75 3,629.41
4240.18
3303.75
MARCH
1,608.34
2,770.60
3,208.66
4,101.64 5,133.67 4,843.17 2,805.03 4,072.93
3887.07
3366.89
APRIL
1,846.63
2,707.60
3,227.59
4,025.21 5,148.07 5,336.03 2,800.10 4,233.24
4029.23
3546.66
MAY
2,074.67
2,689.14
3,505.39
4,349.75 5,001.77 5,175.83 2,852.57 4,241.81
4,078.10
3650.85
JUNE
1,934.96
2,639.75
3,972.15
4,260.49 5,146.73 5,185.56 3,294.56 4,339.28
3,968.12
3703.94
JULY
2,005.08
2,708.03
3,982.00
4,258.54 5,340.08 4,868.27 3,273.10 4,438.58 3,738.46
3832.42
AUGUST
2,107.43
2,708.86
3,938.70
4,486.07 5,371.72 4,648.78 3,102.68 4,454.59 3,465.02
3865.76
SEPTEMBER
2,379.91
2,670.69
3,832.69 4,879.86 5,146.46 4,180.40 3,005.41 4,629.80
3.284
3972.03
OCTOBER
2,457.21
2,829.65
3,939.45 5,314.36 4,971.04 3,386.65 3,083.63 4,659.56 3507.34 4147.28
NOVEMBER
2,736.98
2,918.34
3,974.12 5,615.20 5,234.54 3,341.47 3189.55 4,395.17
3,155 4083.00
DECEMBER
2,737.59
2,945.58
3,973.04 5,645.65 5,444.83 3,521.18 3247.44
4432.60
3,205 4133.00

48
Monthly data on exchange rates
Month/Year 2003 2004 2005 2006 2007 2008 2009 2010 2011 2012
JANUARY 77.72 76.29 77.93 72.21 69.88 68.08 78.95 75.79 81.03 86.34
FEBRUARY 76.84 76.39 76.94 71.80 69.62 70.62 79.53 76.73 81.47 83.18
MARCH 76.58 77.26 74.80 72.28 69.29 64.92 80.26 76.95 84.21 82.90
APRIL 75.66 77.91 76.15 71.30 68.58 62.26 79.63 77.25 83.89 83.19
MAY 71.61 79.24 76.40 71.76 67.19 61.90 77.86 78.54 85.43 84.38
JUNE 73.72 79.27 76.68 73.41 66.57 63.78 77.85 81.02 89.05 84.79
JULY 74.75 79.99 76.23 73.66 67.07 66.70 76.75 81.43 89.90 84.14
AUGUST 75.96 80.83 75.81 72.87 66.95 67.68 76.37 80.44 92.79 84.08
SEPTEMBER 77.90 80.72 74.10 72.87 67.02 71.41 75.60 80.91 96.36 84.16
OCTOBER 77.77 81.20 73.71 72.29 66.85 76.66 75.24 80.71 101.27 85.11
NOVEMBER 76.74 81.20 74.74 71.13 65.49 78.18 74.74 80.46 93.68 85.63
DECEMBER 76.02 79.77 73.11 69.63 63.30 78.04 75.43 80.57 86.66 85.99
Monthly data on interest rates
Month/Year 2003 2004 2005 2006 2007 2008 2009 2010 2011 2012
JANUARY 8.38 1.58 8.26 8.23 6.00 6.95 8.46 6.56 2.46 20.56
FEBRUARY 7.77 1.57 8.59 8.02 6.22 7.28 7.55 6.21 2.59 19.70
MARCH 6.24 1.59 8.63 7.60 6.32 6.90 7.31 5.98 2.77 17.80
APRIL 6.25 2.11 8.68 7.02 6.65 7.35 7.34 5.17 3.26 16.01
MAY 5.84 2.87 8.66 7.01 6.77 7.76 7.45 4.21 5.35 11.18
JUNE 3.00 2.01 8.50 6.60 6.53 7.73 7.33 2.98 8.95 10.09
JULY 1.54 1.71 8.59 5.89 6.52 8.03 7.24 1.60 8.99 11.95
AUGUST 1.18 2.27 8.66 5.96 7.30 8.02 7.25 1.83 9.23 10.93
SEPTEMBER 0.83 2.75 8.58 6.45 7.35 7.69 7.29 2.04 11.93 7.77
OCTOBER 1.00 3.95 8.19 6.83 7.55 7.75 7.26 2.12 14.80 8.98
NOVEMBER 1.28 5.06 7.84 6.41 7.52 8.39 7.22 2.21 16.14 9.80
DECEMBER 1.46 8.04 8.07 5.73 6.87 8.59 6.82 2.28 18.30 8.30

49
Monthly data on inflation - consumer price index(CPI)
Month/Year 2003 2004 2005 2006 2007 2008 2009 2010 2011 2012
JANUARY 56.21 61.35 70.48 76.22 79.75 86.07 97.55 104.89 110.57 130.82
FEBRUARY 55.91 61.41 69.97 76.19 78.57 87.25 100.00 105.18 112.05 130.76
MARCH 57.24 62.00 70.78 76.62 78.40 88.22 100.96 104.97 114.62 132.51
APRIL 58.21 62.61 72.64 76.23 77.76 90.85 101.84 105.56 118.29 133.74
MAY 61.23 64.08 73.54 76.48 78.08 92.68 101.84 105.79 119.48 134.09
JUNE 61.96 65.64 73.46 76.44 79.53 92.89 102.05 105.61 120.91 133.06
JULY 60.46 65.62 73.34 76.30 80.41 92.75 102.33 105.98 122.44 131.92
AUGUST 59.27 68.63 73.35 76.87 80.86 93.79 102.94 106.25 123.97 131.51
SEPTEMBER 58.85 70.02 73.00 77.23 81.43 94.72 103.42 106.74 125.23 131.89
OCTOBER 59.44 70.32 72.93 77.54 81.66 95.29 103.68 106.97 127.20 132.46
NOVEMBER 59.69 70.07 73.33 77.82 82.47 96.95 103.87 107.86 129.13 133.33
DECEMBER 60.28 70.57 74.04 79.46 83.91 96.89 104.66 109.38 130.09 134.25