analysis of the crash experiences of vehicles equipped
TRANSCRIPT

U.S. Department of Transportation National Highway Traffic Safety Administration
DOT HS 808 758 August 1998 Technical Report
Analysis of the Crash Experiences of Vehicles Equipped with Antilock Braking SystemsBBAn Update This document is available to the public from the National Technical Information Service, Springfield, Virginia 22161.

Technical Report Documentation Page
1. Report No.
2. Government Accession No.
3. Recipient=s Catalog No. DOT HS 808 758
4. Title and Subtitle
5. Report Date
Analysis of the Crash Experiences of Vehicles Equipped with Antilock
Braking SystemsBBAn Update
August 1998
6. Performing Organization Code
NRD-30
8. Performing Organization Report No.
7. Author(s) Hertz, Ellen, Ph. D.; Hilton, Judith, and Johnson, Delmas Maxwell
9. Performing Organization Name and Address
10. Work Unit No. (TRAIS) 11. Contract or Grant No.
National Center for Statistics and Analysis; Research and Development; National Highway Traffic Safety Administration; U. S. Department of Transportation; 400 Seventh Street, S. W.; Washington, D. C. 20590
13. Type of Report and Period Covered 12. Sponsoring Agency Name and Address
NHTSA Technical Report
15. Supplementary Notes See An Analysis of the Crash Experience of Light Trucks and Vans Equipped with Antilock Braking Systems, DOT-HS-808-278, May 1995 and An Analysis of the Crash Experience of Passenger Cars Equipped with with Antilock Braking Systems, DOT-HS-808-279, May 1995. 16. Abstract Data from NHTSA=s Fatality Analysis Reporting System (FARS) and State Data System (SDS) were used to analyze the crash experience of ABS-equipped and non-ABS-equipped vehicles for passenger cars (PCs) and light trucks and vans (LTVs). This study updates the results of work published by NHTSA in 1995 using FARS data for 1995 -1996 and SDS data for Florida, Maryland, Missouri, and Pennsylvania for 1995 - 1996. These states were chosen for the study as each, for the period shown, recorded the vehicle identification number (VIN), which is used to determine if specific makes/models of vehicles are equipped with ABS. As with the earlier work, separate analyses were conducted for PCs and LTVs, for each type of ABS system (rear and all wheel), for each of several crash types and each type of road surface (favorable and unfavorable). This analysis also crashesed considered crashes involving pedestrians in addition to the four crash types studied earlier. The findings for PCs study also presents a summary from a review of the literature on the crash experience of DRL-equipped are similar to the earlier results, i.e., a significant reduction in avoiding non-fatal frontal crashes was found. Side impacts and run-off-road crashes on unfavorable surfaces, however, were no longer predicted to increase for PCs. In addition, decreases were found for crashes involving PCs and pedestrians. For all wheel LTVs, increases in fatal rollover and side impact crashes were found. For rear-wheel LTVs, an increase was not found for frontal crashes, as was shown in the previous study. 17. Key Words
18. Distribution Statement
antilock braking systems (ABS); FARS; SDS; rollover; side
This document is available to the public through the National Technical Information Service.

Impact; frontal; rear wheel ABS; all wheel ABS the National Technical Information Service. 19. Security Classif. (of this report)
20. Security Classif. (of this page)
21. No. of Pages
22. Price
Unclassified
Unclassified
XX
Form DOT F 1700.7 (8-72)
Reproduction of completed page authorized
EXECUTIVE SUMMARY This paper updates An Analysis of the Crash Experience of Light Trucks Equipped with Antilock Braking Systems (DOT HS 808 278, May 1995) and An Analysis of the Crash Experience of Fives Equipped with Antilock Braking Systems (DOT HS 808 279, May 1995) both by the same authors. The only substantive changes in methodology are the inclusion of pedestrian-involved crashes and the restriction of the control crashes to a somewhat narrower class. Data from NHTSA's Fatality Analysis Reporting System, supplemented by state crash files, were used to analyze the crash experience of antilock brake-equipped (ABS) and non-ABS-equipped passenger vehicles. State crash files from Florida, Maryland, Missouri, and Pennsylvania were chosen for analysis because these states collect and report, on their automated files, the vehicle identification number for crash-involved vehicles, an important characteristic for identifying specific makes/models and model years. Data for this update were from the calendar years 1995 and 1996. Five ABS-relevant crash types were identified as follows: (1) rollovers, (2) side impacts with parked vehicles or fixed objects, (3) frontal impacts with parked vehicles or fixed objects (4) frontal impacts with another motor vehicle in transport, and (5) pedestrian-involved crashes Passenger vehicle experiences in these five crash types were compared to a control group of passive crashes that are not expected to be affected by the presence of ABS. For light trucks and vans, the two types of ABS, all-wheel antilock systems (AWAL) and rear-wheel antilock systems (RWAL) were analyzed separately. For passenger cars, the vast majority of ABS is AWAL and so attention was restricted to these. The findings for passenger cars in fatal crashes are very similar to the 1995 results. For passenger cars in non-fatal crashes the benefits in avoiding frontal crashes remain about the same. Side impacts and run-off-road crashes, both on a bad surface, went from a predicted increase to non-significance. In addition, there are predicted decreases in crashes involving pedestrians. For LTVs, no significant predicted changes in fatal crashes had been found for AWAL systems in 1995 while the current analysis shows some predicted increases in rollovers and side impacts (both crash types associated with loss of control). In non-fatal crashes with AWAL, frontals on good surfaces went from an increase to a decrease and run-off-road crashes went from non-significance to a decrease. For LTVs with RWAL, the most dramatic change is that frontal crashes both fatal and nonfatal on both surface conditions no longer show an increase as was the case in 1995.

2
PREFACE
The National Highway Traffic Safety Administration (NHTSA) recently completed this updated evaluation of the crash records of passenger vehicles equipped with antilock brake systems (ABS). The data comprise more recent (1995-96) years of ABS exposure. The analysis suggests that ABS has helped reduce vehicle-to-vehicle and pedestrian collisions. Drivers of cars equipped with ABS are not colliding with other vehicles or pedestrians as often as drivers of cars without ABS.
The study, however, shows that current ABS-equipped cars have a higher involvement rate, than cars without ABS, in side impacts and in fatal rollovers. The increase in these loss-of-control type crashes is surprising in view of the good performance of ABS in stopping tests conducted by the agency and others. NHTSA is not yet certain that the observed increase is a direct consequence of the ABS system and/or the driver's interaction with ABS. NHTSA will continue to study the performance of current cars equipped with ABS to find out why run-off-road crashes have increased, and whether the problem is likely to persist in the future. The increase in run-off-road crashes might not be associated with all ABS systems; some current or future designs may perform differently than others. It might result, to some extent, from the inappropriate use of ABS systems by drivers, and it could change as drivers gain more experience with their ABS systems.
Several hypotheses have been suggested to explain the increase in run-off-road crashes. One possibility is that some drivers may negotiate curves or change lanes more aggressively because they believe ABS will enable them to stop in a shorter distance or retain control of their vehicle in extreme driving maneuvers. Other drivers, unaware of how ABS functions, may be pumping or releasing their brakes when the ABS begins to cycle. Another hypothesis is that drivers react to an imminent crash threat by abruptly braking and steering; cars without ABS would lock the front wheels and skid straight ahead, but cars equipped with ABS would remain steerable and could leave the road in those circumstances. It must be emphasized that none of these theories has been confirmed to date, by accident or test data, as an explanation for the increase in crashes.
NHTSA has established a program of data analyses and vehicle testing to obtain a better understanding of the performance of ABS in run-off-road crashes: o National Automotive Sampling System (NASS), Fatality Analysis Reporting System (FARS) and
narrative sections of North Carolina accident reports are being reviewed in-depth for cases involving ABS-equipped cars which ran off the road.
o Drivers who complained to the NHTSA's Auto Safety Hotline about the performance of their ABS
systems will be interviewed. o Discussions will be held with NASS crash investigators and with police officers who drive ABS-
equipped cruisers, or who have investigated crashes involving ABS-equipped vehicles, to gather their insights on possible causes of off-road crashes of ABS-equipped vehicles.
o Recent Human Factors literature will be reviewed to learn how drivers respond (steering and/or braking)
to imminent crash threats. o A research driving simulator will be used to determine average drivers' braking and/or steering responses

3
to simulated crash threats. This study will yield the best objective data likely to be obtained as to what drivers actually do when confronted with an imminent crash threat.
o Combined braking and steering maneuver tests have been conducted with an ABS-equipped vehicle at
NHTSA's Vehicle Research and Test Center to establish the range and bounds of maneuvers that can be successfully executed without a loss of directional control.
Follow-up reports will be released by NHTSA as the results of these efforts become available.
NHTSA's ultimate goal is to identify appropriate actions that can be implemented by the Agency and/or industry to ensure safe, cost-effective braking technology.
In the meantime, NHTSA urges drivers to gain a better understanding of how their ABS systems operate, and to avoid using ABS brakes in a way that could increase crash risk: o Many drivers think the main purpose of ABS is to reduce stopping distances. This is a serious
misconception. ABS will only reduce stopping distances significantly in some special road conditions, but may increase distances in others.
o The principal goals of ABS are to prevent skidding and loss-of-control due to locked-wheel braking,
and to allow a driver to steer the vehicle during hard braking. o Drivers should not pump the brake pedal in cars equipped with ABS. This can defeat the purpose of
ABS and may reduce braking capability. o Drivers should know that the ABS system can make noise and vibrate the brake pedal when it is
working. They should not take their foot off the brake pedal when they hear noise or feel pedal vibration.
o If a driver makes a car skid for reasons other than braking, such as going around a curve too quickly,
ABS will not prevent or relieve the skid. o Drivers of cars equipped with ABS must maintain the same distance behind vehicles they follow that they
would have kept without ABS. They should not expect to stop more quickly because they have ABS. o Drivers of cars equipped with ABS should not drive around curves, or change lanes, or perform other
steering maneuvers any faster or more aggressively than they would have done without ABS. They should not expect ABS to improve their control in these maneuvers.
o Drivers should be aware that extreme steering maneuvers, executed while using ABS brakes, could steer
the car off the road. o ABS can significantly lengthen stopping distances on loose surfaces such as gravel or soft snow.
Drivers should slow down and allow extra distance between vehicles under those conditions.
NHTSA is very interested in hearing from consumers about their experience with ABS systems, especially about cases where vehicles equipped with ABS ended up off the road. Consumers are urged to call NHTSA's Auto Safety Hotline at 1-800-424-9393 (202-366-0123 in the Washington, DC Metro Area). The Auto Safety Hotline can also provide information on the correct use and performance of ABS brakes.


1
INTRODUCTION
Section 2507 of the Highway Safety Act of 1991 (the Act) directs NHTSA to initiate rulemaking to consider the need for any additional brake performance standards , including antilock braking systems (ABS) for all passenger vehicles, i.e., passenger cars, light trucks, sport utility vehicles and vans weighing less than 10,000 pounds. NHTSA's determination of the viability of upgrading braking standards was to include consideration of a mandatory ABS requirement for all passenger vehicles.
Vehicle manufacturers have offered ABS to consumers either as a standard feature or as an option on millions of passenger cars and light trucks since approximately 1985. Most consumers appear to be knowledgeable about the availability of ABS-equipped vehicles, and many have chosen to purchase vehicles equipped with ABS. Manufacturers have actively advertised the availability of ABS on specific vehicle make/models and their potential safety benefits. In addition, several insurance companies offer discounts in premiums to consumers for ABS-equipped vehicles.
The objective of ABS is to automatically modulate braking pressure to prevent the vehicle's wheels from locking during braking. By preventing wheel lockup, ABS allows drivers to control their vehicles even in panic braking situations. Two types of ABS systems are presently available, all-wheel (AWAL) and rear wheel (RWAL). Passenger cars typically are equipped with AWAL, which is designed to keep all wheels of the vehicle rolling in an emergency braking situation. This allows the driver to properly steer the vehicle during the emergency situation and on some road surfaces, is intended to shorten the stopping distance. Most light trucks and vans with ABS are equipped with RWAL. RWAL prevents the rear wheels of these vehicles from "locking up" during emergency braking situations. Preventing lock up is designed to alleviate difficulties in directional control, typically experienced by light trucks and vans in emergency braking maneuvers. An increasing number of light trucks and vans are being equipped with AWAL.
Earlier work to study ABS effectiveness has been conducted by NHTSA's Office of Plans and Policy 1,2 . These studies by Kahane examined the effectiveness of RWAL ABS for light trucks and for passenger cars equipped with ABS. While RWAL was found to be effective in reducing the risk of nonfatal run-off-road crashes for light trucks, this finding did not carry over to fatal run-off-road crashes involving light trucks. Results were conflicting regarding the effect of RWAL in fatal multivehicle crashes and uncertain for nonfatal multivehicle crashes involving light trucks. Collisions with pedestrians, animals, bicyclists, trains, or on-road objects were found to be significantly reduced in light trucks with RWAL. Kahane's findings for passenger cars were also mixed. Both fatal and nonfatal multivehicle crashes were significantly reduced for passenger cars equipped with
1 Kahane, Charles J., Ph.D., Preliminary Evaluation of the Effectiveness of Rear-Wheel Antilock Brake Systems for Light Trucks, December 1993.
2 Kahane, Charles J., Ph.D., Preliminary Evaluation of the Effectiveness of Antilock Brake Systems for Passenger Cars, U. S. Department of Transportation, DOT-HS-808-206, December 1994.

2
ABS. Fatal crashes with pedestrians and bicyclists were also found to be significantly reduced for passenger cars equipped with ABS. However, single vehicle, run-off-road crashes were found to be significantly increased for passenger cars equipped with ABS.
NHTSA's National Center for Statistics and Analysis (NCSA) has also studied ABS effectiveness for light trucks and vans 3 and for passenger cars 4 . NCSA's study found significant reductions in nonfatal rollover crashes and side impacts with fixed objects/parked vehicles for RWAL-equipped light trucks and vans; a significant reduction in nonfatal rollover crashes for AWAL-equipped light trucks and vans; along with mixed findings for fatal crashes. NCSA's study noted that the relatively small number of vehicles equipped with AWAL systems made it difficult to detect significant differences in crashes for these vehicles.
Studies on the effectiveness or impact of ABS have also been conducted by Folksam Research of the Chalmers University of Technology in Sweden 5 and the General Motors (GM) Research and Test Center 6. Until recently, analyses for passenger cars involved crash data for what is believed to be an atypical group of vehicles with limited model years represented in the group. It is recommended that the impact of ABS in specific types of crashes continually be reexamined for passenger vehicles as more of these vehicles are purchased by greater numbers of consumers.
3 Hertz, E., Hilton, J., and Johnson, D. M., An Analysis of the Crash Experience of Light Trucks Equipped with Antilock Braking Systems, DOT HS 808 278, May 1995.
4 Hertz, E., Hilton, J., and Johnson, D. M., An Analysis of the Crash Experience of Passenger Cars Equipped with Antilock Braking Systems, DOT HS 808 279, May 1995.
5 Kullgren A., Lie A., and Tingvall C., The Effectiveness of ABS in Real Life Accidents, #94 S4 O 07, presented at the 14th International Technical Conference on the Enhanced Safety of Vehicles, 1994.
6 Evans, Leonard, Ph.D., ABS and Relative Crash Risk Under Different Roadway, Weather, and Other Conditions, [September 1994], SAE Technical Paper for presentation at SAE Annual Meeting in February 1995.

3
DATA SOURCES, SELECTING CRASHES AND IDENTIFYING VEHICLES
Data from NHTSA's Fatality Analysis Reporting System (FARS) were used to analyze the fatal crash experience of ABS- and non-ABS-equipped passenger vehicles in this study. FARS began in 1975 and contains census data on the most severe traffic crashes, i.e., those resulting in a fatality. A crash is included in FARS when it involves a motor vehicle traveling on a trafficway open to the public and results in the death of an occupant of a vehicle or a nonmotorist within 30 days of the crash. FARS data for calendar years 1995-96, the two most recent available years, were selected for this analysis. It was felt that the two most recent years of data would provide a sufficiently large sample of crashes involving both ABS- and non-ABS-equipped vehicles.
In addition to data from FARS, the two most recent years (1995-96) available of crash files for the states of Florida, Maryland, Missouri and Pennsylvania were chosen for analysis. The files for Florida, Maryland, Pennsylvania, and Missouri contain data on all applicable crashes, ranging from property-damage-only to fatal, which occurred in each of these states. In addition, these states collect and report in their automated crash files the vehicle identification number (VIN) of crash-involved vehicles. This characteristic was important in selecting the state files that would be used in this analysis, as VIN was used to identify specific makes and models of passenger vehicles that were equipped with ABS and to identify comparable non-ABS vehicles.
Once FARS and the specific state files were selected for use in the analysis, the next step was to prepare each of these data files into treatment groups and a control group. The objective was to separate those crashes in which the passenger vehicle(s) involved would be affected by the presence of ABS (i.e., treatment groups), from those crashes in which the passenger vehicle(s) involved would not be affected by ABS (i.e., a control group). With this view in mind, certain crash types considered to be "ambiguous" were deleted. Ambiguities in characterizing crashes and the passenger vehicles involved in these crashes arose in the following areas: crash factors, driver factors, and environmental factors.
Crash factors: Crashes were considered ambiguous if, for example, it was uncertain whether ABS would have been beneficial in either avoiding the crash or reducing the severity of the crash. These ambiguous crashes included sideswipes in multivehicle collisions, head-on collisions and collisions with a vehicle on another roadway, as well as crashes in which the manner of collision was either unknown or characterized as "front-rear". Front-rear crashes are those in which the passenger vehicles have at least two impacts, one in front and one in the rear, as in a "pile-up" crash.
Driver factors: Passenger vehicles with an alcohol-impaired driver were also eliminated from the treatment groups, as it was considered questionable whether or not a driver under the influence would be able to use ABS properly in an emergency crash situation.7
Environmental factors: Crashes where the road condition (i.e., wet vs. dry, paved vs. unpaved) was unknown were deleted since one goal of the study was to determine the effect of ABS separately for favorable ("good", i.e., paved, free of debris, dry) and unfavorable ("bad", i.e., wet, snowy, icy, gravel, unpaved) road conditions.
7 A separate analysis including vehicles operated by alcohol-impaired drivers was conducted to determine if the findings of ABS effectiveness would be greatly affected. The results including alcohol-impaired drivers were almost identical to the results without these drivers.

4
Data for the remaining crashes were divided into five separate treatment groups as follows. Each of the five types of ABS-relevant crashes were defined according to the first event:
(1) rollovers (ROLL); (2) frontal impacts with parked vehicles or fixed objects, i.e., "run-off-the-road" (ROR) situations, in which it is unclear whether either inability to stop and/or loss of control were major crash factors
(3) side impacts with parked vehicles or fixed objects (SIDE), both considered "loss of control" situations;
(4) frontal impacts with another motor vehicle in transport (FRONT), i.e., "did not stop in time" situations; and
(5). impacts with a pedestrian (PED).
The passenger vehicles involved in these five treatment groups of crashes were considered to represent
those for which there would be potential safety benefits of ABS.
The control group of vehicles consisted of vehicles that were standing still or starting out from a parked position at the time of the crash. Crash involvement rates for each of the five treatment groups were analyzed and compared with the crash involvement rate for the control group.
Once the passenger vehicles in FARS and the state files were separated into treatment and control groups, it was necessary to identify which specific makes and models were equipped with ABS versus those that were not. This was done with VINPLUS. Passenger cars that did not decode as either having ABS unavailable or AWAL standard and LTVs that did not decode as having ABS unavailable or AWAL standard or RWAL standard were eliminated. ANALYTICAL METHOD
A crash was considered ABS relevant if it might have been affected by the presence of ABS. Obviously, there is no direct way to count the crashes that were prevented, nor is there any way to determine if ABS was activated during the pre-crash maneuver. The basic approach, therefore, was to study the change in the proportion of crashes that were relevant, assuming that the presence or absence of ABS does not affect the occurrence of non-relevant crashes. The analytical methodology chosen for this study also controls for some demographic characteristics of the drivers along with environmental and vehicle factors. As stated, five types of relevant crashes, also called treatment groups, were considered. These treatment groups are rollover (ROLL), side impact with a fixed object (SIDE), frontal impact with a fixed object (i.e., run-off-the-road crashes, (ROR), involvement in a two-car crash as the striking vehicle (FRONT) and impact with a pedestrian (PED) . Separate analyses were conducted for crashes that occurred on favorable road conditions, "good" vs. unfavorable road conditions, "bad".
The basic technique was to consider the crash data as each observation corresponding to a vehicle that

5
had been in a crash. Logistic regression 8 was used to test the effect of ABS on the probability that the crash was relevant, while controlling for other factors. This technique has been successfully used in other NCSA and NHTSA studies. 9,10
8 Hosmer, D. and Lemeshow, S., Applied Logistic Regression, John Wiley and Sons Publications, 1989.
9 Klein, T. M., Hertz, E., Borener, S., A Collection of Recent Analyses of Vehicle Weight and Safety, U. S. Department of Transportation, DOT HS 807 677, May 1991.
10 Klein, Terry M., A Statistical Analysis of Vehicle Rollover Propensity and Vehicle Stability, SAE Technical Paper Series 920584, The Society for Automotive Engineers, 1992]
Estimating the impact of ABS in reducing relevant crashes could be confounded by factors related to the driver, environment, crash, or other circumstances. To accurately estimate the impact of ABS, therefore, variables were included in the logistic regression to control for those factors, other than ABS, which could influence the proportion of relevant crashes. For example, if ABS-equipped passenger vehicles are more likely to be driven by younger males than by other segments of the driving population, then driver and vehicle characteristics could confound estimating the impact of ABS. As a result, the age and the sex of the driver, whether or not the crash occurred on a curved road segment (thereby increasing the difficulty in maneuvering to avoid a crash), whether the crash occurred in a rural vs. an urban setting, and the age of the vehicle were chosen for inclusion in the logistic regression model.
For passenger cars, for each of the four states and FARS, for each type of road condition, for each of the five types of treatment group crashes, a logistic regression was conducted of the form: logit(p) = AGE YOUNG MALE CURVED ABS RURAL VEH_AGE where p is the probability of an ABS-relevant response, AGE is the age of the driver and YOUNG is an indicator variable that takes the value 1 if the driver is under 25, 0 otherwise. RURAL, an indicator of crashes occurring in rural vs. urban areas, was not available in Missouri and an indicator variable for speed limit of at least 45 mph was substituted. For LTVs, both for AWAL and for RWAL ABS systems, for each of the four states and FARS, for each type of road condition, for each of the five types of treatment group crashes, a logistic regression was conducted of the form: logit(p) = AGE YOUNG MALE CURVED ABS RURAL VEH_AGE VAN where VAN is an indicator variable that takes the value 1 if the vehicle is a VAN and 0 otherwise. RWAL LTVs

6
were excluded for analyses of AWAL ABS LTVs and AWAL LTVs were excluded for analyses of RWAL ABS LTVs.
Each of these models was run a second time with only those predictors that were statistically significant, while retaining ABS. This resulted in a final estimate of the coefficient for ABS and its standard error for each of the analyses, as shown in Tables 1(a)-1(c) for passenger cars, RWAL ABS LTVs and AWAL ABS LTVs respectively. Tables 1(a)-1(c) entries represent the change in the log odds ratio of an ABS-relevant to an ABS-nonrelevant crash in the presence of an ABS-equipped vehicle. Negative coefficients represent a reduction that is associated with the presence of ABS.

7
TABLE 1a Summary of Logistic Regressions for Antilock-Equipped Passenger Cars Rollover Crashes
On Good Surfaces
On Bad Surfaces
Database
ABS Coeff.
Std. Error
ABS Coeff.
Std. Error
0.4132 *
0.1523
-0.1469
0.3908
0.0528
0.0861
0.0797
0.1911
-0.4398
0.2359
-0.1157
0.2785
-0.2772 *
0.1056
0.2185
0.1065
FARS FLORIDA MARYLAND PENNSYLVANIA MISSOURI
-0.3481 *
0.0900
0.1425
0.1427
Side Impact Crashes w/Parked Vehicle or Fixed Object
On Good Surfaces
On Bad Surfaces
Database
ABS Coeff.
Std. Error
ABS Coeff.
Std. Error
0.4759 *
0.1526
0.5271 *
0.2454
0.2495 *
0.0627
0.5067 *
0.0877
0.0234
0.0488
-0.0080
0.0586
-0.1301
0.1899
0.0193
0.1699
FARS FLORIDA MARYLAND PENNSYLVANIA MISSOURI
0.0086
0.0578
-0.1290
0.0866

8
TABLE 1a (continued) Summary of Logistic Regressions for Antilock-Equipped Passenger Cars Front Impact Crashes w/ Another Vehicle in Transport
On Good Surfaces
On Bad Surfaces
Database
ABS Coeff.
Std. Error
ABS Coeff.
Std. Error
0.0472
0.0962
-0.5184 *
0.1947
-0.2318 *
0.0154
-0.6059 *
0.0325
-0.1181 *
0.0462
-0.4400 *
0.0768
-0.1265 *
0.0371
-0.5108 *
0.0591
FARS FLORIDA MARYLAND PENNSYLVANIA MISSOURI
-0.1627 *
0.0279
-0.4969 *
0.0500
Front Impact Crashes w/ Parked Vehicle or Fixed Object
On Good Surfaces
On Bad Surfaces
Database
ABS Coeff. Std. Error
ABS Coeff.
Std. Error
-0.1146
0.1126
-0.1690
0.2219
-0.1373 *
0.0340
0.0610
0.0588
-0.0235
0.0823
-0.1628
0.1052
-0.1796 *
0.0639
0.1133
0.0817
FARS FLORIDA MARYLAND PENNSYLVANIA MISSOURI
-0.1634*
0.0472
-0.0206
0.0730
* Indicates Statistical Significance at the á = 0.05 level, two-tailed test

9
TABLE 1a (continued)
Summary of Logistic Regressions for Antilock-Equipped Passenger Cars Impacts with a Pedestrian
On Good Surfaces
On Bad Surfaces
Database
ABS Coeff.
Std. Error
ABS Coeff.
Std. Error
0.0982
0.1039
-0.4747 *
0.2238
-0.1362 *
0.0278
-0.4839 *
0.0588
-0.0750
0.0549
-0.3003 *
0.0764
-0.2219 *
0.0767
-0.3029 *
0.1312
FARS FLORIDA MARYLAND PENNSYLVANIA MISSOURI
-0.0118
0.0483
-0.0905
0.0992
Indicates Statistical Significance at the á = 0.05 level, two-tailed test
10
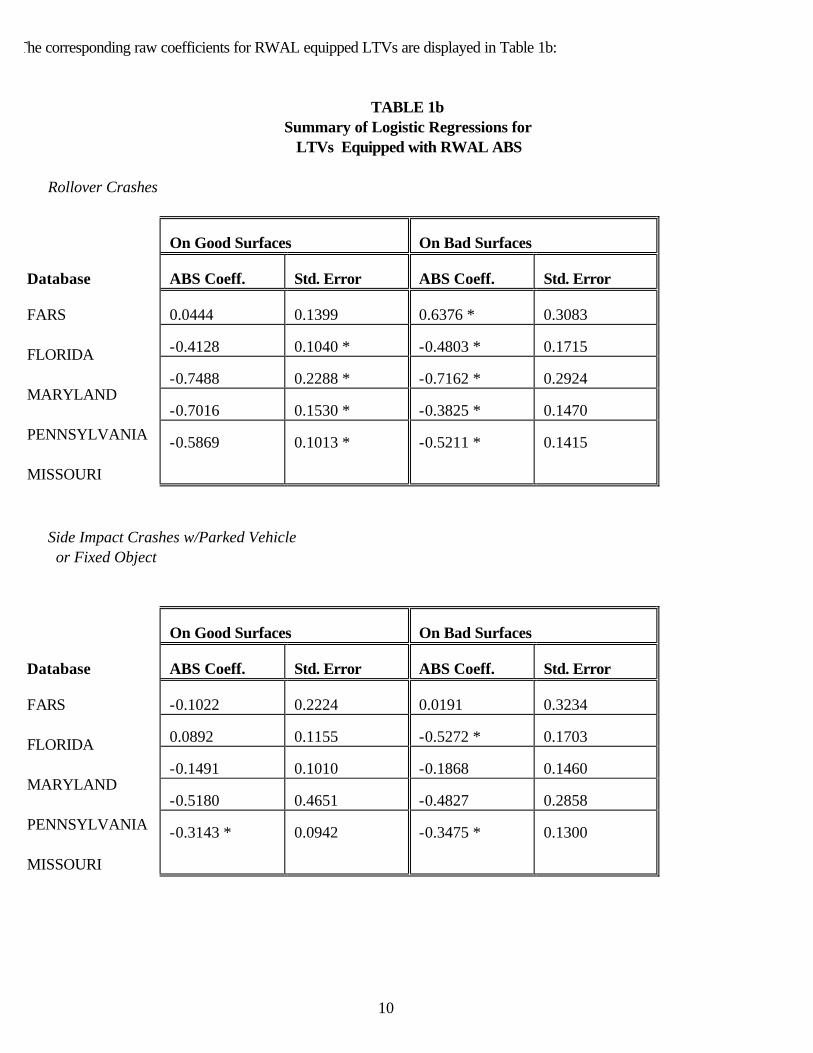
The corresponding raw coefficients for RWAL equipped LTVs are displayed in Table 1b:
TABLE 1b Summary of Logistic Regressions for LTVs Equipped with RWAL ABS Rollover Crashes
On Good Surfaces
On Bad Surfaces
Database
ABS Coeff.
Std. Error
ABS Coeff.
Std. Error
0.0444
0.1399
0.6376 *
0.3083
-0.4128
0.1040 *
-0.4803 *
0.1715
-0.7488
0.2288 *
-0.7162 *
0.2924
-0.7016
0.1530 *
-0.3825 *
0.1470
FARS FLORIDA MARYLAND PENNSYLVANIA MISSOURI
-0.5869
0.1013 *
-0.5211 *
0.1415
Side Impact Crashes w/Parked Vehicle or Fixed Object
On Good Surfaces
On Bad Surfaces
Database
ABS Coeff.
Std. Error
ABS Coeff.
Std. Error
-0.1022
0.2224
0.0191
0.3234
0.0892
0.1155
-0.5272 *
0.1703
-0.1491
0.1010
-0.1868
0.1460
-0.5180
0.4651
-0.4827
0.2858
FARS FLORIDA MARYLAND PENNSYLVANIA MISSOURI
-0.3143 *
0.0942
-0.3475 *
0.1300

11
TABLE 1b (continued) Summary of Logistic Regressions for LTVs Equipped with RWAL ABS Front Impact Crashes w/ Another Vehicle in Transport
On Good Surfaces
On Bad Surfaces
Database
ABS Coeff.
Std. Error
ABS Coeff.
Std. Error
0.1855
0.1009
0.1874
0.2276
-0.0059
0.0295
-0.1336 *
0.0509
0.0949
0.0765
-0.1955
0.1072
0.1207
0.0624
0.1227
0.0991
FARS FLORIDA MARYLAND PENNSYLVANIA MISSOURI
0.0788
0.0485
0.0192
0.0842
Front Impact Crashes w/ Parked Vehicle or Fixed Object
On Good Surfaces
On Bad Surfaces
Database
ABS Coeff. Std. Error
ABS Coeff.
Std. Error
-0.3255 *
0.1307
0.0275
0.2727
-0.0639
0.0634
-0.0198
0.1038
-0.2874
0.1317
-0.0406
0.1711
-0.1736
0.1022
-0.2640
0.1154
FARS FLORIDA MARYLAND PENNSYLVANIA MISSOURI
-0.1107
0.0784
-0.0688
0.1252
* Indicates Statistical Significance at the á = 0.05 level, two-tailed test

12
TABLE 1b (continued) Summary of Logistic Regressions for LTVs Equipped with RWAL ABS Impacts with a Pedestrian
On Good Surfaces
On Bad Surfaces
Database
ABS Coeff. Std. Error
ABS Coeff.
Std. Error
-0.0526
0.1118
0.0505
0.2500
-0.0453
0.0470
0.0055
0.0945
-0.0856
0.0921
-0.0233
0.1822
-0.1672
0.1367
0.0611
0.2713
FARS FLORIDA MARYLAND PENNSYLVANIA MISSOURI
-0.0069
0.0685
0.1526
0.1566
* Indicates Statistical Significance at the á = 0.05 level, two-tailed test

13
Similarly, the raw coefficients for AWAL equipped LTVs are displayed in Table 1c: TABLE 1c Summary of Logistic Regressions for LTVs Equipped with AWAL ABS Rollover Crashes
On Good Surfaces
On Bad Surfaces
Database
ABS Coeff.
Std. Error
ABS Coeff.
Std. Error
0.6780 *
0.1970
0.8093 *
0.3634
-0.6497 *
0.2685
-0.9710 *
0.4610
-0.2364
0.5123
-0.5913
0.5683
-0.4823
0.3127
-0.4463
0.3067
FARS FLORIDA MARYLAND PENNSYLVANIA MISSOURI
-0.3200
0.2175
-0.5066
0.2670
Side Impact Crashes w/Parked Vehicle or Fixed Object
On Good Surfaces
On Bad Surfaces
Database
ABS Coeff.
Std. Error
ABS Coeff.
Std. Error
0.7455 *
0.3022
-0.2969
0.4409
0.2453
0.2065
-0.3624
0.3597
0.0353
0.2586
0.1553
0.3488
-0.6128
1.1701
-0.9033
0.6876
FARS FLORIDA MARYLAND PENNSYLVANIA MISSOURI
0.1106
0.1584
-0.6884
0.2715

14
TABLE 1c (continued) Summary of Logistic Regressions for LTVs Equipped with AWAL ABS Front Impact Crashes w/ Another Vehicle in Transport
On Good Surfaces
On Bad Surfaces
Database
ABS Coeff.
Std. Error
ABS Coeff.
Std. Error
0.2692
0.1434
-0.1563
0.2725
-0.1409 *
0.0514
-0.5229 *
0.1089
0.0872
0.1437
-0.6163 *
0.2299
-0.0321
0.1156
-0.0878
0.1986
FARS FLORIDA MARYLAND PENNSYLVANIA MISSOURI
-0.2383 *
0.0636
-0.5372 *
0.1133
Front Impact Crashes w/ Parked Vehicle or Fixed Object
On Good Surfaces
On Bad Surfaces
Database
ABS Coeff. Std. Error
ABS Coeff.
Std. Error
0.1452
0.1776
-0.2861
0.3614
-0.1636
0.1209
-0.1465
0.2180
-0.2256
0.2978
-0.5210
0.3653
-0.0562
0.1903
-0.0888
0.2250
FARS FLORIDA MARYLAND PENNSYLVANIA MISSOURI
-0.4341 *
0.1221
-0.7810 *
0.1815
* Indicates Statistical Significance at the á = 0.05 level, two-tailed test

15
TABLE 1c (continued) Summary of Logistic Regressions for LTVs Equipped with AWAL ABS Impacts with a Pedestrian
On Good Surfaces
On Bad Surfaces
Database
ABS Coeff. Std. Error
ABS Coeff.
Std. Error
0.0814
0.1591
-0.6837 *
0.3429
-0.0281
0.0898
-0.3417
0.2026
-0.0076
0.1758
0.1447
0.4590
-0.2551
0.2450
0.4563
0.4648
FARS FLORIDA MARYLAND PENNSYLVANIA MISSOURI
0.0601
0.1149
-0.2895
0.2274
* Indicates Statistical Significance at the á = 0.05 level, two-tailed test

16
It appears reasonable to assume that the effects of ABS should not differ dramatically from state
to state. The results, in fact, did not appear to contradict this assumption, i.e., when the state results were examined in pairs, there were no pairs in which there were statistically significant results for the impact of ABS in opposite directions under the same circumstances. Therefore, the state ABS estimated coefficients were combined to form a single estimate, the common log odds ratio, for the same level of RESPONSE and SURFACE, using statistical methods described in Fleiss 11. These results are displayed in Table 2a-2c and represent crashes of all severities in the four states. TABLE 2a Combined ABS Coefficients and Standard Errors for All Crashes, Passenger Cars
Crash Type
Surface Condition
ABS Coefficient
Standard Error
Significance
ROLL
Bad
0.15178
0.075054
INCREASE
ROLL
Good
0.18749
0.052269
DECREASE
ROR
Bad
0.02240
0.037332
NS
ROR
Good
-0.14043
0.024203
DECREASE
SIDE
Bad
0.07978
0.04118
NS
SIDE
Good
0.07218
0.031604
INCREASE
FRONT
Bad
-0.55096
0.023557
DECREASE
FRONT
Good
-0.19909
0.012239
DECREASE
PED
Bad
-0.35184
0.040134
DECREASE
PED
Good
-0.10973
0.021184
DECREASE
LEGEND
ROLL = Rollover Crashes ROR =Run-off-Road Crashes
SIDE = Side impact Crashes with parked vehicles or fixed objects FRONT = Frontal impact Crashes with another motor vehicle in transport
PED =Pedestrian-Involved Crashes The combined coefficients for LTVs with RWAL ABS are displayed in Table 2b.
11 Fleiss, Statistical Methods for Rates and Proportions, John Wiley & Sons, Inc., [1981].

17
TABLE 2b Combined ABS Coefficients and Standard Errors for All Crashes, RWAL LTVs
Crash Type
Surface Condition
ABS Coefficient
Standard Error
Significance
ROLL
Bad
-0.48219
0.083946
DECREASE
ROLL
Good
-0.55476
0.063031
DECREASE
ROR
Bad
-0.10319
0.061323
NS
ROR
Good
-0.11875
0.042065
DECREASE
SIDE
Bad
-0.34952
0.080902
DECREASE
SIDE
Good
-0.15762
0.058678
DECREASE
FRONT
Bad
-0.07450
0.037371
DECREASE
FRONT
Good
0.03703
0.022322
NS
PED
Bad
0.03543
0.70126
NS
PED
Good
-0.04895
0.034568
NS

18
The combined coefficients for LTVs with AWAL ABS are displayed in Table 2c.
TABLE 2c Combined ABS Coefficients and Standard Errors for All Crashes, AWAL LTVs
Crash Type
Surface Condition
ABS Coefficient
Standard Error
Significance
ROLL
Bad
-0.56207
0.17552
DECREASE
ROLL
Good
-0.44054
0.14277
DECREASE
ROR
Bad
-0.41270
0.11276
DECREASE
ROR
Good
-0.25471
0.07572
DECREASE
SIDE
Bad
-0.40390
0.17779
DECREASE
SIDE
Good
0.12829
0.11239
NS
FRONT
Bad
-0.48345
0.06959
DECREASE
FRONT
Good
-0.14745
0.03654
DECREASE
PED
Bad
-0.20947
0.13735
NS
PED
Good
-0.01376
0.06341
NS

19
These coefficients can be translated into the percentage change in the expected number of
relevant crashes in the following way:
(1) Expected percentage change = 100* [ exp(ABS coefficient)-1 ]
The justification for this formulation is as follows: Assume a group of vehicles, without ABS, will have N crashes of which p0N are relevant and (1-p0)N are nonrelevant. With ABS there will still be (1-p0)N nonrelevant crashes. There will now be R relevant crashes where R/[R+(1-p0)N] = p1, i.e. R = [p1/(1-p1)]N(1-p0) since p1 is the new proportion of relevant crashes. But p0 and p1 are related by (2) [p1/(1-p1)]/[p0/(1-p0)] = exp(ABS coefficient) It follows that the expected percentage change in the number of relevant crashes due to ABS is 100*(R-p0N)/(p0N), or 100*[ exp(coefficient)-1 ].
The proportion of ABS-relevant crashes could conceivably be reduced in two different ways: ABS-relevant crashes could be prevented or ABS-relevant crashes could be replaced by ABS-nonrelevant crashes. The assumption is being made that the presence of ABS has the potential to prevent the relevant crashes. This is probably generally true when the response is collision with another vehicle or fixed object. In the case of rollover, it is possible that the crash would still take place but be mitigated in the presence of ABS, that is, would become a nonrollover crash. However, since the proportion of rollover crashes is small, in equation (2), 1-p0 and 1-p1 are approximately 1 and we still obtain, approximately, p1/p0 = exp(ABS coefficient) so that(p1-p0)/p0 = exp(ABS coefficient)-1.
Replacing the ABS coefficient c in (1) with c + 1.96*(standard error of c) results in 95 percent confidence limits for the expected percentage change in relevant crashes. The results are displayed in Tables 3a-3c.

20
TABLE 3a Estimated Percent Changes in Crash Types for ABS-Equipped Passenger Cars With 95 Percent Confidence Bounds For All Crashes
Crash Type
Surface Condition
Percent Change
Lower Bound
Upper Bound
ROLL
Bad
16
0
35
ROLL
Good
-17
-25
-8
ROR
Bad
2
-5
10
ROR
Good
-13
-17
-9
SIDE
Bad
8
0
17
SIDE
Good
7
1
14
FRONT
Bad
-42
-45
-40
FRONT
Good
-18
-20
-16
PED
Bad
-30
-35
-24
PED
Good
-10
-14
-7
For Fatal Crashes
Crash Type
Surface Condition
Percent Change
Lower Bound
Upper Bound
ROLL
Bad
-14
-60
86
ROLL
Good
51
12
104
ROR
Bad
-16
-45
30
ROR
Good
-11
-28
11
SIDE
Bad
69
5
174
SIDE
Good
61
19
117
FRONT
Bad
-40
-59
-13
FRONT
Good
5
-13
27
PED
Bad
-38
-60
-4
PED
Good
10
-10
35

21
LEGEND ROLL = Rollover Crashes SIDE = Side impact Crashes with parked vehicles or fixed objects. FRONT = Frontal impact Crashes with another motor vehicle in transport. ROR = Frontal impact Crashes with parked vehicles or fixed objects.
TABLE 3b Estimated Percent Changes in Crash Types
with 95% Confidence Bounds for RWAL Equipped LTVs
For All Crashes
Crash Type
Surface Condition
Percent Change
Lower Bound
Upper Bound
ROLL
Bad
-38
-48
-27
ROLL
Good
-43
-49
-35
ROR
Bad
-10
-20
2
ROR
Good
-11
-18
-4
SIDE
Bad
-29
-40
-17
SIDE
Good
-15
-24
-4
FRONT
Bad
-7
-14
0
FRONT
Good
4
-1
8
PED
Bad
4
-10
19
PED
Good
-5
-11
2

22
For Fatal Crashes
Crash Type
Surface Condition
Percent Change
Lower Bound
Upper Bound
ROLL
Bad
89
3
246
ROLL
Good
5
-21
38
ROR
Bad
3
-40
75
ROR
Good
-28
-44
-7
SIDE
Bad
2
-46
92
SIDE
Good
-10
-42
40
FRONT
Bad
21
-23
88
FRONT
Good
20
-1
47
PED
Bad
5
-36
72
PED
Good
-5
-24
18

23
TABLE 3c Estimated Percent Changes in Crash Types
with 95% Confidence Bounds for AWAL Equipped LTVs
For All Crashes
Crash Type
Surface Condition
Percent Change
Lower Bound
Upper Bound
ROLL
Bad
-43
-60
-20
ROLL
Good
-36
-51
-15
ROR
Bad
-33
-47
-17
ROR
Good
-24
-35
-12
SIDE
Bad
-35
-54
-8
SIDE
Good
14
-9
42
FRONT
Bad
-38
-46
-29
FRONT
Good
-14
-20
-8
PED
Bad
-19
-38
6
PED
Good
-1
-13
12

24
For Fatal Crashes
Crash Type
Surface Condition
Percent Change
Lower Bound
Upper Bound
ROLL
Bad
125
10
358
ROLL
Good
97
34
190
ROR
Bad
-25
-63
53
ROR
Good
16
-18
64
SIDE
Bad
-26
-69
76
SIDE
Good
111
17
281
FRONT
Bad
-14
-50
46
FRONT
Good
31
-1
73
PED
Bad
-50
-74
0
PED
Good
8
-21
48
How does the impact of the presence of ABS differ on "good" road surfaces vs. "bad" road
surfaces? To answer this question, observe that for each combination of the 2 values of FATAL and the 4 crash types, Tables 3a-c display two estimates for the ABS coefficient, one for good surface and one for bad. For each of these estimates, there is an estimated standard error. Since these estimates are independent, it is straightforward to test if their difference is significantly different from 0 at p = 0.05. If it is not, they can be combined, again using the method described in Fleiss. These results are displayed in Tables 4a-c. In Tables 4a-c, the PERCENT CHANGE is the point estimate. The last column indicates if the ABS effect is significantly different from zero.
Tables 5a-c summarize the statistically significant expected percentage reductions with ABS, combining surfaces where it is valid to do so and presenting effects separately by surface condition where they are significantly different. Confidence limits are presented to provide the different levels of precision.

25
TABLE 4a Estimated Percent Change in Response Crashes in ABS Passenger Cars, When Surfaces Can Be Combined
Crash Severity
Crash Type
Percent Change
Statistically Significant
Fatal
ROLL
40
YES
Fatal
ROR
-12
NO
Fatal
SIDE
63
YES
All
SIDE
8
YES
LEGEND ROLL = Rollover Crashes SIDE = Side impact Crashes with parked vehicles or fixed objects. FRONT = Frontal impact Crashes with another motor vehicle in transport. ROR = Frontal impact Crashes with parked vehicles or fixed objects PED = Pedestrian Crashes.
TABLE 4b Estimated Percent Change in Response Crashes in RW ABS LTVs, When Surfaces Can Be Combined
Crash Severity
Crash Type
Percent Change
Statistically Significant
Fatal
FRONT
20
NO
Fatal
PED
-3
NO
Fatal
ROLL
16
NO
Fatal
ROR
-23
YES
Fatal
SIDE
-6
NO
All
PED
-3
NO
All
ROLL
-41
YES
All
ROR
-11
YES
All
SIDE
-20
YES

26
TABLE 4c Estimated Percent Change in Response Crashes in AW ABS LTVs, When Surfaces Can Be Combined
Crash Severity
Crash Type
Percent Change
Statistically Significant
Fatal
FRONT
19
NO
Fatal
ROLL
103
YES
Fatal
ROR
6
NO
Fatal
SIDE
51
NO
All
PED
-5
NO
All
ROLL
-39
YES
All
ROR
-26
YES

27
TABLE 5a
Summary of Statistically Significant Effects of ABS for Passenger Cars
Crash Severity
Crash Type
Surface Condition
Percent Change
Lower Bound
Upper Bound
All
FRONT
Bad
-42
-45
-39
All
FRONT
Good
-18
-20
-16
All
ROLL
Good
-17
-25
-8
All
ROR
Good
-13
-17
-9
All
SIDE
Both
8
3
13
All
PED
Bad
-30
-35
-24
All
PED
Good
-10
-14
-7
Fatal
ROLL
Both
40
6
85
Fatal
SIDE
Both
63
27
110
Fatal
FRONT
Bad
-40
-59
-13
Fatal
PED
Bad
-38
-60
-4

28
TABLE 5b
Summary of Statistically Significant Effects of ABS for RWAL LTVs
Crash Severity
Crash Type
Surface Condition
Percent Change
Lower Bound
Upper Bound
All
ROLL
Both
-41
-47
-35
All
ROR
Both
-11
-17
-4
All
SIDE
Both
-20
-27
-12
Fatal
ROR
Both
-23
-39
-3
TABLE 5c
Summary of Statistically Significant Effects of ABS for AWAL LTVs
Crash Severity
Crash Type
Surface Condition
Percent Change
Lower Bound
Upper Bound
All
FRONT
Bad
-38
-46
-29
All
FRONT
Good
-14
-20
-8
All
ROLL
Both
-39
-51
-24
All
ROR
Both
-26
-35
-17
All
SIDE
Bad
-33
-53
-5
Fatal
ROLL
Both
103
45
185

29
DISCUSSION The findings for passenger cars in fatal crashes for this study are very similar to the earlier results. For passenger cars in non-fatal crashes the benefits in avoiding frontal crashes remain about the same. Side impacts and run-off-road crashes on unfavorable surfaces, went from a predicted increase in the earlier study to non-significance in these findings. In addition, there are decreases predicted for crashes involving pedestrians. For light trucks and vans, the two types of ABS, i.e., AWAL and RWAL, were analyzed separately. No significant predicted changes in fatal crashes had been found for AWAL systems in the earlier study, while the current analysis shows some predicted increases in rollovers and side impacts (both crash types associated with loss of control). In non-fatal crashes with AWAL, frontals on good surfaces went from an increase to a decrease and run-off-road crashes went from non-significance to a decrease. For LTVs with RWAL, the most dramatic change is that both fatal and nonfatal frontal crashes on favorable and unfavorable road conditions no longer show an increase as was the case in the earlier study. These results surely raise as many questions as they answer. The overall impact of ABS for total crashes and fatalities, i.e., across all crash types, was not estimated in this study. Meanwhile, it has been hypothesized that the apparent increase in loss of control type crashes, i.e., rollovers and side impact crashes, results from successful deliberate attempts to steer off the road in order to avoid worse targets (most notably, perhaps, pedestrians) that now become possible because the wheels do not lock up. Some of the improved predictions for ABS, especially regarding non-fatal crashes in which the driver may be under less pressure, could possibly be due to increased skill on the part of motorists in using ABS. Also, the systems themselves may have been improved. Further analysis is planned which will take into account, where possible, the generation of the ABS and the driver=s amount of experience with ABS. Meanwhile, NHTSA urges drivers to gain an in-depth understanding of the operation of their ABS-equipped vehicles to utilize the safety potential of ABS.

30
REFERENCES Fleiss, Joseph, AStatistical Methods for Rates and Proportions@. John Wiley and Sons, 1981. Hertz, Ellen; Hilton, Judith; and Johnson, Delmas Maxwell, AAn Analysis of the Crash Experience of Light Trucks and Vans Equipped with Antilock Braking Systems@. U.S. Department of Transportation, NHTSA, DOT HS 808 278, May 1995. Hertz, Ellen; Hilton, Judith; and Johnson, Delmas Maxwell, AAn Analysis of the Crash Experience of Passenger Cars Equipped with Antilock Braking Systems@. U.S. Department of Transportation, NHTSA, DOT HS 808 279, May 1995. Hertz, Ellen; Hilton, Judith; and Johnson, Delmas Maxwell, AAnalysis of the Crash Experience of Passenger Vehicles Equipped with Antilock Braking Systems@. ESV Paper Number 96-S9-O-03, May 1996. Hosmer, D.; Lemeshow, S., AApplied Logistic Regression@. John Wiley and Sons, 1989. Kahane, Charles J, APreliminary Evaluation of the Effectiveness of Rear-Wheel Antilock Brake Systems for Light Trucks@. U.S. Department of Transportation, NHTSA, December 1993.