analysis of the co2 emissions factor 18 - demand side management and... · task 18: demand...
TRANSCRIPT

Task 18: Demand Management and Climate ChangeSubTask 2: Emission Calculation Method
Madrid, 8th of June 2008Department of Demand Management
Task 18: Demand Management and ClimateChange
Analysis of the CO2 Emissions Factor

Department of Demand Management
Madrid, 8th of June 2008
Task 18: Demand Management and Climate Change
Analysis of the CO2 Emissions Factor
RED ELÉCTRICA DE ESPAÑA

Task 18: Demand Management and Climate ChangeSubTask 2: Emission Calculation Method 3
Index1. Objectives2. Emissions Factor Estimation Method 3. Daily Emissions4. Sensitivity Analysis5. Conclusions6. Annexe
Task 18: Demand Management and Climate ChangeSubTask 2: Emission Calculation Method
1. Objectives
4
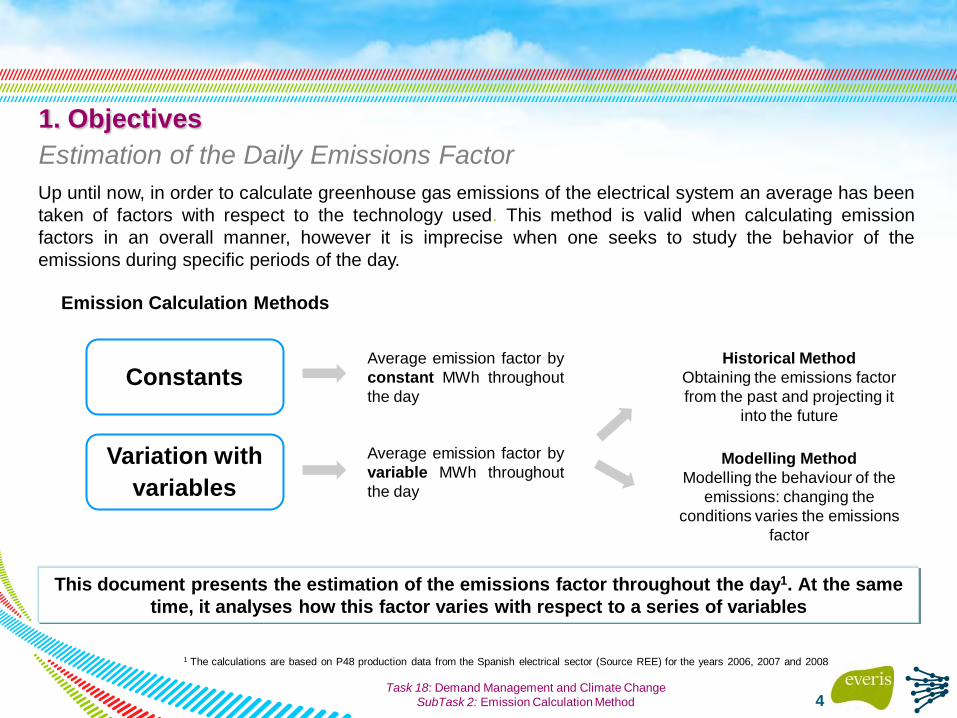
Estimation of the Daily Emissions FactorUp until now, in order to calculate greenhouse gas emissions of the electrical system an average has beentaken of factors with respect to the technology used. This method is valid when calculating emissionfactors in an overall manner, however it is imprecise when one seeks to study the behavior of theemissions during specific periods of the day.
Emission Calculation Methods
This document presents the estimation of the emissions factor throughout the day1. At the same time, it analyses how this factor varies with respect to a series of variables
1 The calculations are based on P48 production data from the Spanish electrical sector (Source REE) for the years 2006, 2007 and 2008
Constants
Variation with variables
Average emission factor byconstant MWh throughoutthe day
Average emission factor byvariable MWh throughoutthe day
Historical MethodObtaining the emissions factor from the past and projecting it
into the future
Modelling MethodModelling the behaviour of the
emissions: changing the conditions varies the emissions
factor

Task 18: Demand Management and Climate ChangeSubTask 2: Emission Calculation Method 5
Index1. Objectives2. Emissions Factor Estimation Method 3. Daily Emissions4. Sensitivity Analysis5. Conclusions6. Annexe

Task 18: Demand Management and Climate ChangeSubTask 2: Emission Calculation Method
2. Emissions Factor Estimation Method Map of VariablesThe average emission factor is intrinsicaly related to the percentage of each technological method usedwithin the mix generation such that the behaviour of the emissions will depend on the behaviour of thelatter.
Park installed
Contribution of renewables
Seasonal variations
Seasonal variationsMeteorology Hydrology
Fuel prices
MIX GENERATION EMISSIONS FACTOR
Availability of the park
Commercial strategy of generators
Restrictions of the operator
Limitations of system procedures
Rigidity of the generation technology
Others…
6
Demand
Work rate
Temperature
Economic activity:Current economic
situationTendency
Production

Task 18: Demand Management and Climate ChangeSubTask 2: Emission Calculation Method 7
Hourly production data by technology used
X
Emission factor data by technology used
Exporter Net Balance
Emission factor for national production
Export emission factor
Importer Net Balance
Emission factor for national production
Import emission factor
= +
The emission factor does not varyeven if the exported energy issubtracted
The emission factor of the importsmust be included – this isincorporated as if it were anothertype of technology1
1The data available does not distinguish between countries for imported energy. For this purpose a fixed emission factor is taken for imports, considering the annualpercentage of imports by countries. See annexe: Data considered.
1.- The Calculation of the Hourly Emission Factor in Production
2.- Calculation of the Hourly Emission Factor in Demand
A B
The inclusion of exports/imports in the hourly emission factor. Only hourly net balance data is available for exports/importswhich means that for each hour only one of these two situations may ocurr:
Taking solely into account total electricalproduction in Spain
Only in the case of Importer Net Balance isnecessary to include the emissions ofimported energy
2. Emissions Factor Estimation Method Calculation of the Hourly Emission Factor

Task 18: Demand Management and Climate ChangeSubTask 2: Emission Calculation Method
Carbón13%
Ciclo Combinado
24%
Eólica17%
Hidráulica20%
Nuclear9%
Otras17%
Carbón13%
Ciclo Combinado
25%
Eólica16%
Hidráulica21%
Nuclear9%
Otras16%
Carbón15%
Ciclo Combinad
o20%
Eólica14%
Hidráulica23%
Nuclear10%
Otras18%
8
Carbón24%
Ciclo Combinado
24%Eólica7%
Hidráulica9%
Nuclear22%
Otras14%
Carbón24%
Ciclo Combinado
25%Eólica8%
Hidráulica10%
Nuclear19%
Otras14%
Carbón15%
Ciclo Combinado
32%Eólica11%
Hidráulica7%
Nuclear20%
Otras15%
2006
Growth of 3.1%.2007
2008
Demand1 Demand Coverage1Climatology2 Rainfall2
Dry year (however its contribution to the mix was similar to 2006).
Growth of 2.9%.
Average year (32.1% hydro-electric production increase).
Summer:
Average year although dryduring the first half of the year.
Moderate increase 1%.
High temp(increase of maximum power).
Winter: Cold
Summer:
Winter:
Moderate temp (maximum of power lower).
Warm
Summer:
Winter:
Normal and even occasionally cold.
Warm
Relevant Info
Source: Richards Bay andNewcastle from PlattsInternational Coal Report
The price of coal increased in 2008:
1 Source: REE. Annual Report on the Spanish Electrical System and Data from the P48 (for the calculation of demand coverage)2 Source: The Spanish State Meteorological Agency (AEMET).
Installed Power1
Coal Prices 2006-2008
Development of Hydroelectric Reserves 2006-2008
Descent of hydro-electric reserves at the end of 2007 and early 2008
Source: REE. Annual Report2008
2. Emissions Factor Estimation Method Characterisation of Investigation Years

Task 18: Demand Management and Climate ChangeSubTask 2: Emission Calculation Method 9
Index1. Objectives2. Emissions Factor Estimation Method 3. Daily Emissions4. Sensitivity Analysis5. Conclusions6. Annexe

Task 18: Demand Management and Climate ChangeSubTask 2: Emission Calculation Method
0
5000
10000
15000
20000
25000
30000
35000
1 2 3 4 5 6 7 8 9 10 11 12 13 14 15 16 17 18 19 20 21 22 23 24
Otras
Fuel-Gas
Hidráulica
Ciclo ComibiandoCarbón
Nuclear
Eólica
3. Daily EmissionsDaily Curves 2008
Curves in Demand Hours Curves in Total Emission Hours
MWh
The total daily emissions emitted by the Spanish electrical system follow a behaviour in line with demand,with two peaks at the final hours of the morning and the afternoon
0
2000
4000
6000
8000
10000
12000
1 2 3 4 5 6 7 8 9 10 11 12 13 14 15 16 17 18 19 20 21 22 23 24
Térmica (R.E)
Fuel-Gas
Ciclo Comibiando
Carbón
tn

Task 18: Demand Management and Climate ChangeSubTask 2: Emission Calculation Method
30
35
40
45
50
55
60
65
70
75
80
0.330
0.340
0.350
0.360
0.370
0.380
0.390
1 2 3 4 5 6 7 8 9 10 11 12 13 14 15 16 17 18 19 20 21 22 23 24
Factor emisiones
€/MWh
Hourly Curves for the Final Market Price vs the Emissions Factor Curve Hourly Curves for the Emissions Factor
tn/MWh
0.000
0.050
0.100
0.150
0.200
0.250
0.300
0.350
0.400
1 2 3 4 5 6 7 8 9 101112131415161718192021222324
Otras
Fuel-Gas
Ciclo Comibiando
Carbón
However the variation of the compostion of the generation mix throughout the day due to the price ofelectricity means that the emissions factor curve (tn/MWh) does not have the same shape as theemissions curve
During peak hours of demand the emissions factor diminished due to the increase of the influence of hydro-electric power in the composition of the mix
Price (€/MWh)
Emission Factor Curves 20083. Daily Emissions
tn/MWh Average factor: 0.346 tn/MWh

Task 18: Demand Management and Climate ChangeSubTask 2: Emission Calculation Method
2007 Curves in Hourly Demand Hourly Curves for the CO2 Emissions Factor
Hours of the Day0.000
0.050
0.100
0.150
0.200
0.250
0.300
0.350
0.400
1 2 3 4 5 6 7 8 9 101112131415161718192021222324
Otras
Fuel-Gas
Ciclo Comibiando
Carbón
2006 Curves in Hourly Demand Hourly Curves for the CO2 Emissions Factor
Hours of the Day
0.000
0.050
0.100
0.150
0.200
0.250
0.300
0.350
0.400
1 2 3 4 5 6 7 8 9 101112131415161718192021222324
Otras
Fuel-Gas
Ciclo Comibiando
Carbón
3. Daily Emissions
0
2000
4000
6000
8000
10000
12000
14000
1 2 3 4 5 6 7 8 9 10 11 12 13 14 15 16 17 18 19 20 21 22 23 24
Otras
Fuel-Gas
Ciclo ComibiandoCarbón
tn tn/MWh
tn/MWh
0
2000
4000
6000
8000
10000
12000
14000
1 2 3 4 5 6 7 8 9 10 11 12 13 14 15 16 17 18 19 20 21 22 23 24
Otras
Fuel-Gas
Ciclo ComibiandoCarbón
tn Average factor: 0.364 tn/MWh
Average factor: 0.367 tn/MWh

Task 18: Demand Management and Climate ChangeSubTask 2: Emission Calculation Method
3035404550556065707580
0.330
0.340
0.350
0.360
0.370
0.380
0.390
1 2 3 4 5 6 7 8 9 10 11 12 13 14 15 16 17 18 19 20 21 22 23 24
Factor emisiones
€/MWh
Characterisation of the Emissions Factor Curve
49.7 €/MWh
Eólica13%
Nuclear24%
Carbon15%
Ciclo combinado
28%
Hidráulica4%
Otras16%
Average Price:
% of times which thetechnology usedmarks the marginalprice:
Mix of generation:
4:00 – 5:00
58.1 €/MWh
7:00 – 8:00
Increase of hydro-electric power coinciding withthe increased price during peak demand
0%
10%
20%
30%
40%
50%
60%
70%
Ciclo combinado
Carbón Hidráulica0%
10%
20%
30%
40%
50%
60%
Ciclo combinado
Carbón Hidráulica
71.3 €/MWh
13:00 – 14:00
Eólica12%
Nuclear23%
Carbon16%
Ciclo combinado
29%
Hidráulica4%
Otras16%
Eólica9%
Nuclear18%
Carbon15%
Ciclo combinado
33%
Hidráulica10%
Otras15%
Initiation of the thermal stations inorder to cover increased demand
64.3 €/MWh
16:00 – 17:00
75.5 €/MWh
21:00 – 22:00
0%
10%
20%
30%
40%
50%
60%
Ciclo combinado
Carbón Hidráulica
Eólica11%
Nuclear19%
Carbon15%
Ciclo combinado
33%
Hidráulica7%
Otras15%
0%
10%
20%
30%
40%
50%
60%
Ciclo combinado
Carbón Hidráulica
Eólica10%
Nuclear18%
Carbon15%
Ciclo combinado
33%
Hidráulica10%
Otras14%
0%
10%
20%
30%
40%
50%
60%
Ciclo combinado
Carbón Hidráulica
2008
3. Daily Emissions
tn/MWh Price (€/MWh)

Task 18: Demand Management and Climate ChangeSubTask 2: Emission Calculation Method 14
Index1. Objectives2. Emissions Factor Estimation Method 3. Daily Emissions4. Sensitivity Analysis
a) Demandb) Importance of Renewablesc) Polluting Technologiesd) Seasonal Variatione) Days of the Week
5. Conclusions6. Annexe

Task 18: Demand Management and Climate ChangeSubTask 2: Emission Calculation Method 15
Demand (I)No clear correlation exists between production levels and emissions factors due to the variation amongnon-polluting technologies vs polluting technologies which are produced in the mix with the increaseddemand
Daily Production vs Emissions factor
20000
22000
24000
26000
28000
30000
32000
34000
36000
38000
40000
0,16 0,21 0,26 0,31 0,36 0,41
MWh
tn/MWh
20000
22000
24000
26000
28000
30000
32000
34000
36000
38000
40000
0,18 0,23 0,28 0,33 0,38 0,43 0,48
MWh
tn/MWh
20072008
2006
20000
22000
24000
26000
28000
30000
32000
34000
36000
38000
40000
0,18 0,23 0,28 0,33 0,38 0,43 0,48
MWh
tn/MWh
3. Daily Emissions

Task 18: Demand Management and Climate ChangeSubTask 2: Emission Calculation Method 16
4. Sensitivity AnalysisDemand (II)
On those days with less demand more than 50% may be produced, minus the total emissions with respect to those of maximum demand
Total Daily Emissions
Days of Greater DemandAverage Generation
MixTotal Daily Emissions
Days of Less Demand
Daily Curve for Emissionstn/MWh
tn Average Generation Mix
tn/MWh Daily Curve for Emissions factors
2008
0
1000
2000
3000
4000
5000
6000
7000
8000
9000
1 2 3 4 5 6 7 8 9 10 11 12 13 14 15 16 17 18 19 20 21 22 23 24
Térmica (R.E)
Fuel-Gas
Ciclo Comibiando
Carbón
0,000
0,050
0,100
0,150
0,200
0,250
0,300
0,350
1 2 3 4 5 6 7 8 9 10 11 12 13 14 15 16 17 18 19 20 21 22 23 24
Otras
Fuel-Gas
Ciclo Comibiando
Carbón
Eólica8%
Nuclear26%
Carbón19%
Ciclo Comibiando
22%
Hidráulica12%
Otras13%
0,000
0,050
0,100
0,150
0,200
0,250
0,300
0,350
1 2 3 4 5 6 7 8 9 10 11 12 13 14 15 16 17 18 19 20 21 22 23 24
Otras
Fuel-Gas
Ciclo Comibiando
Carbón
0
20000
40000
60000
80000
100000
120000
140000
1 2 3 4 5 6 7 8 9 10 11 12 13 14 15 16 17 18 19 20 21 22 23 24
Térmica (R.E)
Fuel-Gas
Ciclo Comibiando
Carbón
tn
Eólica17%
Nuclear17%
Carbón17%
Ciclo Comibiando
29%
Hidráulica8%
Otras12%

Task 18: Demand Management and Climate ChangeSubTask 2: Emission Calculation Method
Eólica9%
Nuclear18%
Carbón22%
Ciclo Comibiando
32%
Hidráulica6%
Otras12%
Eólica4%
Nuclear22%
Carbón34%
Ciclo Comibiando
13%
Hidráulica15%
Otras12%Eólica
17%
Nuclear17%
Carbón17%
Ciclo Comibiando
29%
Hidráulica8%
Otras12%
Eólica8%
Nuclear26%
Carbón19%
Ciclo Comibiando
22%
Hidráulica12%
Otras13%
17
4. Sensitivity AnalysisDemand (II)
Days of Greater Demand Days of Lesser DemandFactor Curve for Emissions from Each Year Factor Curve for Emissions from Each Year
tn/MWh tn/MWh
0.280
0.300
0.320
0.340
0.360
0.380
0.400
0.420
0.440
1 2 3 4 5 6 7 8 9 10 11 12 13 14 15 16 17 18 19 20 21 22 23 240.280
0.300
0.320
0.340
0.360
0.380
0.400
0.420
0.440
1 2 3 4 5 6 7 8 9 10 11 12 13 14 15 16 17 18 19 20 21 22 23 24
2006
2007
2008

Task 18: Demand Management and Climate ChangeSubTask 2: Emission Calculation Method
Eólica20%
Nuclear21%
Carbón19%
Ciclo Comibiando
13%
Hidráulica15%
Otras13%
0
2000
4000
6000
8000
10000
1 2 3 4 5 6 7 8 9 10 11 12 13 14 15 16 17 18 19 20 21 22 23 24
Térmica (R.E)
Fuel-Gas
Ciclo Comibiando
Carbón
0,000
0,050
0,100
0,150
0,200
0,250
0,300
1 2 3 4 5 6 7 8 9 10 11 12 13 14 15 16 17 18 19 20 21 22 23 24
Otras
Fuel-Gas
Ciclo Comibiando
Carbón
Eólica24%
Nuclear18%
Carbón15%
Ciclo Comibiando
23%
Hidráulica8%
Otras12%
18
4. Sensitivity AnalysisWind/Hydro-electric Production (I)
0
2000
4000
6000
8000
10000
12000
1 2 3 4 5 6 7 8 9 10 11 12 13 14 15 16 17 18 19 20 21 22 23 24
Térmica (R.E)
Fuel-Gas
Ciclo Comibiando
Carbón
0,000
0,050
0,100
0,150
0,200
0,250
0,300
1 2 3 4 5 6 7 8 9 10 11 12 13 14 15 16 17 18 19 20 21 22 23 24
Otras
Fuel-Gas
Ciclo Comibiando
Carbón
Total Daily Emissions
Days of Greater Wind ProductionAverage Generation
Mix
tn/MWh Daily Curve for Emission factors
Tºn
2008
Total Daily Emissions
Days of Greater Hydro-electric ProductionAverage Generation
Mix
tn/MWh Daily Curve for Emission factors
tn
On those days with greater production using clean technology the emissions factor is considerably reduced: by 19% and 21%respectively1
1 Average increase over the last three years

Task 18: Demand Management and Climate ChangeSubTask 2: Emission Calculation Method
0.230
0.250
0.270
0.290
0.310
0.330
0.350
1 2 3 4 5 6 7 8 9 10 11 12 13 14 15 16 17 18 19 20 21 22 23 24
2006
2007
2008
19
4. Sensitivity AnalysisWind/hydro-electric Production (II)
Curve Factors for Emissions from Each Year Curve factors for Emissions from Each Year
0.230
0.250
0.270
0.290
0.310
0.330
0.350
1 2 3 4 5 6 7 8 9 10 11 12 13 14 15 16 17 18 19 20 21 22 23 24
Days of greater Wind Production Days of Greater Hydro-electric Production
In both cases there are hardly any fluctuations in the factor during the central hours of the day as the percentage of clean technology is maintained at a high level
tn/MWh tn/MWh

Task 18: Demand Management and Climate ChangeSubTask 2: Emission Calculation Method
0.300
0.320
0.340
0.360
0.380
0.400
0.420
0.440
0.460
1 2 3 4 5 6 7 8 9 101112131415161718192021222324
2006
2007
2008
0
2000
4000
6000
8000
10000
12000
14000
16000
1 2 3 4 5 6 7 8 9 10 11 12 13 14 15 16 17 18 19 20 21 22 23 24
Térmica (R.E)
Fuel-Gas
Ciclo Comibiando
Carbón
Eólica5%
Nuclear20%
Carbón21%
Ciclo Comibiando
35%
Hidráulica6%
Otras12%
0,000
0,050
0,100
0,150
0,200
0,250
0,300
0,350
0,400
0,450
1 2 3 4 5 6 7 8 9 10 11 12 13 14 15 16 17 18 19 20 21 22 23 24
Otras
Fuel-Gas
Ciclo Comibiando
Carbón
20
4. Sensitivity AnalysisCoal Production
On those days with greater percentages of coal the total emissions increased by 28% with respect to the average and the emissions factor increased by more than 10%1
Total Daily Emissions
Days of Greater Coal ProductionAverage Generation
Mix
tn/MWh Daily Curve for Emission factors
Tºn
Curve Factors for Emissions from Each Year
tn/MWh
1 Average increase over three years
2008

Task 18: Demand Management and Climate ChangeSubTask 2: Emission Calculation Method
4. Sensitivity Analysis
In the months when hydro-electric production decreases, the emissions factor increases due to theincreased influence of coal-powered thermal stations in the mix and viceversa
Eólica9%
Nuclear21%
Carbón10%
Ciclo Comibiando
33%
Hidráulica15%
Otras12%
Eólica8%
Nuclear21%
Carbón19%
Ciclo Comibiando
33%
Hidráulica5%
Otras13%
21
Seasonal Variation: Most and Least Polluting Months (I)
0,000
0,050
0,100
0,150
0,200
0,250
0,300
0,350
0,400
1 2 3 4 5 6 7 8 9 10 11 12
Monthly Emissions factor
Monthly Emissions Factor Monthly Emissions Factor
Month of GreatestEmissions Factor
Month of LowestEmissions Factor
tn/MWh tn/MWh
tn/MWh 2008
0,000
0,050
0,100
0,150
0,200
0,250
0,300
0,350
0,400
1 2 3 4 5 6 7 8 9 10 11 12 13 14 15 16 17 18 19 20 21 22 23 24
Otras
Fuel-Gas
Ciclo Comibiando
Carbón
0,000
0,050
0,100
0,150
0,200
0,250
0,300
1 2 3 4 5 6 7 8 9 10 11 12 13 14 15 16 17 18 19 20 21 22 23 24
Otras
Fuel-Gas
Ciclo Comibiando
Carbón

Task 18: Demand Management and Climate ChangeSubTask 2: Emission Calculation Method
4. Sensitivity Analysis
0,000
0,050
0,100
0,150
0,200
0,250
0,300
0,350
0,400
0,450
1 2 3 4 5 6 7 8 9 10 11 12
22
2006
0,000
0,050
0,100
0,150
0,200
0,250
0,300
0,350
0,400
0,450
1 2 3 4 5 6 7 8 9 10 11 12
tn/MWh
tn/MWhMonth of Lowest Emissions Factor
2007tn/MWh
tn/MWh
tn/MWh
Seasonal Variation: Most and Least Polluting Months (II)
0,000
0,050
0,100
0,150
0,200
0,250
0,300
0,350
0,400
0,450
0,500
1 2 3 4 5 6 7 8 9 10 11 12 13 14 15 16 17 18 19 20 21 22 23 24
Otras
Fuel-Gas
Ciclo Comibiando
Carbón
Eólica7%
Nuclear23%
Carbón18%Ciclo
Comibiando18%
Hidráulica21%
Otras12%
Eólica4%
Nuclear20%
Carbón27%
Ciclo Comibiando
29%
Hidráulica7%
Otras13%
0,000
0,050
0,100
0,150
0,200
0,250
0,300
0,350
1 2 3 4 5 6 7 8 9 10 11 12 13 14 15 16 17 18 19 20 21 22 23 24
Otras
Fuel-Gas
Ciclo Comibiando
Carbón
0,000
0,050
0,100
0,150
0,200
0,250
0,300
0,350
0,400
0,450
1 2 3 4 5 6 7 8 9 10 11 12 13 14 15 16 17 18 19 20 21 22 23 24
Otras
Fuel-Gas
Ciclo Comibiando
Carbón
0,000
0,050
0,100
0,150
0,200
0,250
0,300
0,350
1 2 3 4 5 6 7 8 9 10 11 12 13 14 15 16 17 18 19 20 21 22 23 24
Otras
Fuel-Gas
Ciclo Comibiando
Carbón
Eólica9%
Nuclear14%
Carbón26%Ciclo
Comibiando28%
Hidráulica11%
Otras12%
Month of Greatest Emissions Factor
Eólica13%
Nuclear21%
Carbón20%
Ciclo Comibiando
17%
Hidráulica17%
Otras12%
Month of Lowest Emissions Factor
Month of Greatest Emissions Factor
tn/MWh

Task 18: Demand Management and Climate ChangeSubTask 2: Emission Calculation Method 23
Seasonal Variation: Influence in the MixSeasonal variation can determine a sudden increase of the variable clean technologies, mainly hydro-electric and wind power, which drastically reduce the emissions factor
CO2 Emissions Factor (12/2006)
Technological Mix of Energy Production (12/2006)
2006
4. Sensitivity Analysis

Task 18: Demand Management and Climate ChangeSubTask 2: Emission Calculation Method
4. Sensitivity Analysis
24
Seasonal Variation: Curve of the Emissions factor
Curve Factors for Emissions from Each Year
0.340
0.360
0.380
0.400
0.420
0.440
1 2 3 4 5 6 7 8 9 10 11 12 13 14 15 16 17 18 19 20 21 22 23
0.250
0.260
0.270
0.280
0.290
0.300
0.310
1 2 3 4 5 6 7 8 9 10 11 12 13 14 15 16 17 18 19 20 21 22 23
2006
2007
2008
Curve Factors for Emissions from Each Year
tn/MWh tn/MWh
Average increase of the factor by 8%with respect to the average curve foreach year
Average reduction of the factor by 22%with respect to the average curve ofeach year
Modification of the emissions factor curveshape due to the increase during peak hoursin thermal stations
Months of Greatest Factor Months of Least Factor
During the months when hydro-electric power increases considerably and coal generated power decreases, the emissions factor decreases by 22% with respect to the average

Task 18: Demand Management and Climate ChangeSubTask 2: Emission Calculation Method 25
Days of the Week 2008
The total emissions are reduced by close to 20% on the weekends with respect to week days, due to the reduction of the influence of the cycle combined in the mix
Total Daily Emissions
Week Daystn Average Generation
MixTotal Daily Emissions
Weekends
0,000
0,050
0,100
0,150
0,200
0,250
0,300
0,350
1 2 3 4 5 6 7 8 9 10 11 12 13 14 15 16 17 18 19 20 21 22 23 24
Otras
Fuel-Gas
Ciclo Comibiando
Carbón
Daily Curve for Emission factors
0
1000
2000
3000
4000
5000
6000
7000
8000
9000
10000
1 2 3 4 5 6 7 8 9 10 11 12 13 14 15 16 17 18 19 20 21 22 23 24
Térmica (R.E)
Fuel-Gas
Ciclo Comibiando
Carbón
tn/MWh
tnAverage Generation
Mix
Eólica12%
Nuclear23%
Carbón16%
Ciclo Comibiando
27%
Hidráulica9%
Otras14%
Eólica11%
Nuclear19%
Carbón15%Ciclo
Comibiando33%
Hidráulica9%
Otras13%
0
2000
4000
6000
8000
10000
12000
1 2 3 4 5 6 7 8 9 10 11 12 13 14 15 16 17 18 19 20 21 22 23 24
Térmica (R.E)
Fuel-Gas
Ciclo Comibiando
Carbón
0,000
0,050
0,100
0,150
0,200
0,250
0,300
0,350
1 2 3 4 5 6 7 8 9 10 11 12 13 14 15 16 17 18 19 20 21 22 23 24
Otras
Fuel-Gas
Ciclo Comibiando
Carbón
tn/MWh Daily Curve for Emission factors
4. Sensitivity Analysis

Task 18: Demand Management and Climate ChangeSubTask 2: Emission Calculation Method 26
Days of the Week
The emissions factor decreases slightly on the weekends, during which the variability of the factor is reduced throughout the day
Week Days Weekend
0.280
0.300
0.320
0.340
0.360
0.380
1 2 3 4 5 6 7 8 9 10 11 12 13 14 15 16 17 18 19 20 21 22 23 24
Curve Factors for Emissions from Each Year Curve Factors for Emissions from Each Year
0.280
0.300
0.320
0.340
0.360
0.380
1 2 3 4 5 6 7 8 9 10 11 12 13 14 15 16 17 18 19 20 21 22 23 24
2008
2007
2006
tn/MWh tn/MWhDuring the demand peaks the typical dips in the emissins factorcurve are not observed as the peak entry of hydro-electricpower is compensated by a proportional recovery in thecombined cycles
4. Sensitivity Analysis

Task 18: Demand Management and Climate ChangeSubTask 2: Emission Calculation Method 27
Index1. Objectives2. Emissions Factor Estimation Method 3. Daily Emissions4. Sensitivity Analysis5. Conclusions6. Annexe

Task 18: Demand Management and Climate ChangeSubTask 2: Emission Calculation Method
5. ConclusionsConsiderations on the Daily Curves of Emissions Factors
28
The low variability of the emissions factor,remaining relatively constant throughout the day(with a maximum variability of +/- 3.4%)
The factor is highly sensitive to variations in thecomposition of the mix, a small percentage ofvariation in some of the technologies used maynotably affect the factor
0,330
0,340
0,350
0,360
0,370
0,380
0,390
1 2 3 4 5 6 7 8 9 10 11 12 13 14 15 16 17 18 19 20 21 22 23 24
Curva Media
2006
2007
2008
Curva media Tn/MWh
2 periods during the day:
24:00 – 8:00 The emissions factor follows the tendency of the demand and electricity price
8:00 – 24:00 The emissions factor behaves in an inverse manner with respect to demand andprice. A recovery of hydroelectric power ocurrs at the peaks which reduces the factor. Duringthe demand dip the factor recovers due to the influence of the combined cycle in the mix.
Descent of total emissions and the emissions factor in 2008, due to the descent of productionusing coal and the increase in wind power.
Average emissions factor for the three years: 0.36 tn/MWh

Task 18: Demand Management and Climate ChangeSubTask 2: Emission Calculation Method 29
Index1. Objectives2. Emissions Factor Estimation Method 3. Daily Emissions4. Sensitivity Analysis5. Conclusions6. Annexe

Task 18: Demand Management and Climate ChangeSubTask 2: Emission Calculation Method
1998 1999 2000 2001 2002 2005 2006 2007 20082003 2004
Prec
io (€
/MW
)
6. AnnexeConsideration on Prices
The Annual Variation of the Price of Electricity The Daily Variation of the Price of Electricity
Prec
io (€
/MW
)
An increase of the absolute factor is seen in the demand peaks with a range ofvariation in prices
The price of electricity undergoes significant variability – not only interannually, but throughout the day,coinciding with variations in the demand curve
Task 18: Demand Management and Climate ChangeSubTask 2: Emission Calculation Method
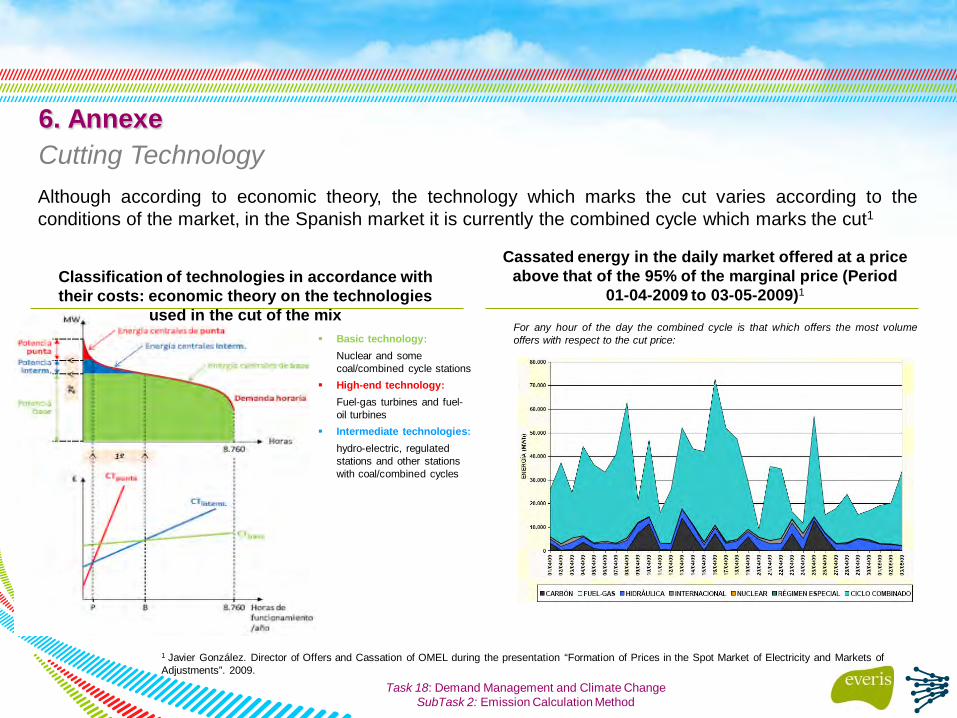
6. AnnexeCutting Technology
Classification of technologies in accordance with their costs: economic theory on the technologies
used in the cut of the mix Basic technology:
Nuclear and some coal/combined cycle stations
High-end technology:Fuel-gas turbines and fuel-oil turbines
Intermediate technologies:hydro-electric, regulated stations and other stations with coal/combined cycles
Cassated energy in the daily market offered at a price above that of the 95% of the marginal price (Period
01-04-2009 to 03-05-2009)1
Although according to economic theory, the technology which marks the cut varies according to theconditions of the market, in the Spanish market it is currently the combined cycle which marks the cut1
1 Javier González. Director of Offers and Cassation of OMEL during the presentation “Formation of Prices in the Spot Market of Electricity and Markets of Adjustments”. 2009.
For any hour of the day the combined cycle is that which offers the most volumeoffers with respect to the cut price:

Task 18: Demand Management and Climate ChangeSubTask 2: Emission Calculation Method
6. AnnexeData used for the AnalysisCalculations based on production data of the P48 programme of the Spanish electrical sector (source:REE) for 2006, 2007and 2008.
The emission factors for each technology is as follows:
Coal: 0.95 tn/MWh Combined cycles: 0.37 tn/MWh Fuel+Gas: 0.70 tn/MWh Special Thermal System: 0.31 tn/MWh Interconnections: 0.49 tn/MWh
In the case of interconnections the specific factor for each country has been considered with respect to its contribution to theinterconnections in the three years. In this manner, for 2008, the influence of each country was: France 77.5%, Portugal22.2%, Morocco 0.3% (Source: El Sistema Eléctrico Español 2008. Avance. REE).The emission factor for the electrical system of each country was obtained in different manners. In the case of Portugal, bymultiplying the emission factor by the technology which appears in its National Assignment Plan by the average energy mixof the country (source:REN). In the case of France, the National Assignment Plan does not provide a factor for technologyused, however it does give a global value for pollutant generating equipment (0.904 tn/MWh). In its place the value of 0.4tn/Mwh of exported electrical production is considered (source: ADEME). In the case of Morocco a factor of 0.83 tn/MWh hasbeen considered, which has been calculated as a ration between electrical production and the total of emissions fromproduction according to the United Nations Framework Convention on Climate Change.

Task 18: Demand Management and Climate ChangeSubTask 2: Emission Calculation Method 33