analysis of the berlin accord reforms to theageconsearch.umn.edu/bitstream/18282/1/bp990024.pdf ·...
TRANSCRIPT

Analysis of the Berlin Accord Reforms of the European Union’s Common Agricultural Policy
FAPRI Staff*Food and Agricultural Policy Research Institute
Briefing Paper 99-BP 24June 1999
Center for Agricultural and Rural DevelopmentIowa State University
Ames, Iowa 50011-1070www.card.iastate.edu
*FAPRI Staff who contributed to this paper are Bruce A. Babcock, John C. Beghin, SamarenduMohanty, Frank Fuller, Jacinto Fabiosa, Sudhir Chaudhary, Phillip Kaus, Cheng Fang, Chad Hart,and Karen Kovarik.
This paper is available online on the CARD Web site: www.card.iastate.edu. Permission isgranted to cite this information with appropriate attribution to the authors.
Questions or comments about the contents of this paper should be directed to John Beghin, 578Heady Hall, Iowa State University, Ames, Iowa 50011-1070; Ph: (515) 294-5811; Fax: (515) 294-6336; E-mail: [email protected].
Iowa State University does not discriminate on the basis of race, color, age, religion, national origin, sexual orientation,gender identity, sex, marital status, disability, or status as a U.S. veteran. Inquiries can be directed to the Director of EqualOpportunity and Diversity, 3680 Beardshear Hall, (515) 294-7612.
ANALYSIS OF THE BERLIN ACCORD REFORMS OF THE EUROPEAN UNION’S COMMON AGRICULTURAL POLICY
This document briefly summarizes the impacts of the European Union’s Common Agricultural Policy (CAP) reforms on the European agricultural sector and on international agricultural trade. Objectives of the CAP reform (as stated in EU Commission documents) are: • = to ensure the environmental viability of European agriculture, and • = to protect the livelihood of European farmers.
DURING THE BERLIN European Council meeting in March, 1999, European Union (EU) heads of state reached an agreement on the political and financial guidelines of the Agenda 2000 reforms (reforms to the EU’s Common Agricultural Policy [CAP]). The guidelines were officially adopted by the Council two months later. An analysis of the Berlin Accord reforms (summarized in the briefing paper) was conducted by this Food and Agricultural Policy Research Institute (FAPRI) at Iowa State University as part of a study of the impacts of enlarging the EU to include the Central and Eastern European countries (CEECs).1 The initial Agenda 2000 reform proposal was drafted in 1997, and, after several revisions, the proposal now constitutes the most comprehensive plan for reform of the CAP since the “MacSharry” reforms in 1991-92. As with the MacSharry reforms, the Agenda 2000 proposal is intended to reduce support for commodities through market interventions and increase support to farmers through direct payments. The specifics of the proposed reforms are outlined in the next section.
Assumptions of the Analysis The FAPRI modeling system was employed to simulate the implementation of the proposed CAP reforms. This modeling system incorporates forecasts of macroeconomic variables–such as gross domestic product (GDP), inflation rates, and exchange rates–that were obtained from Standard and Poors DRI, Project Link, and WEFA. FAPRI researchers assume that average weather will prevail in the projection period. Apart from the policy changes contained in the Agenda 2000 proposal, domestic agricultural and commercial policies embodied in existing legislation and trade agreements are assumed to remain intact. The analysis uses the reform proposal outlined by the Agricultural Directorate General of the European Commission (DG VI 1999; DG VI 1999a). The proposal includes the following commodity-specific policy changes.
1 The Midwest Agribusiness Trade Research and Information Center (MATRIC) funded the EU enlargement analysis.
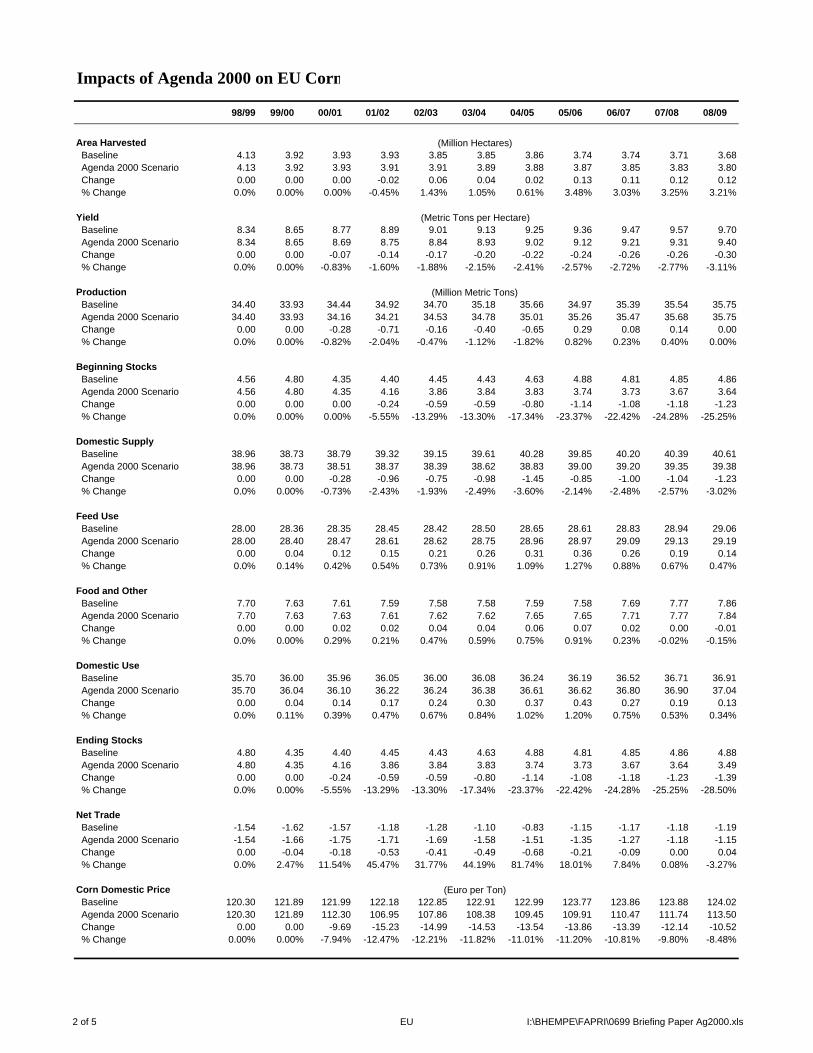
Crops The cereals intervention price is reduced by 15 percent in two equal steps, with the first reduction occurring during the 2000/01 marketing year. Cereals producers will be compensated for the price support reduction by increasing compensation payments from 54.34 to 63 euros per metric ton. The base rate for compulsory set-aside is 10 percent through the 2006/07 marketing year. Direct payments to oilseed producers will be progressively reduced to the level for cereals by the 2002/03 marketing year. Protein crops will receive a direct payment of 9.5 euros per metric ton in addition to the basic direct payment Beef The beef intervention price is reduced by 20 percent over a three-year period. In July 2002, the intervention price will be replaced by a beef basic price of 2224 euros per metric ton, and a private storage aid scheme will be introduced. Beef producers will be compensated for the decline in market prices by a phased increase in the special premium for steers and bulls and the suckler cow premium to 300, 210, and 200 euros per head, respectively. In addition, a slaughter premium is introduced, paying 80 euros per head for adult animals and 50 euros per head for calves. All producer premiums are capped at the regional level to contain expenditures; however, national governments may supplement producer payments up to the national financial expenditure limit established for each country. Finally, the extensification premium is increased to encourage reduced stocking densities. Dairy The current milk quota system is retained under Agenda 2000; however, quotas are increased in two stages. In 2000 and 2001, quotas for Greece, Spain, Ireland, Italy, and Northern Ireland are increased to more accurately reflect current production. Quotas for all countries are increased by 1.5 percent over the three-year period beginning in 2005. Butter and skim milk powder (SMP) intervention prices are reduced by 15 percent in three equal steps beginning in 2005. Producers will be compensated for the price reduction by the introduction of a payment of 17.24 euros per metric ton of milk delivered under the quota system. The Agenda 2000 proposal also outlines new regulations governing wine production and rural development policy. These regulations are an integral part of the proposed reforms, particularly the rural development policy; nevertheless, they do not affect the analysis described in this document and are ignored in the following discussion of the analysis results. Results The commodity policy changes described above were implemented in the FAPRI international agricultural policy model, and the model simulated the Agenda 2000 reforms through the 2008/09 crop year. The simulation results are compared to the 1999 FAPRI world agricultural baseline (FAPRI 1999) to assess the impacts of the policy changes on European and international agricultural markets. Impacts on Crops. The impacts on the crop sector largely depend on the assumed EU set-aside rate, both in the baseline and the Berlin Accord analysis. In the baseline, the set-aside rate was

Analysis of the Berlin Accord Reforms / 3
raised from 10 percent in 1999/00 to 15 percent in 2008/09 based on market conditions. For the Berlin Accord scenario, a 10 percent set-aside is maintained throughout the period, as indicated in the accord. With a set-aside rate of 10 percent for 2000/01 and 2001/02, both in the baseline and the scenario, the Berlin Accord is not projected to have any significant impact on crop production. Total crop area declines slightly during this period, due to an increase in voluntary set-aside area in response to the lower intervention price. After 2001, the total area devoted to cereals and oilseeds increases because the set-aside rate is below the baseline level. The 2 percent reduction in set-aside each year during 2002 to 2004 and the 5 percent reduction during 2005 to 2008 increases crop area by little over 1 and 3 percent
Figure 1. EU Crop Area and Set Aside Rates
3 8 5 0 0
3 9 0 0 0
3 9 5 0 0
4 0 0 0 0
4 0 5 0 0
4 1 0 0 0
4 1 5 0 0
4 2 0 0 0
4 2 5 0 0
4 3 0 0 0
1 9 98 /9 9 2 00 0 /0 1 2 0 0 2 /0 3 2 0 04 /0 5 2 0 0 6/0 7 2 0 0 8 /0 9
Tho
usan
d H
ecta
res
0
2
4
6
8
1 0
1 2
1 4
1 6
Per
cent
Base line Area A G 20 0 0 Area Ba seline Set A side AG 20 00 Set A side

respectively (see Figure 1). Most of the rise in total area is likely to go into wheat production because the expected net return for wheat does not decline as much as for corn and barley. The addition of less productive land in production and lower prices cause a small decline in EU cereal yields. A modest change is projected for domestic use of cereals, with feed use rising mainly because of lower prices. In the baseline, EU wheat stock rises steadily until 2005/06 because weaker world prices restrict EU exports to the maximum level allowed by the Uruguay Round Agreement on Agriculture (URAA). After 2005, commercial exports expand as the worldprice strengthens. However, under the Berlin Accord, the decline in the intervention price enables the EU to export wheat without subsidy from 2001/02, and commercial exports expand above the baseline levels (see Figure 2). The increase in wheat exports results in a steady reduction of cereal intervention stocks.
Figure 2. EU Wheat Exports and Price
0
5
10
15
20
25
1998/99 2000/01 2002/03 2004/05 2006/07 2008/09
Mill
ion
Met
ric
Tons
95
100
105
110
115
120
125
130
EUR
O p
er M
etri
c To
n
Baseline Exports AG 2000 Exports Baseline Price AG 2000 Price

Analysis of the Berlin Accord Reforms / 5
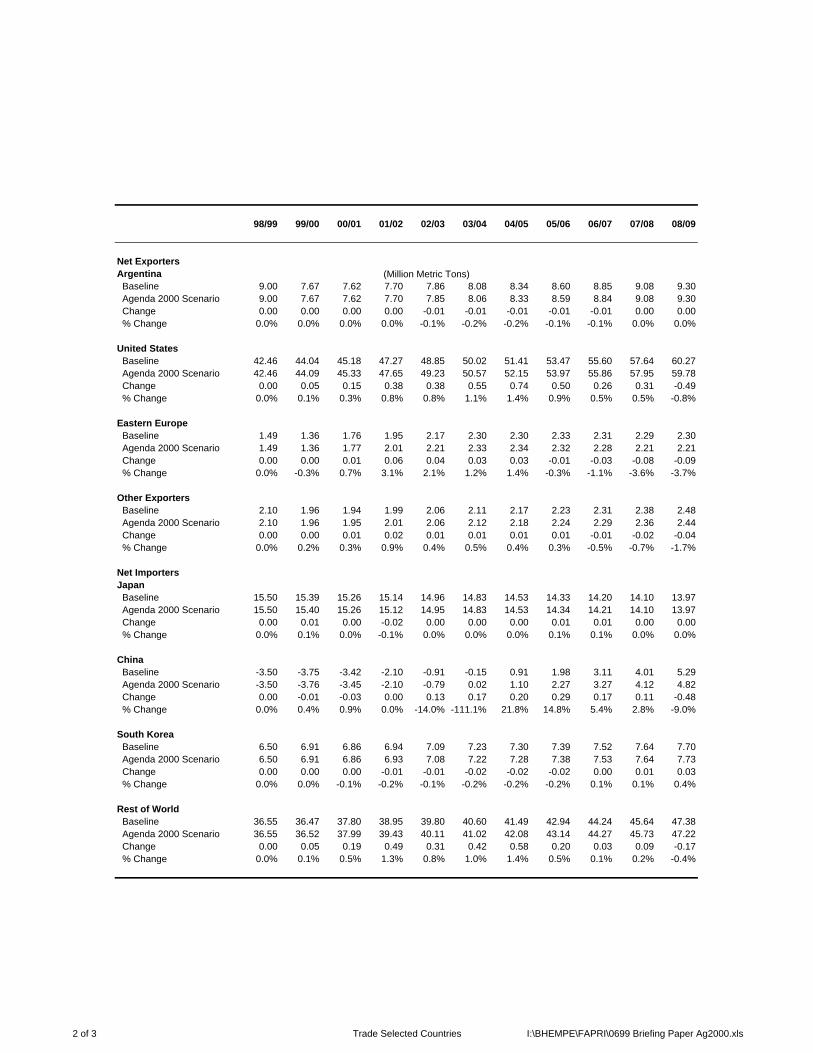
By equalizing the direct payments for both cereals and oilseeds, the Berlin Accord puts an end to restrictions on oilseed plantings contained in the Blair House Agreement; thus, planting decisions should be driven by market factors. Based on relative returns, oilseed area is projected to decline in the Berlin Accord scenario. Impacts on the U.S. and World Markets Implementation of the Berlin Accord is likely to expand EU exports and reduce world prices for most crops. However, changes in world market prices are likely to be small. The United States and the EU compete most heavily in the world wheat market. Because the EU would produce and export more wheat under the Berlin Accord, the world reference price for wheat is expected to decline by an average of 2 to 3 percent (see Figure 3). Similarly, U.S. wheat exports are likely to fall by 2 to 3 percent. In addition to the United States, wheat exports by other major exporters such as Argentina, Australia, and Canada also decline by 1 to 2 percent. Unlike wheat, U.S. corn and soybean prices are projected to fall by less than 1 percent. The reduction in EU oilseed production under the Berlin Accord increases U.S. soybean and soybean meal exports slightly.
Figure 3. US Wheat Exports and Price
23
24
25
26
27
28
29
30
31
1998/99 2000/01 2002/03 2004/05 2006/07 2008/09
Mill
ion
Met
ric
Tons
100
110
120
130
140
150
160
170
180
US
Dol
lars
per
Met
ric
Ton
Baseline Exports AG 2000 Exports Baseline Price AG 2000 Price

6 / FAPRI Staff
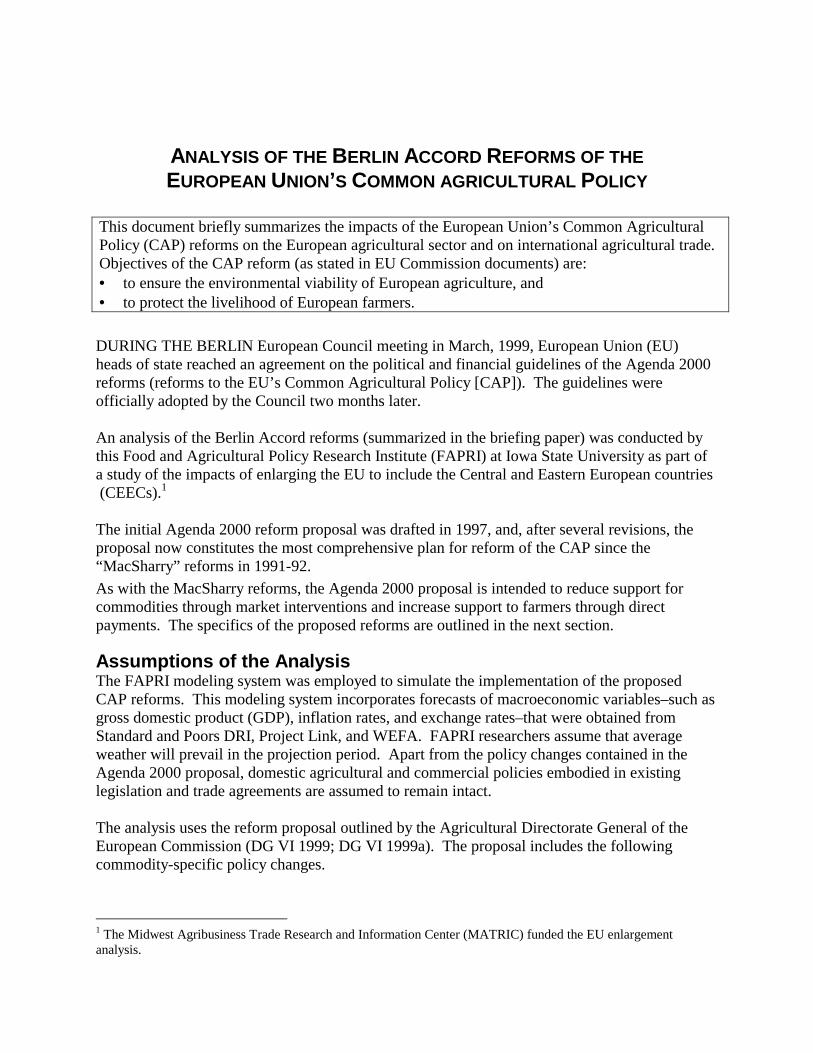
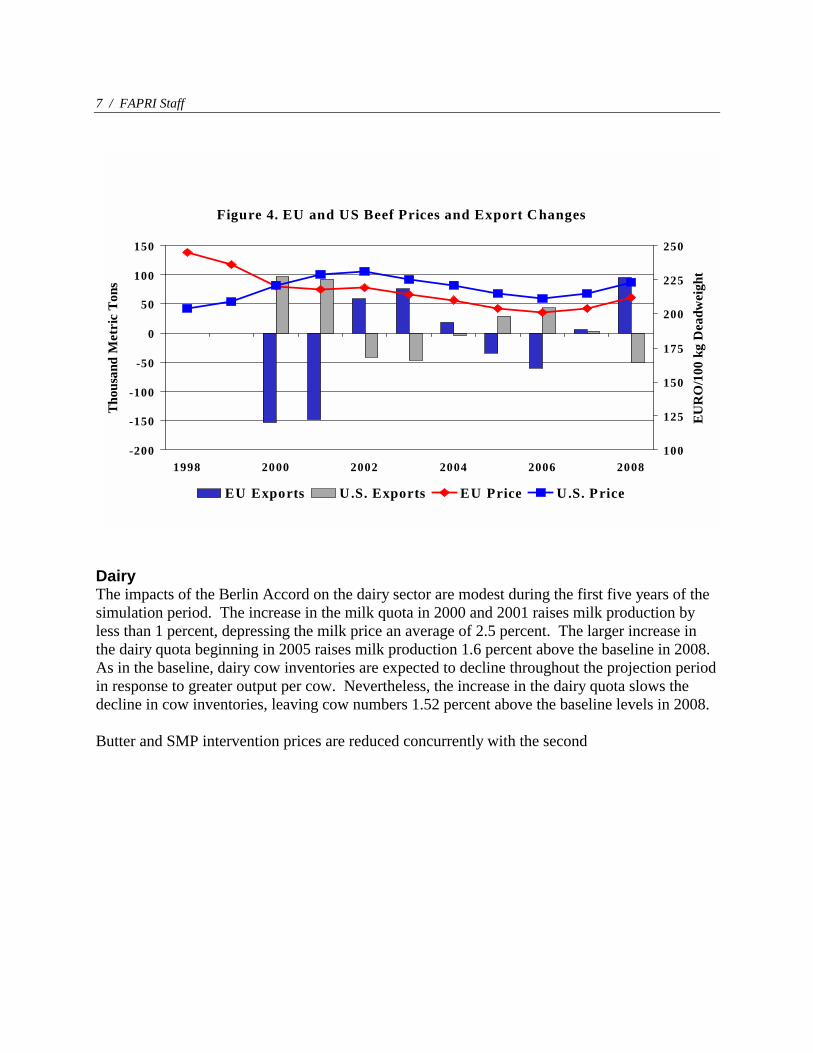
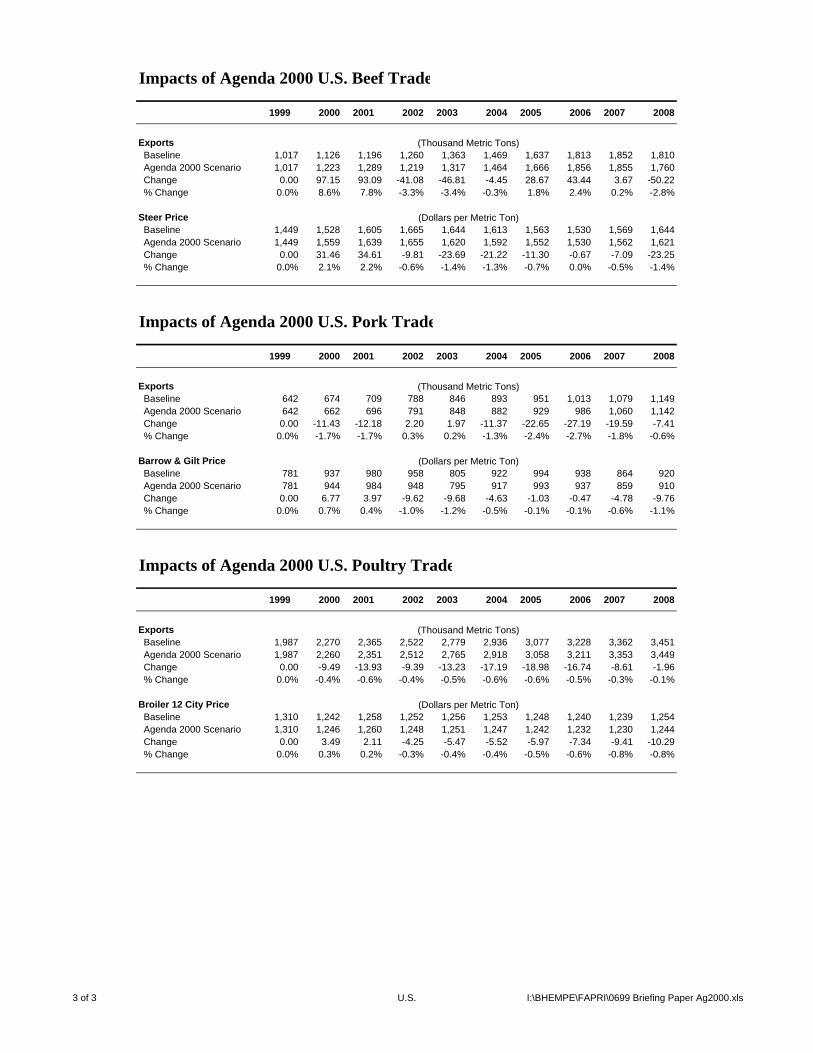
Livestock The impacts of the Berlin Accord in the livestock sector are dominated by changes in the EU beef market. The phased reduction in the beef intervention price prompts the release of beef intervention stocks, reducing domestic beef prices. The magnitude of the decline in EU beef prices is determined, in part, by how the Commission handles export subsidies. If subsidized beef exports are maintained at the maximum levels allowed under the URAA, domestic beef prices will be supported, counteracting efforts to increase international competitiveness through the reduction in the intervention price. Consequently, we assume the EU Commission will reduce subsidized beef exports as long as industry revenues are as great as under the baseline. The net impact on the EU average beef producer price is a 6.44 and a 7.42 percent decline in 2000 and 2001 relative to the baseline projections. EU beef net exports are an average of 150 thousand metric tons below the baseline during those two years. By 2002, the intervention price reductions are complete, and intervention stocks are eliminated. We assume that private beef stocks will replace intervention stocks at a level near 2.5 percent of annual beef consumption. In 2002, EU beef prices are 5 percent below the U.S. price. Although U.S. and European beef are not perfect substitutes on international markets, it is assumed that with the 5 percent price discount, the EU can export beef without subsidy. The EU will most likely continue to subsidize beef exports to certain markets; however, beef exports will not be constrained by URAA limits. Consequently, EU beef prices move with international prices from 2002 onward, and beef exports exceed the baseline levels five of seven years from 2002 to 2008. Figure 4 summarizes the movements in the EU and U.S. beef prices and changes in beef exports. Beef producers in the EU respond to lower prices by decreasing beef production slightly relative to the baseline, averaging 0.5 percent lower. The downward pressures on beef production are offset partially by producer payments, changes in dairy cow inventories, and reductions in feed costs. We assume that most direct payments to producers are coupled to production over some range cattle inventories. Though the degree of coupling and the relevant ranges are not known, FAPRI researchers approximate the positive impacts on production by assuming the increases in the special premium to male animals if fully coupled. Lower beef prices encourage consumers in the EU to increase their consumption of beef between 1.5 and 3 percent over the baseline levels. Substitution effects away from pork and poultry consumption are fully compensated by lower pork and poultry prices. Lower cereal and oilseed prices prompt small increases in EU pork and poultry production, averaging less than 1 percent, inducing an average decline in EU pork and poultry prices of 3.8 to 4 percent relative to the baseline.
7 / FAPRI Staff
Dairy The impacts of the Berlin Accord on the dairy sector are modest during the first five years of the simulation period. The increase in the milk quota in 2000 and 2001 raises milk production by less than 1 percent, depressing the milk price an average of 2.5 percent. The larger increase in the dairy quota beginning in 2005 raises milk production 1.6 percent above the baseline in 2008. As in the baseline, dairy cow inventories are expected to decline throughout the projection period in response to greater output per cow. Nevertheless, the increase in the dairy quota slows the decline in cow inventories, leaving cow numbers 1.52 percent above the baseline levels in 2008. Butter and SMP intervention prices are reduced concurrently with the second
-200
-150
-100
-50
0
50
100
150
1998 2000 2002 2004 2006 2008
Thou
sand
Met
ric
Tons
100
125
150
175
200
225
250
EUR
O/1
00 k
g D
eadw
eigh
t
EU Exports U.S. Exports EU Price U.S. Price
Figure 4. EU and US Beef Prices and Export Changes
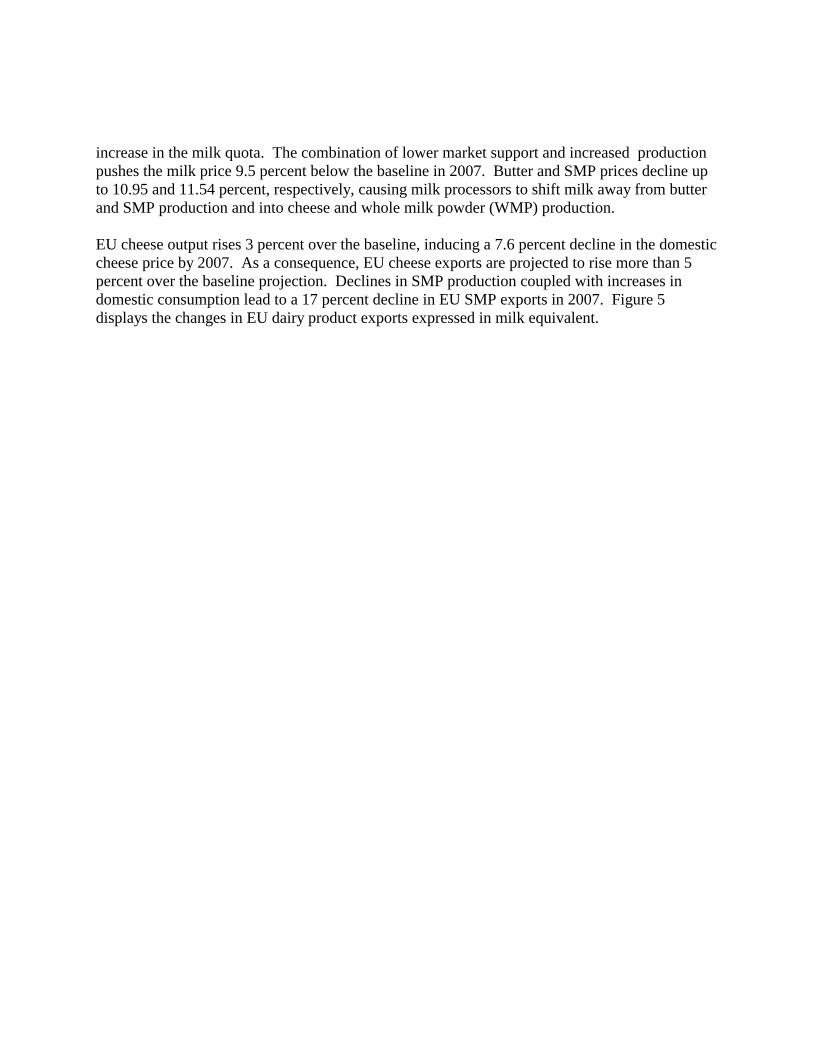
increase in the milk quota. The combination of lower market support and increased production pushes the milk price 9.5 percent below the baseline in 2007. Butter and SMP prices decline up to 10.95 and 11.54 percent, respectively, causing milk processors to shift milk away from butter and SMP production and into cheese and whole milk powder (WMP) production. EU cheese output rises 3 percent over the baseline, inducing a 7.6 percent decline in the domestic cheese price by 2007. As a consequence, EU cheese exports are projected to rise more than 5 percent over the baseline projection. Declines in SMP production coupled with increases in domestic consumption lead to a 17 percent decline in EU SMP exports in 2007. Figure 5 displays the changes in EU dairy product exports expressed in milk equivalent.

Analysis of the Berlin Accord Reforms / 9
Concluding Remarks The CAP reforms resulting from the Berlin Accord are likely to create substantial changes in European agricultural markets. In particular, implementation of the Berlin Accord will expand cereal production in the EU, lowering wheat prices and enhancing the EU’s ability to export without subsidies. This will lead to lower world wheat prices and also lower U.S. exports. Prices of other crops, such as corn, soybeans, and barley are lower under the Berlin Accord, though the effects are much smaller than for wheat. Likewise, policy changes in the livestock and dairy sector will lower beef and dairy product prices between 5 and 15 percent. EU beef exports may no longer be constrained by export subsidy reduction commitments, as EU domestic beef prices fall below the world price. The impact of changes in the EU beef market on U.S. beef prices and exports is small. Expansion in EU milk output will be channeled predominately into cheese production, lowering EU prices and increasing cheese exports. The results reported in this analysis are dependent on series of assumptions relating to the functioning of EU markets and to the future world agricultural and macro-economic situations. Changes in the underlying assumptions could significantly alter the results reported in this study.
-2000
-1500
-1000
-500
0
500
1000
2000 2001 2002 2003 2004 2005 2006 2007 2008
Thou
sand
Met
ric
Ton
s
Cheese Butter SMP WMP
Figure 5. EU Dairy Product Export Changes in Milk Equivalent

References Directorate General VI (Agriculture). 1999. “Agriculture Council: Policy Agreement on CAP
Reform.” DG VI Newsletter (Special Edition), March 11, 1999 <http://europa.eu.int/comm/dg06/publi/newsletter/spec1_en.htm> June 14, 1999.
Directorate General VI (Agriculture). 1999a. “Berlin European Council: Agenda 2000,
conclusions of the Presidency.” DG VI Newsletter (10), March 1999 < http://europa.eu.int/comm/dg06/publi/newsletter/10_en.htm> June 14, 1999.
Food and Agricultural Policy Research Institute (FAPRI). 1999. FAPRI 1999 World Agricultural
Outlook. Staff Report 2-99, Ames, Iowa.

Impacts of Agenda 2000 U.S. Wheat Trade
99/00 00/01 01/02 02/03 03/04 04/05 05/06 06/07 07/08 08/09
Exports Baseline 28.35 29.49 30.72 31.14 31.46 32.01 32.68 32.50 32.23 31.88 Agenda 2000 Scenario 28.39 29.43 30.25 30.46 30.48 30.79 31.13 31.46 31.66 31.99 Change 0.04 -0.06 -0.47 -0.68 -0.98 -1.22 -1.55 -1.04 -0.57 0.11 % Change 0.13% -0.19% -1.53% -2.19% -3.12% -3.82% -4.74% -3.19% -1.77% 0.34%
FOB Gulf Price Baseline 134.69 141.93 145.98 149.92 155.20 158.66 162.80 163.71 165.32 167.11 Agenda 2000 Scenario 134.83 142.03 144.58 147.55 151.48 154.28 156.92 160.26 162.87 166.89 Change 0.14 0.10 -1.40 -2.37 -3.72 -4.38 -5.88 -3.45 -2.45 -0.22 % Change 0.10% 0.07% -0.96% -1.58% -2.40% -2.76% -3.61% -2.11% -1.48% -0.13%
Impacts of Agenda 2000 U.S. Corn Trade
99/00 00/01 01/02 02/03 03/04 04/05 05/06 06/07 07/08 08/09
Exports Baseline 44.29 45.43 47.52 49.10 50.27 51.67 53.73 55.86 57.90 60.54 Agenda 2000 Scenario 44.34 45.58 47.91 49.48 50.83 52.40 54.23 56.12 58.20 60.04 Change 0.05 0.15 0.39 0.38 0.56 0.73 0.50 0.26 0.30 -0.50 % Change 0.12% 0.32% 0.82% 0.77% 1.10% 1.42% 0.94% 0.46% 0.51% -0.83%
FOB Gulf Price Baseline 91.54 94.05 95.80 98.61 101.83 103.85 106.32 107.96 109.90 112.95 Agenda 2000 Scenario 91.60 94.23 96.07 98.17 101.20 102.94 104.90 106.49 108.73 111.40 Change 0.06 0.18 0.27 -0.44 -0.63 -0.91 -1.42 -1.47 -1.17 -1.55 % Change 0.06% 0.19% 0.28% -0.44% -0.62% -0.87% -1.34% -1.36% -1.07% -1.37%
Impacts of Agenda 2000 U.S. Barley Trade
99/00 00/01 01/02 02/03 03/04 04/05 05/06 06/07 07/08 08/09
Exports Baseline 0.71 0.77 0.82 0.83 0.88 0.91 0.96 0.99 1.02 1.06 Agenda 2000 Scenario 0.71 0.77 0.82 0.85 0.88 0.94 0.96 1.02 1.00 1.07 Change 0.00 0.00 0.00 0.02 0.00 0.03 0.00 0.03 -0.02 0.01 % Change -0.18% -0.19% 0.61% 2.14% -0.12% 2.93% -0.19% 2.74% -2.24% 1.03%
Portland Baseline 115.71 117.49 118.83 122.04 124.79 126.69 128.57 130.06 131.88 134.69 Agenda 2000 Scenario 115.76 117.65 118.98 121.09 124.12 125.01 127.03 127.66 131.36 132.76 Change 0.05 0.16 0.15 -0.95 -0.67 -1.68 -1.54 -2.40 -0.52 -1.93 % Change 0.04% 0.14% 0.12% -0.77% -0.54% -1.32% -1.20% -1.84% -0.40% -1.43%
(Million Metric Tons)
(Million Metric Tons)
(Million Metric Tons)
(Dollars per Metric Ton)
(Dollars per Metric Ton)
(Dollars per Metric Ton)
1 of 3 U.S. I:\BHEMPE\FAPRI\0699 Briefing Paper Ag2000.xls
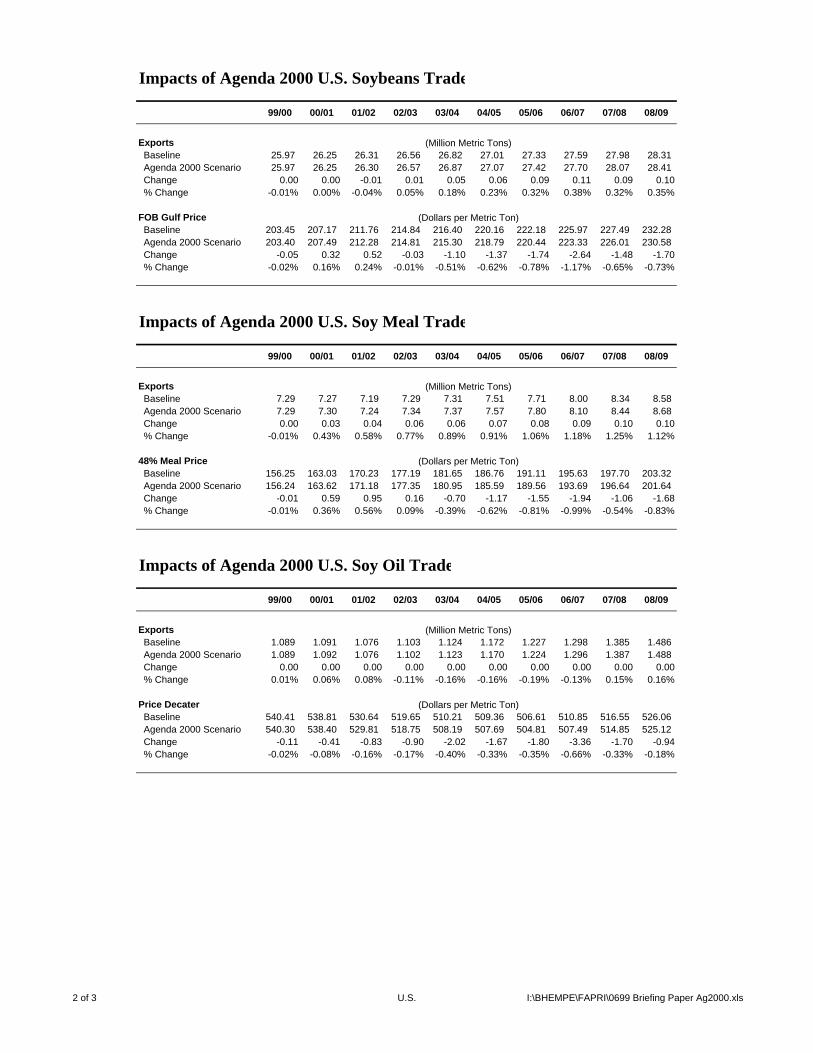
Impacts of Agenda 2000 U.S. Soybeans Trade
99/00 00/01 01/02 02/03 03/04 04/05 05/06 06/07 07/08 08/09
Exports Baseline 25.97 26.25 26.31 26.56 26.82 27.01 27.33 27.59 27.98 28.31 Agenda 2000 Scenario 25.97 26.25 26.30 26.57 26.87 27.07 27.42 27.70 28.07 28.41 Change 0.00 0.00 -0.01 0.01 0.05 0.06 0.09 0.11 0.09 0.10 % Change -0.01% 0.00% -0.04% 0.05% 0.18% 0.23% 0.32% 0.38% 0.32% 0.35%
FOB Gulf Price Baseline 203.45 207.17 211.76 214.84 216.40 220.16 222.18 225.97 227.49 232.28 Agenda 2000 Scenario 203.40 207.49 212.28 214.81 215.30 218.79 220.44 223.33 226.01 230.58 Change -0.05 0.32 0.52 -0.03 -1.10 -1.37 -1.74 -2.64 -1.48 -1.70 % Change -0.02% 0.16% 0.24% -0.01% -0.51% -0.62% -0.78% -1.17% -0.65% -0.73%
Impacts of Agenda 2000 U.S. Soy Meal Trade
99/00 00/01 01/02 02/03 03/04 04/05 05/06 06/07 07/08 08/09
Exports Baseline 7.29 7.27 7.19 7.29 7.31 7.51 7.71 8.00 8.34 8.58 Agenda 2000 Scenario 7.29 7.30 7.24 7.34 7.37 7.57 7.80 8.10 8.44 8.68 Change 0.00 0.03 0.04 0.06 0.06 0.07 0.08 0.09 0.10 0.10 % Change -0.01% 0.43% 0.58% 0.77% 0.89% 0.91% 1.06% 1.18% 1.25% 1.12%
48% Meal Price Baseline 156.25 163.03 170.23 177.19 181.65 186.76 191.11 195.63 197.70 203.32 Agenda 2000 Scenario 156.24 163.62 171.18 177.35 180.95 185.59 189.56 193.69 196.64 201.64 Change -0.01 0.59 0.95 0.16 -0.70 -1.17 -1.55 -1.94 -1.06 -1.68 % Change -0.01% 0.36% 0.56% 0.09% -0.39% -0.62% -0.81% -0.99% -0.54% -0.83%
Impacts of Agenda 2000 U.S. Soy Oil Trade
99/00 00/01 01/02 02/03 03/04 04/05 05/06 06/07 07/08 08/09
Exports Baseline 1.089 1.091 1.076 1.103 1.124 1.172 1.227 1.298 1.385 1.486 Agenda 2000 Scenario 1.089 1.092 1.076 1.102 1.123 1.170 1.224 1.296 1.387 1.488 Change 0.00 0.00 0.00 0.00 0.00 0.00 0.00 0.00 0.00 0.00 % Change 0.01% 0.06% 0.08% -0.11% -0.16% -0.16% -0.19% -0.13% 0.15% 0.16%
Price Decater Baseline 540.41 538.81 530.64 519.65 510.21 509.36 506.61 510.85 516.55 526.06 Agenda 2000 Scenario 540.30 538.40 529.81 518.75 508.19 507.69 504.81 507.49 514.85 525.12 Change -0.11 -0.41 -0.83 -0.90 -2.02 -1.67 -1.80 -3.36 -1.70 -0.94 % Change -0.02% -0.08% -0.16% -0.17% -0.40% -0.33% -0.35% -0.66% -0.33% -0.18%
(Dollars per Metric Ton)
(Million Metric Tons)
(Dollars per Metric Ton)
(Million Metric Tons)
(Million Metric Tons)
(Dollars per Metric Ton)
2 of 3 U.S. I:\BHEMPE\FAPRI\0699 Briefing Paper Ag2000.xls
Impacts of Agenda 2000 U.S. Beef Trade
1999 2000 2001 2002 2003 2004 2005 2006 2007 2008
Exports Baseline 1,017 1,126 1,196 1,260 1,363 1,469 1,637 1,813 1,852 1,810 Agenda 2000 Scenario 1,017 1,223 1,289 1,219 1,317 1,464 1,666 1,856 1,855 1,760 Change 0.00 97.15 93.09 -41.08 -46.81 -4.45 28.67 43.44 3.67 -50.22 % Change 0.0% 8.6% 7.8% -3.3% -3.4% -0.3% 1.8% 2.4% 0.2% -2.8%
Steer Price Baseline 1,449 1,528 1,605 1,665 1,644 1,613 1,563 1,530 1,569 1,644 Agenda 2000 Scenario 1,449 1,559 1,639 1,655 1,620 1,592 1,552 1,530 1,562 1,621 Change 0.00 31.46 34.61 -9.81 -23.69 -21.22 -11.30 -0.67 -7.09 -23.25 % Change 0.0% 2.1% 2.2% -0.6% -1.4% -1.3% -0.7% 0.0% -0.5% -1.4%
Impacts of Agenda 2000 U.S. Pork Trade
1999 2000 2001 2002 2003 2004 2005 2006 2007 2008
Exports Baseline 642 674 709 788 846 893 951 1,013 1,079 1,149 Agenda 2000 Scenario 642 662 696 791 848 882 929 986 1,060 1,142 Change 0.00 -11.43 -12.18 2.20 1.97 -11.37 -22.65 -27.19 -19.59 -7.41 % Change 0.0% -1.7% -1.7% 0.3% 0.2% -1.3% -2.4% -2.7% -1.8% -0.6%
Barrow & Gilt Price Baseline 781 937 980 958 805 922 994 938 864 920 Agenda 2000 Scenario 781 944 984 948 795 917 993 937 859 910 Change 0.00 6.77 3.97 -9.62 -9.68 -4.63 -1.03 -0.47 -4.78 -9.76 % Change 0.0% 0.7% 0.4% -1.0% -1.2% -0.5% -0.1% -0.1% -0.6% -1.1%
Impacts of Agenda 2000 U.S. Poultry Trade
1999 2000 2001 2002 2003 2004 2005 2006 2007 2008
Exports Baseline 1,987 2,270 2,365 2,522 2,779 2,936 3,077 3,228 3,362 3,451 Agenda 2000 Scenario 1,987 2,260 2,351 2,512 2,765 2,918 3,058 3,211 3,353 3,449 Change 0.00 -9.49 -13.93 -9.39 -13.23 -17.19 -18.98 -16.74 -8.61 -1.96 % Change 0.0% -0.4% -0.6% -0.4% -0.5% -0.6% -0.6% -0.5% -0.3% -0.1%
Broiler 12 City Price Baseline 1,310 1,242 1,258 1,252 1,256 1,253 1,248 1,240 1,239 1,254 Agenda 2000 Scenario 1,310 1,246 1,260 1,248 1,251 1,247 1,242 1,232 1,230 1,244 Change 0.00 3.49 2.11 -4.25 -5.47 -5.52 -5.97 -7.34 -9.41 -10.29 % Change 0.0% 0.3% 0.2% -0.3% -0.4% -0.4% -0.5% -0.6% -0.8% -0.8%
(Dollars per Metric Ton)
(Thousand Metric Tons)
(Thousand Metric Tons)
(Thousand Metric Tons)
(Dollars per Metric Ton)
(Dollars per Metric Ton)
3 of 3 U.S. I:\BHEMPE\FAPRI\0699 Briefing Paper Ag2000.xls

98/99 99/00 00/01 01/02 02/03 03/04 04/05 05/06 06/07 07/08 08/09
Net ExportersArgentina Baseline 5.98 6.27 6.48 6.72 6.94 7.15 7.37 7.59 7.80 7.99 8.19 Agenda 2000 Scenario 5.98 6.27 6.48 6.72 6.92 7.12 7.32 7.52 7.72 7.92 8.15 Change 0.00 0.00 0.00 0.00 -0.02 -0.03 -0.05 -0.07 -0.08 -0.07 -0.05 % Change 0.0% 0.0% 0.0% 0.0% -0.3% -0.5% -0.7% -0.9% -1.1% -0.8% -0.6%
Australia Baseline 13.97 14.95 14.70 14.41 14.38 14.61 14.99 15.42 15.85 16.24 16.55 Agenda 2000 Scenario 13.97 14.95 14.70 14.41 14.37 14.59 14.95 15.36 15.75 16.12 16.44 Change 0.00 0.00 0.00 0.00 -0.01 -0.02 -0.04 -0.07 -0.10 -0.11 -0.12 % Change 0.0% 0.0% 0.0% 0.0% -0.1% -0.1% -0.3% -0.4% -0.6% -0.7% -0.7%
Canada Baseline 15.30 15.54 15.66 15.88 16.15 16.49 16.83 17.18 17.52 17.68 17.85 Agenda 2000 Scenario 15.30 15.54 15.66 15.80 16.00 16.25 16.50 16.75 17.13 17.34 17.65 Change 0.00 0.01 0.00 -0.07 -0.15 -0.24 -0.33 -0.43 -0.40 -0.33 -0.20 % Change 0.0% 0.0% 0.0% -0.5% -0.9% -1.5% -1.9% -2.5% -2.3% -1.9% -1.1%
Eastern Europe Baseline 1.18 0.67 1.16 1.40 1.45 1.45 1.41 1.40 1.31 1.28 1.21 Agenda 2000 Scenario 1.18 0.65 1.15 1.35 1.36 1.32 1.24 1.17 1.12 1.14 1.18 Change 0.00 -0.02 -0.01 -0.05 -0.09 -0.13 -0.17 -0.23 -0.19 -0.14 -0.03 % Change 0.0% -3.2% -0.9% -3.4% -6.0% -9.2% -12.1% -16.4% -14.6% -11.2% -2.9%
United States Baseline 27.37 25.90 27.03 28.26 28.68 29.01 29.56 30.25 30.08 29.83 29.48 Agenda 2000 Scenario 27.37 25.94 26.98 27.80 28.01 28.03 28.34 28.68 29.01 29.21 29.54 Change 0.00 0.03 -0.05 -0.46 -0.67 -0.98 -1.22 -1.57 -1.07 -0.62 0.07 % Change 0.0% 0.1% -0.2% -1.6% -2.3% -3.4% -4.1% -5.2% -3.5% -2.1% 0.2%
European Union Baseline 15.24 14.72 13.29 13.29 13.29 13.29 13.29 13.29 15.16 17.40 20.62 Agenda 2000 Scenario 15.24 14.67 13.29 14.18 15.05 16.05 16.95 18.02 19.08 20.15 21.48 Change 0.00 -0.05 0.00 0.88 1.76 2.76 3.65 4.72 3.92 2.75 0.86 % Change 0.0% -0.4% 0.0% 6.7% 13.2% 20.8% 27.5% 35.5% 25.9% 15.8% 4.2%
Other Exporters Baseline 22.23 22.91 24.41 25.09 25.97 26.44 27.01 27.47 27.75 27.88 27.64 Agenda 2000 Scenario 22.23 22.91 24.43 25.01 25.64 25.97 26.33 26.67 26.89 27.34 27.34 Change 0.00 0.00 0.01 -0.08 -0.33 -0.47 -0.68 -0.79 -0.86 -0.54 -0.30 % Change 0.0% 0.0% 0.1% -0.3% -1.3% -1.8% -2.5% -2.9% -3.1% -1.9% -1.1%
Net ImportersJapan Baseline 5.80 5.80 5.79 5.80 5.81 5.84 5.87 5.89 5.93 5.97 6.01 Agenda 2000 Scenario 5.80 5.80 5.79 5.80 5.81 5.84 5.87 5.89 5.93 5.97 6.01 Change 0.00 0.00 0.00 0.00 0.00 0.00 0.00 0.00 0.00 0.00 0.00 % Change 0.0% 0.0% 0.0% 0.0% 0.0% 0.0% 0.0% 0.0% 0.0% 0.0% 0.0%
China Baseline 1.00 0.98 1.55 2.17 2.81 2.57 2.28 1.88 1.71 1.63 1.74 Agenda 2000 Scenario 1.00 0.97 1.54 2.25 3.02 2.99 2.84 2.69 2.43 2.28 2.02 Change 0.00 -0.01 -0.01 0.08 0.21 0.42 0.56 0.81 0.72 0.65 0.28 % Change 0.0% -1.2% -0.6% 3.7% 7.4% 16.2% 24.6% 43.0% 42.2% 39.8% 16.4%
Brazil Baseline 5.86 5.96 6.03 6.10 6.15 6.22 6.29 6.38 6.48 6.57 6.66 Agenda 2000 Scenario 5.86 5.96 6.03 6.10 6.16 6.22 6.30 6.39 6.49 6.57 6.67 Change 0.00 0.00 0.00 0.00 0.01 0.01 0.01 0.01 0.01 0.01 0.00 % Change 0.0% 0.0% 0.0% 0.0% 0.1% 0.1% 0.1% 0.2% 0.1% 0.1% 0.1%
Mexico Baseline 2.25 2.26 2.32 2.38 2.47 2.58 2.69 2.81 2.95 3.10 3.26 Agenda 2000 Scenario 2.25 2.26 2.32 2.38 2.48 2.59 2.70 2.83 2.96 3.11 3.26 Change 0.00 0.00 0.00 0.00 0.01 0.01 0.01 0.02 0.02 0.01 0.00 % Change 0.0% 0.0% 0.0% 0.1% 0.3% 0.4% 0.5% 0.6% 0.5% 0.3% 0.1%
Rest of World Baseline 65.23 64.06 64.70 66.08 66.84 68.03 69.56 71.23 73.45 75.52 77.92 Agenda 2000 Scenario 65.23 64.06 64.68 66.27 67.23 68.66 70.40 72.32 74.30 76.11 78.06 Change 0.00 0.00 -0.02 0.18 0.39 0.63 0.84 1.09 0.85 0.59 0.14 % Change 0.0% 0.0% 0.0% 0.3% 0.6% 0.9% 1.2% 1.5% 1.2% 0.8% 0.2%
Impacts of Agenda 2000 on World Wheat Trade
(Million Metric Tons)
1 of 3 Trade Selected Countries I:\BHEMPE\FAPRI\0699 Briefing Paper Ag2000.xls
98/99 99/00 00/01 01/02 02/03 03/04 04/05 05/06 06/07 07/08 08/09
Net ExportersArgentina Baseline 9.00 7.67 7.62 7.70 7.86 8.08 8.34 8.60 8.85 9.08 9.30 Agenda 2000 Scenario 9.00 7.67 7.62 7.70 7.85 8.06 8.33 8.59 8.84 9.08 9.30 Change 0.00 0.00 0.00 0.00 -0.01 -0.01 -0.01 -0.01 -0.01 0.00 0.00 % Change 0.0% 0.0% 0.0% 0.0% -0.1% -0.2% -0.2% -0.1% -0.1% 0.0% 0.0%
United States Baseline 42.46 44.04 45.18 47.27 48.85 50.02 51.41 53.47 55.60 57.64 60.27 Agenda 2000 Scenario 42.46 44.09 45.33 47.65 49.23 50.57 52.15 53.97 55.86 57.95 59.78 Change 0.00 0.05 0.15 0.38 0.38 0.55 0.74 0.50 0.26 0.31 -0.49 % Change 0.0% 0.1% 0.3% 0.8% 0.8% 1.1% 1.4% 0.9% 0.5% 0.5% -0.8%
Eastern Europe Baseline 1.49 1.36 1.76 1.95 2.17 2.30 2.30 2.33 2.31 2.29 2.30 Agenda 2000 Scenario 1.49 1.36 1.77 2.01 2.21 2.33 2.34 2.32 2.28 2.21 2.21 Change 0.00 0.00 0.01 0.06 0.04 0.03 0.03 -0.01 -0.03 -0.08 -0.09 % Change 0.0% -0.3% 0.7% 3.1% 2.1% 1.2% 1.4% -0.3% -1.1% -3.6% -3.7%
Other Exporters Baseline 2.10 1.96 1.94 1.99 2.06 2.11 2.17 2.23 2.31 2.38 2.48 Agenda 2000 Scenario 2.10 1.96 1.95 2.01 2.06 2.12 2.18 2.24 2.29 2.36 2.44 Change 0.00 0.00 0.01 0.02 0.01 0.01 0.01 0.01 -0.01 -0.02 -0.04 % Change 0.0% 0.2% 0.3% 0.9% 0.4% 0.5% 0.4% 0.3% -0.5% -0.7% -1.7%
Net ImportersJapan Baseline 15.50 15.39 15.26 15.14 14.96 14.83 14.53 14.33 14.20 14.10 13.97 Agenda 2000 Scenario 15.50 15.40 15.26 15.12 14.95 14.83 14.53 14.34 14.21 14.10 13.97 Change 0.00 0.01 0.00 -0.02 0.00 0.00 0.00 0.01 0.01 0.00 0.00 % Change 0.0% 0.1% 0.0% -0.1% 0.0% 0.0% 0.0% 0.1% 0.1% 0.0% 0.0%
China Baseline -3.50 -3.75 -3.42 -2.10 -0.91 -0.15 0.91 1.98 3.11 4.01 5.29 Agenda 2000 Scenario -3.50 -3.76 -3.45 -2.10 -0.79 0.02 1.10 2.27 3.27 4.12 4.82 Change 0.00 -0.01 -0.03 0.00 0.13 0.17 0.20 0.29 0.17 0.11 -0.48 % Change 0.0% 0.4% 0.9% 0.0% -14.0% -111.1% 21.8% 14.8% 5.4% 2.8% -9.0%
South Korea Baseline 6.50 6.91 6.86 6.94 7.09 7.23 7.30 7.39 7.52 7.64 7.70 Agenda 2000 Scenario 6.50 6.91 6.86 6.93 7.08 7.22 7.28 7.38 7.53 7.64 7.73 Change 0.00 0.00 0.00 -0.01 -0.01 -0.02 -0.02 -0.02 0.00 0.01 0.03 % Change 0.0% 0.0% -0.1% -0.2% -0.1% -0.2% -0.2% -0.2% 0.1% 0.1% 0.4%
Rest of World Baseline 36.55 36.47 37.80 38.95 39.80 40.60 41.49 42.94 44.24 45.64 47.38 Agenda 2000 Scenario 36.55 36.52 37.99 39.43 40.11 41.02 42.08 43.14 44.27 45.73 47.22 Change 0.00 0.05 0.19 0.49 0.31 0.42 0.58 0.20 0.03 0.09 -0.17 % Change 0.0% 0.1% 0.5% 1.3% 0.8% 1.0% 1.4% 0.5% 0.1% 0.2% -0.4%
(Million Metric Tons)
2 of 3 Trade Selected Countries I:\BHEMPE\FAPRI\0699 Briefing Paper Ag2000.xls

98/99 99/00 00/01 01/02 02/03 03/04 04/05 05/06 06/07 07/08 08/09
Net ExportersAustralia Baseline 2.55 2.53 2.43 2.41 2.40 2.39 2.37 2.36 2.35 2.35 2.37 Agenda 2000 Scenario 2.55 2.53 2.43 2.42 2.41 2.40 2.39 2.38 2.37 2.37 2.38 Change 0.00 0.00 0.00 0.00 0.01 0.01 0.01 0.02 0.02 0.02 0.01 % Change 0.0% 0.0% 0.0% 0.2% 0.2% 0.4% 0.6% 0.8% 0.9% 0.8% 0.5%
Canada Baseline 1.59 1.18 1.04 1.00 1.04 1.11 1.18 1.27 1.37 1.47 1.58 Agenda 2000 Scenario 1.59 1.18 1.04 1.00 1.03 1.10 1.16 1.25 1.34 1.44 1.55 Change 0.00 0.00 0.00 0.00 -0.01 -0.01 -0.02 -0.03 -0.03 -0.03 -0.03 % Change 0.0% 0.0% 0.0% 0.0% -0.6% -1.3% -1.5% -2.1% -2.4% -2.2% -1.6%
Other Exporters Baseline 8.16 9.30 9.75 10.16 10.50 10.70 10.86 10.81 10.91 11.09 11.39 Agenda 2000 Scenario 8.16 9.25 9.75 10.24 10.65 10.85 11.15 11.41 11.51 11.84 12.21 Change 0.00 -0.05 0.00 0.08 0.14 0.16 0.29 0.60 0.60 0.74 0.82 % Change 0.0% -0.5% 0.0% 0.8% 1.4% 1.5% 2.7% 5.5% 5.5% 6.7% 7.2%
Net ImportersEastern Europe Baseline -0.04 -0.11 -0.09 -0.10 -0.12 -0.15 -0.18 -0.21 -0.24 -0.28 -0.32 Agenda 2000 Scenario -0.04 -0.11 -0.09 -0.10 -0.13 -0.17 -0.20 -0.23 -0.26 -0.29 -0.32 Change 0.00 0.00 0.00 0.00 -0.01 -0.01 -0.02 -0.02 -0.02 -0.01 -0.01 % Change 0.0% -0.4% -0.7% 3.4% 9.3% 7.0% 9.3% 8.0% 8.2% 2.6% 2.6%
Japan Baseline 1.40 1.36 1.33 1.32 1.31 1.31 1.26 1.24 1.23 1.22 1.19 Agenda 2000 Scenario 1.40 1.36 1.33 1.32 1.31 1.31 1.26 1.24 1.22 1.22 1.19 Change 0.00 0.00 0.00 0.00 0.00 0.00 0.00 0.00 0.00 0.00 0.00 % Change 0.0% 0.0% -0.1% 0.0% 0.2% 0.0% -0.2% -0.4% -0.3% -0.2% -0.1%
China Baseline 2.00 2.24 2.28 2.39 2.47 2.56 2.68 2.81 2.96 3.12 3.29 Agenda 2000 Scenario 2.00 2.24 2.28 2.39 2.47 2.56 2.68 2.82 2.97 3.14 3.31 Change 0.00 0.00 0.00 0.00 0.00 0.00 0.01 0.01 0.01 0.02 0.02 % Change 0.0% 0.0% 0.0% -0.1% -0.1% 0.0% 0.2% 0.4% 0.5% 0.6% 0.5%
Rest of World Baseline 8.94 9.52 9.71 9.96 10.28 10.48 10.65 10.61 10.69 10.86 11.17 Agenda 2000 Scenario 8.94 9.48 9.71 10.04 10.43 10.64 10.96 11.21 11.29 11.58 11.96 Change 0.00 -0.05 0.00 0.09 0.16 0.16 0.30 0.60 0.60 0.72 0.79 % Change 0.0% -0.5% 0.0% 0.9% 1.5% 1.5% 2.8% 5.7% 5.6% 6.7% 7.1%
Impacts of Agenda 2000 on World Barley Trade
(Million Metric Tons)
3 of 3 Trade Selected Countries I:\BHEMPE\FAPRI\0699 Briefing Paper Ag2000.xls

Impacts of Agenda 2000 on EU Wheat
98/99 99/00 00/01 01/02 02/03 03/04 04/05 05/06 06/07 07/08 08/09
Area Harvested Baseline 16.75 16.54 16.56 16.61 16.30 16.32 16.34 15.82 15.84 15.95 16.02 Agenda 2000 Scenario 16.75 16.54 16.57 16.65 16.72 16.73 16.74 16.76 16.76 16.77 16.80 Change 0.00 0.00 0.00 0.04 0.42 0.41 0.40 0.93 0.92 0.82 0.78 % Change 0.0% 0.00% 0.01% 0.23% 2.59% 2.54% 2.45% 5.90% 5.80% 5.15% 4.86%
Yield Baseline 6.12 5.72 5.81 5.88 5.96 6.03 6.11 6.19 6.26 6.35 6.42 Agenda 2000 Scenario 6.12 5.72 5.79 5.83 5.88 5.96 6.04 6.12 6.20 6.28 6.35 Change 0.00 0.00 -0.02 -0.05 -0.08 -0.07 -0.07 -0.07 -0.07 -0.08 -0.08 % Change 0.0% 0.00% -0.43% -0.87% -1.37% -1.19% -1.13% -1.15% -1.08% -1.22% -1.21%
Production Baseline 102.59 94.71 96.27 97.71 97.10 98.44 99.77 97.93 99.23 101.33 102.92 Agenda 2000 Scenario 102.59 94.71 95.87 97.08 98.25 99.74 101.06 102.52 103.86 105.25 106.61 Change 0.00 0.00 -0.40 -0.63 1.15 1.30 1.28 4.59 4.62 3.92 3.69 % Change 0.0% 0.00% -0.42% -0.64% 1.19% 1.32% 1.29% 4.69% 4.66% 3.87% 3.58%
Beginning Stocks Baseline 12.70 17.45 14.73 14.76 15.85 16.14 17.43 19.58 19.70 19.17 18.24 Agenda 2000 Scenario 12.70 17.45 14.73 14.34 13.75 13.35 13.09 12.82 12.76 12.70 12.65 Change 0.00 0.00 0.00 -0.41 -2.10 -2.79 -4.34 -6.77 -6.94 -6.47 -5.59 % Change 0.0% 0.00% 0.00% -2.80% -13.24% -17.29% -24.92% -34.56% -35.21% -33.77% -30.65%
Domestic Supply Baseline 115.29 112.16 111.00 112.47 112.95 114.58 117.21 117.52 118.93 120.50 121.16 Agenda 2000 Scenario 115.29 112.16 110.60 111.43 112.00 113.09 114.14 115.34 116.62 117.94 119.26 Change 0.00 0.00 -0.40 -1.04 -0.95 -1.49 -3.06 -2.18 -2.31 -2.56 -1.90 % Change 0.0% 0.00% -0.36% -0.93% -0.84% -1.30% -2.61% -1.85% -1.95% -2.12% -1.57%
Feed Use Baseline 37.00 37.04 37.23 37.58 37.75 38.06 38.46 38.60 38.67 38.89 39.13 Agenda 2000 Scenario 37.00 37.10 37.31 37.87 37.95 38.26 38.62 38.74 38.98 39.23 39.41 Change 0.00 0.05 0.08 0.29 0.20 0.20 0.16 0.14 0.31 0.34 0.28 % Change 0.0% 0.14% 0.22% 0.76% 0.52% 0.53% 0.41% 0.35% 0.81% 0.88% 0.71%
Food Use Baseline 45.60 45.67 45.72 45.75 45.76 45.80 45.87 45.92 45.93 45.97 46.00 Agenda 2000 Scenario 45.60 45.67 45.65 45.64 45.65 45.69 45.76 45.82 45.86 45.91 45.97 Change 0.00 0.00 -0.07 -0.11 -0.11 -0.11 -0.10 -0.10 -0.07 -0.06 -0.04 % Change 0.0% 0.00% -0.15% -0.24% -0.24% -0.23% -0.22% -0.22% -0.16% -0.12% -0.08%
Domestic Use Baseline 82.60 82.71 82.95 83.33 83.51 83.86 84.33 84.52 84.60 84.86 85.14 Agenda 2000 Scenario 82.60 82.76 82.96 83.50 83.60 83.95 84.38 84.56 84.84 85.14 85.37 Change 0.00 0.05 0.01 0.17 0.09 0.09 0.06 0.03 0.24 0.28 0.24 % Change 0.0% 0.06% 0.01% 0.21% 0.10% 0.11% 0.07% 0.04% 0.28% 0.34% 0.28%
Ending Stocks Baseline 17.45 14.73 14.76 15.85 16.14 17.43 19.58 19.70 19.17 18.24 15.40 Agenda 2000 Scenario 17.45 14.73 14.34 13.75 13.35 13.09 12.82 12.76 12.70 12.65 12.40 Change 0.00 0.00 -0.41 -2.10 -2.79 -4.34 -6.77 -6.94 -6.47 -5.59 -3.00 % Change 0.0% 0.00% -2.80% -13.24% -17.29% -24.92% -34.56% -35.21% -33.77% -30.65% -19.48%
Net Trade Baseline 15.24 14.72 13.29 13.29 13.29 13.29 13.29 13.29 15.16 17.40 20.62 Agenda 2000 Scenario 15.24 14.67 13.29 14.18 15.05 16.05 16.95 18.02 19.08 20.15 21.48 Change 0.00 -0.05 0.00 0.88 1.76 2.76 3.65 4.72 3.92 2.75 0.86 % Change 0.0% -0.35% 0.00% 6.65% 13.22% 20.75% 27.48% 35.53% 25.86% 15.80% 4.17%
Wheat Domestic Price Baseline 120.00 121.40 121.76 121.81 123.01 123.09 123.18 124.46 124.56 125.62 126.82 Agenda 2000 Scenario 120.00 121.40 113.49 107.79 109.82 110.91 112.77 114.01 115.51 116.65 118.98 Change 0.00 0.00 -8.27 -14.02 -13.19 -12.18 -10.41 -10.45 -9.05 -8.96 -7.83 % Change 0.00% 0.00% -6.79% -11.51% -10.73% -9.90% -8.45% -8.39% -7.27% -7.14% -6.18%
(Million Hectares)
(Metric Tons per Hectare)
(Million Metric Tons)
(Euro per Ton)
1 of 5 EU I:\BHEMPE\FAPRI\0699 Briefing Paper Ag2000.xls
Impacts of Agenda 2000 on EU Corn
98/99 99/00 00/01 01/02 02/03 03/04 04/05 05/06 06/07 07/08 08/09
Area Harvested Baseline 4.13 3.92 3.93 3.93 3.85 3.85 3.86 3.74 3.74 3.71 3.68 Agenda 2000 Scenario 4.13 3.92 3.93 3.91 3.91 3.89 3.88 3.87 3.85 3.83 3.80 Change 0.00 0.00 0.00 -0.02 0.06 0.04 0.02 0.13 0.11 0.12 0.12 % Change 0.0% 0.00% 0.00% -0.45% 1.43% 1.05% 0.61% 3.48% 3.03% 3.25% 3.21%
Yield Baseline 8.34 8.65 8.77 8.89 9.01 9.13 9.25 9.36 9.47 9.57 9.70 Agenda 2000 Scenario 8.34 8.65 8.69 8.75 8.84 8.93 9.02 9.12 9.21 9.31 9.40 Change 0.00 0.00 -0.07 -0.14 -0.17 -0.20 -0.22 -0.24 -0.26 -0.26 -0.30 % Change 0.0% 0.00% -0.83% -1.60% -1.88% -2.15% -2.41% -2.57% -2.72% -2.77% -3.11%
Production Baseline 34.40 33.93 34.44 34.92 34.70 35.18 35.66 34.97 35.39 35.54 35.75 Agenda 2000 Scenario 34.40 33.93 34.16 34.21 34.53 34.78 35.01 35.26 35.47 35.68 35.75 Change 0.00 0.00 -0.28 -0.71 -0.16 -0.40 -0.65 0.29 0.08 0.14 0.00 % Change 0.0% 0.00% -0.82% -2.04% -0.47% -1.12% -1.82% 0.82% 0.23% 0.40% 0.00%
Beginning Stocks Baseline 4.56 4.80 4.35 4.40 4.45 4.43 4.63 4.88 4.81 4.85 4.86 Agenda 2000 Scenario 4.56 4.80 4.35 4.16 3.86 3.84 3.83 3.74 3.73 3.67 3.64 Change 0.00 0.00 0.00 -0.24 -0.59 -0.59 -0.80 -1.14 -1.08 -1.18 -1.23 % Change 0.0% 0.00% 0.00% -5.55% -13.29% -13.30% -17.34% -23.37% -22.42% -24.28% -25.25%
Domestic Supply Baseline 38.96 38.73 38.79 39.32 39.15 39.61 40.28 39.85 40.20 40.39 40.61 Agenda 2000 Scenario 38.96 38.73 38.51 38.37 38.39 38.62 38.83 39.00 39.20 39.35 39.38 Change 0.00 0.00 -0.28 -0.96 -0.75 -0.98 -1.45 -0.85 -1.00 -1.04 -1.23 % Change 0.0% 0.00% -0.73% -2.43% -1.93% -2.49% -3.60% -2.14% -2.48% -2.57% -3.02%
Feed Use Baseline 28.00 28.36 28.35 28.45 28.42 28.50 28.65 28.61 28.83 28.94 29.06 Agenda 2000 Scenario 28.00 28.40 28.47 28.61 28.62 28.75 28.96 28.97 29.09 29.13 29.19 Change 0.00 0.04 0.12 0.15 0.21 0.26 0.31 0.36 0.26 0.19 0.14 % Change 0.0% 0.14% 0.42% 0.54% 0.73% 0.91% 1.09% 1.27% 0.88% 0.67% 0.47%
Food and Other Baseline 7.70 7.63 7.61 7.59 7.58 7.58 7.59 7.58 7.69 7.77 7.86 Agenda 2000 Scenario 7.70 7.63 7.63 7.61 7.62 7.62 7.65 7.65 7.71 7.77 7.84 Change 0.00 0.00 0.02 0.02 0.04 0.04 0.06 0.07 0.02 0.00 -0.01 % Change 0.0% 0.00% 0.29% 0.21% 0.47% 0.59% 0.75% 0.91% 0.23% -0.02% -0.15%
Domestic Use Baseline 35.70 36.00 35.96 36.05 36.00 36.08 36.24 36.19 36.52 36.71 36.91 Agenda 2000 Scenario 35.70 36.04 36.10 36.22 36.24 36.38 36.61 36.62 36.80 36.90 37.04 Change 0.00 0.04 0.14 0.17 0.24 0.30 0.37 0.43 0.27 0.19 0.13 % Change 0.0% 0.11% 0.39% 0.47% 0.67% 0.84% 1.02% 1.20% 0.75% 0.53% 0.34%
Ending Stocks Baseline 4.80 4.35 4.40 4.45 4.43 4.63 4.88 4.81 4.85 4.86 4.88 Agenda 2000 Scenario 4.80 4.35 4.16 3.86 3.84 3.83 3.74 3.73 3.67 3.64 3.49 Change 0.00 0.00 -0.24 -0.59 -0.59 -0.80 -1.14 -1.08 -1.18 -1.23 -1.39 % Change 0.0% 0.00% -5.55% -13.29% -13.30% -17.34% -23.37% -22.42% -24.28% -25.25% -28.50%
Net Trade Baseline -1.54 -1.62 -1.57 -1.18 -1.28 -1.10 -0.83 -1.15 -1.17 -1.18 -1.19 Agenda 2000 Scenario -1.54 -1.66 -1.75 -1.71 -1.69 -1.58 -1.51 -1.35 -1.27 -1.18 -1.15 Change 0.00 -0.04 -0.18 -0.53 -0.41 -0.49 -0.68 -0.21 -0.09 0.00 0.04 % Change 0.0% 2.47% 11.54% 45.47% 31.77% 44.19% 81.74% 18.01% 7.84% 0.08% -3.27%
Corn Domestic Price Baseline 120.30 121.89 121.99 122.18 122.85 122.91 122.99 123.77 123.86 123.88 124.02 Agenda 2000 Scenario 120.30 121.89 112.30 106.95 107.86 108.38 109.45 109.91 110.47 111.74 113.50 Change 0.00 0.00 -9.69 -15.23 -14.99 -14.53 -13.54 -13.86 -13.39 -12.14 -10.52 % Change 0.00% 0.00% -7.94% -12.47% -12.21% -11.82% -11.01% -11.20% -10.81% -9.80% -8.48%
(Metric Tons per Hectare)
(Million Metric Tons)
(Euro per Ton)
(Million Hectares)
2 of 5 EU I:\BHEMPE\FAPRI\0699 Briefing Paper Ag2000.xls
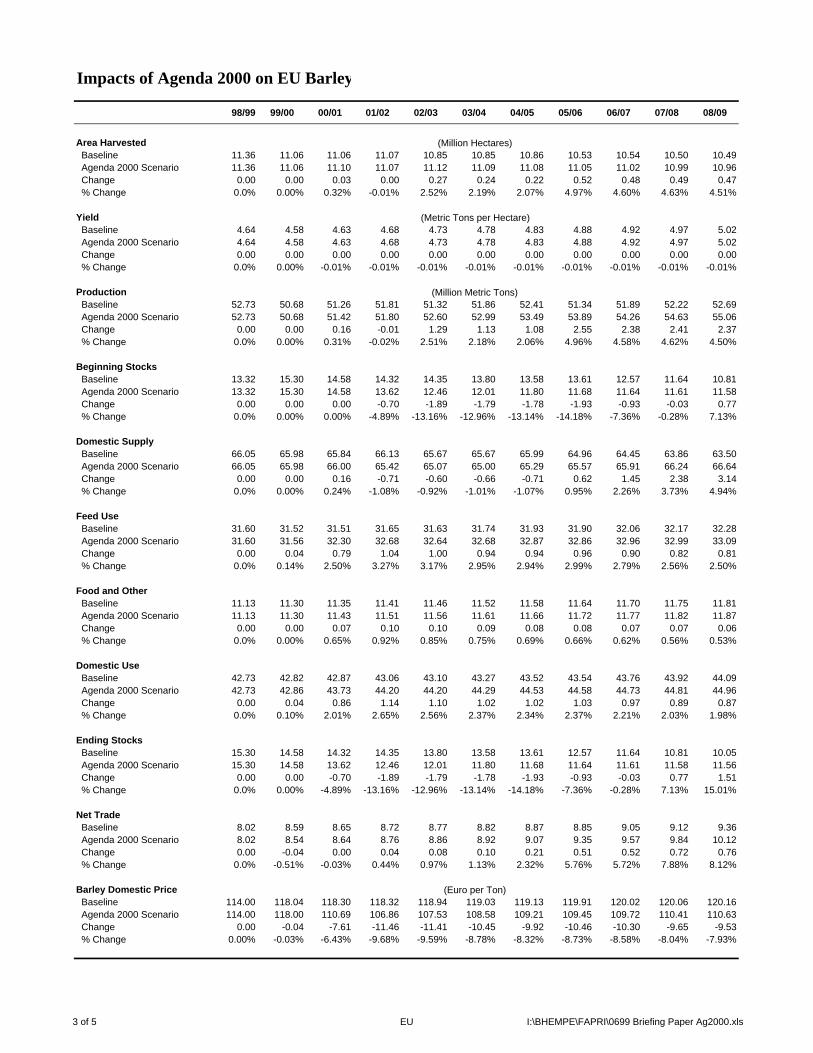
Impacts of Agenda 2000 on EU Barley
98/99 99/00 00/01 01/02 02/03 03/04 04/05 05/06 06/07 07/08 08/09
Area Harvested Baseline 11.36 11.06 11.06 11.07 10.85 10.85 10.86 10.53 10.54 10.50 10.49 Agenda 2000 Scenario 11.36 11.06 11.10 11.07 11.12 11.09 11.08 11.05 11.02 10.99 10.96 Change 0.00 0.00 0.03 0.00 0.27 0.24 0.22 0.52 0.48 0.49 0.47 % Change 0.0% 0.00% 0.32% -0.01% 2.52% 2.19% 2.07% 4.97% 4.60% 4.63% 4.51%
Yield Baseline 4.64 4.58 4.63 4.68 4.73 4.78 4.83 4.88 4.92 4.97 5.02 Agenda 2000 Scenario 4.64 4.58 4.63 4.68 4.73 4.78 4.83 4.88 4.92 4.97 5.02 Change 0.00 0.00 0.00 0.00 0.00 0.00 0.00 0.00 0.00 0.00 0.00 % Change 0.0% 0.00% -0.01% -0.01% -0.01% -0.01% -0.01% -0.01% -0.01% -0.01% -0.01%
Production Baseline 52.73 50.68 51.26 51.81 51.32 51.86 52.41 51.34 51.89 52.22 52.69 Agenda 2000 Scenario 52.73 50.68 51.42 51.80 52.60 52.99 53.49 53.89 54.26 54.63 55.06 Change 0.00 0.00 0.16 -0.01 1.29 1.13 1.08 2.55 2.38 2.41 2.37 % Change 0.0% 0.00% 0.31% -0.02% 2.51% 2.18% 2.06% 4.96% 4.58% 4.62% 4.50%
Beginning Stocks Baseline 13.32 15.30 14.58 14.32 14.35 13.80 13.58 13.61 12.57 11.64 10.81 Agenda 2000 Scenario 13.32 15.30 14.58 13.62 12.46 12.01 11.80 11.68 11.64 11.61 11.58 Change 0.00 0.00 0.00 -0.70 -1.89 -1.79 -1.78 -1.93 -0.93 -0.03 0.77 % Change 0.0% 0.00% 0.00% -4.89% -13.16% -12.96% -13.14% -14.18% -7.36% -0.28% 7.13%
Domestic Supply Baseline 66.05 65.98 65.84 66.13 65.67 65.67 65.99 64.96 64.45 63.86 63.50 Agenda 2000 Scenario 66.05 65.98 66.00 65.42 65.07 65.00 65.29 65.57 65.91 66.24 66.64 Change 0.00 0.00 0.16 -0.71 -0.60 -0.66 -0.71 0.62 1.45 2.38 3.14 % Change 0.0% 0.00% 0.24% -1.08% -0.92% -1.01% -1.07% 0.95% 2.26% 3.73% 4.94%
Feed Use Baseline 31.60 31.52 31.51 31.65 31.63 31.74 31.93 31.90 32.06 32.17 32.28 Agenda 2000 Scenario 31.60 31.56 32.30 32.68 32.64 32.68 32.87 32.86 32.96 32.99 33.09 Change 0.00 0.04 0.79 1.04 1.00 0.94 0.94 0.96 0.90 0.82 0.81 % Change 0.0% 0.14% 2.50% 3.27% 3.17% 2.95% 2.94% 2.99% 2.79% 2.56% 2.50%
Food and Other Baseline 11.13 11.30 11.35 11.41 11.46 11.52 11.58 11.64 11.70 11.75 11.81 Agenda 2000 Scenario 11.13 11.30 11.43 11.51 11.56 11.61 11.66 11.72 11.77 11.82 11.87 Change 0.00 0.00 0.07 0.10 0.10 0.09 0.08 0.08 0.07 0.07 0.06 % Change 0.0% 0.00% 0.65% 0.92% 0.85% 0.75% 0.69% 0.66% 0.62% 0.56% 0.53%
Domestic Use Baseline 42.73 42.82 42.87 43.06 43.10 43.27 43.52 43.54 43.76 43.92 44.09 Agenda 2000 Scenario 42.73 42.86 43.73 44.20 44.20 44.29 44.53 44.58 44.73 44.81 44.96 Change 0.00 0.04 0.86 1.14 1.10 1.02 1.02 1.03 0.97 0.89 0.87 % Change 0.0% 0.10% 2.01% 2.65% 2.56% 2.37% 2.34% 2.37% 2.21% 2.03% 1.98%
Ending Stocks Baseline 15.30 14.58 14.32 14.35 13.80 13.58 13.61 12.57 11.64 10.81 10.05 Agenda 2000 Scenario 15.30 14.58 13.62 12.46 12.01 11.80 11.68 11.64 11.61 11.58 11.56 Change 0.00 0.00 -0.70 -1.89 -1.79 -1.78 -1.93 -0.93 -0.03 0.77 1.51 % Change 0.0% 0.00% -4.89% -13.16% -12.96% -13.14% -14.18% -7.36% -0.28% 7.13% 15.01%
Net Trade Baseline 8.02 8.59 8.65 8.72 8.77 8.82 8.87 8.85 9.05 9.12 9.36 Agenda 2000 Scenario 8.02 8.54 8.64 8.76 8.86 8.92 9.07 9.35 9.57 9.84 10.12 Change 0.00 -0.04 0.00 0.04 0.08 0.10 0.21 0.51 0.52 0.72 0.76 % Change 0.0% -0.51% -0.03% 0.44% 0.97% 1.13% 2.32% 5.76% 5.72% 7.88% 8.12%
Barley Domestic Price Baseline 114.00 118.04 118.30 118.32 118.94 119.03 119.13 119.91 120.02 120.06 120.16 Agenda 2000 Scenario 114.00 118.00 110.69 106.86 107.53 108.58 109.21 109.45 109.72 110.41 110.63 Change 0.00 -0.04 -7.61 -11.46 -11.41 -10.45 -9.92 -10.46 -10.30 -9.65 -9.53 % Change 0.00% -0.03% -6.43% -9.68% -9.59% -8.78% -8.32% -8.73% -8.58% -8.04% -7.93%
(Million Metric Tons)
(Euro per Ton)
(Million Hectares)
(Metric Tons per Hectare)
3 of 5 EU I:\BHEMPE\FAPRI\0699 Briefing Paper Ag2000.xls
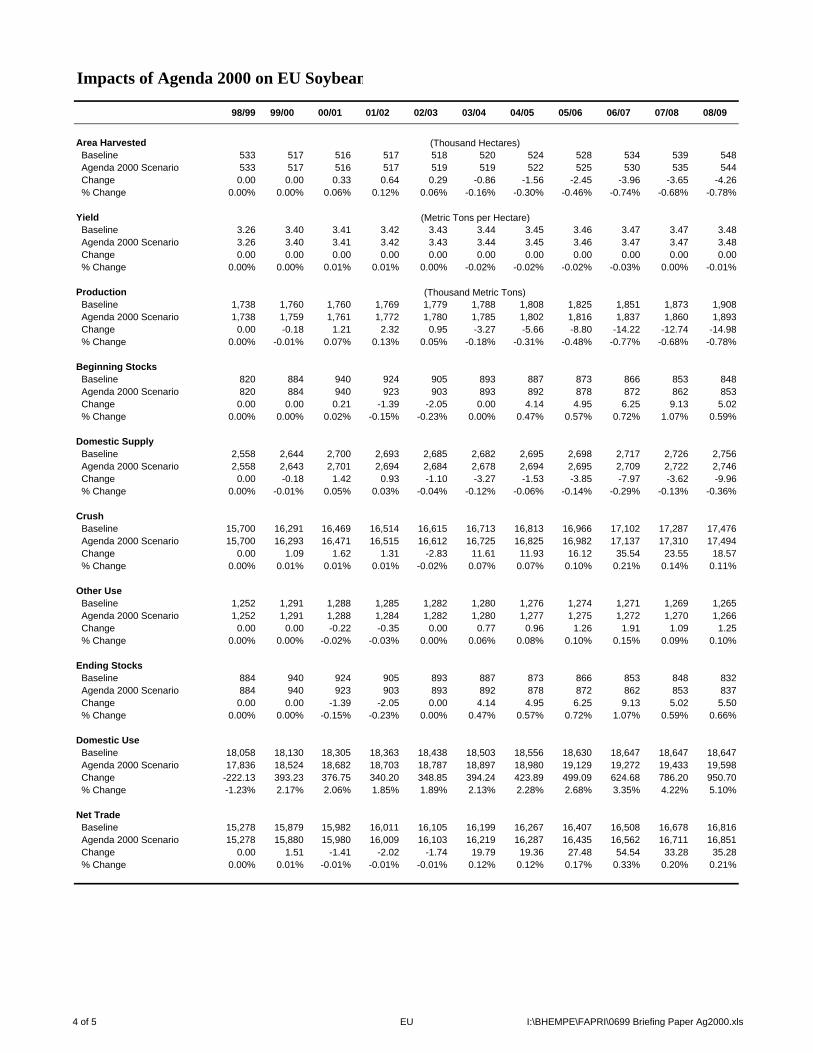
Impacts of Agenda 2000 on EU Soybean
98/99 99/00 00/01 01/02 02/03 03/04 04/05 05/06 06/07 07/08 08/09
Area Harvested Baseline 533 517 516 517 518 520 524 528 534 539 548 Agenda 2000 Scenario 533 517 516 517 519 519 522 525 530 535 544 Change 0.00 0.00 0.33 0.64 0.29 -0.86 -1.56 -2.45 -3.96 -3.65 -4.26 % Change 0.00% 0.00% 0.06% 0.12% 0.06% -0.16% -0.30% -0.46% -0.74% -0.68% -0.78%
Yield Baseline 3.26 3.40 3.41 3.42 3.43 3.44 3.45 3.46 3.47 3.47 3.48 Agenda 2000 Scenario 3.26 3.40 3.41 3.42 3.43 3.44 3.45 3.46 3.47 3.47 3.48 Change 0.00 0.00 0.00 0.00 0.00 0.00 0.00 0.00 0.00 0.00 0.00 % Change 0.00% 0.00% 0.01% 0.01% 0.00% -0.02% -0.02% -0.02% -0.03% 0.00% -0.01%
Production Baseline 1,738 1,760 1,760 1,769 1,779 1,788 1,808 1,825 1,851 1,873 1,908 Agenda 2000 Scenario 1,738 1,759 1,761 1,772 1,780 1,785 1,802 1,816 1,837 1,860 1,893 Change 0.00 -0.18 1.21 2.32 0.95 -3.27 -5.66 -8.80 -14.22 -12.74 -14.98 % Change 0.00% -0.01% 0.07% 0.13% 0.05% -0.18% -0.31% -0.48% -0.77% -0.68% -0.78%
Beginning Stocks Baseline 820 884 940 924 905 893 887 873 866 853 848 Agenda 2000 Scenario 820 884 940 923 903 893 892 878 872 862 853 Change 0.00 0.00 0.21 -1.39 -2.05 0.00 4.14 4.95 6.25 9.13 5.02 % Change 0.00% 0.00% 0.02% -0.15% -0.23% 0.00% 0.47% 0.57% 0.72% 1.07% 0.59%
Domestic Supply Baseline 2,558 2,644 2,700 2,693 2,685 2,682 2,695 2,698 2,717 2,726 2,756 Agenda 2000 Scenario 2,558 2,643 2,701 2,694 2,684 2,678 2,694 2,695 2,709 2,722 2,746 Change 0.00 -0.18 1.42 0.93 -1.10 -3.27 -1.53 -3.85 -7.97 -3.62 -9.96 % Change 0.00% -0.01% 0.05% 0.03% -0.04% -0.12% -0.06% -0.14% -0.29% -0.13% -0.36%
Crush Baseline 15,700 16,291 16,469 16,514 16,615 16,713 16,813 16,966 17,102 17,287 17,476 Agenda 2000 Scenario 15,700 16,293 16,471 16,515 16,612 16,725 16,825 16,982 17,137 17,310 17,494 Change 0.00 1.09 1.62 1.31 -2.83 11.61 11.93 16.12 35.54 23.55 18.57 % Change 0.00% 0.01% 0.01% 0.01% -0.02% 0.07% 0.07% 0.10% 0.21% 0.14% 0.11%
Other Use Baseline 1,252 1,291 1,288 1,285 1,282 1,280 1,276 1,274 1,271 1,269 1,265 Agenda 2000 Scenario 1,252 1,291 1,288 1,284 1,282 1,280 1,277 1,275 1,272 1,270 1,266 Change 0.00 0.00 -0.22 -0.35 0.00 0.77 0.96 1.26 1.91 1.09 1.25 % Change 0.00% 0.00% -0.02% -0.03% 0.00% 0.06% 0.08% 0.10% 0.15% 0.09% 0.10%
Ending Stocks Baseline 884 940 924 905 893 887 873 866 853 848 832 Agenda 2000 Scenario 884 940 923 903 893 892 878 872 862 853 837 Change 0.00 0.00 -1.39 -2.05 0.00 4.14 4.95 6.25 9.13 5.02 5.50 % Change 0.00% 0.00% -0.15% -0.23% 0.00% 0.47% 0.57% 0.72% 1.07% 0.59% 0.66%
Domestic Use Baseline 18,058 18,130 18,305 18,363 18,438 18,503 18,556 18,630 18,647 18,647 18,647 Agenda 2000 Scenario 17,836 18,524 18,682 18,703 18,787 18,897 18,980 19,129 19,272 19,433 19,598 Change -222.13 393.23 376.75 340.20 348.85 394.24 423.89 499.09 624.68 786.20 950.70 % Change -1.23% 2.17% 2.06% 1.85% 1.89% 2.13% 2.28% 2.68% 3.35% 4.22% 5.10%
Net Trade Baseline 15,278 15,879 15,982 16,011 16,105 16,199 16,267 16,407 16,508 16,678 16,816 Agenda 2000 Scenario 15,278 15,880 15,980 16,009 16,103 16,219 16,287 16,435 16,562 16,711 16,851 Change 0.00 1.51 -1.41 -2.02 -1.74 19.79 19.36 27.48 54.54 33.28 35.28 % Change 0.00% 0.01% -0.01% -0.01% -0.01% 0.12% 0.12% 0.17% 0.33% 0.20% 0.21%
(Thousand Hectares)
(Metric Tons per Hectare)
(Thousand Metric Tons)
4 of 5 EU I:\BHEMPE\FAPRI\0699 Briefing Paper Ag2000.xls

Impacts of Agenda 2000 on EU Rapeseed
98/99 99/00 00/01 01/02 02/03 03/04 04/05 05/06 06/07 07/08 08/09
Area Harvested Baseline 3,113 3,229 3,134 3,113 3,151 3,047 2,993 3,025 2,997 2,967 2,982 Agenda 2000 Scenario 3,113 3,204 3,082 3,050 3,012 2,962 2,923 2,880 2,866 2,855 2,877 Change 0.00 -25.01 -51.57 -62.57 -138.47 -85.33 -69.94 -144.16 -130.99 -111.96 -104.91 % Change 0.00% -0.77% -1.65% -2.01% -4.39% -2.80% -2.34% -4.77% -4.37% -3.77% -3.52%
Yield Baseline 3.05 3.06 3.08 3.10 3.12 3.14 3.16 3.17 3.19 3.21 3.23 Agenda 2000 Scenario 3.05 3.06 3.08 3.12 3.14 3.15 3.18 3.20 3.22 3.24 3.27 Change 0.00 0.00 0.01 0.01 0.01 0.02 0.02 0.02 0.02 0.03 0.04 % Change 0.00% -0.01% 0.19% 0.38% 0.48% 0.49% 0.59% 0.70% 0.73% 1.02% 1.16%
Production Baseline 9,492 9,877 9,648 9,662 9,843 9,559 9,453 9,598 9,573 9,516 9,640 Agenda 2000 Scenario 9,492 9,800 9,506 9,503 9,456 9,337 9,287 9,204 9,222 9,250 9,408 Change 0.00 -77.09 -141.07 -158.30 -387.61 -222.03 -165.96 -393.65 -351.43 -266.06 -231.28 % Change 0.00% -0.78% -1.46% -1.64% -3.94% -2.32% -1.76% -4.10% -3.67% -2.80% -2.40%
Beginning Stocks Baseline 114 112 132 130 120 112 105 96 88 79 72 Agenda 2000 Scenario 114 112 132 129 117 109 102 92 84 75 66 Change 0.00 0.00 0.05 -1.44 -2.64 -3.15 -3.17 -3.88 -4.54 -4.63 -6.68 % Change 0.00% 0.00% 0.04% -1.11% -2.20% -2.82% -3.02% -4.05% -5.14% -5.84% -9.23%
Domestic Supply Baseline 9,606 9,989 9,780 9,792 9,963 9,670 9,558 9,693 9,661 9,595 9,712 Agenda 2000 Scenario 9,606 9,912 9,639 9,632 9,573 9,445 9,388 9,296 9,305 9,325 9,474 Change 0.00 -77.09 -141.02 -159.74 -390.25 -225.18 -169.13 -397.53 -355.96 -270.68 -237.96 % Change 0.00% -0.77% -1.44% -1.63% -3.92% -2.33% -1.77% -4.10% -3.68% -2.82% -2.45%
Crush Baseline 8,646 8,991 8,847 8,887 8,995 8,869 8,828 9,001 9,039 9,062 9,234 Agenda 2000 Scenario 8,646 8,926 8,723 8,744 8,658 8,669 8,674 8,653 8,725 8,815 9,015 Change 0.00 -64.98 -124.45 -143.31 -337.32 -199.67 -153.96 -347.47 -314.61 -247.25 -219.46 % Change 0.00% -0.72% -1.41% -1.61% -3.75% -2.25% -1.74% -3.86% -3.48% -2.73% -2.38%
Other Use Baseline 736 788 801 816 834 854 877 904 934 968 1,007 Agenda 2000 Scenario 736 788 801 816 834 854 877 904 934 968 1,006 Change 0.00 0.00 -0.04 -0.09 -0.13 -0.15 -0.22 -0.30 -0.36 -0.60 -0.77 % Change 0.00% 0.00% -0.01% -0.01% -0.02% -0.02% -0.02% -0.03% -0.04% -0.06% -0.08%
Ending Stocks Baseline 112 132 130 120 112 105 96 88 79 72 62 Agenda 2000 Scenario 112 132 129 117 109 102 92 84 75 66 55 Change 0.00 0.05 -1.44 -2.64 -3.15 -3.17 -3.88 -4.54 -4.63 -6.68 -7.24 % Change 0.00% 0.04% -1.11% -2.20% -2.82% -3.02% -4.05% -5.14% -5.84% -9.23% -11.63%
Domestic Use Baseline 9,494 9,911 9,778 9,824 9,941 9,828 9,801 9,993 10,052 10,103 10,303 Agenda 2000 Scenario 9,494 9,846 9,652 9,678 9,600 9,625 9,643 9,641 9,733 9,848 10,076 Change 0.00 -64.93 -125.93 -146.05 -340.59 -202.99 -158.06 -352.30 -319.60 -254.53 -227.48 % Change 0.00% -0.66% -1.29% -1.49% -3.43% -2.07% -1.61% -3.53% -3.18% -2.52% -2.21%
Net Trade Baseline 112 77 1 -32 23 -158 -243 -300 -391 -507 -591 Agenda 2000 Scenario 112 65 -14 -46 -27 -180 -254 -345 -427 -524 -602 Change 0.00 -12.17 -15.09 -13.70 -49.65 -22.19 -11.07 -45.22 -36.37 -16.15 -10.48 % Change 0.00% -15.74% -1068% 42.33% -220% 14.07% 4.55% 15.08% 9.30% 3.18% 1.77%
(Thousand Metric Tons)
(Thousand Hectares)
(Metric Tons per Hectare)
5 of 5 EU I:\BHEMPE\FAPRI\0699 Briefing Paper Ag2000.xls

Impacts of Agenda 2000 on World Beef Trade
1999 2000 2001 2002 2003 2004 2005 2006 2007 2008
Net ExportersArgentina Baseline 310 353 392 428 452 461 447 439 435 440 Scenario 310 355 395 430 453 465 452 443 434 432 Change 0 2 2 2 1 4 5 4 -1 -8 % Change 0.00% 0.51% 0.61% 0.41% 0.17% 0.91% 1.13% 0.95% -0.18% -1.79%
Australia Baseline 1,188 1,172 1,156 1,148 1,137 1,133 1,135 1,139 1,145 1,149 Scenario 1,188 1,178 1,161 1,147 1,137 1,135 1,138 1,141 1,144 1,144 Change 0 5 5 -1 -1 2 3 2 -1 -5 % Change 0.00% 0.44% 0.45% -0.06% -0.06% 0.13% 0.28% 0.22% -0.11% -0.40%
Canada Baseline 126 123 147 178 204 215 222 231 247 254 Scenario 126 129 152 174 201 216 225 235 247 249 Change 0 7 5 -4 -3 1 3 4 0 -5 % Change 0.00% 5.29% 3.59% -2.16% -1.33% 0.36% 1.55% 1.70% 0.01% -1.92%
New Zealand Baseline 508 507 508 514 521 530 539 548 559 569 Scenario 507 508 509 513 520 529 538 548 558 568 Change 0 1 0 -1 -1 0 0 0 -1 -1 % Change 0.00% 0.22% 0.09% -0.20% -0.12% -0.07% -0.04% -0.06% -0.19% -0.23%
United States Baseline -249 -194 -124 -37 103 245 426 578 600 543 Scenario -249 -110 -45 -75 66 250 459 622 605 501 Change 0 84 79 -38 -37 5 33 43 6 -42 % Change 0.00% -43.46% -63.40% 100.87% -35.70% 1.92% 7.78% 7.47% 0.94% -7.74%
Net ImportersFormer Soviet Union Baseline 418 416 470 522 580 627 668 710 740 758 Scenario 418 413 466 524 583 629 668 709 741 761 Change 0 -4 -4 2 3 2 0 -1 1 3 % Change 0.00% -0.91% -0.82% 0.35% 0.52% 0.33% 0.00% -0.17% 0.14% 0.45%
Japan Baseline 928 904 901 907 954 1,019 1,088 1,149 1,172 1,188 Scenario 928 893 890 911 962 1,026 1,092 1,148 1,175 1,198 Change 0 -12 -12 4 8 8 4 -1 2 9 % Change 0.00% -1.30% -1.28% 0.40% 0.84% 0.75% 0.37% -0.08% 0.18% 0.79%
Mexico Baseline 235 262 276 287 300 308 314 320 319 325 Scenario 235 257 272 291 304 310 313 317 319 329 Change 0 -5 -4 3 4 1 -1 -3 0 4 % Change 0.00% -1.91% -1.55% 1.20% 1.32% 0.43% -0.47% -0.92% -0.02% 1.27%
Rest of World Baseline 784 758 735 721 707 699 704 722 718 673 Scenario 784 738 713 727 722 712 710 723 722 687 Change 0 -20 -21 6 14 13 7 0 4 14 % Change 0.00% -2.60% -2.91% 0.82% 2.03% 1.85% 0.97% 0.05% 0.59% 2.07%
(Thousand Metric Tons)
1 of 3 Livestock I:\BHEMPE\FAPRI\0699 Briefing Paper Ag2000.xls
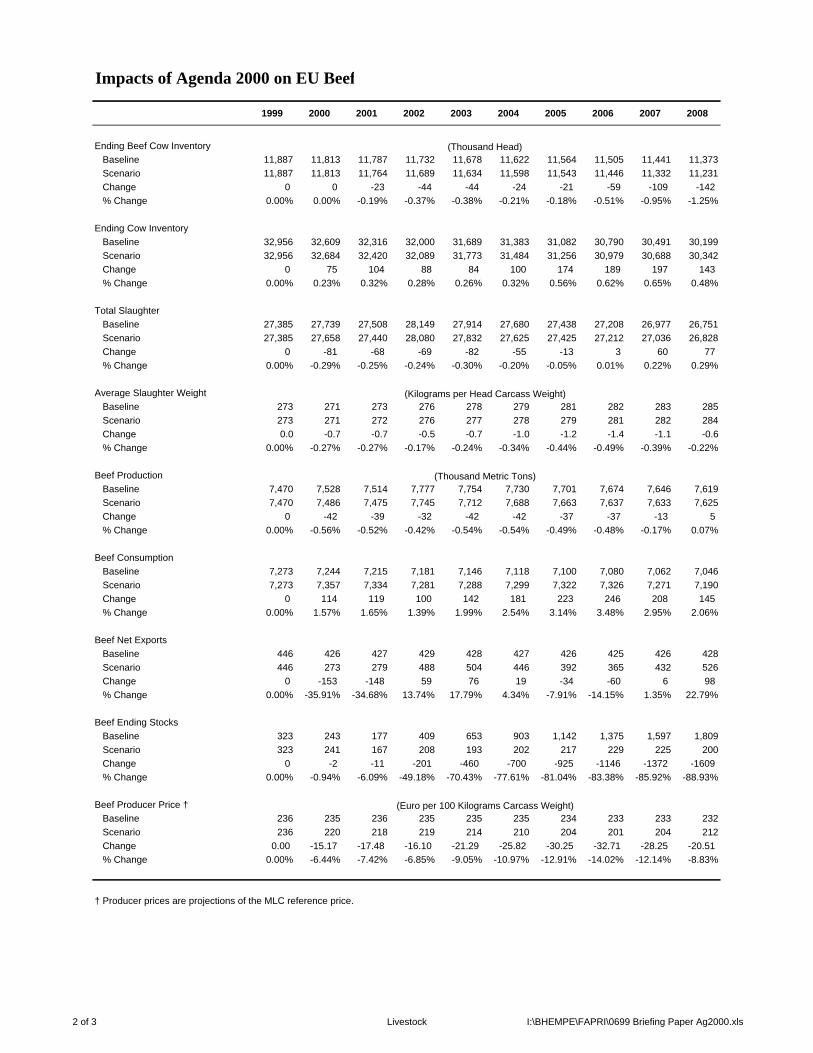
Impacts of Agenda 2000 on EU Beef
1999 2000 2001 2002 2003 2004 2005 2006 2007 2008
Ending Beef Cow Inventory Baseline 11,887 11,813 11,787 11,732 11,678 11,622 11,564 11,505 11,441 11,373 Scenario 11,887 11,813 11,764 11,689 11,634 11,598 11,543 11,446 11,332 11,231 Change 0 0 -23 -44 -44 -24 -21 -59 -109 -142 % Change 0.00% 0.00% -0.19% -0.37% -0.38% -0.21% -0.18% -0.51% -0.95% -1.25%
Ending Cow Inventory Baseline 32,956 32,609 32,316 32,000 31,689 31,383 31,082 30,790 30,491 30,199 Scenario 32,956 32,684 32,420 32,089 31,773 31,484 31,256 30,979 30,688 30,342 Change 0 75 104 88 84 100 174 189 197 143 % Change 0.00% 0.23% 0.32% 0.28% 0.26% 0.32% 0.56% 0.62% 0.65% 0.48%
Total Slaughter Baseline 27,385 27,739 27,508 28,149 27,914 27,680 27,438 27,208 26,977 26,751 Scenario 27,385 27,658 27,440 28,080 27,832 27,625 27,425 27,212 27,036 26,828 Change 0 -81 -68 -69 -82 -55 -13 3 60 77 % Change 0.00% -0.29% -0.25% -0.24% -0.30% -0.20% -0.05% 0.01% 0.22% 0.29%
Average Slaughter Weight Baseline 273 271 273 276 278 279 281 282 283 285 Scenario 273 271 272 276 277 278 279 281 282 284 Change 0.0 -0.7 -0.7 -0.5 -0.7 -1.0 -1.2 -1.4 -1.1 -0.6 % Change 0.00% -0.27% -0.27% -0.17% -0.24% -0.34% -0.44% -0.49% -0.39% -0.22%
Beef Production Baseline 7,470 7,528 7,514 7,777 7,754 7,730 7,701 7,674 7,646 7,619 Scenario 7,470 7,486 7,475 7,745 7,712 7,688 7,663 7,637 7,633 7,625 Change 0 -42 -39 -32 -42 -42 -37 -37 -13 5 % Change 0.00% -0.56% -0.52% -0.42% -0.54% -0.54% -0.49% -0.48% -0.17% 0.07%
Beef Consumption Baseline 7,273 7,244 7,215 7,181 7,146 7,118 7,100 7,080 7,062 7,046 Scenario 7,273 7,357 7,334 7,281 7,288 7,299 7,322 7,326 7,271 7,190 Change 0 114 119 100 142 181 223 246 208 145 % Change 0.00% 1.57% 1.65% 1.39% 1.99% 2.54% 3.14% 3.48% 2.95% 2.06%
Beef Net Exports Baseline 446 426 427 429 428 427 426 425 426 428 Scenario 446 273 279 488 504 446 392 365 432 526 Change 0 -153 -148 59 76 19 -34 -60 6 98 % Change 0.00% -35.91% -34.68% 13.74% 17.79% 4.34% -7.91% -14.15% 1.35% 22.79%
Beef Ending Stocks Baseline 323 243 177 409 653 903 1,142 1,375 1,597 1,809 Scenario 323 241 167 208 193 202 217 229 225 200 Change 0 -2 -11 -201 -460 -700 -925 -1146 -1372 -1609 % Change 0.00% -0.94% -6.09% -49.18% -70.43% -77.61% -81.04% -83.38% -85.92% -88.93%
Beef Producer Price † Baseline 236 235 236 235 235 235 234 233 233 232 Scenario 236 220 218 219 214 210 204 201 204 212 Change 0.00 -15.17 -17.48 -16.10 -21.29 -25.82 -30.25 -32.71 -28.25 -20.51 % Change 0.00% -6.44% -7.42% -6.85% -9.05% -10.97% -12.91% -14.02% -12.14% -8.83%
† Producer prices are projections of the MLC reference price.
(Thousand Head)
(Kilograms per Head Carcass Weight)
(Thousand Metric Tons)
(Euro per 100 Kilograms Carcass Weight)
2 of 3 Livestock I:\BHEMPE\FAPRI\0699 Briefing Paper Ag2000.xls

Impacts of Agenda 2000 on EU Livestock and Poultry
1999 2000 2001 2002 2003 2004 2005 2006 2007 2008
Pork Production Baseline 17,138 17,185 17,246 17,330 17,410 17,531 17,632 17,710 17,786 17,881 Scenario 17,138 17,183 17,289 17,401 17,480 17,600 17,692 17,765 17,841 17,937 Change 0 -3 43 72 70 70 61 55 55 56 % Change 0.00% -0.01% 0.25% 0.41% 0.40% 0.40% 0.34% 0.31% 0.31% 0.31%
Pork Consumption Baseline 16,058 16,105 16,165 16,262 16,394 16,485 16,571 16,671 16,774 16,859 Scenario 16,059 16,096 16,198 16,325 16,455 16,542 16,619 16,712 16,819 16,908 Change 0 -8 33 63 61 58 48 41 45 49 % Change 0.00% -0.05% 0.20% 0.39% 0.37% 0.35% 0.29% 0.25% 0.27% 0.29%
Broiler Production Baseline 6,458 6,556 6,636 6,700 6,763 6,834 6,902 6,966 7,034 7,109 Scenario 6,458 6,553 6,674 6,767 6,821 6,879 6,934 6,994 7,067 7,149 Change 0 -4 38 67 58 45 32 27 34 40 % Change 0.00% -0.06% 0.58% 1.00% 0.85% 0.66% 0.47% 0.39% 0.48% 0.56%
Broiler Consumption Baseline 5,927 6,056 6,145 6,220 6,292 6,373 6,452 6,527 6,603 6,683 Scenario 5,927 6,047 6,168 6,270 6,333 6,403 6,468 6,540 6,624 6,712 Change 0 -10 23 49 41 29 17 13 21 29 % Change 0.00% -0.16% 0.38% 0.79% 0.65% 0.46% 0.26% 0.19% 0.31% 0.43%
Sheepmeat Production Baseline 1,104 1,091 1,083 1,075 1,065 1,054 1,040 1,026 1,010 994 Scenario 1,104 1,090 1,079 1,068 1,057 1,043 1,029 1,013 997 982 Change 0 -1 -5 -7 -9 -10 -12 -13 -13 -12 % Change 0.00% -0.13% -0.43% -0.66% -0.82% -0.98% -1.13% -1.26% -1.30% -1.20%
Sheepmeat Consumption Baseline 1,311 1,307 1,308 1,313 1,320 1,327 1,336 1,344 1,351 1,362 Scenario 1,310 1,304 1,301 1,304 1,309 1,314 1,321 1,328 1,335 1,348 Change 0 -3 -6 -9 -11 -13 -15 -16 -16 -14 % Change 0.00% -0.22% -0.49% -0.67% -0.83% -0.97% -1.10% -1.19% -1.17% -1.02%
Pork Producer Price † Baseline 118 123 127 130 131 134 137 139 141 145 Scenario 118 121 123 125 125 128 131 133 135 139 Change 0.00 -1.43 -3.84 -5.19 -5.68 -6.13 -6.29 -6.40 -6.03 -5.23 % Change 0.00% -1.17% -3.02% -4.00% -4.34% -4.57% -4.59% -4.60% -4.26% -3.62%
Poultry Producer Price † Baseline 115 115 118 121 124 126 129 132 135 138 Scenario 115 114 114 115 118 120 123 126 129 133 Change 0.00 -1.38 -4.07 -5.71 -5.94 -5.91 -5.82 -6.00 -5.88 -5.27 % Change 0.00% -1.20% -3.45% -4.73% -4.80% -4.68% -4.51% -4.54% -4.36% -3.82%
Sheep Producer Price † Baseline 320 328 335 336 337 339 338 338 339 338 Scenario 320 324 329 332 331 333 332 332 335 336 Change 0.00 -4.31 -5.22 -4.53 -5.08 -5.50 -5.84 -5.90 -4.17 -1.95 % Change 0.00% -1.31% -1.56% -1.35% -1.51% -1.62% -1.73% -1.75% -1.23% -0.58%
† Producer prices are projections of the MLC reference price.
(Thousand Metric Tons)
(Euro per 100 Kilograms)
3 of 3 Livestock I:\BHEMPE\FAPRI\0699 Briefing Paper Ag2000.xls

Impacts of Agenda 2000 on EU Milk
1999 2000 2001 2002 2003 2004 2005 2006 2007 2008
Milk ProductionBaseline 120,530 120,449 120,405 120,376 120,360 120,350 120,337 120,309 120,282 120,259Agenda 2000 120,530 121,093 121,514 121,471 121,405 121,361 121,723 122,014 122,300 122,177
Change 0 644 1,109 1,095 1,044 1,011 1,386 1,706 2,018 1,918% Change 0.00% 0.53% 0.92% 0.91% 0.87% 0.84% 1.15% 1.42% 1.68% 1.59%
Prod. per CowBaseline 5,721 5,792 5,865 5,939 6,015 6,090 6,165 6,238 6,314 6,388Agenda 2000 5,721 5,802 5,883 5,954 6,028 6,103 6,175 6,247 6,318 6,393
Change 0.00 9.97 17.71 15.19 13.69 12.76 9.33 8.12 4.38 4.83% Change 0.00% 0.17% 0.30% 0.26% 0.23% 0.21% 0.15% 0.13% 0.07% 0.08%
Milk CowsBaseline 21,069 20,796 20,529 20,268 20,011 19,762 19,518 19,285 19,050 18,825Agenda 2000 21,069 20,871 20,656 20,400 20,139 19,886 19,713 19,533 19,356 19,111
Change 0.00 75.22 126.74 132.12 127.76 124.40 194.89 247.96 306.19 285.74% Change 0.00% 0.36% 0.62% 0.65% 0.64% 0.63% 1.00% 1.29% 1.61% 1.52%
Fluid Milk Cons.Baseline 32,441 32,367 32,271 32,150 32,026 31,895 31,763 31,626 31,485 31,347Agenda 2000 32,441 32,416 32,377 32,284 32,174 32,040 32,046 32,021 32,015 31,850
Change 0.00 48.92 105.63 134.06 148.87 145.17 282.87 395.57 530.25 502.77% Change 0.00% 0.15% 0.33% 0.42% 0.46% 0.46% 0.89% 1.25% 1.68% 1.60%
EU Milk PriceBaseline 29 29 29 30 30 30 30 31 31 31Agenda 2000 29 29 29 29 29 29 29 29 28 29
Change 0.00 -0.24 -0.52 -0.67 -0.76 -0.76 -1.51 -2.15 -2.94 -2.85% Change 0.00% -0.82% -1.79% -2.29% -2.56% -2.52% -4.96% -7.00% -9.48% -9.08%
(Thousand MT)
(Kilograms)
(Thousands)
(Thousand MT)
(Euro/100 kg)
1 of 6 Dairy

Impacts of Agenda 2000 on EU Butter and Cheese
1999 2000 2001 2002 2003 2004 2005 2006 2007 2008
Butter ProductionBaseline 1,750 1,758 1,757 1,756 1,755 1,754 1,752 1,750 1,748 1,745Agenda 2000 1,750 1,775 1,784 1,779 1,774 1,773 1,764 1,758 1,746 1,747
Change 0.00 16.93 26.46 22.80 19.29 19.01 11.94 7.99 -1.46 1.76% Change 0.00% 0.96% 1.51% 1.30% 1.10% 1.08% 0.68% 0.46% -0.08% 0.10%
Butter ConsumptionBaseline 1,649 1,641 1,639 1,638 1,635 1,633 1,629 1,626 1,622 1,618Agenda 2000 1,649 1,641 1,639 1,637 1,633 1,631 1,647 1,656 1,667 1,658
Change 0.00 -0.04 -0.29 -1.11 -2.26 -2.11 18.05 30.14 44.95 39.88% Change 0.00% 0.00% -0.02% -0.07% -0.14% -0.13% 1.11% 1.85% 2.77% 2.46%
Butter StocksBaseline 228 231 228 221 213 204 195 186 177 169Agenda 2000 228 240 248 245 238 229 201 171 135 118
Change 0.00 9.22 19.78 23.90 24.74 24.87 6.61 -14.48 -41.74 -51.30% Change 0.00% 3.99% 8.67% 10.80% 11.62% 12.20% 3.40% -7.80% -23.57% -30.37%
Butter ExportsBaseline 160 194 200 204 207 209 211 212 213 214Agenda 2000 160 201 216 224 228 230 223 211 194 186
Change 0.00 7.75 16.19 19.79 20.72 20.99 12.14 -1.06 -19.15 -28.56% Change 0.00% 4.00% 8.10% 9.70% 10.02% 10.05% 5.75% -0.50% -8.98% -13.34%
EU Butter PriceBaseline 353 356 357 358 360 362 364 366 367 369Agenda 2000 353 354 353 353 355 357 345 337 327 331
Change 0.00 -1.73 -3.73 -4.53 -4.71 -4.73 -18.54 -28.29 -40.22 -37.65% Change 0.00% -0.49% -1.05% -1.26% -1.31% -1.31% -5.10% -7.74% -10.95% -10.20%
Cheese ProductionBaseline 6,010 6,050 6,103 6,153 6,206 6,259 6,313 6,367 6,423 6,478Agenda 2000 6,010 6,076 6,153 6,210 6,266 6,317 6,424 6,516 6,619 6,654
Change 0.00 26.54 50.60 57.06 60.56 57.71 110.81 148.45 196.50 175.34% Change 0.00% 0.44% 0.83% 0.93% 0.98% 0.92% 1.76% 2.33% 3.06% 2.71%
Cheese ConsumptionBaseline 5,681 5,745 5,800 5,850 5,901 5,951 6,004 6,056 6,109 6,163Agenda 2000 5,681 5,763 5,838 5,897 5,953 6,003 6,091 6,176 6,268 6,317
Change 0.00 18.31 38.45 47.56 52.17 51.03 87.08 120.24 159.58 154.50% Change 0.00% 0.32% 0.66% 0.81% 0.88% 0.86% 1.45% 1.99% 2.61% 2.51%
Cheese StocksBaseline 1,332 1,334 1,333 1,331 1,329 1,328 1,326 1,324 1,322 1,320Agenda 2000 1,332 1,339 1,345 1,346 1,346 1,343 1,353 1,361 1,372 1,368
Change 0.00 5.76 12.10 14.91 16.30 15.92 27.14 37.45 49.69 47.99% Change 0.00% 0.43% 0.91% 1.12% 1.23% 1.20% 2.05% 2.83% 3.76% 3.64%
Cheese ExportsBaseline 427 419 419 420 422 425 426 428 431 433Agenda 2000 427 421 424 427 429 432 439 446 456 455
Change 0.00 2.47 5.80 6.69 7.00 7.06 12.51 17.90 24.68 22.55% Change 0.00% 0.59% 1.39% 1.59% 1.66% 1.66% 2.93% 4.18% 5.73% 5.21%
EU Cheese PriceBaseline 469 470 474 478 483 489 494 499 504 510Agenda 2000 469 466 465 468 471 477 473 470 465 471
Change 0.00 -3.93 -8.40 -10.57 -11.82 -11.78 -20.51 -28.89 -39.12 -38.65% Change 0.00% -0.84% -1.77% -2.21% -2.45% -2.41% -4.15% -5.79% -7.76% -7.58%
(Euro/100 kg)
(Euro/100 kg)
(Thousand MT)
(Thousand MT)
2 of 6 Dairy

Impacts of Agenda 2000 on EU Milk Powder
1999 2000 2001 2002 2003 2004 2005 2006 2007 2008
SMP ProductionBaseline 1,086 1,088 1,073 1,057 1,041 1,026 1,009 992 974 956Agenda 2000 1,086 1,114 1,111 1,086 1,062 1,046 1,001 965 915 908
Change 0.00 25.84 37.62 28.33 20.37 20.50 -8.17 -26.97 -59.15 -47.90% Change 0.00% 2.37% 3.51% 2.68% 1.96% 2.00% -0.81% -2.72% -6.07% -5.01%
SMP ConsumptionBaseline 894 888 880 871 862 845 829 813 797 781Agenda 2000 894 890 886 881 874 857 846 836 828 810
Change 0.00 2.11 6.15 9.82 12.39 11.86 17.35 23.00 30.79 28.80% Change 0.00% 0.24% 0.70% 1.13% 1.44% 1.40% 2.09% 2.83% 3.86% 3.69%
SMP StocksBaseline 209 216 215 208 199 195 193 191 189 186Agenda 2000 209 234 264 276 270 265 225 177 129 111
Change 0.00 17.78 49.26 67.77 70.19 69.45 32.22 -14.41 -59.96 -75.07% Change 0.00% 8.23% 22.90% 32.61% 35.21% 35.55% 16.67% -7.53% -31.77% -40.39%
SMP ExportsBaseline 265 273 273 273 267 264 261 260 258 256Agenda 2000 265 279 273 273 273 273 273 256 214 195
Change 0.00 5.94 0.00 0.00 5.56 9.40 11.71 -3.34 -44.38 -61.59% Change 0.00% 2.18% 0.00% 0.00% 2.08% 3.56% 4.48% -1.29% -17.18% -24.02%
EU SMP PriceBaseline 206 207 209 211 214 216 219 221 224 226Agenda 2000 206 206 205 204 205 208 205 202 198 201
Change 0.00 -1.47 -4.33 -6.89 -8.72 -8.52 -13.81 -18.97 -25.81 -24.79% Change 0.00% -0.71% -2.07% -3.26% -4.08% -3.94% -6.31% -8.58% -11.54% -10.96%
WMP ProductionBaseline 1,032 1,002 991 991 990 988 987 985 983 981Agenda 2000 1,032 1,003 996 996 995 993 997 1,002 1,011 1,009
Change 0.00 1.54 4.76 5.55 5.41 4.85 10.06 16.66 27.25 27.16% Change 0.00% 0.15% 0.48% 0.56% 0.55% 0.49% 1.02% 1.69% 2.77% 2.77%
WMP ExportsBaseline 485 452 440 438 436 434 431 429 427 424Agenda 2000 485 453 444 443 440 438 440 443 451 449
Change 0.00 1.19 4.06 4.69 4.46 3.91 8.41 14.43 24.37 24.45% Change 0.00% 0.26% 0.92% 1.07% 1.02% 0.90% 1.95% 3.36% 5.71% 5.76%
EU WMP PriceBaseline 258 254 255 258 260 263 266 269 272 274Agenda 2000 258 251 249 251 253 256 252 250 246 250
Change 0.00 -2.69 -5.48 -6.88 -7.77 -7.72 -13.93 -19.14 -25.32 -24.31% Change 0.00% -1.06% -2.15% -2.67% -2.98% -2.93% -5.24% -7.12% -9.32% -8.86%
(Euro/100 kg)
(Euro/100 kg)
(Thousand Metric Tons)
(Thousand Metric Tons)
3 of 6 Dairy

Impacts of Agenda 2000 on World Cheese Markets
1999 2000 2001 2002 2003 2004 2005 2006 2007 2008
EU Net ExportsBaseline 316 304 304 305 307 310 311 313 316 318Agenda 2000 316 306 309 312 314 317 324 331 341 340
Change 0.00 2.47 5.80 6.69 7.00 7.06 12.51 17.90 24.68 22.55% Change 0.00% 0.81% 1.91% 2.19% 2.28% 2.28% 4.02% 5.72% 7.81% 7.10%
New Zealand Net ExportsBaseline 216 237 244 252 260 270 280 290 302 313Agenda 2000 216 237 244 252 260 271 281 290 298 307
Change 0.00 0.18 -0.40 -0.35 0.21 0.89 0.98 -0.56 -4.32 -5.75% Change 0.00% 0.08% -0.17% -0.14% 0.08% 0.33% 0.35% -0.19% -1.43% -1.84%
Australia Net ExportsBaseline 121 130 137 140 144 149 154 158 163 168Agenda 2000 121 131 138 141 145 150 155 158 158 160
Change 0.00 0.59 0.51 0.48 0.81 1.31 1.09 -0.68 -4.89 -7.85% Change 0.00% 0.45% 0.38% 0.34% 0.56% 0.88% 0.71% -0.43% -2.99% -4.68%
Argentina Net ExportsBaseline 21 28 32 35 37 40 41 41 42 43Agenda 2000 21 27 31 33 35 39 40 40 41 41
Change 0.00 -0.58 -1.17 -1.54 -1.47 -1.01 -0.93 -0.79 -0.92 -1.09% Change 0.02% -2.11% -3.69% -4.46% -3.99% -2.55% -2.27% -1.91% -2.18% -2.57%
Russia Net ImportsBaseline 230 243 259 268 276 285 288 285 286 282Agenda 2000 230 243 261 270 277 286 291 288 285 276
Change 0.00 0.71 1.82 2.00 0.93 1.28 3.12 3.32 -0.23 -5.95% Change 0.00% 0.29% 0.70% 0.75% 0.34% 0.45% 1.08% 1.16% -0.08% -2.11%
Japan Net ImportsBaseline 192 196 204 214 225 238 251 264 278 292Agenda 2000 192 197 204 214 226 238 251 265 279 294
Change 0.00 0.07 0.13 0.23 0.34 0.35 0.49 0.69 0.89 1.17% Change 0.00% 0.03% 0.06% 0.11% 0.15% 0.15% 0.20% 0.26% 0.32% 0.40%
U.S. Net ImportsBaseline 115 117 117 117 118 118 118 118 119 119Agenda 2000 115 117 117 117 118 118 118 118 119 119
Change 0.00 0.00 0.00 0.00 0.00 0.00 0.00 0.00 0.00 0.00% Change 0.00% 0.00% 0.00% 0.00% 0.00% 0.00% 0.00% 0.00% 0.00% 0.00%
Rest of World Net ImportsBaseline 150 145 141 142 144 146 149 154 156 160Agenda 2000 150 145 141 143 146 148 152 158 164 172
Change 0.00 0.15 0.39 1.03 1.56 1.41 2.53 4.56 8.00 11.19% Change 0.00% 0.10% 0.28% 0.73% 1.08% 0.96% 1.69% 2.97% 5.11% 6.98%
Cheese, FOB N.Eur.Baseline 2,316 2,351 2,436 2,443 2,448 2,463 2,469 2,471 2,485 2,488Agenda 2000 2,316 2,346 2,430 2,431 2,432 2,450 2,447 2,444 2,451 2,446
Change 0.00 -4.47 -6.56 -11.78 -15.58 -13.84 -21.79 -27.41 -33.72 -42.34% Change 0.00% -0.19% -0.27% -0.48% -0.64% -0.56% -0.88% -1.11% -1.36% -1.70%
(Thousand MT)
(U.S. Dollar per MT)
4 of 6 Dairy

Impacts of Agenda 2000 on World Butter Markets
1999 2000 2001 2002 2003 2004 2005 2006 2007 2008
EU Net ExportsBaseline 80 115 121 125 128 130 132 133 134 135Agenda 2000 80 122 137 145 149 151 144 132 115 107
Change 0.00 7.75 16.19 19.79 20.72 20.99 12.14 -1.06 -19.15 -28.56% Change 0.00% 6.76% 13.39% 15.83% 16.20% 16.17% 9.19% -0.79% -14.26% -21.14%
New Zealand Net ExportsBaseline 322 327 331 335 337 340 342 345 348 351Agenda 2000 322 326 330 334 336 338 342 347 353 357
Change 0.00 -0.83 -0.77 -0.87 -1.13 -1.25 -0.67 1.18 4.83 6.16% Change 0.00% -0.25% -0.23% -0.26% -0.33% -0.37% -0.19% 0.34% 1.39% 1.75%
Australia Net ExportsBaseline 104 104 105 108 111 114 117 120 124 127Agenda 2000 104 103 105 108 111 114 118 122 127 131
Change 0.00 -0.49 -0.33 -0.22 -0.22 -0.10 0.36 1.24 2.91 3.44% Change 0.00% -0.47% -0.31% -0.20% -0.20% -0.08% 0.31% 1.03% 2.35% 2.70%
Argentina Net ExportsBaseline 5 7 8 9 10 10 11 11 11 11Agenda 2000 5 7 8 9 9 10 10 11 13 13
Change 0.00 -0.32 -0.34 -0.41 -0.51 -0.56 -0.32 0.43 1.87 2.37% Change 0.04% -4.57% -4.10% -4.38% -5.22% -5.50% -3.00% 3.95% 17.03% 21.46%
Russia Net ImportsBaseline 175 189 199 207 213 219 225 228 227 223Agenda 2000 175 190 201 210 215 221 226 228 225 219
Change 0.00 1.03 2.25 2.34 1.99 1.92 1.05 0.04 -1.71 -3.27% Change 0.00% 0.54% 1.13% 1.13% 0.93% 0.88% 0.47% 0.02% -0.75% -1.47%
Ukraine Net ExportsBaseline 54 51 51 53 53 54 54 54 53 52Agenda 2000 54 50 51 52 52 53 54 54 54 54
Change 0.00 -0.40 -0.78 -0.86 -0.92 -1.02 -0.61 -0.01 0.83 1.27% Change 0.00% -0.78% -1.52% -1.63% -1.72% -1.90% -1.13% -0.03% 1.57% 2.42%
U.S. Net ExportsBaseline -7 -8 -4 -5 -2 0 1 3 5 6Agenda 2000 -7 -8 -4 -5 -2 0 1 3 5 6
Change 0.00 0.00 0.00 0.00 0.00 0.00 0.00 0.00 0.00 0.00% Change 0.00% 0.00% 0.00% 0.00% 0.00% 0.00% 0.00% 0.00% 0.00% 0.00%
Rest of World Net ImportsBaseline 338 354 362 364 365 366 366 369 376 386Agenda 2000 338 356 369 375 376 377 373 371 374 381
Change 0.00 2.49 7.45 10.23 11.06 11.08 6.66 1.65 -2.32 -5.05% Change 0.00% 0.71% 2.06% 2.81% 3.03% 3.03% 1.82% 0.45% -0.62% -1.31%
Butter, FOB N.Eur.Baseline 1,798 1,761 1,778 1,801 1,826 1,848 1,875 1,886 1,882 1,875Agenda 2000 1,798 1,749 1,746 1,765 1,791 1,815 1,864 1,888 1,890 1,887
Change 0.00 -12.07 -31.82 -35.96 -34.45 -32.62 -11.87 1.98 7.61 11.61% Change 0.00% -0.69% -1.79% -2.00% -1.89% -1.77% -0.63% 0.11% 0.40% 0.62%
(Thousand MT)
(U.S. Dollar per MT)
5 of 6 Dairy

Impacts of Agenda 2000 on World SMP Markets
1999 2000 2001 2002 2003 2004 2005 2006 2007 2008
EU Net ExportsBaseline 186 194 194 194 188 185 182 181 179 177Agenda 2000 186 200 194 194 194 194 194 177 135 116
Change 0.00 5.94 0.00 0.00 5.56 9.40 11.71 -3.34 -44.38 -61.59% Change 0.00% 3.06% 0.00% 0.00% 2.95% 5.09% 6.42% -1.85% -24.74% -34.71%
New Zealand Net ExportsBaseline 211 225 237 248 257 266 275 284 293 302Agenda 2000 211 224 236 247 255 264 273 286 301 313
Change 0.00 -1.31 -0.90 -1.04 -1.62 -2.00 -1.28 1.96 8.77 11.22% Change 0.00% -0.58% -0.38% -0.42% -0.63% -0.75% -0.47% 0.69% 3.00% 3.72%
Australia Net ExportsBaseline 195 200 207 216 225 233 242 251 260 269Agenda 2000 195 199 206 215 224 233 242 253 267 278
Change 0.00 -1.10 -0.54 -0.37 -0.58 -0.50 0.14 2.28 6.90 8.60% Change 0.00% -0.55% -0.26% -0.17% -0.26% -0.22% 0.06% 0.91% 2.65% 3.19%
Poland Net ExportsBaseline 95 94 91 94 99 102 106 109 112 115Agenda 2000 95 94 91 94 99 102 105 109 113 117
Change 0.00 -0.34 0.09 0.44 0.06 -0.47 -0.93 -0.31 1.34 2.13% Change 0.00% -0.36% 0.10% 0.46% 0.06% -0.46% -0.88% -0.28% 1.20% 1.85%
Mexico Net ImportsBaseline 132 134 130 131 134 137 141 145 150 154Agenda 2000 132 134 130 131 135 138 143 146 148 151
Change 0.00 0.43 0.04 0.32 0.79 1.00 1.42 0.52 -1.95 -2.70% Change 0.00% 0.32% 0.03% 0.24% 0.59% 0.73% 1.00% 0.36% -1.30% -1.76%
Brazil Net ImportsBaseline 41 46 43 42 43 44 47 49 53 56Agenda 2000 41 46 43 42 43 45 47 48 46 48
Change 0.00 0.71 0.25 0.30 0.74 1.02 0.56 -1.65 -6.38 -7.87% Change -0.01% 1.55% 0.58% 0.72% 1.75% 2.31% 1.19% -3.35% -12.12% -14.00%
U.S. Net ExportsBaseline 120 116 88 69 68 68 68 67 67 67Agenda 2000 120 116 88 69 68 68 68 67 67 67
Change 0.00 0.00 0.00 0.00 0.00 0.00 0.00 0.00 0.00 0.00% Change 0.00% 0.00% 0.00% 0.00% 0.00% 0.00% 0.00% 0.00% 0.00% 0.00%
Rest of World Net ImportsBaseline 73 78 73 70 69 68 68 68 68 67Agenda 2000 73 79 73 70 69 69 71 70 64 60
Change 0.00 0.46 -0.41 -0.51 0.26 0.97 2.25 1.36 -3.62 -6.83% Change 0.00% 0.59% -0.55% -0.72% 0.37% 1.43% 3.30% 1.99% -5.34% -10.17%
SMP, FOB N.Eur.Baseline 1,260 1,289 1,413 1,460 1,486 1,518 1,540 1,568 1,604 1,640Agenda 2000 1,260 1,281 1,418 1,460 1,475 1,501 1,509 1,557 1,657 1,711
Change 0.00 -8.14 4.53 0.28 -11.19 -16.90 -30.68 -11.04 52.89 70.62% Change 0.00% -0.63% 0.32% 0.02% -0.75% -1.11% -1.99% -0.70% 3.30% 4.31%
(Thousand MT)
(U.S. Dollar per MT)
6 of 6 Dairy