analysis of subsidence using terrasar-x data: murcia case study
TRANSCRIPT
Engineering Geology 116 (2010) 284–295
Contents lists available at ScienceDirect
Engineering Geology
j ourna l homepage: www.e lsev ie r.com/ locate /enggeo
Analysis of subsidence using TerraSAR-X data: Murcia case study
Gerardo Herrera a,⁎, Roberto Tomás b, Daniel Monells c, Giuseppe Centolanza c, Jordi J. Mallorquí c,Fernando Vicente d, Victor D. Navarro d, Juan M. Lopez-Sanchez d, Margarita Sanabria a,Miguel Cano b, Joaquín Mulas a
a Área de Investigación en Peligrosidad y Riesgos Geológicos, Departamento de Investigación y Prospectiva Geocientífica, Instituto Geológico y Minero de España (IGME),Ministerio de Ciencia y Tecnología, c/ Alenza 1, E-28003 Madrid, Spainb Departamento de Ingeniería de la Construcción, Obras Públicas e Infraestructura Urbana, Escuela Politécnica Superior, Universidad de Alicante P.O. Box 99, E-03080 Alicante, Spainc Departament de Teoria del Senyal i Comunicacions, Universitat Politècnica de Catalunya, c/Jordi Girona, 1-3, Ed. D-3, E-08034, Barcelona, Spaind Departamento de Física, Ingeniería de Sistemas y Teoría de la Señal (DFISTS), Escuela Politécnica Superior, Universidad de Alicante, P.O. Box 99, E-03080 Alicante, Spain
⁎ Corresponding author.E-mail addresses: [email protected] (G. Herrera), ro
[email protected] (J.J. Mallorquí), [email protected]@igme.es (J. Mulas).
0013-7952/$ – see front matter © 2010 Elsevier B.V. Adoi:10.1016/j.enggeo.2010.09.010
a b s t r a c t
a r t i c l e i n f oArticle history:Received 9 March 2010Received in revised form 10 August 2010Accepted 17 September 2010Available online 27 September 2010
Keywords:SubsidenceSARRadar interferometryDeformationBuildings and InfrastructureMonitoring
This paper presents an analysis of the performance of the Coherent Pixel Technique for urban subsidencemonitoring using TerraSAR-X data. Repeated observations for the period comprised between July 2008 andSeptember 2009 have been used. For this purpose the city of Murcia has been selected as a test-site because itis affected by subsidence due to groundwater exploitation. The obtained results are compared with thoseobtained from ERS/ENVISAT data belonging to the same period and validated with pre-existing information.Subsidence data reveal average rates of subsidence for the whole area up to −5 mm/year with local valuesthat reach −35 mm/year. These results are analyzed with respect to the main factors that control subsidencemechanisms: the thickness of the compressible layer, the presence of pumping wells, and the water tablevariation. Finally a local analysis of several buildings and infrastructures is presented. Therefore the usefulnessof X-band radar technology, not only to improve the knowledge of this kind of regional phenomenon, but alsoto study its effects on local areas such as buildings and infrastructures is demonstrated.
[email protected] (R. Tomás),a.es (J.M. Lopez-Sanchez),
ll rights reserved.
© 2010 Elsevier B.V. All rights reserved.
1. Introduction
Advanced remote sensing techniques based on satellite radar datahave become a powerful method to detect and monitor slow groundsurface deformations at a low cost. Synthetic Aperture Radar (SAR)images acquired by ERS-1, ERS-2 and ENVISAT C-band satellites of theEuropean Space Agency (ESA) provide a wide coverage of an area upto 100 by 100 km in a single image, an acceptable spatial resolution of20 by 4 m (ground range×azimuth) and the availability of a widehistorical archive of SAR images acquired since 1991. The CosmoS-kyMed and TerraSAR-X missions, launched in 2007 by the ItalianSpace Agency and the German Aerospace Centre (DLR), respectively,have improved the spatial resolution of the acquired SAR images up to1.6 by 1.9 m with a coverage about 30 by 30 km in stripmap mode.Another important advantage of these satellites is that the acquisitionfrequency of SAR images has been reduced, e.g., 11 days in the case ofTerraSAR-X compared to 35 days in the case of ERS and ENVISATsatellites. Standard differential interferometry (DInSAR) methodscompare two SAR images acquired in different moments over the
same area permitting to detect ground surface deformations thatoccurred between the acquisition dates of both images, but withmanylimitations due to temporal and spatial decorrelation, atmosphericartifacts, etc. These limitations have been partially resolved by thePersistent Scatterer Interferometry techniques (PSI) that make use oflarge sets of SAR images acquired in different moments over the samearea, permitting to detect deformation zones and to observe thetemporal evolution of the displacement of every detected groundtarget with amillimetric precision and high spatial resolution (Ferrettiet al., 2000; Berardino et al., 2002; Arnaud et al., 2003; Mora et al.,2003; Werner et al., 2003; Hooper et al., 2004).
Subsidence has occurred in themetropolitan area of Murcia City (SESpain) as a result of soil consolidation due to piezometric level depletioncaused by excessive pumping of groundwater. The study area is part ofSegura River valley located in the oriental sector of the Betic Cordillera.Permian and Triassic deformed materials corresponding to the InternalZones of the Betic Cordillera make up the basement. The basin fillingcomprises Upper Miocene to Quaternary sediment fluvial deposits.Younger sediments are highly compressible and the most problematicones from a geotechnical point of view (Mulas et al., 2003). Theyconstitute an aquifer system that is divided in two units (Cerón andPulido, 1996; Aragón et al., 2004). The shallow aquifer reaches 30 mbelow the surface, and it is formed by recent clay, silt and sand facies.The deep aquifer, located below, is composed of a sequence of gravels
285G. Herrera et al. / Engineering Geology 116 (2010) 284–295
and sands alternating with confined silt and clay layers. Subsidence istriggered by the excessive water pumping of the first layer of the deepaquifer (Mulas et al., 2003). In fact a piezometric level decline between5and 15 m was measured on this layer during recent drought periods:1980–1983, 1993–1995 and 2005–2008. After the second droughtperiod, ground subsidence was triggered causing damages in buildingsand other structures that were documented by Martínez et al. (2004)with anestimated cost of 50million euros, generating a significant socialimpact. As a consequence, a permanentmonitoring has been carried outsince then, by using an extensometer network since 2001 and alsothrough the application of different PSI techniques (Tomás et al., 2005,2010; Herrera et al., 2009a,b).
This work presents an analysis of the performance of the CoherentPixel Technique for urban subsidence monitoring using TerraSAR-Xdata. The geological and geotechnical setting of the study area isintroduced in Section 2. Then Coherent Pixel Technique processingstrategy is presented as well as the different satellite radar datasetsand the retrieved ground deformation measurements. In Section 4 wecompare X-band results with several conditioning factors, a triggeringfactor (the piezometric level), and the measurements from anextensometric network. Finally a local detailed structural damageanalysis of two buildings and one infrastructure is presented.
2. Description of the study area
The City of Murcia occupies the flood plain of the Segura River (SWto NE), also known as the Vega Media, which is located in the orientalsector of the Betic Cordillera (SE Spain). A compressive stress field hasacted since the Upper Miocene and has led to the development of abasin bounded by active faults in which progressively youngersediments have been deposited (Figure 1). The basement is madeup by old Permian and Triassic deformedmaterials that correspond tothe Internal Zones of the Betic Cordillera. The basin fill comprisesrecent sediments deposited by Segura and Guadelentin rivers(Holocene at ground surface, Pleistocene and Pliocene at somedepth). At the ground surface, recent continental (meander, channel,oxbow lakes, flood plain, alluvial fans, etc.) sediments are found. Siltsand clays are abundant in flood plain and oxbow deposits, while sandis common in channel areas and in the alluvial fans formed in thereliefs that surround the valley. These recent sediments, 3 to 30 mthick, are moderate to highly compressible, and represent the mostproblematic unit from a geotechnical point of view (Mulas et al.,2003).
Thematerials that are filling the basin constitute an aquifer systemthat can be divided in two units, a shallow aquifer and a deep aquifer(Cerón and Pulido, 1996; Aragón et al., 2004). The deep aquifer islocated below the first 30 m and is composed of a sequence of gravelsand sands alternating with marls, clay and silts (Pleistocene toPliocene materials). This unit is characterized by high horizontal andvertical hydraulic conductivities (10–100 m/day and 1–50 m/day,respectively). The upper part of this unit is the most exploited level asa ground water resource, producing significant piezometric variationsalong drought periods. The materials of the deep aquifer show lowcompressibility values and for these reason they represent thegeotechnical substratum of the zone, being used as the support levelfor deep foundations. The shallow aquifer or aquitard comprises thefirst 30 m below the surface and is formed by recent clay, silt andsandy facies (Figure 1). These materials show very low and variablepermeability values (from 8.20×10⁻¹¹ to 6.24×10⁻⁸ m/s). Theyconstitute a layer of medium to soft sediments, susceptible to sufferconsolidation due to variations (increase) of effective stresses actingon them. Previous works have studied the consolidation of these softsediments due to ground water level depletion in the drought periodsthat occurred in the region of Murcia (Mulas et al., 2003; Martínezet al., 2004; Tomás et al., 2005, 2010; Herrera et al., 2009a,b).
From a geotechnical point of view the standard geotechnicalprofile of the Vega Media of the Segura flood plain is constituted by(see cross section in Figure 1 and Table 1): a) anthropic fillings with aheterogeneous and variable composition that reach maximumthicknesses up to 15 m; b) a compressible (Cc varying from 0.124 to0.139) clayey and silty layer (CL, ML, CL-ML or CH) with an averagethickness of 11.8 m whose hardness increases notably at some depthsand sites; c) a sandy layer (SC and SM)with a 1.7 m thickness and lowdeformability (average Cc equals to 0.081); d) and a gravel layer (GCand GW) where deep foundations are usually embedded constitutingthe geotechnical substratum of the deep foundations constructed inthe area.
3. The Coherent Pixels Technique (CPT)
In this study, we have made use of the Coherent Pixels Technique(CPT) algorithm (Mora et al., 2003), a PSI technique that allows toisolate from a stack of interferometric phases the complete deforma-tion evolution, the error of the DEM used and the contribution of theatmospheric artifacts. CPT processing is divided into two main steps,corresponding to the extraction of both the linear and non-linearcomponents of ground surface deformation. Firstly, the retrieval of thelinear terms includes the estimation of both the mean deformationvelocity and the DEM error. They are calculated by adjusting a modelfunction to the interferometric data only over those pixels of the scenethat are coherent or, in other words, that show a stable electromag-netic response along time. The selection of coherent pixels can bemade following either the coherence or the amplitude stabilitycriterion. This second approach usually offers the benefit of increasingthe density of measurement points in urban areas as it detectsdeterministic targets like those induced by man-made structures. Theformer is also suited to non-urban areas where most of the targets aredeterministic. The estimation of the coherence requires a multilook ofthe interferograms that reduces its spatial resolution. The non-linearterms are estimated applying a set of spatio-temporal filters thatextract the contributions of the atmospheric artifacts and the low andhigh resolution components of the non-linear deformation. Theretrieval of the deformation maps from SAR imagery is a complexprocess involving several steps: image focusing from the raw data,image co-registration and filtering for the generation of theinterferograms, proper calculation of satellite orbits and cancellationof the topography in the interferograms and, finally, the DInSARprocessing itself previously described. In all cases, the larger thenumber of images, the more precise the results are for both linear andnon-linear estimates. A detailed description of the whole algorithmcan be consulted in Blanco et al. (2008) (Table 2).
On one hand, the results presented in this work have beenobtained with 39 TerraSAR-X images acquired during the temporalinterval comprised from 28/06/2008 to 25/11/2009. On the otherhand, 12 ERS/ENVISAT images covering the period from 28/06/2008to 13/06/2009 have been used for comparison purposes. From thedataset of 39 TerraSAR-X images, interferograms have been generatedwith spatial baselines ranging from 7 m to 295 m. The temporalbaselines range from 11 days up to 286 days. A multilook of 3×3(range×azimuth) has been used and the coherence threshold foraccepting or rejecting a multilooked pixel has been set to 0.7, whichprovides a good compromise between pixels density and reliability.Only 12 C-band SAR images have been used due to the limitedperformances of the ERS-2 old sensor. In fact, the large spatialbaselines and the varying Doppler centroids of this sensor preventmost of the SAR images to be useful for interferometric applications.The generated interferograms present temporal decorrelation rangingfrom 3.6 m up to 203 m, while the temporal baselines range from35 days up to 350 days. The multilook applied has been 3×15(range×azimuth) and the coherence threshold has been set to 0.45.The external DEM used to cancel out the topographic component of
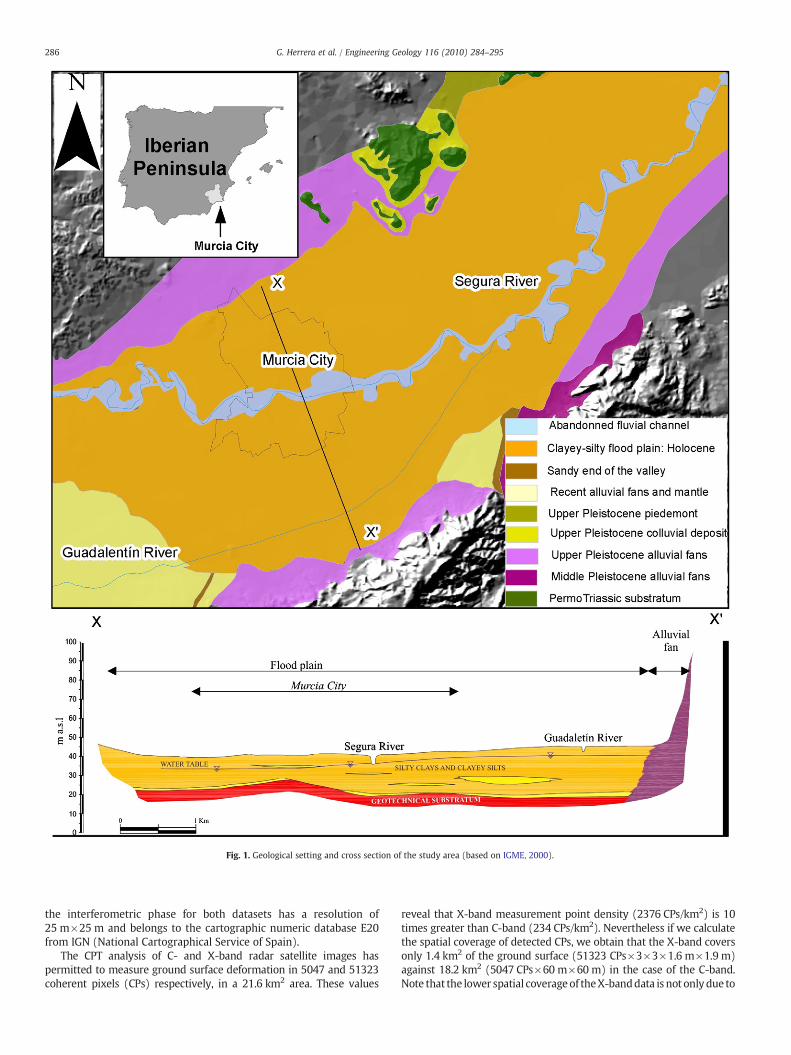
Fig. 1. Geological setting and cross section of the study area (based on IGME, 2000).
286 G. Herrera et al. / Engineering Geology 116 (2010) 284–295
the interferometric phase for both datasets has a resolution of25 m×25 m and belongs to the cartographic numeric database E20from IGN (National Cartographical Service of Spain).
The CPT analysis of C- and X-band radar satellite images haspermitted to measure ground surface deformation in 5047 and 51323coherent pixels (CPs) respectively, in a 21.6 km2 area. These values
reveal that X-band measurement point density (2376 CPs/km2) is 10times greater than C-band (234 CPs/km2). Nevertheless if we calculatethe spatial coverage of detected CPs, we obtain that the X-band coversonly 1.4 km2 of the ground surface (51323 CPs×3×3×1.6 m×1.9 m)against 18.2 km2 (5047 CPs×60 m×60 m) in the case of the C-band.Note that the lower spatial coverageof theX-banddata is not only due to
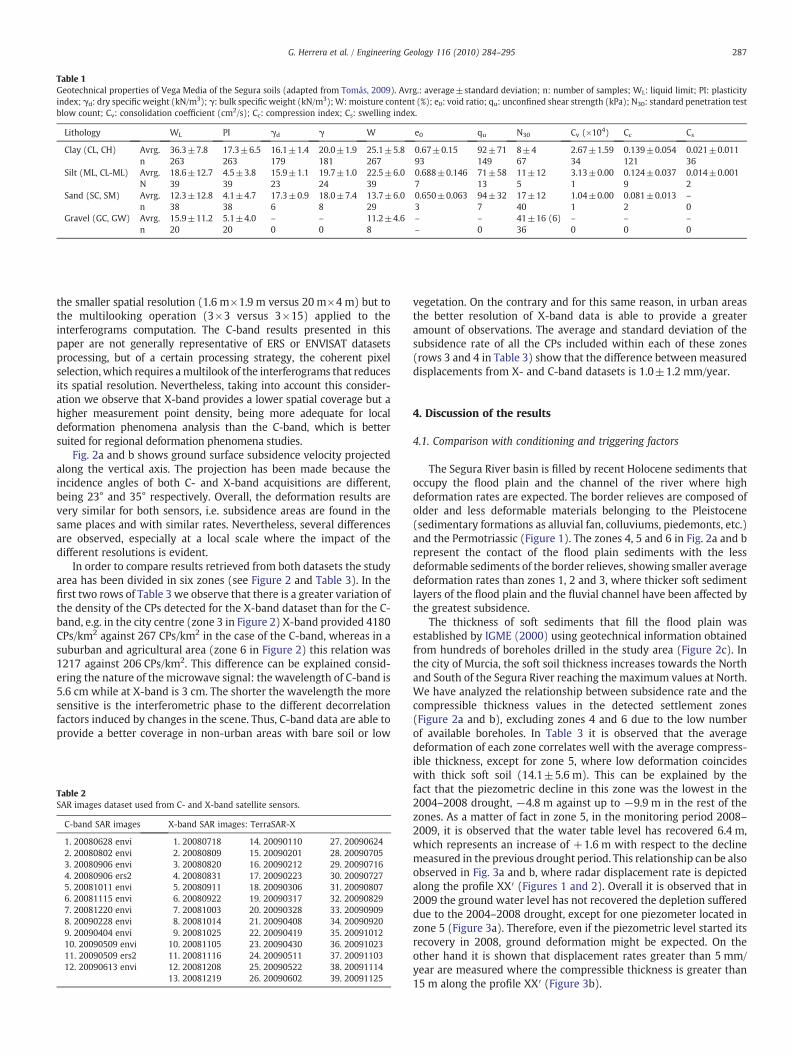
Table 1Geotechnical properties of Vega Media of the Segura soils (adapted from Tomás, 2009). Avrg.: average±standard deviation; n: number of samples; WL: liquid limit; PI: plasticityindex; γd: dry specific weight (kN/m3); γ: bulk specific weight (kN/m3);W:moisture content (%); e0: void ratio; qu: unconfined shear strength (kPa); N30: standard penetration testblow count; Cv: consolidation coefficient (cm2/s); Cc: compression index; Cs: swelling index.
Lithology WL PI γd γ W e0 qu N30 Cv (×104) Cc Cs
Clay (CL, CH) Avrg. 36.3±7.8 17.3±6.5 16.1±1.4 20.0±1.9 25.1±5.8 0.67±0.15 92±71 8±4 2.67±1.59 0.139±0.054 0.021±0.011n 263 263 179 181 267 93 149 67 34 121 36
Silt (ML, CL-ML) Avrg. 18.6±12.7 4.5±3.8 15.9±1.1 19.7±1.0 22.5±6.0 0.688±0.146 71±58 11±12 3.13±0.00 0.124±0.037 0.014±0.001N 39 39 23 24 39 7 13 5 1 9 2
Sand (SC, SM) Avrg. 12.3±12.8 4.1±4.7 17.3±0.9 18.0±7.4 13.7±6.0 0.650±0.063 94±32 17±12 1.04±0.00 0.081±0.013 –
n 38 38 6 8 29 3 7 40 1 2 0Gravel (GC, GW) Avrg. 15.9±11.2 5.1±4.0 – – 11.2±4.6 – – 41±16 (6) – – –
n 20 20 0 0 8 – 0 36 0 0 0
287G. Herrera et al. / Engineering Geology 116 (2010) 284–295
the smaller spatial resolution (1.6 m×1.9 m versus 20 m×4 m) but tothe multilooking operation (3×3 versus 3×15) applied to theinterferograms computation. The C-band results presented in thispaper are not generally representative of ERS or ENVISAT datasetsprocessing, but of a certain processing strategy, the coherent pixelselection,which requires amultilook of the interferograms that reducesits spatial resolution. Nevertheless, taking into account this consider-ation we observe that X-band provides a lower spatial coverage but ahigher measurement point density, being more adequate for localdeformation phenomena analysis than the C-band, which is bettersuited for regional deformation phenomena studies.
Fig. 2a and b shows ground surface subsidence velocity projectedalong the vertical axis. The projection has been made because theincidence angles of both C- and X-band acquisitions are different,being 23° and 35° respectively. Overall, the deformation results arevery similar for both sensors, i.e. subsidence areas are found in thesame places and with similar rates. Nevertheless, several differencesare observed, especially at a local scale where the impact of thedifferent resolutions is evident.
In order to compare results retrieved from both datasets the studyarea has been divided in six zones (see Figure 2 and Table 3). In thefirst two rows of Table 3 we observe that there is a greater variation ofthe density of the CPs detected for the X-band dataset than for the C-band, e.g. in the city centre (zone 3 in Figure 2) X-band provided 4180CPs/km2 against 267 CPs/km2 in the case of the C-band, whereas in asuburban and agricultural area (zone 6 in Figure 2) this relation was1217 against 206 CPs/km2. This difference can be explained consid-ering the nature of the microwave signal: the wavelength of C-band is5.6 cm while at X-band is 3 cm. The shorter the wavelength the moresensitive is the interferometric phase to the different decorrelationfactors induced by changes in the scene. Thus, C-band data are able toprovide a better coverage in non-urban areas with bare soil or low
Table 2SAR images dataset used from C- and X-band satellite sensors.
C-band SAR images X-band SAR images: TerraSAR-X
1. 20080628 envi 1. 20080718 14. 20090110 27. 200906242. 20080802 envi 2. 20080809 15. 20090201 28. 200907053. 20080906 envi 3. 20080820 16. 20090212 29. 200907164. 20080906 ers2 4. 20080831 17. 20090223 30. 200907275. 20081011 envi 5. 20080911 18. 20090306 31. 200908076. 20081115 envi 6. 20080922 19. 20090317 32. 200908297. 20081220 envi 7. 20081003 20. 20090328 33. 200909098. 20090228 envi 8. 20081014 21. 20090408 34. 200909209. 20090404 envi 9. 20081025 22. 20090419 35. 2009101210. 20090509 envi 10. 20081105 23. 20090430 36. 2009102311. 20090509 ers2 11. 20081116 24. 20090511 37. 2009110312. 20090613 envi 12. 20081208 25. 20090522 38. 20091114
13. 20081219 26. 20090602 39. 20091125
vegetation. On the contrary and for this same reason, in urban areasthe better resolution of X-band data is able to provide a greateramount of observations. The average and standard deviation of thesubsidence rate of all the CPs included within each of these zones(rows 3 and 4 in Table 3) show that the difference between measureddisplacements from X- and C-band datasets is 1.0±1.2 mm/year.
4. Discussion of the results
4.1. Comparison with conditioning and triggering factors
The Segura River basin is filled by recent Holocene sediments thatoccupy the flood plain and the channel of the river where highdeformation rates are expected. The border relieves are composed ofolder and less deformable materials belonging to the Pleistocene(sedimentary formations as alluvial fan, colluviums, piedemonts, etc.)and the Permotriassic (Figure 1). The zones 4, 5 and 6 in Fig. 2a and brepresent the contact of the flood plain sediments with the lessdeformable sediments of the border relieves, showing smaller averagedeformation rates than zones 1, 2 and 3, where thicker soft sedimentlayers of the flood plain and the fluvial channel have been affected bythe greatest subsidence.
The thickness of soft sediments that fill the flood plain wasestablished by IGME (2000) using geotechnical information obtainedfrom hundreds of boreholes drilled in the study area (Figure 2c). Inthe city of Murcia, the soft soil thickness increases towards the Northand South of the Segura River reaching the maximum values at North.We have analyzed the relationship between subsidence rate and thecompressible thickness values in the detected settlement zones(Figure 2a and b), excluding zones 4 and 6 due to the low numberof available boreholes. In Table 3 it is observed that the averagedeformation of each zone correlates well with the average compress-ible thickness, except for zone 5, where low deformation coincideswith thick soft soil (14.1±5.6 m). This can be explained by thefact that the piezometric decline in this zone was the lowest in the2004–2008 drought, −4.8 m against up to −9.9 m in the rest of thezones. As a matter of fact in zone 5, in the monitoring period 2008–2009, it is observed that the water table level has recovered 6.4 m,which represents an increase of +1.6 m with respect to the declinemeasured in the previous drought period. This relationship can be alsoobserved in Fig. 3a and b, where radar displacement rate is depictedalong the profile XX′ (Figures 1 and 2). Overall it is observed that in2009 the ground water level has not recovered the depletion suffereddue to the 2004–2008 drought, except for one piezometer located inzone 5 (Figure 3a). Therefore, even if the piezometric level started itsrecovery in 2008, ground deformation might be expected. On theother hand it is shown that displacement rates greater than 5 mm/year are measured where the compressible thickness is greater than15 m along the profile XX′ (Figure 3b).
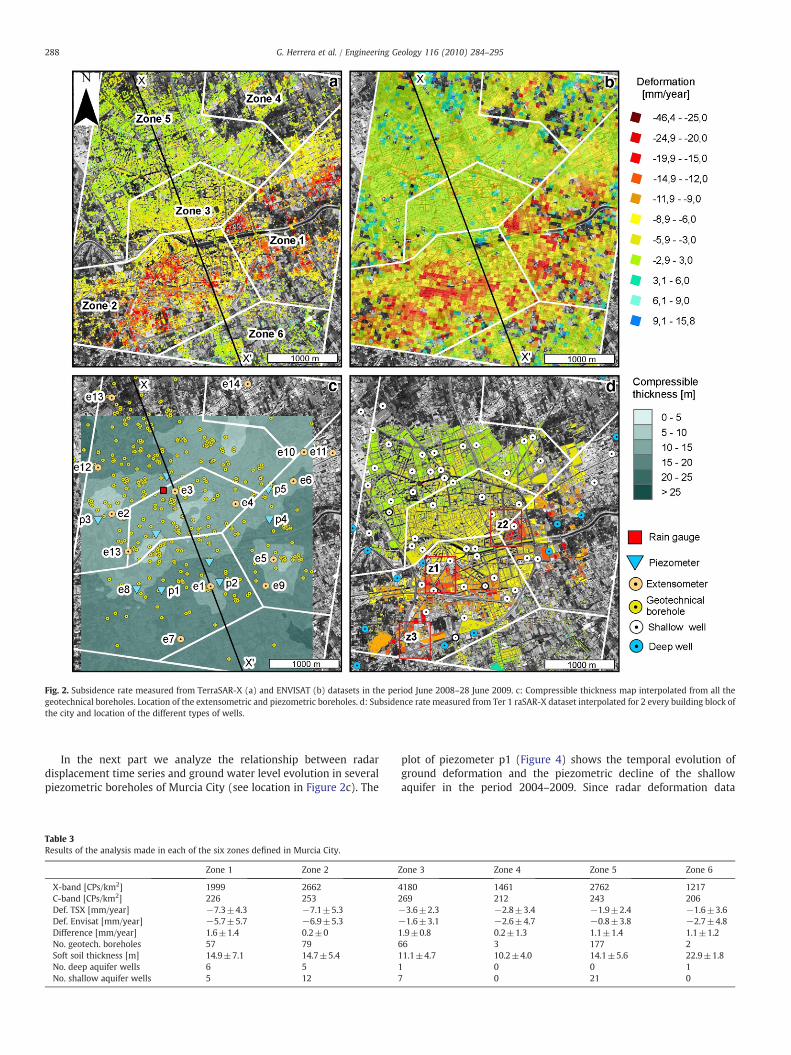
Fig. 2. Subsidence rate measured from TerraSAR-X (a) and ENVISAT (b) datasets in the period June 2008–28 June 2009. c: Compressible thickness map interpolated from all thegeotechnical boreholes. Location of the extensometric and piezometric boreholes. d: Subsidence rate measured from Ter 1 raSAR-X dataset interpolated for 2 every building block ofthe city and location of the different types of wells.
288 G. Herrera et al. / Engineering Geology 116 (2010) 284–295
In the next part we analyze the relationship between radardisplacement time series and ground water level evolution in severalpiezometric boreholes of Murcia City (see location in Figure 2c). The
Table 3Results of the analysis made in each of the six zones defined in Murcia City.
Zone 1 Zone 2
X-band [CPs/km2] 1999 2662C-band [CPs/km2] 226 253Def. TSX [mm/year] −7.3±4.3 −7.1±5.3Def. Envisat [mm/year] −5.7±5.7 −6.9±5.3Difference [mm/year] 1.6±1.4 0.2±0No. geotech. boreholes 57 79Soft soil thickness [m] 14.9±7.1 14.7±5.4No. deep aquifer wells 6 5No. shallow aquifer wells 5 12
plot of piezometer p1 (Figure 4) shows the temporal evolution ofground deformation and the piezometric decline of the shallowaquifer in the period 2004–2009. Since radar deformation data
Zone 3 Zone 4 Zone 5 Zone 6
4180 1461 2762 1217269 212 243 206−3.6±2.3 −2.8±3.4 −1.9±2.4 −1.6±3.6−1.6±3.1 −2.6±4.7 −0.8±3.8 −2.7±4.81.9±0.8 0.2±1.3 1.1±1.4 1.1±1.266 3 177 211.1±4.7 10.2±4.0 14.1±5.6 22.9±1.81 0 0 17 0 21 0
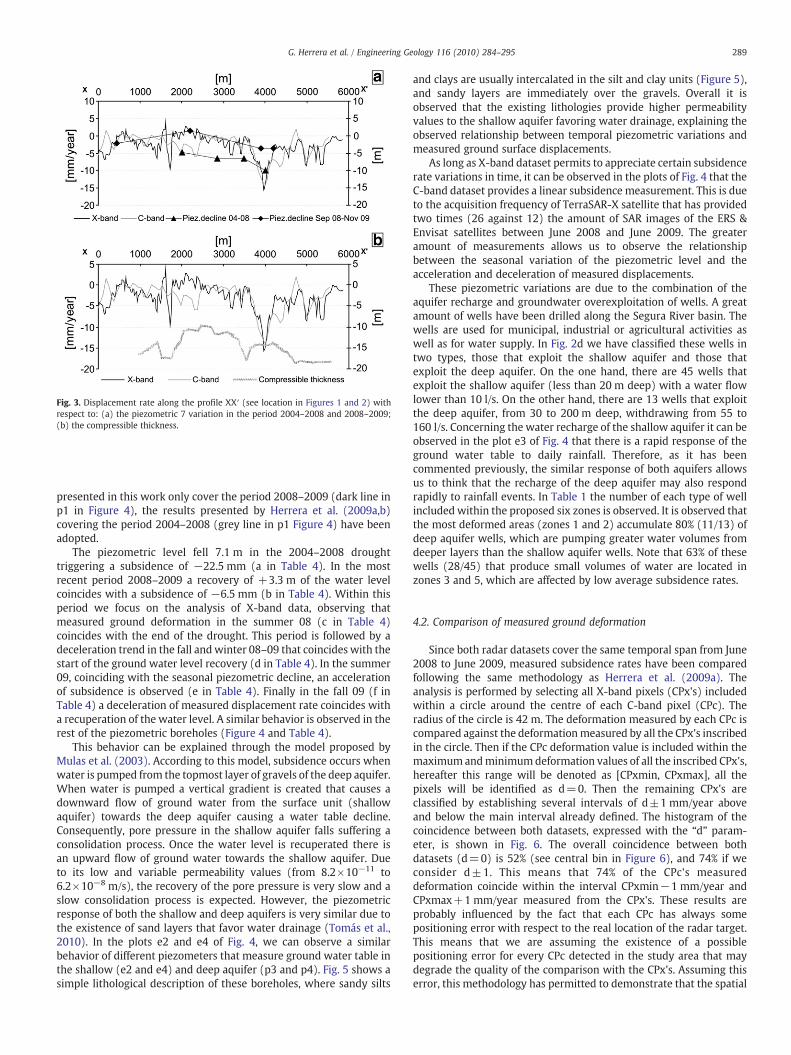
Fig. 3. Displacement rate along the profile XX′ (see location in Figures 1 and 2) withrespect to: (a) the piezometric 7 variation in the period 2004–2008 and 2008–2009;(b) the compressible thickness.
289G. Herrera et al. / Engineering Geology 116 (2010) 284–295
presented in this work only cover the period 2008–2009 (dark line inp1 in Figure 4), the results presented by Herrera et al. (2009a,b)covering the period 2004–2008 (grey line in p1 Figure 4) have beenadopted.
The piezometric level fell 7.1 m in the 2004–2008 droughttriggering a subsidence of −22.5 mm (a in Table 4). In the mostrecent period 2008–2009 a recovery of +3.3 m of the water levelcoincides with a subsidence of −6.5 mm (b in Table 4). Within thisperiod we focus on the analysis of X-band data, observing thatmeasured ground deformation in the summer 08 (c in Table 4)coincides with the end of the drought. This period is followed by adeceleration trend in the fall andwinter 08–09 that coincides with thestart of the ground water level recovery (d in Table 4). In the summer09, coinciding with the seasonal piezometric decline, an accelerationof subsidence is observed (e in Table 4). Finally in the fall 09 (f inTable 4) a deceleration of measured displacement rate coincides witha recuperation of the water level. A similar behavior is observed in therest of the piezometric boreholes (Figure 4 and Table 4).
This behavior can be explained through the model proposed byMulas et al. (2003). According to this model, subsidence occurs whenwater is pumped from the topmost layer of gravels of the deep aquifer.When water is pumped a vertical gradient is created that causes adownward flow of ground water from the surface unit (shallowaquifer) towards the deep aquifer causing a water table decline.Consequently, pore pressure in the shallow aquifer falls suffering aconsolidation process. Once the water level is recuperated there isan upward flow of ground water towards the shallow aquifer. Dueto its low and variable permeability values (from 8.2×10⁻¹¹ to6.2×10−8 m/s), the recovery of the pore pressure is very slow and aslow consolidation process is expected. However, the piezometricresponse of both the shallow and deep aquifers is very similar due tothe existence of sand layers that favor water drainage (Tomás et al.,2010). In the plots e2 and e4 of Fig. 4, we can observe a similarbehavior of different piezometers that measure ground water table inthe shallow (e2 and e4) and deep aquifer (p3 and p4). Fig. 5 shows asimple lithological description of these boreholes, where sandy silts
and clays are usually intercalated in the silt and clay units (Figure 5),and sandy layers are immediately over the gravels. Overall it isobserved that the existing lithologies provide higher permeabilityvalues to the shallow aquifer favoring water drainage, explaining theobserved relationship between temporal piezometric variations andmeasured ground surface displacements.
As long as X-band dataset permits to appreciate certain subsidencerate variations in time, it can be observed in the plots of Fig. 4 that theC-band dataset provides a linear subsidence measurement. This is dueto the acquisition frequency of TerraSAR-X satellite that has providedtwo times (26 against 12) the amount of SAR images of the ERS &Envisat satellites between June 2008 and June 2009. The greateramount of measurements allows us to observe the relationshipbetween the seasonal variation of the piezometric level and theacceleration and deceleration of measured displacements.
These piezometric variations are due to the combination of theaquifer recharge and groundwater overexploitation of wells. A greatamount of wells have been drilled along the Segura River basin. Thewells are used for municipal, industrial or agricultural activities aswell as for water supply. In Fig. 2d we have classified these wells intwo types, those that exploit the shallow aquifer and those thatexploit the deep aquifer. On the one hand, there are 45 wells thatexploit the shallow aquifer (less than 20 m deep) with a water flowlower than 10 l/s. On the other hand, there are 13 wells that exploitthe deep aquifer, from 30 to 200 m deep, withdrawing from 55 to160 l/s. Concerning the water recharge of the shallow aquifer it can beobserved in the plot e3 of Fig. 4 that there is a rapid response of theground water table to daily rainfall. Therefore, as it has beencommented previously, the similar response of both aquifers allowsus to think that the recharge of the deep aquifer may also respondrapidly to rainfall events. In Table 1 the number of each type of wellincluded within the proposed six zones is observed. It is observed thatthe most deformed areas (zones 1 and 2) accumulate 80% (11/13) ofdeep aquifer wells, which are pumping greater water volumes fromdeeper layers than the shallow aquifer wells. Note that 63% of thesewells (28/45) that produce small volumes of water are located inzones 3 and 5, which are affected by low average subsidence rates.
4.2. Comparison of measured ground deformation
Since both radar datasets cover the same temporal span from June2008 to June 2009, measured subsidence rates have been comparedfollowing the same methodology as Herrera et al. (2009a). Theanalysis is performed by selecting all X-band pixels (CPx's) includedwithin a circle around the centre of each C-band pixel (CPc). Theradius of the circle is 42 m. The deformation measured by each CPc iscompared against the deformationmeasured by all the CPx's inscribedin the circle. Then if the CPc deformation value is included within themaximumandminimumdeformation values of all the inscribed CPx's,hereafter this range will be denoted as [CPxmin, CPxmax], all thepixels will be identified as d=0. Then the remaining CPx's areclassified by establishing several intervals of d±1 mm/year aboveand below the main interval already defined. The histogram of thecoincidence between both datasets, expressed with the “d” param-eter, is shown in Fig. 6. The overall coincidence between bothdatasets (d=0) is 52% (see central bin in Figure 6), and 74% if weconsider d±1. This means that 74% of the CPc's measureddeformation coincide within the interval CPxmin−1 mm/year andCPxmax+1 mm/year measured from the CPx's. These results areprobably influenced by the fact that each CPc has always somepositioning error with respect to the real location of the radar target.This means that we are assuming the existence of a possiblepositioning error for every CPc detected in the study area that maydegrade the quality of the comparison with the CPx's. Assuming thiserror, this methodology has permitted to demonstrate that the spatial
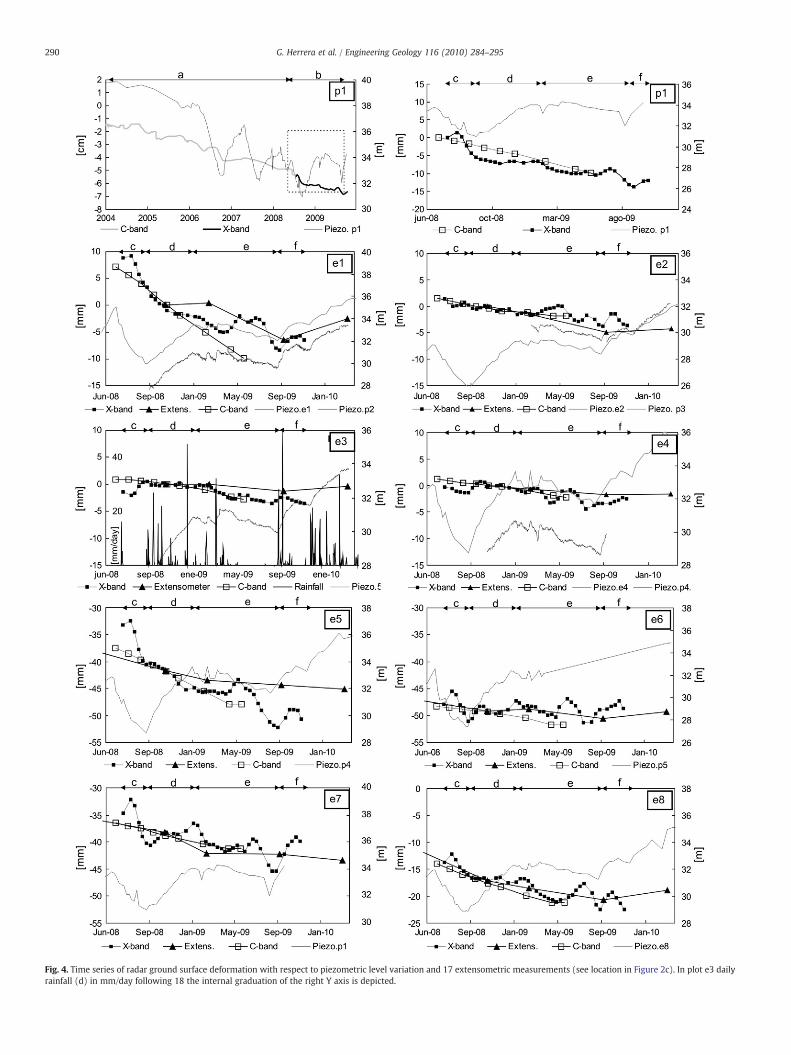
Fig. 4. Time series of radar ground surface deformation with respect to piezometric level variation and 17 extensometric measurements (see location in Figure 2c). In plot e3 dailyrainfall (d) in mm/day following 18 the internal graduation of the right Y axis is depicted.
290 G. Herrera et al. / Engineering Geology 116 (2010) 284–295
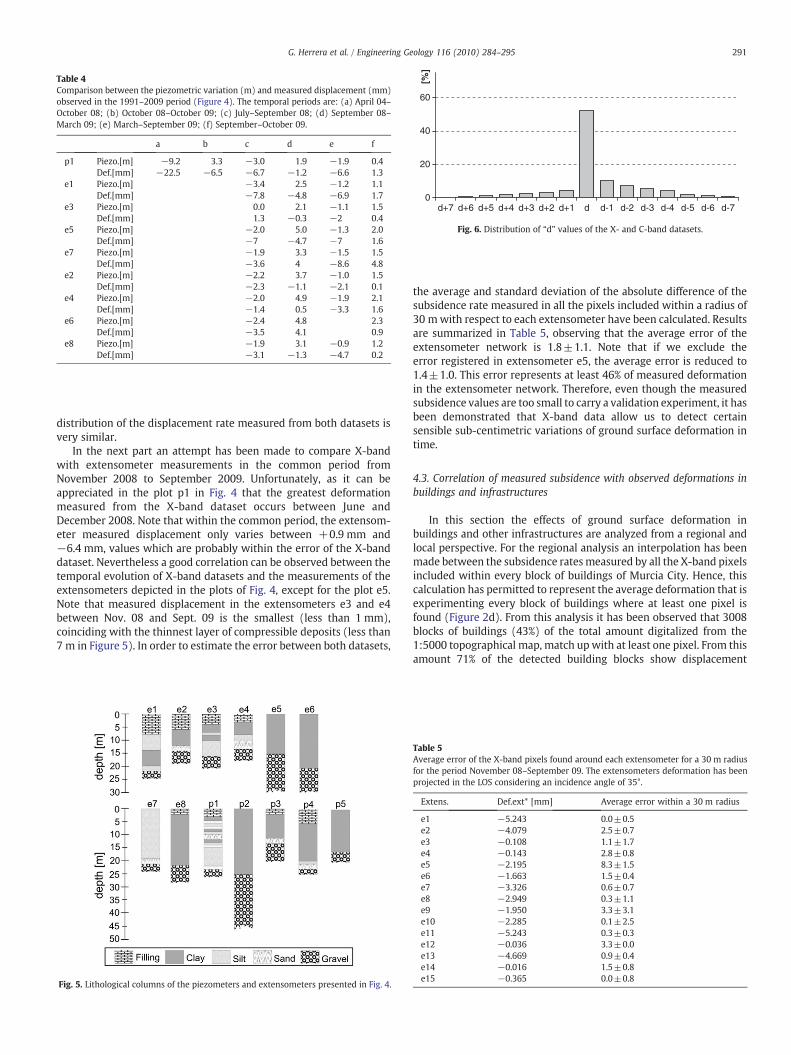
Table 4Comparison between the piezometric variation (m) and measured displacement (mm)observed in the 1991–2009 period (Figure 4). The temporal periods are: (a) April 04–October 08; (b) October 08–October 09; (c) July–September 08; (d) September 08–March 09; (e) March–September 09; (f) September–October 09.
a b c d e f
p1 Piezo.[m] −9.2 3.3 −3.0 1.9 −1.9 0.4Def.[mm] −22.5 −6.5 −6.7 −1.2 −6.6 1.3
e1 Piezo.[m] −3.4 2.5 −1.2 1.1Def.[mm] −7.8 −4.8 −6.9 1.7
e3 Piezo.[m] 0.0 2.1 −1.1 1.5Def.[mm] 1.3 −0.3 −2 0.4
e5 Piezo.[m] −2.0 5.0 −1.3 2.0Def.[mm] −7 −4.7 −7 1.6
e7 Piezo.[m] −1.9 3.3 −1.5 1.5Def.[mm] −3.6 4 −8.6 4.8
e2 Piezo.[m] −2.2 3.7 −1.0 1.5Def.[mm] −2.3 −1.1 −2.1 0.1
e4 Piezo.[m] −2.0 4.9 −1.9 2.1Def.[mm] −1.4 0.5 −3.3 1.6
e6 Piezo.[m] −2.4 4.8 2.3Def.[mm] −3.5 4.1 0.9
e8 Piezo.[m] −1.9 3.1 −0.9 1.2Def.[mm] −3.1 −1.3 −4.7 0.2
0
20
40
60
[%]
d+7 d+6 d+5 d+4 d+3 d+2 d+1 d d-1 d-2 d-3 d-4 d-5 d-6 d-7
Fig. 6. Distribution of “d” values of the X- and C-band datasets.
291G. Herrera et al. / Engineering Geology 116 (2010) 284–295
distribution of the displacement rate measured from both datasets isvery similar.
In the next part an attempt has been made to compare X-bandwith extensometer measurements in the common period fromNovember 2008 to September 2009. Unfortunately, as it can beappreciated in the plot p1 in Fig. 4 that the greatest deformationmeasured from the X-band dataset occurs between June andDecember 2008. Note that within the common period, the extensom-eter measured displacement only varies between +0.9 mm and−6.4 mm, values which are probably within the error of the X-banddataset. Nevertheless a good correlation can be observed between thetemporal evolution of X-band datasets and the measurements of theextensometers depicted in the plots of Fig. 4, except for the plot e5.Note that measured displacement in the extensometers e3 and e4between Nov. 08 and Sept. 09 is the smallest (less than 1 mm),coinciding with the thinnest layer of compressible deposits (less than7 m in Figure 5). In order to estimate the error between both datasets,
Fig. 5. Lithological columns of the piezometers and extensometers presented in Fig. 4.
the average and standard deviation of the absolute difference of thesubsidence rate measured in all the pixels included within a radius of30 mwith respect to each extensometer have been calculated. Resultsare summarized in Table 5, observing that the average error of theextensometer network is 1.8±1.1. Note that if we exclude theerror registered in extensometer e5, the average error is reduced to1.4±1.0. This error represents at least 46% of measured deformationin the extensometer network. Therefore, even though the measuredsubsidence values are too small to carry a validation experiment, it hasbeen demonstrated that X-band data allow us to detect certainsensible sub-centimetric variations of ground surface deformation intime.
4.3. Correlation of measured subsidence with observed deformations inbuildings and infrastructures
In this section the effects of ground surface deformation inbuildings and other infrastructures are analyzed from a regional andlocal perspective. For the regional analysis an interpolation has beenmade between the subsidence ratesmeasured by all the X-band pixelsincluded within every block of buildings of Murcia City. Hence, thiscalculation has permitted to represent the average deformation that isexperimenting every block of buildings where at least one pixel isfound (Figure 2d). From this analysis it has been observed that 3008blocks of buildings (43%) of the total amount digitalized from the1:5000 topographical map, match up with at least one pixel. From thisamount 71% of the detected building blocks show displacement
Table 5Average error of the X-band pixels found around each extensometer for a 30 m radiusfor the period November 08–September 09. The extensometers deformation has beenprojected in the LOS considering an incidence angle of 35°.
Extens. Def.ext* [mm] Average error within a 30 m radius
e1 −5.243 0.0±0.5e2 −4.079 2.5±0.7e3 −0.108 1.1±1.7e4 −0.143 2.8±0.8e5 −2.195 8.3±1.5e6 −1.663 1.5±0.4e7 −3.326 0.6±0.7e8 −2.949 0.3±1.1e9 −1.950 3.3±3.1e10 −2.285 0.1±2.5e11 −5.243 0.3±0.3e12 −0.036 3.3±0.0e13 −4.669 0.9±0.4e14 −0.016 1.5±0.8e15 −0.365 0.0±0.8
292 G. Herrera et al. / Engineering Geology 116 (2010) 284–295
rates greater than 3 mm/year, 40% show subsidence greater than6 mm/year, and over 10 mm/year for the 15% of them. These valuesreveal a regional moderate subsidence affecting the buildings ofMurcia City.
The local analysis is focused on three illustrative examples thatshow the potential of using X-band SAR images for buildings andinfrastructures monitoring: three buildings of the University Hospital,Cartagena St, and a highway bridge (z1, z2 and z3 in Fig. 2d).
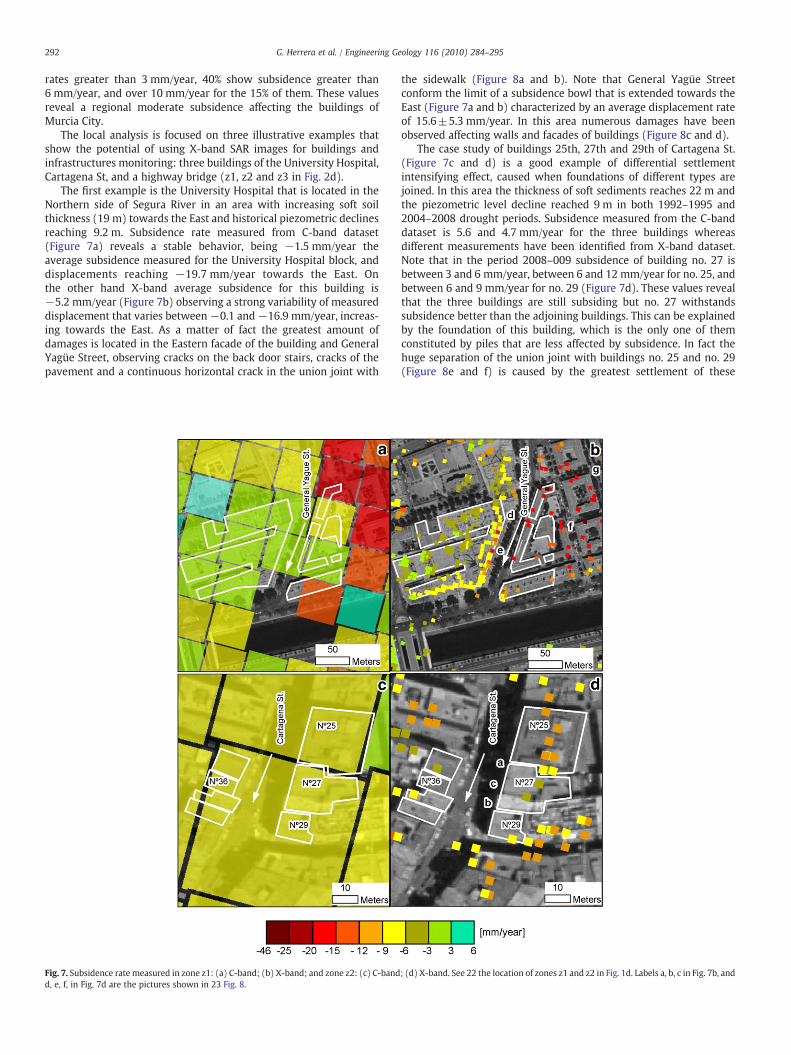
The first example is the University Hospital that is located in theNorthern side of Segura River in an area with increasing soft soilthickness (19 m) towards the East and historical piezometric declinesreaching 9.2 m. Subsidence rate measured from C-band dataset(Figure 7a) reveals a stable behavior, being −1.5 mm/year theaverage subsidence measured for the University Hospital block, anddisplacements reaching −19.7 mm/year towards the East. Onthe other hand X-band average subsidence for this building is−5.2 mm/year (Figure 7b) observing a strong variability of measureddisplacement that varies between−0.1 and−16.9 mm/year, increas-ing towards the East. As a matter of fact the greatest amount ofdamages is located in the Eastern facade of the building and GeneralYagüe Street, observing cracks on the back door stairs, cracks of thepavement and a continuous horizontal crack in the union joint with
Fig. 7. Subsidence rate measured in zone z1: (a) C-band; (b) X-band; and zone z2: (c) C-bandd, e, f, in Fig. 7d are the pictures shown in 23 Fig. 8.
the sidewalk (Figure 8a and b). Note that General Yagüe Streetconform the limit of a subsidence bowl that is extended towards theEast (Figure 7a and b) characterized by an average displacement rateof 15.6±5.3 mm/year. In this area numerous damages have beenobserved affecting walls and facades of buildings (Figure 8c and d).
The case study of buildings 25th, 27th and 29th of Cartagena St.(Figure 7c and d) is a good example of differential settlementintensifying effect, caused when foundations of different types arejoined. In this area the thickness of soft sediments reaches 22 m andthe piezometric level decline reached 9 m in both 1992–1995 and2004–2008 drought periods. Subsidence measured from the C-banddataset is 5.6 and 4.7 mm/year for the three buildings whereasdifferent measurements have been identified from X-band dataset.Note that in the period 2008–009 subsidence of building no. 27 isbetween 3 and 6 mm/year, between 6 and 12 mm/year for no. 25, andbetween 6 and 9 mm/year for no. 29 (Figure 7d). These values revealthat the three buildings are still subsiding but no. 27 withstandssubsidence better than the adjoining buildings. This can be explainedby the foundation of this building, which is the only one of themconstituted by piles that are less affected by subsidence. In fact thehuge separation of the union joint with buildings no. 25 and no. 29(Figure 8e and f) is caused by the greatest settlement of these
; (d) X-band. See 22 the location of zones z1 and z2 in Fig. 1d. Labels a, b, c in Fig. 7b, and
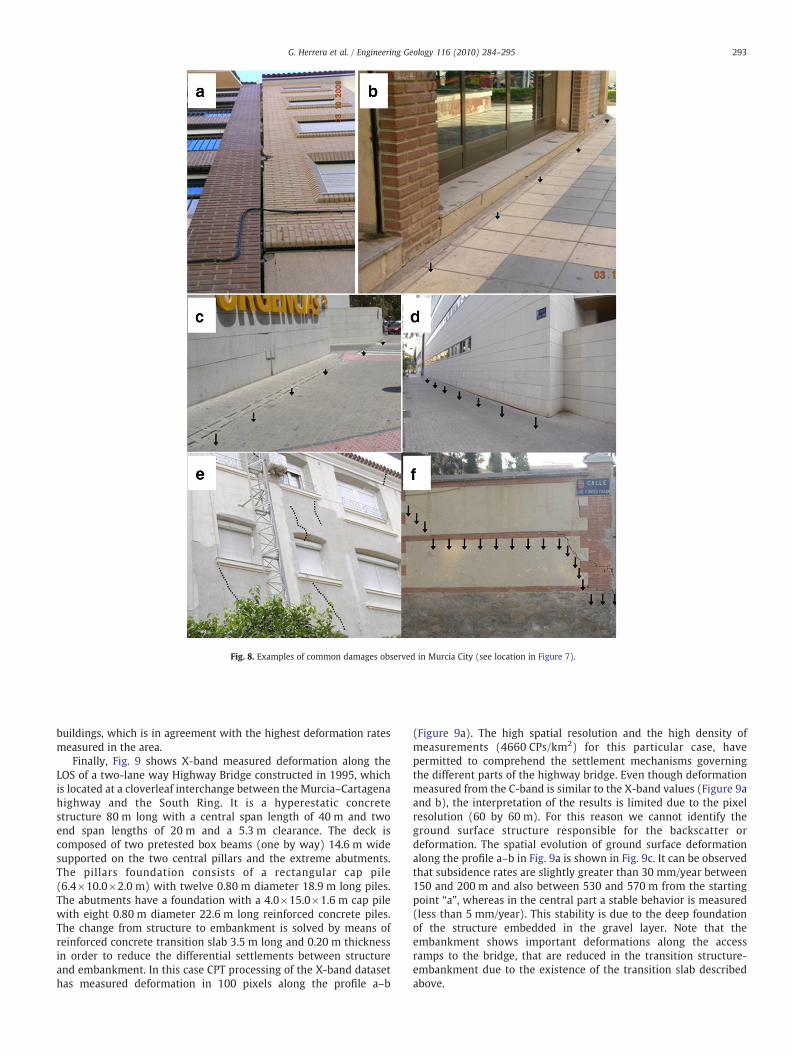
Fig. 8. Examples of common damages observed in Murcia City (see location in Figure 7).
293G. Herrera et al. / Engineering Geology 116 (2010) 284–295
buildings, which is in agreement with the highest deformation ratesmeasured in the area.
Finally, Fig. 9 shows X-band measured deformation along theLOS of a two-lane way Highway Bridge constructed in 1995, whichis located at a cloverleaf interchange between the Murcia–Cartagenahighway and the South Ring. It is a hyperestatic concretestructure 80 m long with a central span length of 40 m and twoend span lengths of 20 m and a 5.3 m clearance. The deck iscomposed of two pretested box beams (one by way) 14.6 m widesupported on the two central pillars and the extreme abutments.The pillars foundation consists of a rectangular cap pile(6.4×10.0×2.0 m) with twelve 0.80 m diameter 18.9 m long piles.The abutments have a foundation with a 4.0×15.0×1.6 m cap pilewith eight 0.80 m diameter 22.6 m long reinforced concrete piles.The change from structure to embankment is solved by means ofreinforced concrete transition slab 3.5 m long and 0.20 m thicknessin order to reduce the differential settlements between structureand embankment. In this case CPT processing of the X-band datasethas measured deformation in 100 pixels along the profile a–b
(Figure 9a). The high spatial resolution and the high density ofmeasurements (4660 CPs/km2) for this particular case, havepermitted to comprehend the settlement mechanisms governingthe different parts of the highway bridge. Even though deformationmeasured from the C-band is similar to the X-band values (Figure 9aand b), the interpretation of the results is limited due to the pixelresolution (60 by 60 m). For this reason we cannot identify theground surface structure responsible for the backscatter ordeformation. The spatial evolution of ground surface deformationalong the profile a–b in Fig. 9a is shown in Fig. 9c. It can be observedthat subsidence rates are slightly greater than 30 mm/year between150 and 200 m and also between 530 and 570 m from the startingpoint “a”, whereas in the central part a stable behavior is measured(less than 5 mm/year). This stability is due to the deep foundationof the structure embedded in the gravel layer. Note that theembankment shows important deformations along the accessramps to the bridge, that are reduced in the transition structure-embankment due to the existence of the transition slab describedabove.
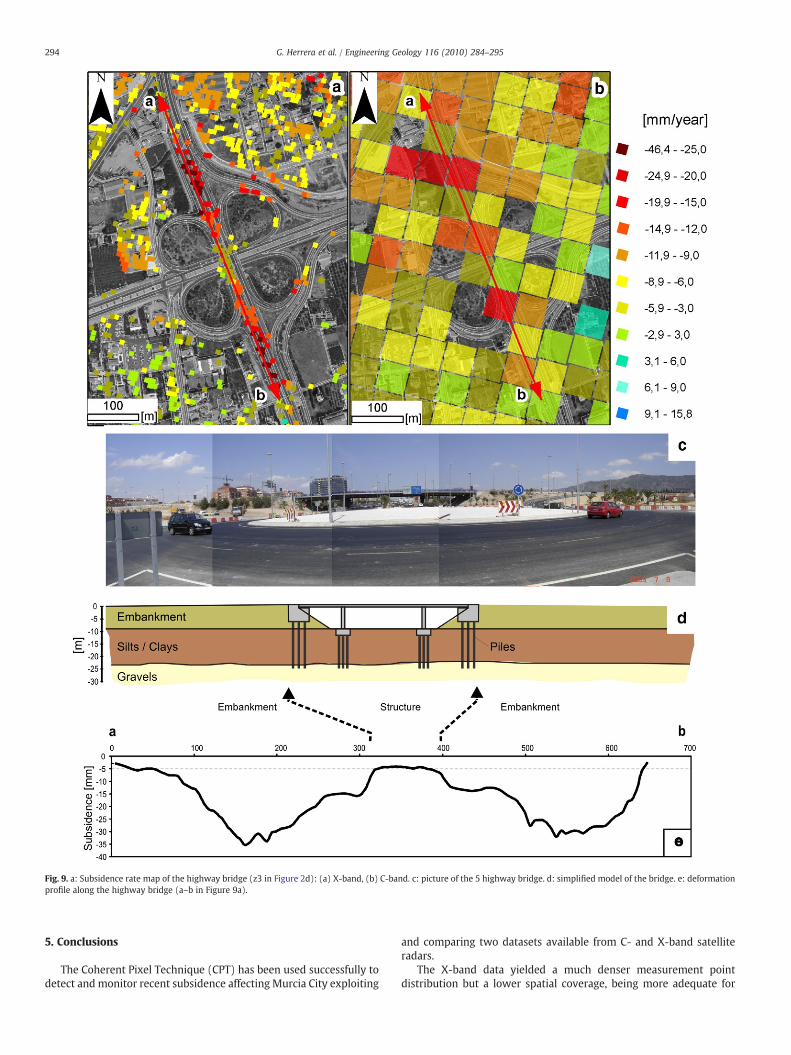
Fig. 9. a: Subsidence rate map of the highway bridge (z3 in Figure 2d): (a) X-band, (b) C-band. c: picture of the 5 highway bridge. d: simplified model of the bridge. e: deformationprofile along the highway bridge (a–b in Figure 9a).
294 G. Herrera et al. / Engineering Geology 116 (2010) 284–295
5. Conclusions
The Coherent Pixel Technique (CPT) has been used successfully todetect and monitor recent subsidence affecting Murcia City exploiting
and comparing two datasets available from C- and X-band satelliteradars.
The X-band data yielded a much denser measurement pointdistribution but a lower spatial coverage, being more adequate for
295G. Herrera et al. / Engineering Geology 116 (2010) 284–295
local deformation phenomena analysis than the C-band, especiallyif we consider the higher cost of the SAR images of the former.The spatial distribution and the magnitude of measured defor-mation rate have been proven to be very similar by comparingboth datasets (1.0±1.2 mm/year). It has been observed that 74% ofthe C-band CPs measurements coincide with the range of X-band CPsmeasurements±1 mm/year.
The spatial analysis of X-bandmeasured subsidence haspermitted todemonstrate that settlement areas are located within the flood plain ofthe valley close to the River Segura where: the soft soil is thicker, themaximum piezometric decline has occurred; and the agricultural anddrought pumping wells are located. The analysis of the X-banddisplacement time series has permitted to demonstrate that groundsurface displacement variations are correlated with seasonal variationsof ground water table level. The rapid response of ground deformationto pore pressure changes is explained by the drainage capacity of theaquifer system, and particularly by the presence of sandy layers in theshallow aquifer that increases its permeability.
Finally three examples of ground surface deformation analysis inbuildings and infrastructures have been presented. These examplesillustrate that the X-band data allow us to identify the differentialsettlement caused when different types of foundations of buildingsand infrastructures are joined, e.g. the settlement mechanismsgoverning the different parts of the highway bridge.
Acknowledgements
This study was partially funded by the Spanish Ministry of Scienceand Technology and EU FEDER (Projects TEC-2008-06764 and CGL-2009-08457) and by the Generalitat Valenciana (Project ACOMP/2010/082), as well as by the Spanish Geological and Mining Institute (IGME)with the collaboration of the Regional Government of Murcia. TheTerraSAR-X images were provided by DLR in the framework of thescientific projectGEO0389. ERS and ENVISATdatawere provided by ESAin the framework of the CAT1 project 2494.
References
Aragón, R., García-Aróstegui, J.L., Lambán, J., Hornero, J., Fernández-Grillo, A.I., 2004.Impacto de la explotación intensiva de aguas subterráneas en la ciudad de Murcia(España). Análisis hidrogeológico. Proc. XXXIII Congress of IAH-ALHSUD, Conferenceon Groundwater FlowUnderstanding from local to regional scales, Zacatecas, Mexico,pp. 2622–2624.
Arnaud, A., Adam, N., Hanssen, R., Inglada, J., Duro, J., Closa, J., Eineder, M., 2003. ASAR ERSInterferometric Phase Continuity. Proc. IEEE International Geoscience and RemoteSensing Symposium (IGARSS-03), 21-25 July, Toulouse, France, 2, pp. 1133–1135.
Berardino, P., Fornaro, G., Lanari, R., Sansosti, E., 2002. A new algorithm for surfacedeformation monitoring based on small baseline differential SAR interferograms.IEEE Transactions on Geoscience and Remote Sensing 40, 2375–2383.
Blanco, P., Mallorquí, J.J., Duque, S., Monells, D., 2008. The Coherent Pixels Technique(CPT): an advanced DInSAR technique for non-linear deformationmonitoring. Pureand Applied Geophysics 165, 1167–1193.
Cerón, J.C. and Pulido, A., 1996. Groundwater problems resulting from CO2 pollution andoverexploitation in Alto Guadalentín aquifer (Murcia, Spain). Env. Geol. 28, 223–228.
Ferretti, A., Prati, C., Rocca, F., 2000. Nonlinear subsidence rate estimation usingpermanent scatterers in differential SAR interferometry. IEEE Trans. Geosci. RemoteSensing 38, 2202–2212.
Herrera, G., Tomás, R., Lopez-Sanchez, J.M., Delgado, J., Vicente, F., Mulas, J., Cooksley, G.,Sánchez, M., Duro, J., Arnaud, A., Blanco, P., Duque, S., Mallorquí, J.J., Vega-Panizo, R.,Monserrat, O., 2009a. Validation and comparison of Advanced DifferentialInterferometry Techniques: Murcia metropolitan area case study. ISPRS Journalof Photogrammetry and Remote Sensing 64, 501–512.
Herrera, G., Fernández, J.A., Tomás, R., Cooksley, G., Mulas, J., 2009b. Advancedinterpretation of subsidence inMurcia (SE Spain) using A-DInSAR data—modellingand validation. Natural Hazards and Earth System Science 9, 647–661.
Hooper, A., Zebker, H., Segall, P., Kampes, B., 2004. A new method for measuringdeformation on volcanoes and other natural terrains using InSAR PersistentScatterers. Geophys. Res. Lett. 31. doi:10.1029/2004GL021737.21.
IGME, 2000. Estudio Geotécnico del subsuelo del Área Metropolitana de Murcia.Instituto Geológico y Minero de España. 200 pp. Report.
Martínez, M., Mulas, J., Herrera, G., Aragón, R., 2004. Efectos de una subsidenciamoderada por extracción de agua subterránea en Murcia, España. Proc. XXXIIICongress of IAH-ALHSUD, Zacatecas, Mexico. Conference on Groundwater FlowUnderstanding from Local to Regional Scales, CD ROM.
Mora, O., Mallorquí, J.J., Broquetas, A., 2003. Linear and nonlinear terrain deformationmaps from a reduced set of interferometric SAR images. IEEE T. Geosci. Remote 41,2243–2253.
Mulas, J., Aragón, R., Martínez, M., Lambán, J., García-Arostegui, J.L., Fernández-Grillo,A.I., Hornero, J., Rodríguez, J., Rodríguez, J.M., 2003. Geotechnical and hydrologicalanalysis of land subsidence in Murcia (Spain). Proc. 1ª International Conferenceon Groundwater in Geological Engineering, 22–26 September, Bled, Slovenia, 50,pp. 249–252.
Tomás, R., Márquez, Y., Lopez-Sanchez, J.M., Delgado, J., Blanco, P., Mallorqui, J.J.,Martinez, M., Herrera, G., Mulas, J., 2005. Mapping ground subsidence induced byaquifer overexploitation using advanced Differential SAR Interferometry: VegaMedia of the Segura River (SE Spain) case study. Remote Sensing of Environment98, 269–283.
Tomás, R., 2009. Estudio de la subsidencia de la ciudad de Murcia medianteInterferometría SAR diferencial (DInSAR) avanzada. PhD Thesis.
Tomás, R., Herrera, G., Delgado, J., López-Sánchez, J.M., Mallorquí, J.J., Mulas, J., 2010. Aground subsidence study base don DInSAR data: calibration of soil parameters andsubsidence prediction in Murcia City (Spain). Engineering Geology 111, 19–30.
Werner, C., Wegmüller, U., Strozzi, T., Wiesmann, A., 2003. Interferometric Point TargetAnalysis for DeformationMapping. Proc. IEEE International Geoscience and RemoteSensing Symposium (IGARSS-03), 21–25 July, Toulouse, France 7, pp. 4362–4364.