analysis of stock market reactions to fda and emea
TRANSCRIPT

GHENT UNIVERSITY
FACULTY OF ECONOMICS AND BUSINESS
ADMINISTRATION
ACADEMIC YEAR 2012 – 2013
Analysis of stock market reactions to FDA and EMEA announcements
Thesis submitted in fulfilment of the requirements for the degree of
Master of Science in Economics
Joachim De Schrijver
supervised by
Dr. Dries Heyman


The author gives the permission to use this thesis for consultation and/or copy parts on the condition
that the source is extensively specified.
De auteur verklaart dat de inhoud van deze masterproef mag geraadpleegd en/of gereproduceerd
worden, mits uitgebreide bronvermelding
Joachim De Schrijver


Preface|i
PREFACE Writing the thesis is the final stage of a long journey towards obtaining the Masters degree. For me
personally, it has been quite an exciting journey, especially a tough one as I combined obtaining my
degree in economics with obtaining a PhD in Applied Biological Sciences. However, this would not have
been possible without the continuous support of some important people.
First of all, I want to thank Ghent University for offering the flexible study programs which allowed me
to combine both. I also want to thank my PhD promoter, Prof. Wim Van Criekinge for giving me the
flexibility to attend some classes, attend exams, and allow me to schedule my own agenda.
Furthermore, I also want to thank my fellow students for understanding my situation and being there
when I needed yet another syllabus or needed to reschedule meetings when I was unable to attend
them. And last but not least, I want to thank my friends and family for their continuous support
throughout the recent years.
I want to thank Dr. Dries Heyman for the opportunity to study the stock price responses of biotech and
pharmaceutical companies in response to regulatory decisions. This research question has been
intriguing me for quite some time and through this thesis I finally was able to investigate this and
combine my different interests in both life science and capital markets.
I had a wonderful time conducting the research and really enjoyed writing this thesis. I hope you will
have an equally great time reading this thesis.
Joachim De Schrijver Ghent, May 2013


Contents|iii
Contents Preface ............................................................................................................................................................................ i
List of abbreviations ...................................................................................................................................................... v
List of figures ............................................................................................................................................................... vii
List of tables .................................................................................................................................................................. ix
Introduction ................................................................................................................................................................... 1
1. Clinical trials ........................................................................................................................................................... 3
1.1. The Softenon case ........................................................................................................................................ 3
1.2. Commercial risks in developing drugs .......................................................................................................... 4
1.3. The clinical trial process ............................................................................................................................... 6
2. Investing in an environment of regulatory uncertainty ......................................................................................... 9
2.1. Valuating life science companies ................................................................................................................. 9
2.2. Stock price responses to regulatory decisions ........................................................................................... 10
2.3. Research focus ........................................................................................................................................... 13
3. Datasets and analysis framework ........................................................................................................................ 15
3.1. Analysis timeline ........................................................................................................................................ 15
3.2. Announcement events ............................................................................................................................... 15
3.3. Stock price data and index data ................................................................................................................. 20
3.4. Data analysis framework ............................................................................................................................ 20
4. Stock price anticipation – averaged cumulative returns ..................................................................................... 21
4.1. Methodology .............................................................................................................................................. 21
4.2. Results and discussion ................................................................................................................................ 23
4.3. Concluding remarks ................................................................................................................................... 29
5. Announcement day effect – distributional analysis ............................................................................................ 31
5.1. Methodology .............................................................................................................................................. 31
5.2. Result & discussion .................................................................................................................................... 32
5.3. Concluding remarks ................................................................................................................................... 38
6. Event study analysis ............................................................................................................................................. 39
6.1. Methodology .............................................................................................................................................. 39
6.2. Results and discussion ................................................................................................................................ 46
7. Benefiting from the insights – trading simulations.............................................................................................. 57
7.1. Methodology .............................................................................................................................................. 57
7.2. Results and discussion ................................................................................................................................ 58

iv|Contents
7.3. Concluding remarks ................................................................................................................................... 61
8. Conclusions and future perspectives ................................................................................................................... 63
References ................................................................................................................................................................... 65
Appendices .................................................................................................................................................................. 69

Abbreviations|v
LIST OF ABBREVIATIONS AMEX American Stock Exchange
API Application Programming Interface
BLA Biologic License Application
BTM Book-to-market
CAPM Capital Asset Pricing Model
CHMP Committee for Medicinal Products for Human Use
DCF Discounted Cash Flow
DRG NYSE Arca Pharmaceutical Index
EM(E)A European Medicine Agency
FDA Food and Drug Administration
HPR Holding Period Return
IND Investigational New Drug
IXIC NASDAQ Composite Index
MPT Modern Portfolio Theory
NASDAQ National Association of Securities Dealers Automated Quotations
NBI NASDAQ Biotechnology Index
NDA New Drug Application
NME New Molecular Entity
NYA NYSE Composite Index
NYSE New York Stock Exchange
OLS Ordinary Least Squares
OTC Over-The-Counter [Market]
PE Price earnings ratio
R&D Research and Development

vi|Abbreviations
SEC Securities and Exchange Commission
US United States
VaR Value-at-Risk
Figures|vii
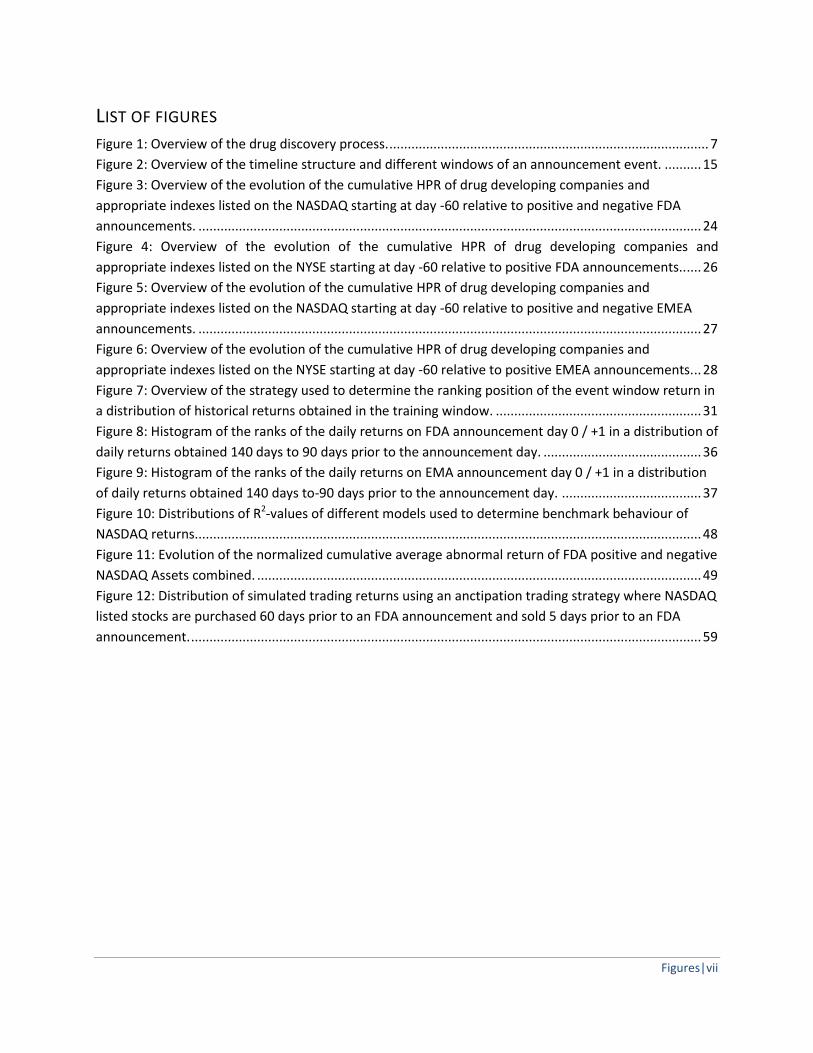
LIST OF FIGURES Figure 1: Overview of the drug discovery process. ....................................................................................... 7
Figure 2: Overview of the timeline structure and different windows of an announcement event. .......... 15
Figure 3: Overview of the evolution of the cumulative HPR of drug developing companies and
appropriate indexes listed on the NASDAQ starting at day -60 relative to positive and negative FDA
announcements. ......................................................................................................................................... 24
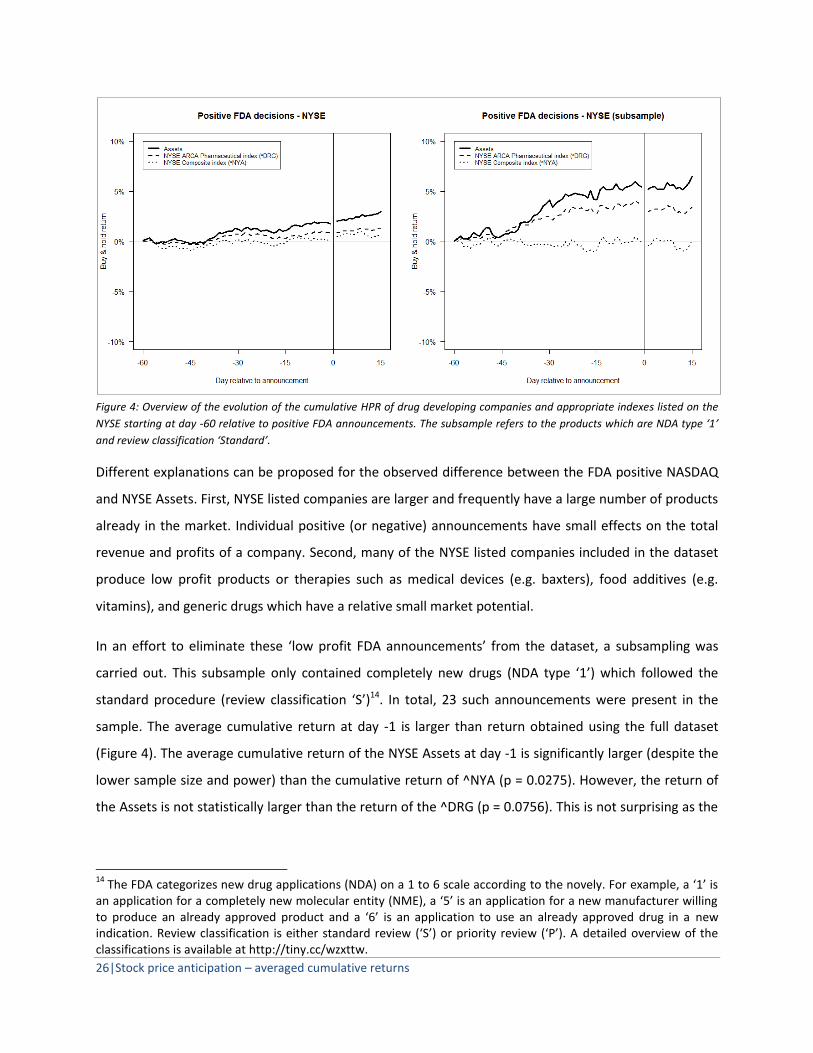
Figure 4: Overview of the evolution of the cumulative HPR of drug developing companies and
appropriate indexes listed on the NYSE starting at day -60 relative to positive FDA announcements.. .... 26
Figure 5: Overview of the evolution of the cumulative HPR of drug developing companies and
appropriate indexes listed on the NASDAQ starting at day -60 relative to positive and negative EMEA
announcements. ......................................................................................................................................... 27
Figure 6: Overview of the evolution of the cumulative HPR of drug developing companies and
appropriate indexes listed on the NYSE starting at day -60 relative to positive EMEA announcements. .. 28
Figure 7: Overview of the strategy used to determine the ranking position of the event window return in
a distribution of historical returns obtained in the training window. ........................................................ 31
Figure 8: Histogram of the ranks of the daily returns on FDA announcement day 0 / +1 in a distribution of
daily returns obtained 140 days to 90 days prior to the announcement day. ........................................... 36
Figure 9: Histogram of the ranks of the daily returns on EMA announcement day 0 / +1 in a distribution
of daily returns obtained 140 days to-90 days prior to the announcement day. ...................................... 37
Figure 10: Distributions of R2-values of different models used to determine benchmark behaviour of
NASDAQ returns.......................................................................................................................................... 48
Figure 11: Evolution of the normalized cumulative average abnormal return of FDA positive and negative
NASDAQ Assets combined. ......................................................................................................................... 49
Figure 12: Distribution of simulated trading returns using an anctipation trading strategy where NASDAQ
listed stocks are purchased 60 days prior to an FDA announcement and sold 5 days prior to an FDA
announcement. ........................................................................................................................................... 59


Tables|ix
LIST OF TABLES Table 1: Announcements between January 2008 and September 2012 per agency and exchange. ......... 18
Table 2: Overview of the used reference indexes. ..................................................................................... 20
Table 3: Average cumulative buy & hold returns starting on day -60 to the announcement date at day -1,
+1, and +15.................................................................................................................................................. 25
Table 4: P-values of rank testing using Wilcoxon rank-sum tests. .............................................................. 33
Table 5: Summary statistics of trading simulations using different 'long' strategies. ................................ 60
Table 6: Summary statistics of trading simulations using different 'short' strategies. ............................... 61


Introduction|1
INTRODUCTION Biotech and pharmaceutical companies (and many life science companies in general) research and
manufacture products which are strictly regulated by regulatory governmental agencies.
Announcements of such agencies to either approve or reject newly developed products are high-profile
events which are of critical importance for the financial success of these products (Rothenstein,
Tomlinson et al. 2011). As a consequence, these events are important valuation determinants of publicly
traded companies and are closely monitored by investors (Herper and Langreth 2008).
Nowadays, investment professionals go to great lenghts in an effort to determine the most probable
regulatory decision (approval or rejection) in advance and take trading positions accordingly. Many
people, including investigators, company employees, outside consultants and agency staff are aware of
results before they are made public. Too many a times have such professionals been paid by investment
firms to provide ‘expert opinions’ which are in turn used by the investment firms to take trading
positions (Steinbrook 2005). Use of such non-public information can indeed be very profitable as the
information is not yet reflected in the market price of a stock and the price is expected to move in the
desired direction. In anticipation of a positive decision by the regulatory agencies, an increase of the
company’s stock price is often observed which could be related to investors buying on this non-public
news (Rothenstein, Tomlinson et al. 2011). In a way, this could be viewed as market efficiency as
investors are absorbing information and valuing the company accordingly.
However, strong stock price movements of life science companies do not always reflect market
efficiency. In 1998, the New York Times ran an article on a newly developed drug by EntreMed in its
Sunday edition. The following Monday, the stock price of EntreMed more than quadruppled. But in fact,
no new information had been presented as the drug was already reported in the scientific journal
Nature and in various popular newspapers more than five months earlier (Huberman and Regev 2001).
In this thesis I will study the stock price reaction of companies listed on both the National Association of
Securities Dealers Automated Quotations (NASDAQ) and the New York Stock Exchange (NYSE) to 403
positive and negative announcements made by the US Food and Drug Administration (FDA) and the
European Medicine Agency (EMEA) between January 2008 and September 2012. Stock price movements
prior to the announcement will be studied to investigate whether there is a systematic stock price
anticipation and what its determinants could be. Furthermore, stock price movements on the
announcement day will be studied to identify the determinants of a price shock. Lastly, the evolution of

2|Introduction
stock prices in the days following the announcement will be studied to verify whether the response is
efficient or possibly irrational as in the EntreMed case.
The remainder of this thesis is organised as follows. The first section gives a short introduction on the
clinical trial and regulatory process encountered by life science companies developing new products.
The second section studies how this development process can have an effect on the stock price of
companies developing these products and gives an overview of existing literature on this topic. The third
section gives an overview of the datasets and analysis framework used in this thesis. The fourth section
studies stock price anticipation leading up to the announcement day using a methodology similar to the
one used in a recent study on the stock price response to oncology drugs related FDA announcements
(Rothenstein, Tomlinson et al. 2011). The fifth section deals with stock price responses on the
announcement day itself using a company-specific return distribution approach. The sixth section deals
primarily with stock price anticipation, response on the announcement day itself, and the potentially
inefficient stock price behaviour following the announcement using an event-study framework
(MacKinlay 1997; De Jong 2007). The seventh section proposes some trading strategies which can
generate excess returns using the insights obtained in sections four through six. Simulations will show
that excess returns can indeed be obtained using relatively low-risk strategies. The eighth and final
section summarizes the main conclusions and gives an overview of possible future research.

The Softenon case|3
1. CLINICAL TRIALS
1.1. THE SOFTENON CASE
Biotech and pharmaceutical companies (commonly known as life science companies) research, develop,
and market products to cure or prevent diseases typically in humans1. However, as these products
typically interfere with existing molecules in humans, effects of these newly developed products are
sometimes unexpected and/or unpredictable and as a consequence bear high risks.
A classic example of such unexpected effects is the drug thalidomide (α-N-[phtalimido]glutarimide),
having brand names such as Softenon, Contergan, Distaral, and others. Thalidomide was developed in
the 1950s and eventually commercialised in 1957. At the time it was considered a ‘wonder drug’, able to
cure many diseases and minor discomforts. The drug was initially designed as a sleeping pill, but was
also used as a drug to cure headaches and colds, but more importantly to suppress morning sickness in
pregnant women (Cohen 1960; Somers 1960; Franks, Macpherson et al. 2004). However, the drug was
unknown to be teratogenic; women using thalidomide during the first trimester of the pregnancy gave
birth to children with congenital malformations, i.e. missing or malformed limbs (phocomelia) (Giroud,
Tuchmann-Duplessis et al. 1962; Speirs 1962).
Thalidomide is a racemic mix, consisting of very similar but different chemical molecules (R-thalidomide
and S-thalidomide). In mice, S-thalidomide is responsible for the teratogenic effects; in rabbits both
enantiomers are responsible for the effects. In humans, teratogenic effects are caused by only one of
the two enantiomers. In principle, specific synthetisation of the non-teratogenic enantiomer should
prevent enantiomer-related problems. However, researchers were not aware that S-thalidomide is
converted into R-thalidomide (and vice versa) in humans, eventually making both enantiomers
teratogenic in humans (Eriksson, Bjorkman et al. 1995; Matthews and McCoy 2003).
In the late 1950s and early 60s, more than 10,000 children in 46 countries were born with congenital
deformities. Despite the known side effects, thalidomide was sold in pharmacies in Canada until 1962;
Canada was the last country to end sales of the drug (Webb 1963). In the United Kingdom, the drug was
approved in 1958 and withdrawn in 1961. Remarkably, it was never approved in the US (Bren 2001).
1 Most of the large pharmaceutical companies such as Pfizer and Novartis for example have large animal health
divisions developing pharmaceutical products specifically for non-humans. However, revenues are typically single digit percentages of the revenues obtained in the ‘human health’ division, are regulated to a lesser degree, and are generally of lesser importance. As a consequence, the animal health industry, albeit a growing industry, will not be studied in this thesis.

4|Clinical trials
The effects of thalidomide increased the fear of the safety of medical drugs. The Softenon crisis was
needed to implement the much needed change in the way regulatory institutions look at medical
products. From then on, toxicology was assessed separately from pharmacology and efficacy by the
regulatory agencies. Toxicology studies whether a product is safe to be used; pharmacology is typically
divided into pharmacodynamics and pharmacokinetics; the former studies the effects of the drug on
biological systems, the latter the effects of biological systems on the drug (absorption, distribution,
metabolism, and excretion).
Currently, the main regulatory authorities going over drug approvals are the Food and Drug
Administration (FDA) in the United States, Health Canada in Canada, the European Medicines Agency
(EMEA) in Europe, and the Ministry of Health, Labour and Welfare in Japan.
1.2. COMMERCIAL RISKS IN DEVELOPING DRUGS
Life science companies bear incredible large risks regarding future revenues and related cash flows.
Upfront investments are high, earn back periods are far away and short, and success depends on the
competitive environment which is the result of the developments of competing companies.
1.2.1. UPFRONT INVESTMENTS
Upfront investments are frequently in the excess of $1 billion. In 1975, the life science industry spent
the equivalent of $100 million in today’s dollars for research and development (R&D) of an average drug
approved by the FDA. By 2005, that figure had risen to $1.3 billion (Roy 2012). Different datasets and
methodologies come to approximately the same conclusion. A study conducted by DiMasi and
colleagues concluded that, currently, the average cost of an approved drug is $802 million (DiMasi,
Hansen et al. 2003). Adams and Brantner recently concluded that the cost of an approved drug is on
average $1 billion (Adams and Brantner 2010).
However, many products fail somewhere during the long research process and, as a consequence, are
discontinued. When taking these lost investments into account and dividing the total amount of R&D
investments by the number of approved drugs, the true cost of an approved drug is roughly $5 billion
(Herper 2012). For example, between 1997 and 2011 Pfizer spent $108 billion on R&D and had 14 drugs
approved by the FDA, resulting in an average cost per approved drug of $7.7 billion2.
2 Companies with a low success rate are off even worse. Between 1997 and 2011 AstraZeneca spent approximately
$60 billion on R&D and had only 5 drugs approved by the FDA resulting in an average cost per approved drug of almost $12 billion. Novartis spent approximately $83 billion in the same period and had 21 drugs approved by the

Commercial risks in developing drugs|5
Some are arguing excessive regulation and increased scrutiny by the FDA are ‘killing’ the life science
industry (Herper 2012). Recently, the US House of Representatives investigated (Issa 2012) whether the
strict FDA regulation is responsible for shortage of drug supplies in the USA3. The semiconductor
industry, typically a research intensive industry, invests approximately $40,000 per year per employee
on R&D. In the life science industry, that number has recently risen to over $100,000 per employee (Roy
2012). The costs are becoming so large that life science companies are becoming increasingly reluctant
to invest in such risky endeavours.
1.2.2. PATENT PROTECTED PAYBACK PERIOD
In 1995, following the World Trade Organization's Agreement on Trade-Related Aspects of Intellectual
Property Rights negotiated in the Uruguay Round, the patent term for medical drugs in the United
States was changed from seventeen to twenty years from the earliest filing date (United States 2007).
Although this might seem a lengthy period at first sight, sometimes this twenty years is still too short.
Life science companies file their drug candidates in the early stages of the R&D process. However, as this
R&D process takes seven up to twelve years (Adams and Brantner 2010), the protected payback period
of the investments is roughly ten years, meaning the invested money needs to be earned back in a
relatively short period of time. Furthermore, many large pharmaceutical companies4 are currently facing
a ‘patent cliff’ where many of their top selling drugs are going off patent. Off patent drugs face stiff
competition from generic competitors (Andrew 2012). Such drugs can see sizeable drops in sales even
the first year the products go off patent5, effectively making the patent protected period a relative
hardcoded payback period (Danzon and Furukawa 2011; Pierson 2012).
FDA, resulting in an average cost of $4 billion per approved drug, demonstrating that even companies with high success rates face incredible steep upfront investment costs. 3 The US House of Representatives report points out that between 2009 and 2011, the number of warning letters
sent by the FDA to manufacturers (especially of generic injectable medications) almost quadrupled from 474 to 1720. Rather than pinpointing the precise problems with the drug manufacturing, the FDA has ordered costly general upgrades to plants, which lead to significant lapses in production. Four major producers of generic injectable drugs (Bedford Laboratories, Hospira Pharmaceuticals, Sandoz Pharmaceuticals, and Teva Pharmaceuticals) have reduced their combined production 30%, from 1 billion units per year to 700 million units per year. 4 The top pharmaceutical companies are frequently considered to be a small group composed of Johnson &
Johnson, Pfizer, Bayer HealthCare, GlaxoSmithKline, Roche, Sanofi, Novartis, AstraZeneca, Abbott Laboratories, Merck & Co., Bristol-Myers Squibb. and Eli Lilly. Also see Appendix 1. 5 Sanofi and Bristol-Myers Squibb’s blockbuster blood-thinner drug Plavix had sales of approximately €7 billion in
2011. The drug went off patent in May 2012 and third quarter (Q3 2012) sales dropped 96% to €50 million, evaporating billions of revenue.

6|Clinical trials
As a consequence, life science companies want to speed up the R&D process as much as possible in an
effort to maximize the protected payback period. In practice, these companies want to dispose of non-
performing products as early as possible in the research process. After all, it makes no sense to keep
adapting the product in a trial and error approach so that the total research period eventually exceeds
the twenty year mark, rendering the patent protection void.
1.2.3. COMPETITIVE ENVIRONMENT
In general, the FDA and EMEA only allow new products to be commercialised when they perform better
than the existing therapies or perform at least as good but with less side effects. However, as a company
it is difficult to look ahead ten years and assess the products developed by the competitors. Company A
might be developing a product which is better than the existing therapy, but so might company B. When
company B’s product reaches the market earlier then company A, company A’s product might not be
approved unless it performs even better than company B’s product.
To avoid such risks, pharmaceutical companies tend to research and develop multiple potential drugs
for a certain disease and discontinue many in the development process in the hope to have a single
blockbuster product left in the end.
1.3. THE CLINICAL TRIAL PROCESS
To mitigate some of these aforementioned risks, a stepping stone (phased) approach is used in the
development process. This approach allows a company to fairly cheaply dispose of non-performing drug
candidates or drug candidates with unwanted side effects. Drug candidates passing an initial cheap
screening undergo more thorough and expensive screenings until, hopefully, one of the many
candidates passes all tests and is allowed to be commercialized.
Both the regulatory agencies (FDA and EMEA) and the life science companies have incentives to use a
stepping stone approach. The regulatory agencies want to prevent a new Softenon case and companies
want to make sure they have a product with a reasonable chance of success before starting lengthy and
expensive clinical trials. Typically, the R&D process consists of a drug discovery process, a preclinical
phase, clinical phases, and a registration phase (Meinert and Tonascia 1986; Cox Gad 2009). An overview
of the process is shown in Figure 1.

The clinical trial process|7
Figure 1: Overview of the drug discovery process. Source: FDA.gov
In the pre-discovery and drug discovery phase, a disease condition is thoroughly investigated. Using the
insights obtained in the fundamental research, potential drug candidates are identified, optimized, and
eventually pushed into the preclinical phase.
In the preclinical phase, experimental products undergo different tests, but not in humans; products
may undergo pharmacodynamics, pharmacokinetics, and toxicity testing in animal models. The data
obtained in this phase allows researchers to estimate a safe starting dose for testing in humans. After
finalising these preclinical studies, products designed for the American market need an IND
(Investigational New Drug) approval by the FDA to start further phases of the clinical trials.
In 2006, the FDA released a guidance document outlining recommendations for exploratory
investigational studies. In these so-called phase 0 studies, conducted before traditional phase I trials,
subtherapeutic doses of a new product are given to a small group of healthy volunteers (typically fewer
than 15) for roughly a week to determine pharmacodynamic and pharmacokinetic properties.
Researchers can then use these early data to guide further development (The Lancet 2009).
In phase I, similar to phase 0, researchers test an experimental drug or treatment in a small group of
healthy people (<100) to evaluate its safety, determine a safe dosage range, and identify potential side
effects. On average, phase I studies take a little more than 17 months and have a success rate of 75%
(Adams and Brantner 2010).
In phase II, the experimental drug or treatment is given to a larger group of unhealthy people (100-300)
to see if it is effective and to further evaluate its safety. This phase often consists of a phase IIa and
phase IIb, where the treatment is given initially to a small group of unhealthy people (~20) to quickly
assess effectiveness before initiating a larger and more expensive phase IIb study. On average, phase II
studies take 31 months and have a success rate of 48% (Adams and Brantner 2010).

8|Clinical trials
In phase III, the experimental drug or treatment is given to large groups of thousands of unhealthy
people to confirm its effectiveness, monitor side effects, and compare it to commonly used treatments.
On average, phase III studies take 27 months and have a success rate of 71% (Adams and Brantner
2010). After a successful phase III study, a product is typically filed for review at a regulatory agency (e.g.
FDA or EMEA) for commercialisation. The company hands over the data obtained in the pivotal phases
to the regulatory agency. The agency in turn analyses the data and then decides whether the company
can commercialise the product or not. A successful phase III results almost always (~85%) in an approval
of the product for commercialization.
To have a product approved by the FDA, a company needs to file an NDA (New Drug Application) and
needs to demonstrate the new product is safe and effective when used as directed and that the benefits
outweigh the risks. Furthermore, the company needs to demonstrate that it can adequately produce the
product on a big scale and maintain quality, purity, and strength of the product (FDA 2013).
Phase IV studies consist of post-marketing studies to delineate additional information, including the
treatment's risks, benefits, and optimal use. Phase III studies allow ‘only’ thousands of patients to be
monitored compared to a phase IV study where the entire population of patients exposed to the specific
drug are monitored. Occasionally products are withdrawn or use thereof restricted when phase IV
studies for example indicate long term adverse effects or adverse effects for specific high-risk groups
(Johnson-Pratt 2010).

Valuating life science companies|9
2. INVESTING IN AN ENVIRONMENT OF REGULATORY UNCERTAINTY
2.1. VALUATING LIFE SCIENCE COMPANIES
Valuating a public life science company is difficult. Valuation methods typically include, amongst others,
market capitalization over earnings (P/E ratio), market capitalization over sales, discounted future cash
flow (DCF), and dividend growth models (Ross and Westerfield 2002). However, many pharmaceutical
and biotech companies are ‘one trick ponies’ investing all available resources in a single product. This
means a typical company has no approved products, hence no sales and most probably no profit. This
renders many of these standard valuation methods unusable and many times an investor is left with a
set of uncertain ‘guesstimates’ regarding the chance of approval, the size of the potential market, the
pricing strategy of the company etc.
Inevitably, this uncertainty about future earnings leads to many differing opinions and different price
targets amongst investors, and as a consequence, large price volatility (Rozelman 2011). However, one
thing is certain: a lot of the approval uncertainty is taken away once the phase II hurdle is taken. A
successful phase II study is a major value creating event as the experimental product has shown to be
both safe (demonstrated in phase I) and to work (demonstrated in phase II).
Phase III trials are typically the most expensive part of clinical trials (Roy 2012). A negative phase III trial
is often perceived as a very negative event for a life science company as it typically means a huge
investment needs to be written down completely to zero. But even after a successful phase III study,
uncertainty remains. The final decision to approve or refuse a product is made by the regulatory agency.
On average, a small life science company, having a single product, who decides to file at the regulatory
agency after a successful phase III clinical trial still has a 10-20% chance of having the filed product being
rejected. So, an investor is often confronted with a discrete set of outcomes. There is either a big chance
of an approval and subsequent earnings, albeit an uncertain amount, or a small chance of refusal and
certainly no earnings.
Decisions by regulatory agencies can heavily affect stock prices of the product developing companies,
especially when the company is relatively small. After all, the regulatory agencies decide whether the
made investments are allowed to generate revenues or not. Recently, the FDA ruled negatively twice on
25 February 2013. Affymax’ anemia drug Omontys was withdrawn under pressure by the FDA because
patients complained about allergic reactions. The stock price plummeted 85% to $2.40. Dynavax

10|Investing in an environment of regulatory uncertainty
Technologies’ Hepatitis B vaccine was refused by the FDA because Dynavax failed to effectively
demonstrate the safe of the vaccine. The stock price was sent down 33% to $1.99 (Siddiqui 2013).
2.2. STOCK PRICE RESPONSES TO REGULATORY DECISIONS
2.2.1. STOCK PRICE ANTICIPATION
Knowledge of non-public clinical trial results or regulatory decisions before they are made public can
offer a ‘free lunch’ opportunity for investors having access to this non-public information. However,
when many people have access to this non-public information, a buying frenzy can affect the price of a
drug company’s stock in the runup to the actual announcement. Several scientific studies have tried to
systematically investigate the role of insider trading in pharmaceutical and biotechnology companies.
Rothenstein and colleagues investigated the public announcements from 23 positive clinical trials, 41
positive FDA regulatory decisions (“winners”), 36 negative clinical trials, and 9 negative FDA regulatory
decisions (“losers”) between 2000 and 2009. All the trial results and regulatory decisions were regarding
experimental anticancer drugs developed by the companies. The average stock price change from 60
days before the announcement to the actual announcement day was positive for the winners and
negative for the losers. After the decision, the stock price increased on average for the winners and
decreased for the losers (Rothenstein, Tomlinson et al. 2011). Overgaard and colleagues analysed the
stock price anticipation of biotechnology stocks to 98 phase III trial decisions and 49 FDA regulatory
decisions between 1990 and 1998. The average stock price change from 120 to 3 days before public
announcement was significantly higher for the winners compared to the losers (Overgaard, van den
Broek et al. 2000).
Both studies concluded that insider trading is the most likely explanation for the observed stock price
anticipation prior to the announcement. Recently, researchers from academia have raised their concern
about hedge funds and expert network firms which are constantly probing doctors, researchs and other
academics for non-public information related to the clinical research (Ledford 2013). However, a recent
study contradicts the idea that insider trading is responsible for the observed stock price anticipation. In
his study, Goozner explains that it possibly is just a form of market efficiency: “The majority of the effect
is probably unconscious. It’s just leaking of information that eventually finds its way into the market
place.” He continues to explain that the observed decrease of the stock price of losers in anticipation of
the decisions, especially for small companies, is just another form of market efficiency: “All of these
micro-companies in phase III trials have been shopped to big companies. The ones that aren’t sold are
Stock price responses to regulatory decisions|11
the wallflowers, the leftovers. The good companies get bought, while the little companies doing phase III
trials on their own are the ones probably headed for failure. [...] The success rate of 78% for large-cap
companies, while the small-cap companies had no positive outcomes, was remarkable. The conclusion is
to short these small-cap companies [...] when they have a drug in phase III clinical trials.” (Goozner
2011).
It is Important to stress the difference between announcements of clinical trial results (e.g. phase III
results) and announcements of regulatory agency decisions (e.g. FDA annoucements). Clinical trial
results are much more prone to insider trading as there are more people involved and the chance of
information leakage is always present. Furthermore, the day on which the non-public information will
become public (i.e. the company announces the results) is much more uncertain, forcing an investor to
act relatively fast to the non-public information. Decisions by the regulatory agencies on the other hand
are taken relatively quick, mostly on a predetermined day, by a small group of people, seriously reducing
the chance of information leakage. This is also demonstrated in the studies by Rothenstein and
Overgaard. In both studies results were more outspoken in the case of the clinical trials, suggesting that
insider trading happens more intensively using non-public clinical trial results than using regulatory
decisions.
2.2.2. STOCK PRICE RESPONSE
Many researchers explored the effects of FDA drug authorizations on stock prices. A recent study using
344 FDA events revealed a significant wealth effect of 1.56% following a positive FDA announcement.
This study also found that financial market losses from product development failures are much larger
than financial market gains from product development successes; indicating an asymmetry in the
response of financial markets (Sharma and Lacey 2004). A more recent event study demonstrated stock
prices showing significant abnormal returns following a final FDA decision (Sarkar and de Jong 2006). A
study conducted on a sample of life science companies from the United Kingdom also found positive
stock price reactions to marketing authorization (Dedman, Lin et al. 2008).
Researchers tried to identify the cause of this observed stock price increase following approval by a
regulatory body. The price reactions are not solely attributable to the positive information content but
also reflect additional effects (Himmelmann and Schiereck 2012). As investors face many different
investment alternatives, they primarily consider those that caught their attention. Increased media
presence and a high level of attention affect buying behaviour and generate additional trading volume.

12|Investing in an environment of regulatory uncertainty
This attention-based stock demand in turn can push stock prices higher (Barber and Odean 2011). Other
researchers concluded positive FDA announcements are accompanied by an increased trading liquidity
which can result in higher stock prices (Himmelmann and Schiereck 2012). Liquidity effects are larger for
smaller companies, so it would be reasonable to expect smaller companies to have larger stock price
increases following a positive regulatory announcement (Lakonishok, Shleifer et al. 1992).
2.2.3. INSIDER TRADING SCANDALS
Recently, many insider trading cases related to the life science industry have surfaced. There are two
reasons for this. Firstly, academic research is identifying new methods to detect potential insider trading
cases (Berkman, Koch et al. 2012). Secondly, the Securities and Exchange Commission (SEC), the US
federal agency responsible for enforcing the federal securities laws and regulating the securities
industry, together with the Federal Bureau of Investigations (FBI), started investigating and prosecuting
much more leads than in the past (Del Guercio, Odders-White et al. 2011). Of special interest are the so-
called expert network firms which often employ prominent doctors and company executives as
consultants. Several technology executives who consulted for expert network firms have already
pleaded guilty to insider trading (Scannel 2012). Furthermore, the financial crisis has wiped out many
investment companies and individuals, resulting in rogue behaviour in a desperate attempt to survive
financially. Two examples demonstrate this hypothesis.
In April 2011, James Fan, a manager of clinical programming at Seattle Genetics, committed suicide in
the parking of Newark Airport after the SEC discovered he had illegally tipped his brother about the
results of a clinical trial at Seattle Genetics. He helped his brother gain $200,000, who needed the funds
as he found himself deep under water after the real estate market collapsed in 2008 (Voreacos 2012).
In November 2012, the SEC alleged that $276 million in illegal profits or avoided losses were made by CR
Intrinsic Investors by trading ahead of negative news in July 2008. The negative news included a clinical
trial involving an Alzheimer’s drug developed by Elan and Wyeth. A professor of neurology in an expert
network firm at the University of Michigan Medical School tipped off a hedge fund run by CR Intrinsic
Investors to liquidate $700 million in positions in Elan and Wyeth, as well as establish $960 million in
short positions against the companies’ shares (Goldstein 2012; Voreacos 2012)6.
6 This scandal was considered one of the most high profile insider trading cases of Wall Street as CR Intrinsic
Investors is part of SAC Capital Advisors, a household name of Wall Street. At the end of 2008, the portfolio manager at CR Intrinsic Investors received a $9.3 million bonus, a significant portion of which was attributable to the drug-trial trades. The professor involved received more than $100,000 in expert network consulting fees.

Research focus|13
2.3. RESEARCH FOCUS
Existing research almost exclusively focusses on stock responses of National Association of Securities
Dealers Automated Quotations (NASDAQ) listed companies to clinical trial results or announcements
made by the FDA. Research on stock responses of public companies listed on other exchanges such as
the New York Stock Exchange (NYSE) or to announcements of other agencies such as the EMEA are very
limited. I will try to fill this void by analyzing both NASDAQ and NYSE listed stocks in response to both
FDA and EMEA announcements. I will extend my study to three periods: 1) the period preceding the
actual announcement, 2) the days immediately following the announcements, and 3) the period
following the actual announcement.
.


Analysis timeline|15
3. DATASETS AND ANALYSIS FRAMEWORK
3.1. ANALYSIS TIMELINE
The exact dates of both the FDA and EMEA decisions are easy to be identified as there is no ambiguity in
regards to the actual announcement date. The decisions made by the regulatory agencies are typically
the result of a vote of a small panel of experts. Shortly after this vote, the decision is made public via
either the FDA or the EMEA website.
However, the announcement can be made before a market opens or after a market closed. This
problem is further complicated by the differences in time zones of ‘overseas decisions’. For example, an
FDA announcement at 2PM PST concerning a drug of a company listed on a European exchange has no
immediate effect on the stock price of the European company because the European stock market is
already closed. A solution to overcome this problem is to take a look at the cumulative return of day 0
(the actual day of the announcement) and day +1 (the first day post-announcement). In Figure 2, this
would correspond with the window [T0, T3] and I will call this the ‘announcement window’.
The period directly following the announcement window is the ‘post-announcement window’. The
period preceding the announcement window is the ‘anticipation window’. The ‘training window’ is a
long period preceding both the event window and the anticipation window, which is used to determine
normal behaviour of the stock price. An overview is given in Figure 2.
Figure 2: Overview of the timeline structure and different windows of an announcement event.
3.2. ANNOUNCEMENT EVENTS
Earlier studies by Overgaard and Rothenstein focussed on the periods 1990-1998 and 2000-2009. I will
restrict my analyses to announcements made by the FDA and EMEA between January 2008 and
September 2012.

16|Datasets and analysis framework
3.2.1. FDA ANNOUNCEMENTS
The FDA is responsible for different types of product filings. The two most important filings are New
Drug Application (NDA) filings and Biological License Application (BLA) filings. The NDA is a document
submitted to the FDA to request approval to market a new drug. The BLA is a document submitted to
the FDA to request approval to market a biologic. Moreover, the BLA is equivalent to an NDA for a
biologic which can be a therapeutic DNA plasmid product, therapeutic synthetic peptide product of 40
or fewer amino acids, monoclonal antibody product for in vivo use, or therapeutic recombinant DNA-
derived product (FDA 2013). In short, these filings correspond with the most innovative products and
are of most importance for a company’s earning potential and corresponding stock price. An overview of
the BLA and NDA decisions are available from the FDA website7. For the period January 2008 –
September 2012, 438 positive NDA and BLA decisions were recorded on the FDA website. Duplicate
entries (e.g. simultaneous approval of different formulations or dosages) were removed from the data
set.
Industry representatives caution that findings or data on refused products containing confidential
company information could harm competition if made widely available (Heavey 2012). However,
doctors and consumers could benefit from disclosure of the refused products. The FDA is looking into
ways the agency can make its regulatory decisions more transparent and systematically report both
approvals and refusals. At the moment, however, products refused by the FDA are not officially publicly
disclosed by the FDA nor systematically listed on the FDA website. Nevertheless, companies typically
disclose it publicly when they receive a Complete Response Letter (CRL) from the FDA indicating a
certain product was refused. An internet search using keywords such as ‘CRL overview’, ‘FDA refusal
overview’, and ‘refused FDA drugs’ yielded 69 negative FDA announcement events8.
3.2.2. EMEA ANNOUNCEMENTS
Similar to the FDA, the EMEA lists several different types of approvals on a public website. Unlike the
FDA, however, the EMEA lists approved, refused, suspended, and withdrawn products. Products for
human use (EMEA/H/C designation) are new drugs designed for human consumption and are the
products of importance in this study. A list of approval and refusal events was obtained from the EMEA
7 A list of all the FDA approved products (NDA and BLA) can be downloaded per month from the following URL:
http://www.accessdata.fda.gov/scripts/cder/drugsatfda/index.cfm?fuseaction=Reports.NewOriginalNDA. 8 Several websites list specific overviews of drugs refused by the FDA. Two excellent overview websites are the
Vaughns website and the RTTnews website, available from respectively: http://www.vaughns-1-pagers.com/medicine/prescription-drugs-rejected.htm and http://www.rttnews.com/CorpInfo/FDACalendar.aspx.

Announcement events|17
website9 as described in earlier studies (Downing, Aminawung et al. 2012). In total, 326 positive and 12
negative EMEA announcements were recorded between January 2008 and September 2012. Similar to
the FDA announcements, duplicate entries were removed from the data set.
3.2.3. LINKING ANNOUNCEMENTS TO STOCK TICKERS
Each of the FDA and EMEA announcements was linked to a publicly traded company if possible; private
companies were discarded from the dataset. When a company is listed on multiple exchanges (e.g.
Novartis is traded both on the Swiss exchange and on NYSE as SIX:NOVN and NYSE:NVS
respectively), the American ticker was taken.
3.2.4. SAMPLE SELECTION
Of the 438 positive FDA announcements, 130 could be associated with a private company.
Consequently, these ‘private announcements’ were removed from the dataset. If a company had two
different drugs with positive or negative announcements close to each other, only the earlier
announcement was retained in the dataset.
Regulatory decisions on products developed by companies which entered the market through an initial
public offering (IPO) close to the actual announcement day were removed from the dataset. Companies
often use the attention and momentum of a positive FDA or EMEA announcement to raise capital
through an IPO. This was of special importance in the aftermath of the recent financial crisis where
investor sentiment was low and the number of IPOs per year was at a record low10. A company trying to
have an IPO could use any good news or momentum to open up the IPO window (Gaoa, Ritterb et al.
2012). However, despite the frequent positive FDA decisions, many of the recent biotech IPOs were no
great successes as companies frequently had to slash their IPO price forks or lower the amount of shares
to be floated11.
These IPO related announcements were excluded from the dataset as there is frequently large stock
price volatility attributable to the IPO event, rather than the announcement event. Data availability
9 http://www.ema.europa.eu/ema/index.jsp?curl=pages/medicines/landing/epar_search.jsp
10 Between 1988 and 2011, there were on average 32.5 IPOs per year on the NASDAQ, NYSE, and Amex exchanges
combined. In 2008, there were only 7 IPOs, in 2009 there were 12, in 2010 45, and in 2011 22. 11
Supernus Pharmaceuticals planned to sell 5.8 million shares and hoped to fetch as much as $12 or $14 a piece. After being postponed more than sixe months, 10 million shares were sold at $5 a share in the beginning of January 2012. At the end of Novermber 2010, Zogenix raised a total of $56 million by offering 14 million shares at $4 a share. However, The company initially planned to raise close to $90 million by offering 6 million shares at $12 and $14 a share. In August 2010, Trius Therapeutics offered 10 millions shares at $5 a share, after initially planning to sell six million shares at a price range between $12 and $14 a share.

18|Datasets and analysis framework
problems also occur as there is no training window or anticipation window data available as the shares
were not yet floating at that time.
Companies which were subject of a takeover or merger during the January 2008 – September 2012
period were also removed from the dataset as these stocks also suffer from large stock price volatility
and problems with data availability once the merger is finalised.
After cleansing the dataset, approximately 70% of the positive FDA announcements can be linked to a
publicly traded company. Approximately 50% and 20% of these public companies is listed on the NYSE
and NASDAQ respectively (see Appendix 4 for more detailed information). Numbers are fairly similar for
EMEA announcements (Appendix 5). As the largest portion of the announcement events can be linked to
NYSE and NASDAQ listed companies, this thesis will exclusively focus on the stock price responses of
companies listed on these two exchanges. In total, 403 events are studied of which a breakdown per
exchange and agency is given in Table 1.
Table 1: Overview of the announcement events between January 2008 and September 2012 per agency and exchange.
FDA EMEA Total
Positive Negative Total Positive Negative Total
NASDAQ 48 43 91 16 3 19 110 NYSE 140 8 148 142 3 145 293
Total 188 51 239 158 6 164 403
Of the 403 announcements made between January 2008 and September 2012, 346 were positive and 49
negative. Remarkable differences appear when the announcements are separated per agency and per
exchange on which the companies are publicly listed (Table 1). Forty-eight FDA announcements on drugs
of NASDAQ listed companies were positive compared to 43 negative announcements. However, FDA
announcements on drugs of NYSE listed companies were allmost exclusively positive. Both the number
of positive and negative EMEA announcements of drugs developed by NASDAQ listed companies is
lower than is the case with FDA announcements. The FDA and EMEA announcements of drugs
developed by NYSE listed companies are similar.
Several possible explanations exist for this observed difference between NASDAQ and NYSE listed drug
developers. First, I manually aggregated the negative FDA announcements from different websites
which mainly focus on companies developing innovative (and hence controversial) therapies with a
potential significant impact on the stock price; such (small) companies are typically listed on NASDAQ.
Second, the market capitalization of companies with approved products is typically larger than the

Announcement events|19
market capitalization of companies with failed drug candidates. Larger (pharmaceutical) companies
typically list on NYSE, rather than on NASDAQ (Goozner 2011). Third, closely related to the previous
point made, big (pharmaceutical) companies have had many successes in the past and have more
experience in properly designing and carrying out clinical trials and filing for approval at the regulatory
agencies. As a result, the success rate increases with company size and repeated approval of other drugs
(Sarkar and de Jong 2006). Fourth, a large company like Pfizer or Novartis might easily discontinue
promising project in the later stages of clinical trials, even if this means a significant loss of invested
money. Indeed, the big pharmaceutical companies have many approved cash flow generating products
in the market providing sufficient buffers to overcome occasional setbacks. Small NASDAQ companies,
however, typically are developing one or a few products and are cash flow negative. These companies
might be forced to file not-so-promising drugs for approval in a desperate attempt as the only
alternative is to discontinue their only potential source of future income. Fifth, NASDAQ listed
companies typically develop more experimental or more innovative products which have a bigger
chance of failure as the FDA typically does not have a standard ‘roadmap’ for such products12.
The observed difference between the FDA and EMEA is a little more difficult to explain. However, there
are some intuitively plausible explanations. First, NASDAQ listed companies are typically smaller than
NYSE listed companies and as a consequence will focus on their US home market rather than on Europe,
hence the smaller amount of ‘NASDAQ announcements’ by the EMEA. It is not uncommon for a small US
based company to file a product locally at the FDA and license out the rights abroad to another
company, frequently a large pharmaceutical company with an established (global) distribution network.
Second, the NASDAQ is typically faster than the EMEA to approve products (FDA 2010), hence a US
based company will normally first file at the FDA to have a quick answer and then proceed to file at the
EMEA if the filing was successful. Third, large pharmaceutical companies with headquarters outside the
US are typically listed on multiple exchanges, including the NYSE. These large companies can successfully
file products simultaneously at both the FDA and EMEA. Hence, ‘NYSE announcements’ are almost
identical for the FDA and EMA.
12
ChondroCelect, developed by the Belgian company Tigenix, is the first cell-based product to be approved by the EMEA as an Advanced Medicinal Therapy. Rather than being a standard drug, cells are removed from a patient’s knee, treated, and reinjected into the knee. The treated cells than cure the cartilage damage inside the patient’s knee. As this type of therapy was completely new, no standard FDA roadmap existed, and although the product was already approved by the EMEA and is commercially available in Europe, the product was refused by the FDA.
20|Datasets and analysis framework
Throughout this thesis I will refer to companies listed on the NASDAQ which have products approved by
the FDA as ‘FDA positive NASDAQ Assets’, companies listed on the NYSE which have products refused by
the EMEA as ‘EMEA negative NYSE Assets’ etc.
3.3. STOCK PRICE DATA AND INDEX DATA
3.3.1. STOCK PRICE DATA
Daily stock price information for all the NYSE and NASDAQ Assets was retrieved from the Finance Yahoo
website using an automated retrieval strategy13. Through a combination of existing software packages
and a set of custom made packages, the stock price information was stored in a local relational MySQL
database, optimized for the analyses described in this thesis.
3.3.2. INDEX DATA
In many analyses, daily stock returns need to be compared to a reference index or analysed using the
return on a reference index. For both the NYSE and the NASDAQ, a broad index and smaller life science
related index were selected (Table 2). Daily values of these indexes was retrieved using a strategy similar
to the one explained above.
Table 2: Overview of the used reference indexes.
Index name Ticker Exchange Index type
NYSE Composite (DJ) Index ^NYA NYSE Broad NYSE ARCA Pharmaceutical Index ^DRG NYSE Small / life science NASDAQ Composite Index ^IXIC NASDAQ Broad NASDAQ Biotechnology Index ^NBI NASDAQ Small / life science
3.4. DATA ANALYSIS FRAMEWORK
A large quantity of data needed to be analysed and aggregated, and this for different agencies (FDA and
EMEA), different exchanges (NASDAQ and NYSE), and different announcements (positive and negative).
To ensure an identical analysis methodology over all different datasets, avoid human errors, speed up
analyses, and automate analyses in general, an analysis framework was developed in Perl and R which
allows each of these goals to be met. A more detailed overview of the analysis framework is given in
Appendix 6.
13
Stock price information can manually be downloaded for each stock from the Finance Yahoo website: http://finance.yahoo.com. However, there are automated strategies available which can automate data retrieval.
A good example is the Finance::QuoteHist Perl package which makes use of the Finance Yahoo CSV API, explained in detail at https://code.google.com/p/yahoo-finance-managed/wiki/csvHistQuotesDownload.

Methodology|21
4. STOCK PRICE ANTICIPATION – AVERAGED CUMULATIVE RETURNS Earlier research indicated insider trading might be a frequent phenomenon in the life science industry.
This is often demonstrated by stock price appreciation prior to positive news and stock price
depreciation prior to negative news regarding clinical trials or regulatory announcements. This section
investigates stock price behaviour of NYSE and NASDAQ listed companies prior to FDA and EMEA
announcements.
4.1. METHODOLOGY
4.1.1. MEAN AND VARIANCE OF CUMULATIVE RETURNS
Day 0 is the day the final FDA or EMEA decision is announced. The stock price of the companies which
developed the products being approved or refused were recorded for each of the 60 consecutive trading
days before day 0, day 0 itself, and the 15 consecutive trading days following day 0. This corresponds
with approximately four calendar months excluding weekends and holidays. This strategy is similar to
the one applied in a number of earlier studies on insider trading and/or stock price anticipation
(Rothenstein, Tomlinson et al. 2011).
The rate of return for an individual stock was calculated as a buy and hold holding period return (HPR)
assuming the stock was purchased at day -61 using the following formula:
(1)
where is the closing price of stock at day -61 and the closing price of stock at day . Using
this formula, the real cumulative return on each trading day was calculated assuming the stock was
purchased at day -61. Assuming there are announcement events and consequently stock price
evolutions to be analysed, the cumulative returns can be represented using the following matrix
notation:
[
]. (2)
The average stock price evolution of the entire set of announcement events can be approximated by
calculating averaged cumulative returns, which are obtained by averaging over each column in the
matrix in equation (2) using the following formula:

22|Stock price anticipation – averaged cumulative returns
∑
(3)
where represents the average cumulative return at day ; eventually resulting in a single series of
average cumulative returns:
[ ]. (4)
The returns of NASDAQ and NYSE listed stocks were compared to returns (calculated in a similar fashion)
of appropriate indices. Returns of NASDAQ Assets were compared to returns of both the NASDAQ
Biotechnology Index (^NBI) and the NASDAQ Composite Index (^IXIC). Returns of NYSE Assets were
compared to the NYSE Composite Index (^NYA) and the NYSE Pharmaceutical Index (^DRG).
Similarly, the variance for each trading day can be calculated over each of the announcement events.
This can be represented by calculating the sample variance over each column of the matrix in equation
(2) using the following formula:
∑( )
(5)
where
represents the variance of the cumulative returns at day calculated over announcement
events.
4.1.2. TESTING DIFFERENCES FOR SIGNIFICANCE
The research question is whether the average cumulative return of the FDA positive NASDAQ Assets at a
specific day is larger than the average cumulative return of a specific reference index. This can be
statistically tested using a standard t-test. However, the standard t-test comes with a series of
conditions which need to be met before it can be applied. The most important conditions are the
equality of variances of the compared samples and normality of the data.
However, the standard t-test is not valid in case any of the aforementioned two conditions are not met.
Equality of variances can be tested using Bartlett’s test (Bartlett 1937). Furthermore, it is known that
daily stock returns, especially daily NASDAQ returns, are not normally distributed (Brown and Warner
1985; De Jong 2007). This is also clearly demonstrated in Appendix 7. Even in case the variances would
be identical, the non-parametric Wilcoxon rank-sum test (also known as the Mann–Whitney U test) is a
much safer method to test equality of the cumulative means (Wilcoxon 1945).

Results and discussion|23
4.2. RESULTS AND DISCUSSION
4.2.1. FDA - NASDAQ
The average cumulative returns for each trading day were calculated separately for positive and
negative FDA and EMEA announcements and separately for NASDAQ and NYSE Assets. Further sections
will also have these different subsections.
The average cumulative return at day -1 for the FDA positive NASDAQ Assets is 23.76%, compared to
7.63% and 3.76% for the ^NBI and ^IXIC respectively (Table 3). The variances of the cumulative returns
at day -1 are 29.87%, 0.99%, and 1.13% for the NASDAQ Assets, ^IXIC and ^NBI respectively. The
variance at day -1 of the NASDAQ Assets differs from both the ^NBI (p < 0.0001) and the ^IXIC (p <
0.0001). The variance of both indexes does not differ (p = 0.64). Variances also differ in the FDA – NYSE,
EMEA – NASDAQ, and EMEA – NYSE case (data not shown). Clearly, using the Wilcoxon rank-sum test is
the safer method to test for equality of the means and consequently this test will be used throughout
this section.
The return of the FDA positive NASDAQ Assets at day -1 is significantly higher than the returns of the
^NBI (p = 0.0004) and the ^IXIC (p < 0.0001). One explanation for this observation could be that the
stocks under consideration systematically outperform the reference indexes, independently of the
announcement events. To test whether this positive and significant anticipation is indeed
announcement event-driven, NASDAQ Asset returns were compared to the performance of a random
index generated using the same NASDAQ listed companies but random dates. The returns at day -1 are
significantly larger for the NASDAQ Assets compared to this random index (p = 0.0291), from which can
be concluded the observed stock price anticipation is indeed announcement event-driven.
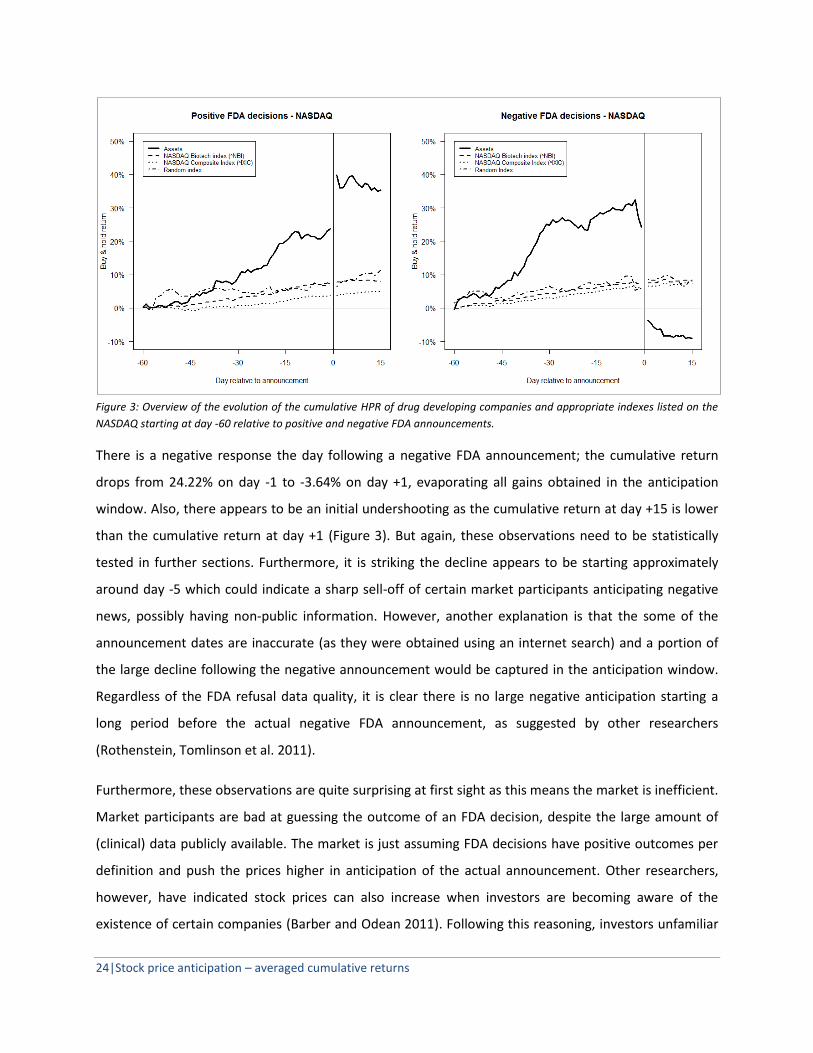
Next to the positive anticipation, there is a clear positive response the day following a positive FDA
announcement; the average cumulative return goes from 23.76% on day -1 to 39.91% on day +1. At first
sight, there appears to be an initial overshoot as the cumulative return at day +15 is slightly lower than
the cumulative return at day +1 (Figure 3). However, it is difficult to statistically test these observations
in this framework and these observations will be tested in further sections.
The average cumulative return at day -1 for FDA negative NASDAQ Assets is 24.22%, compared to 7.51%
and 6.20% for the ^NBI and ^IXIC respectively (Table 3). The cumulative return at day -1 is higher than
the return of both the ^NBI (p = 0.0002), the ^IXIC (p = 0.0003), and a random index generated in a
similar fashion as described before (p = 0.0004).
24|Stock price anticipation – averaged cumulative returns
Figure 3: Overview of the evolution of the cumulative HPR of drug developing companies and appropriate indexes listed on the
NASDAQ starting at day -60 relative to positive and negative FDA announcements.
There is a negative response the day following a negative FDA announcement; the cumulative return
drops from 24.22% on day -1 to -3.64% on day +1, evaporating all gains obtained in the anticipation
window. Also, there appears to be an initial undershooting as the cumulative return at day +15 is lower
than the cumulative return at day +1 (Figure 3). But again, these observations need to be statistically
tested in further sections. Furthermore, it is striking the decline appears to be starting approximately
around day -5 which could indicate a sharp sell-off of certain market participants anticipating negative
news, possibly having non-public information. However, another explanation is that the some of the
announcement dates are inaccurate (as they were obtained using an internet search) and a portion of
the large decline following the negative announcement would be captured in the anticipation window.
Regardless of the FDA refusal data quality, it is clear there is no large negative anticipation starting a
long period before the actual negative FDA announcement, as suggested by other researchers
(Rothenstein, Tomlinson et al. 2011).
Furthermore, these observations are quite surprising at first sight as this means the market is inefficient.
Market participants are bad at guessing the outcome of an FDA decision, despite the large amount of
(clinical) data publicly available. The market is just assuming FDA decisions have positive outcomes per
definition and push the prices higher in anticipation of the actual announcement. Other researchers,
however, have indicated stock prices can also increase when investors are becoming aware of the
existence of certain companies (Barber and Odean 2011). Following this reasoning, investors unfamiliar

Results and discussion|25
with a particular life science company might become informed about the company as the media is
frequently indicating important FDA decisions are due. This awareness might cause an additional stock
demand and push stock prices higher.
The cumulative return at day -1 is similar for both the positive and negative FDA announcements; the
returns do not differ statistically (p-value = 0.555). This also means insider trading does not appear to be
a significant problem in regards to FDA decisions, whereas it can be (and probably is) a larger problem in
regards to the results of phase II/III clinical trials (Rothenstein, Tomlinson et al. 2011). This makes sense
once one realizes the FDA decision is a ruling based on the voting of a small and independent panel
compared to clinical trials which is a lengthy process involving many persons.
At first sight, this market inefficiency offers a ‘free lunch’ opportunity by going ‘long’ at day -60, closing
the position close to the announcement date, going ‘short’ at day +1 and closing the position at for
example day +15. The results of such, apparently risk-free, trading strategies will be investigated into
more detail in further sections.
Table 3: Average cumulative HPR at day -1, +1, and +15 assuming the stock was bought at day -61.
FDA EMEA
positive negative positive negative
-1 +1 +15 -1 +1 +15 -1 +1 +15 -1 +1 +15
NASDAQ 23.76 39.91 35.37 24.22 -3.64 -8.99 14.69 13.87 19.27 5.87 4.59 10.48 ^NBI 7.63* 7.79 7.91 7.51* 7.63 8.83 2.07 2.36 2.07 2.73 2.52 7.32 ^IXIC 3.76* 3.79 4.97 6.20* 6.52 7.27 -0.09 -0.17 0.17 8.38 6.32 7.26
NYSE 1.75 2.03 2.96 -0.57 -0.18 -0.25 2.88* 2.73 2.02 -2.44 -1.64 -3.33 ^DRG 0.92* 0.88 1.29 -0.30 -0.87 -1.06 1.66 1.43 1.61 -1.85 -2.77 -2.02 ^NYA 0.14* 0.49 0.66 2.44 1.88 1.33 0.13 -0.33 0.14 -10.82 -11.10 -7.92
NASDAQ indicates the averages of the ‘NASDAQ Assets’, NYSE indicates the averages of the ‘NYSE Assets’. All numbers are percentages.
* Indicates the average cumulative return of the Index differs significantly from the average cumulative return of the Assets (Wilcoxon rank-sum test, 5%); only tested at day -1.
4.2.2. FDA - NYSE
The average cumulative return at day -1 for the FDA positive NYSE Assets is 1.75%, compared to 0.92%
and 0.14% for the ^DRG and ^NYA respectively (Table 3). Although the average cumulative return of the
NYSE Assets at day -1 is only slightly higher than the return of both indexes, the return is statistically
higher than the return of the ^DRG (p = 0.0059) and the ^NYA (p = 0.0099).
There appears to be only a slight response to the actual announcement as the cumulative return of the
Assets at day +1 only increased to 2.03%, slightly higher than the cumulative return at day -1 (Figure 4).
Again, this will be evaluated into more detail in further sections.
26|Stock price anticipation – averaged cumulative returns
Figure 4: Overview of the evolution of the cumulative HPR of drug developing companies and appropriate indexes listed on the
NYSE starting at day -60 relative to positive FDA announcements. The subsample refers to the products which are NDA type ‘1’
and review classification ‘Standard’.
Different explanations can be proposed for the observed difference between the FDA positive NASDAQ
and NYSE Assets. First, NYSE listed companies are larger and frequently have a large number of products
already in the market. Individual positive (or negative) announcements have small effects on the total
revenue and profits of a company. Second, many of the NYSE listed companies included in the dataset
produce low profit products or therapies such as medical devices (e.g. baxters), food additives (e.g.
vitamins), and generic drugs which have a relative small market potential.
In an effort to eliminate these ‘low profit FDA announcements’ from the dataset, a subsampling was
carried out. This subsample only contained completely new drugs (NDA type ‘1’) which followed the
standard procedure (review classification ‘S’)14. In total, 23 such announcements were present in the
sample. The average cumulative return at day -1 is larger than return obtained using the full dataset
(Figure 4). The average cumulative return of the NYSE Assets at day -1 is significantly larger (despite the
lower sample size and power) than the cumulative return of ^NYA (p = 0.0275). However, the return of
the Assets is not statistically larger than the return of the ^DRG (p = 0.0756). This is not surprising as the
14
The FDA categorizes new drug applications (NDA) on a 1 to 6 scale according to the novely. For example, a ‘1’ is an application for a completely new molecular entity (NME), a ‘5’ is an application for a new manufacturer willing to produce an already approved product and a ‘6’ is an application to use an already approved drug in a new indication. Review classification is either standard review (‘S’) or priority review (‘P’). A detailed overview of the classifications is available at http://tiny.cc/wzxttw.

Results and discussion|27
^DRG is an index composed of 16 large pharmaceutical companies (see Appendix 8) which are mostly
the companies present in this specific subsample.
The average cumulative return at day -1 for the FDA negative NYSE Assets is -0.57%, compared to -0.30%
and 2.44% for the ^DRG and ^NYA respectively. As the sample size is relatively small, the non-
parametric statistical testing does not yield any significant results. The return at day -1 is not statistically
larger than the return of both the ^DRG and the ^NYA (p-values are both 1.00), nor does it statistically
differ from the anticipation observed in the FDA positive NYSE Assets (p = 0.7121).
4.2.3. EMEA – NASDAQ
The average cumulative return at day -1 for the EMEA positive NASDAQ Assets is 14.69% compared to
2.07% and -0.09% for the ^NBI and ^IXIC respectively (Table 3). However, the return is not significantly
larger than the return of both the ^NBI (p = 0.1908) and ^IXIC (p = 0.0705). This is largely due to the low
number of observations (n=16) included in the analysis making the statistical testing not robust enough.
The cumulative response of the NASDAQ Assets at day -1 is also not statistically larger than the return of
the random generated index (p = 0.3478).
Figure 5: Overview of the evolution of the cumulative HPR of drug developing companies and appropriate indexes listed on the
NASDAQ starting at day -60 relative to positive and negative EMEA announcements.
The response on the day following the public announcement is much smaller than the response
observed for the NASDAQ Assets in response to FDA announcements. Furthermore, the largest portion
of this assumed anticipation is caused by an event happening around day -50 (Figure 5). This can be
explained by the structure of the reviewing process applied by the EMEA. Prior to the final decision, the

28|Stock price anticipation – averaged cumulative returns
EMEA Committee for Medicinal Products for Human Use (CHMP) decides on a non-binding opinion15 and
makes this opinion public. The EMEA then issues a final decision approximately two months later. The -
50 day (trading days) coincides with this period wherein the CHMP issues the opinion. Apparently,
market participants process the opinion issued by the CHMP as it were a final decision and treat the final
decision made by the EMEA as a non-event.
The response of NASDAQ assets on negative EMEA decisions is difficult to assess as there were only
three assets available and no clear pattern emerges from the data, as can be seen in Figure 5.
Consequently, this dataset will also not be analysed in furhter sections either.
4.2.4. EMEA - NYSE
The average cumulative return at day -1 for the EMEA positive NYSE Assets is 2.88% compared to 1.66%
and 0.13% for the ^NBI and ^IXIC respectively (Table 3). This return is significantly larger than the return
of the ^DRG (p = 0.0019), but not significantly larger than the return of the ^IXIC (p = 0.1404). Results for
the subsample (identical to the subsampling strategy carried out for the FDA positive NYSE Asssets) are
very similar to the results obtained in using the full dataset (Figure 6).
Figure 6: Overview of the evolution of the cumulative HPR of drug developing companies and appropriate indexes listed on the
NYSE starting at day -60 relative to positive EMEA announcements. The subsample refers to the products which are NDA type ‘1’
and review classification ‘Standard’.
15
The CHMP Opinion is issued by the EMEA and is a non-final and non-binding opinion based on the submitted application file as it is. Companies can append or modify the application file in case the opinion would be negative. 67 days later, based on the appended or modified file, the CHMP issues a Final Commission Decision. A positive opinion is typically followed by a positive final decision.

Concluding remarks|29
The relatively clear spike at about day -50 observed in Figure 5 is not present in the case of EMEA
positive NYSE announcements. The response on the day following the public announcement is also
much smaller than the response observed for the NASDAQ Assets in response to the FDA
announcements. The response of NYSE Assets to negative EMEA decisions is difficult to assess as only
three announcements are available and no clear pattern emerges from the data (data not shown).
4.3. CONCLUDING REMARKS
Over a 60 trading days window prior to an FDA or EMEA announcement, NASDAQ listed companies
outperform both a broad market index and a more specific life science index. NYSE listed companies
outperform a broad market index and a more specific life science index in case of positive FDA
announcements. Both NYSE and NASDAQ listed companies do not systematically outperform different
reference indexes in anticipation of EMEA announcements.
There is no clear evidence of frequent and widespread insider trading occuring in anticipation of FDA or
EMEA announcements. However, in some cases stock prices depreciate prior to negative FDA
announcements, only partially offsetting the anticipation increases gained. There is no long-term
underperformance prior to negative annoucements.
There are some problems with the strategy described in this section. First of all, this strategy does not
allow stock price responses on the announcement day or the period following the announcement day to
be analysed without recalculating all individual holding period returns. Furthermore, this strategy does
not correct for global market movements or different exposures of companies to market movements
(‘beta’). For example, imagine a situation where one company experiences a stock price increase of 50 %
and 10 stocks a stock price decrease of 1%. Now also assume the former company has a volatility of 50%
and the latter companies a volatility of 0.5%. Clearly the 1% stock price decreases are more important
than the 50% increase of the more volatile company. However, this would not be obvious using the
strategy outlined in this section. These problems will be addressed in a further section using the event
study methodology.

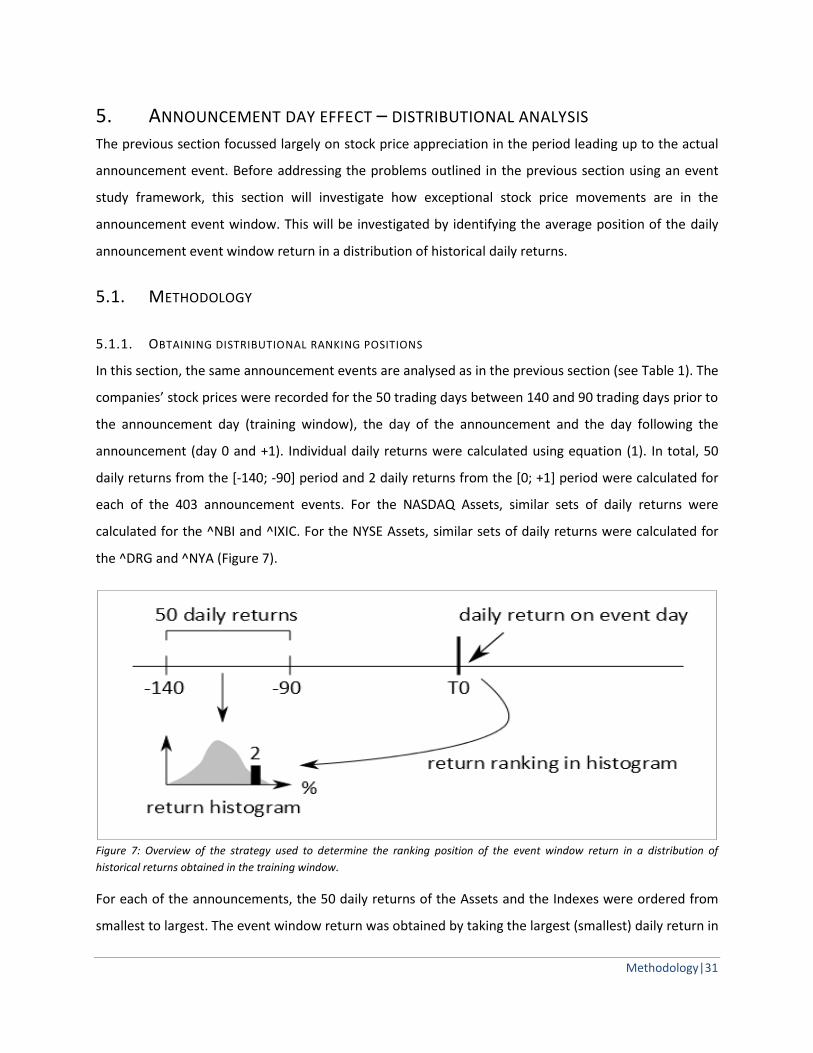
Methodology|31
5. ANNOUNCEMENT DAY EFFECT – DISTRIBUTIONAL ANALYSIS The previous section focussed largely on stock price appreciation in the period leading up to the actual
announcement event. Before addressing the problems outlined in the previous section using an event
study framework, this section will investigate how exceptional stock price movements are in the
announcement event window. This will be investigated by identifying the average position of the daily
announcement event window return in a distribution of historical daily returns.
5.1. METHODOLOGY
5.1.1. OBTAINING DISTRIBUTIONAL RANKING POSITIONS
In this section, the same announcement events are analysed as in the previous section (see Table 1). The
companies’ stock prices were recorded for the 50 trading days between 140 and 90 trading days prior to
the announcement day (training window), the day of the announcement and the day following the
announcement (day 0 and +1). Individual daily returns were calculated using equation (1). In total, 50
daily returns from the [-140; -90] period and 2 daily returns from the [0; +1] period were calculated for
each of the 403 announcement events. For the NASDAQ Assets, similar sets of daily returns were
calculated for the ^NBI and ^IXIC. For the NYSE Assets, similar sets of daily returns were calculated for
the ^DRG and ^NYA (Figure 7).
Figure 7: Overview of the strategy used to determine the ranking position of the event window return in a distribution of
historical returns obtained in the training window.
For each of the announcements, the 50 daily returns of the Assets and the Indexes were ordered from
smallest to largest. The event window return was obtained by taking the largest (smallest) daily return in

32|Announcement day effect – distributional analysis
the event window in the case of a positive (negative) FDA or EMEA announcement. This procedure
allows one single return value to be obtained for the two-day event window. Once this event window
return was obtained, the ranking position of this return in the training window returns was determined.
A rank value between 0 and 50 was obtained where rank 0 indicates the event associated daily return is
larger than any of the observed daily returns in the 50 day window and rank 50 indicates the daily return
is smaller than any of the observed daily returns in the 50 day window.
5.1.2. STATISTICAL TESTING
Given all the individual ranks (for both the Assets and the Indexes) for each of the event types (e.g.
positive FDA – NASDAQ), a new distribution was built for both the Asset ranks and the Index ranks.
These two distributions were then compared using an ordinal Wilcoxon rank-sum test. In the case where
the distribution of Asset ranks is statistically smaller (larger) than the distribution of Index ranks, the
daily returns on the announcement day or the day following the announcement can be considered
exceptionally large (small) given the historical distribution of both Asset and Index returns.
5.2. RESULT & DISCUSSION
The previous section demonstrated there are too few negative EMEA announcements to be analysed in
a meaningful way. Consequently negative EMEA announcements will not be investigated in this section.
5.2.1. FDA - NASDAQ
Earlier results suggested FDA announcement have a significant and instantaneous impact on NASDAQ
Assets (see Figure 3 for example). Indeed, of the 48 positive FDA announcements under study, 15 (31%)
announcements caused a daily stock return on day 0 or +1 larger than any daily stock return observed in
the training window (hence have a rank of 0). Thirty-one (65%) of the announcements caused a daily
stock return which ranks in the top 10 of the returns observed in the training window (see top left panel
in Figure 8). The full distribution of ranks is clearly positively skewed (skewness = 1.095785) towards
smaller ranks, indicating returns are on average larger than observed in the training window.
The distributions of corresponding ranks of the ^NBI and ^IXIC are both relatively flat. This is expected as
there is no reason to assume daily returns of the indexes on the announcement day to differ from
historically observed returns in the training window (see top right panel in Figure 8). The ^NBI returns
for positive FDA announcements are slightly skewed towards low ranks (skewness = 0.243982) as the
biggest return of day 0 and +1 was taking as the event window return. Testing using an ordinal Wilcoxon

Result & discussion|33
rank-sum test showed that the ranks of the FDA positive NASDAQ Assets are statistically lower than the
ranks of both the ^NBI and ^IXIC index (Table 4). It is important to note that analysing event day 0 and
+1 separately does not yield significant results (see Appendix 9), indicating that FDA announcements do
happen both during the trading day (day 0) and after the close of the trading day (day +1) and, as a
consequence, both days of the announcement window need to be analysed together.
Table 4: P-values of distribution testing using Wilcoxon rank-sum tests. Ranks of Asset returns in the
announcement event window in a distribution of traning window returns were compared to ranks of Index
returns.
FDA EMA
Asset type Index Positive Negative Positive Negative
NASDAQ NBI 0.000087* 0.000152* 0.664700 -
IXIC 0.000073* 0.000361* 0.984960 -
NYSE DRG 0.256340 0.594988 0.598380 -
NYA 0.585980 0.975524 0.683640 -
NYSE Big Pharma† DRG 0.826760 - 0.409500 -
NYA 0.299700 - 0.594460 -
NYSE Standard‡ DRG 0.516920 - 0.567700 -
NYA 0.448480 - 0.877140 - † Indicates a subsample of the Big Pharma companies (see Appendix 1)
‡ Indicates standard approvals defined as NDA ‘type 1’ and review classification ‘Standard’ for FDA products;
no generic, no biosimilar, no orphan for EMA products.
* Indicates statistically significant results at the 5% level.
Similar results are obtained when analysing the stock responses of NASDAQ listed companies to
negative FDA decisions. Of the 43 negative FDA announcements under study, 20 (47%) have returns
smaller than all the observed returns in the training window. 30 announcements (70%) are associated
with returns which rank in the bottom 10 of the returns observed in the training window (Figure 8). The
full distribution of ranks is clearly negatively skewed (skewness = -1.161189) towards larger ranks.
Testing using an ordinal Wilcoxon rank-sum test showed the ranks of the returns of the NASDAQ assets
are significantly larger than the return ranks of the ^NBI and ^IXIC (Table 4). In contrast to the positive
FDA announcements, analysing event day 0 and +1 separately yields significant results as well (p-values
are 0.0402 and 0.0231 respectively), also see Appendix 9.

34|Announcement day effect – distributional analysis
Although there is a significant stock price anticipation leading up to the actual FDA announcement, there
still is a significant stock price reaction following both positive and negative announcements16. This
clearly opens the window for profitable short-term trading opportunities. Market participants could
‘place their bets’ by buying (shorting) a stock prior to the predetermined FDA announcement date and
hope for a positive (negative) outcome17. However, one should bear in mind that the ‘trading and
hoping’ strategy generally will only generate a profit when systematically more predictions are correct
than wrong. It is clear that any information regarding the outcome can be beneficial for market
participants (either by being long in case of a positive outcome or short in case of a negative outcome)
and discretion by the members of the FDA voting panel is of utmost importance to ensure a fair market
environment where all participants have symmetrical information.
Furthermore, there appears to be no strict form of market efficiency. Although there is a lot of public
information regarding the clinical trials submitted to the FDA, the market is systematically anticipating a
positive outcome. As a consequence, negative FDA announcements come more as a shock as the
observed negative returns following a negative announcement are extremer than the returns observed
following a positive announcement. This can be explained by the fact that positive news probably will
generate positive cash flows in the future, but this does not necessarily mean the company will become
a very profitable multi-billion company. However, negative news in many cases means there is a
certainty of no future cash flows and consequently dilutive financing rounds to continue existing
operations are likely or even bankruptcy. This assymetry in responses to positive and negative news has
been demonstrated several times before (Sarkar and de Jong 2006).
5.2.2. FDA – NYSE
Compared to the instantaneous impact of FDA announcements on NASDAQ Assets, the impact on NYSE
Assets is relatively limited. Of the 140 positive announcements under study, only 6 (4.2%) are associated
with a daily stock return on day 0 or +1 larger than any daily stock return observed in the training
window. Forty-five (32%) of the announcements are associated with a daily stock return which ranks in
the top of the returns observed in the training window (Figure 8). The positive skew of the distribution is
16
The distribution of daily NASDAQ returns is leptokurtic (i.e. they have “fat tails”) under normal circumstances and the FDA announcements still cause tail-events. Standard risk prediction and Value-at-Risk (VaR) models assuming normal distibutions are clearly not a good option to assess the risk of NASDAQ listed life science companies. 17
FDA announcement dates are typically known in advance and are listed on specialised websites such as RTTnews: http://www.rttnews.com/corpinfo/fdacalendar.aspx.

Result & discussion|35
largely attributable to the method used to determine a single ranking value in the two day
announcement event window (see Appendix 9).
The distribution of corresponding ranks of the ^DRG and ^NYA is relatively similar to the distribution of
the ranks of the NYSE Assets. Testing using an ordinal Wilcoxon rank-sum test showed that the ranks of
the FDA positive NYSE Assets are statistically not different from the ranks of both the ^NBI and ^IXIC
(Table 4). Analysing decisions on Big Pharma companies (as defined in Appendix 1), standard product
announcements, and analysing day 0 and day +1 separately does not yield statistical significant results
(Table 4).
Similar results are obtained when analysing the stock responses of NYSE listed companies to negative
FDA decisions (Table 4). However, as there are only 7 observations available, it is difficult to draw
conclusive results from this dataset.
Apparently, the market is more efficient in respect to NYSE listed companies. FDA announcement are
more anticipated and come less as a shock and as a result do not cause extreme daily returns. However,
one should keep in mind that large pharmaceutical companies, typically listed on NYSE, constantly
report news on products under development, clinical trial results, products filed etc. As a consequence,
the distribution of daily returns in the training window might contain event-driven returns which in turn
makes it more difficult to identify ‘extreme’ returns following an FDA announcement.
However, it is more likely that other, more fundamental, explanations can explain these observations.
As mentioned before, NYSE listed life science companies have a plentitude of products on the market
and in the pipeline, making the impact of one single new product relatively limited. Furthermore, the
FDA approval process is the final step in a long process of product development which is clearly
communicated to the markets. This will be discussed in more detail in the following section.
Alos, large pharmaceutical companies are better covered by analysts18 than smaller NASDAQ companies,
resulting in a greater market efficiency and a smaller surprise effect following the announcement
(Canivet 2010; Guagliano, Linciano et al. 2013).
18
It is estimated that 35 – 40% of all publicly traded companies worldwide have no sell-side analyst coverage. Unfortunately, it is the smaller, less liquid companies that tend to slip through the cracks. More heavily traded, large-cap companies attract greater sell-side analyst interest.
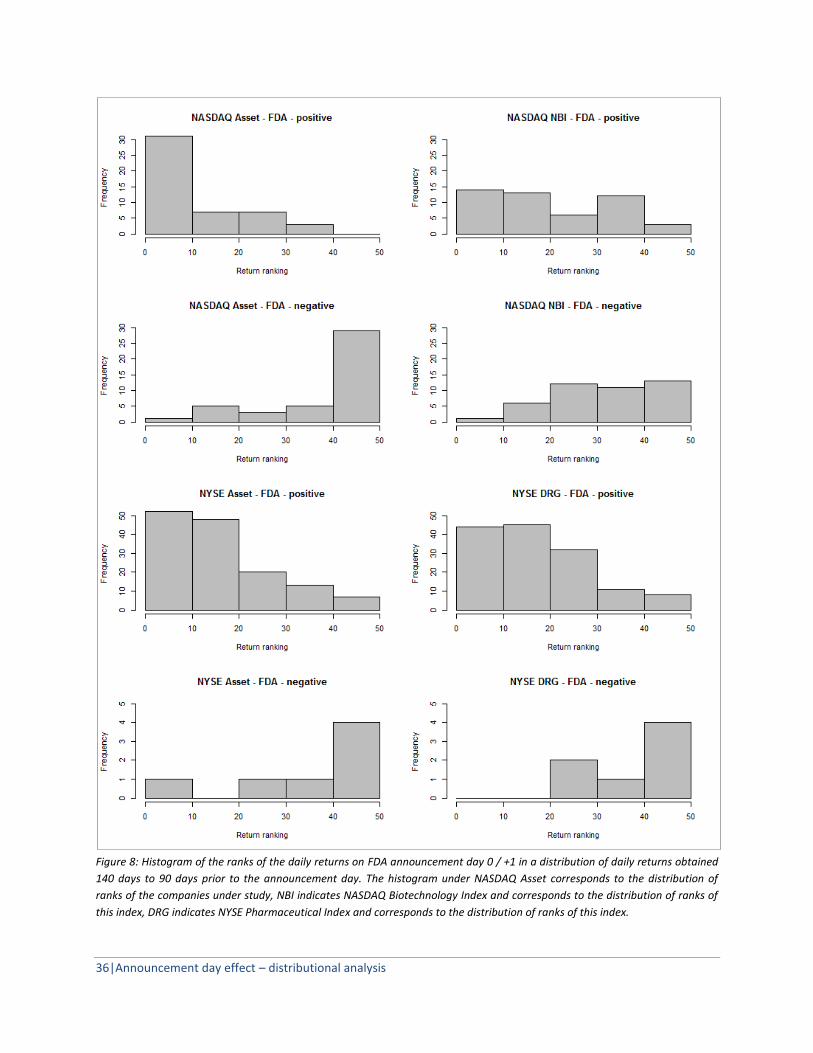
36|Announcement day effect – distributional analysis
Figure 8: Histogram of the ranks of the daily returns on FDA announcement day 0 / +1 in a distribution of daily returns obtained
140 days to 90 days prior to the announcement day. The histogram under NASDAQ Asset corresponds to the distribution of
ranks of the companies under study, NBI indicates NASDAQ Biotechnology Index and corresponds to the distribution of ranks of
this index, DRG indicates NYSE Pharmaceutical Index and corresponds to the distribution of ranks of this index.

Result & discussion|37
5.2.3. EMEA
Compared to the instantaneous impact of FDA announcements on the stock prices of NASDAQ listed
companies, the impact of EMEA annoucements on NASDAQ listed companies is less clear. The
distribution of both the FDA positive NASDAQ Assets and the Index ranks are skewed towards smaller
values (Figure 9) and do not differ statistically (Table 4). Results are also not significant for day 0 (p =
0.5718) and day +1 (p = 0.6647) separately.
Results are not significant possibly due to the relatively limited number of observations and thus lower
power of statistical testing. Furthermore, the CHMP Opinion issued around day -50 in the training
window might cause the real announcement effect to be captured in the training window, making it
more difficult to have an even more skewed distribution. This in turn complicates capturing the event at
day 0 or day -1.
Figure 9: Histogram of the ranks of the daily returns on EMA announcement day 0 / +1 in a distribution of daily returns obtained
140 days to-90 days prior to the announcement day. The histogram under NASDAQ Asset corresponds to the distribution of
ranks of the companies under study, NBI indicates NASDAQ Biotechnology Index and corresponds to the distribution of ranks of
this index, DRG indicates NYSE Pharmaceutical Index and corresponds to the distribution of ranks of this index.

38|Announcement day effect – distributional analysis
Similar to the absence of a clear instantaneous response of NYSE listed companies to positive FDA
announcements, NYSE listed companies do not respond to EMEA announcements. Of the 142 positive
announcements under study, only 3 (2.1%) are associated with daily stock returns on day 0 or +1 larger
than any daily stock return observed in the training window. Thirty-nine (27.5%) of the announcements
are associated with a daily stock return which ranks in the top 10 of the returns observed in the training
window (Figure 9). Again, the positive skew of the distribution is largely attributable to the method used
to determine a single ranking value in the two day announcement event window (data not shown).
The distribution of corresponding ranks of the ^DRG and ^NYA is similar to the distribution of the ranks
of the NYSE Assets. Testing using an ordinal Wilcoxon rank-sum test showed that the ranks of the FDA
positive NYSE Assets are statistically not different from the ranks of both the ^NBI and ^IXIC (Table 4).
Analysing decisions on Big Pharma companies (as defined in Appendix 1) and standard product
announcements does not yield statistical significant results (Table 4).
5.3. CONCLUDING REMARKS
Public NASDAQ listed companies show exceptional daily stock price returns following an FDA
announcement. Positive FDA announcements result in exceptional positive dialy stock returns
unobserved in a 50 day period preceding the announcement. Negative FDA announcement result in
exceptional negative stock price returns. The returns are asymetrical; negative FDA announcements
result in more negative returns than positive announcements results in positive returns.
NYSE listed companies show no exceptional daily stock returns following FDA announcements. Both
NASDAQ and NYSE listed companies show no exceptional daily stock returns following EMEA
announcements. This difference between FDA and EMEA announcements is possibly attributable to the
existing differences between the FDA and EMEA reviewing process.
Further investigation could focus on a more detailed subsampling of the products developed by NYSE
listed companies. It is to be expected that FDA announcements regarding highly profitable products (e.g.
diabetes, cancer, ageing drugs) developed by big pharmaceutical companies might cause a different
stock price response compared to products with only a limited market potential (e.g. generics).

Methodology|39
6. EVENT STUDY ANALYSIS The previous two sections focussed on stock price anticipation over a relatively long horizon and the
exceptionality of stock price responses on the announcement day. This section will focus on stock price
anticipation in a short period preceding the actual FDA or EMEA announcement, the return on the
announcement day, and the return in the period following the announcement day using an event study
framework. The event study framework corrects biasses present in earlier analyses such as global
market returns and company specific market return exposure.
6.1. METHODOLOGY
Event studies can be used to measure the effect of an event – economic or firm specific – on the value
of a firm (MacKinlay 1997). Typical examples include the effect of a change in the regulatory
environment (Schwert 1981) or the effect of merger announcements on public stock prices (Weston and
Halpern 1983). However, event studies have also been used in the past to study the effect of FDA
decisions on public stock prices (Sarkar and de Jong 2006).
An event study typically involves four steps (De Jong 2007): 1) Specification of an event of interest and
identification of the accompanying timing, 2) determination of normal behaviour of the stock price using
a benchmark model, 3) determination of excess (abnormal) returns around the timing of the event of
interest using the information gathered in the benchmark model, and 4) testing these abnormal returns
for statistical significance.
I will describe these four steps into more detail in the following paragraphs. These paragraphs are
roughly based on event study work carried out by MacKinlay and de Jong (MacKinlay 1997; De Jong
2007).
6.1.1. SPECIFICATION OF EVENT TIMING
The announcements dates are clearly specified in the FDA and EMEA datasets. The training window to
determine benchmark behaviour is defined from 140 to 90 trading days prior to the announcement
date. The anticipation window is defined from 60 days to 1 day prior to the announcement date. The
event window is defined from the announcement day to 1 day past the announcement day. The post-
announcement window is defined from 2 days past the announcement to 30 days past the
announcement (Figure 2).
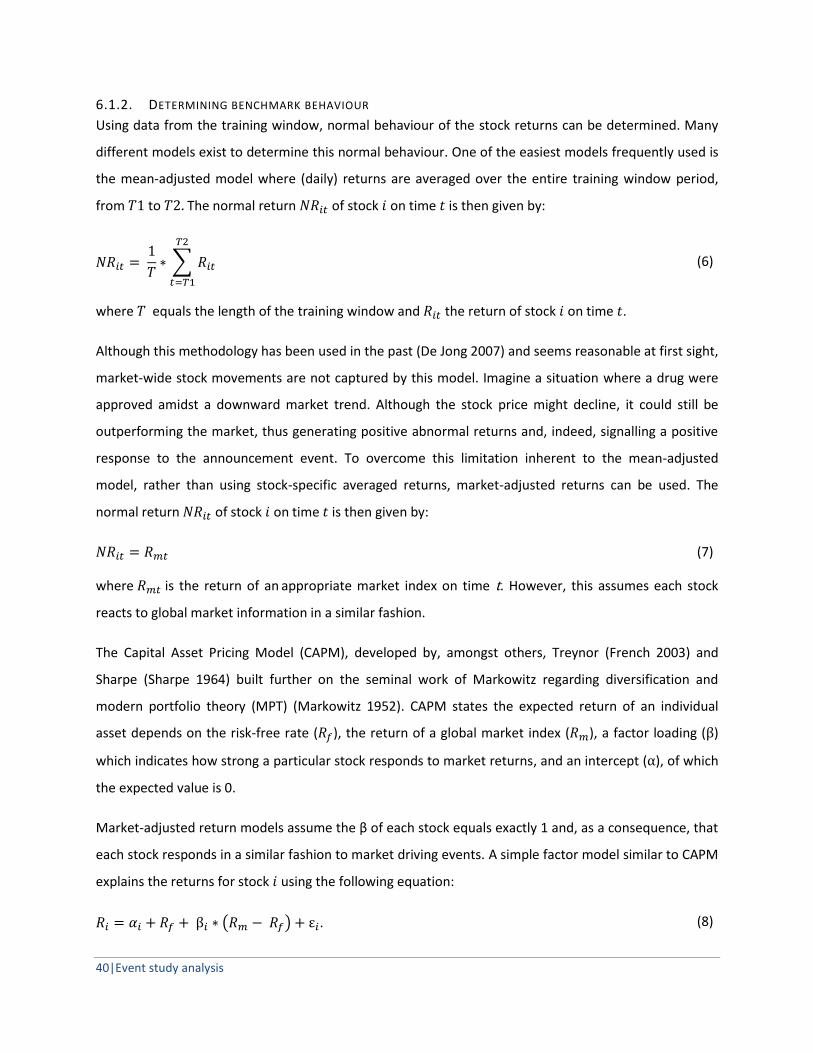
40|Event study analysis
6.1.2. DETERMINING BENCHMARK BEHAVIOUR
Using data from the training window, normal behaviour of the stock returns can be determined. Many
different models exist to determine this normal behaviour. One of the easiest models frequently used is
the mean-adjusted model where (daily) returns are averaged over the entire training window period,
from to . The normal return of stock on time is then given by:
∑
(6)
where equals the length of the training window and the return of stock on time .
Although this methodology has been used in the past (De Jong 2007) and seems reasonable at first sight,
market-wide stock movements are not captured by this model. Imagine a situation where a drug were
approved amidst a downward market trend. Although the stock price might decline, it could still be
outperforming the market, thus generating positive abnormal returns and, indeed, signalling a positive
response to the announcement event. To overcome this limitation inherent to the mean-adjusted
model, rather than using stock-specific averaged returns, market-adjusted returns can be used. The
normal return of stock on time is then given by:
(7)
where is the return of an appropriate market index on time t. However, this assumes each stock
reacts to global market information in a similar fashion.
The Capital Asset Pricing Model (CAPM), developed by, amongst others, Treynor (French 2003) and
Sharpe (Sharpe 1964) built further on the seminal work of Markowitz regarding diversification and
modern portfolio theory (MPT) (Markowitz 1952). CAPM states the expected return of an individual
asset depends on the risk-free rate ( ), the return of a global market index ( ), a factor loading ( )
which indicates how strong a particular stock responds to market returns, and an intercept ( ), of which
the expected value is 0.
Market-adjusted return models assume the β of each stock equals exactly 1 and, as a consequence, that
each stock responds in a similar fashion to market driving events. A simple factor model similar to CAPM
explains the returns for stock using the following equation:
( ) . (8)

Methodology|41
As the risk free rate was virtually zero in the period under consideration, equation (8) can be simplified
to the following single-factor index model:
(9)
where represents an estimation error term or disturbance term which is 0 on average. This equation
can be estimated using ordinary least squares (OLS) regression. According to the single-factor index
model, normal returns of stock on time are a function of the estimated response to market returns
( ) and the estimated intercept ( ):
(10)
where is the return of an appropriate index on time t (see Table 2).
More complex models have been proposed in the past. For example, the Fama-French model uses three
factors, compared to the standard single-factor model (Fama and French 1993). Fama and French
observed that companies with a small market capitalization and companies with a high book-to-market
(BTM) ratio tend to perform better (MacKinlay 1997). Consequently, they added two factors to reflect
exposure to these two classes and proposed the following model:
(11)
where SMB stands for small minus big and HML for high minus low; these variables measure
respectively (historic) excess returns of small market capitalization companies (small caps) over big caps
and of companies with a high book-to-market (BTM) over low BTM companies19. The coefficients and
correspond with the exposures of stock to these two factors. Again, this model can be simplified
assuming a risk free rate of zero. The following equation can then be estimated using OLS:
(12)
which yields the following equation for the normal returns of stock on time :
(13)
More complex (higher number of factor) models have been proposed. For example, Chen Roll and Ross
proposed a multi-factor model where the following factors are used: unanticipated growth in industrial
19
HML and SMB data is available from the data library website of Kenneth French: http://mba.tuck.dartmouth.edu/pages/faculty/ken.french/data_library.html.

42|Event study analysis
production, changes in expected inflation, unexpected inflation, default spread, term spread, and the
return on the equal-weighted and value-weighted market portfolio (Chen, Roll et al. 1986).
Recently, Makarov and Papanikolaou used a principal components approach to propose an industry
specific four-factor model using the following four factors: the return on the value-weighted market
portfolio, the return of capital minus consumption goods producers, the return of cyclical minus non-
cyclical industries, and the return of input good producers minus everyone else (Makarov and
Papanikolaou 2007). However, MacKinlay has demonstrated there is little benefit to be obtained in
moving from a single factor model to a multi-factor model when trying to predict or explain returns,
unless the sample firms have a common characteristic such as market capitalization or industry type
(MacKinlay 1997).
A slight modification of the Fama-French model has been used in an event study by Bastin and Hübner
to test the effect of three important events in spring 2000. Two political statements by Bill Clinton and
Tony Blair had a major impact on biotechnology stocks as there was uncertainty about the strength of
genomics based patents. A breakthrough announcement by Celera Genomics had a significant impact as
it opened to door to the genomics era20. The three original factors of the Fama-French were extended
with a fourth factor defined as the ‘patent market value’ of a firm which was calculated as the ratio
between the firm’s market value of equity in excess of total cash and the number of patents (Bastin and
Hübner 2006).
6.1.3. ESTIMATING ABNORMALS RETURNS
The abnormal return of stock on time ( ) is defined as the difference between the observed
return and the normal return return calculated using one of the proposed benchmark:
. (14)
Using for example the Fama-French model from equation (10), the abnormal return is given by:
(15)
20
The three events followed each other very rapidly and the first two fount their origin in the announced
publication of the first human genome by Celera. On 14 March 2000 Bill Clinton and Tony Blair recommended free
access to raw genomic data, but recognize intellectual property protection for gene-based invention. On 5 April
2000 Bill Clinton reaffirms his previous statement, but specifies that commercial applications should be protected
by patents and 6 April 2000 Celera Genomics announced its completion of the sequencing phase of the human
genome.

Methodology|43
which corresponds with the estimation error ( ) from equation (9). In other words, the abnormal return
is the part of the observed return which could not be predicted using a specific benchmark model.
Consider a sample of events which starts on and runs for a period , hence the abnormal return of
stock 1 on the event date can be denoted as . The abnormal return of the Nth stock on the event
date can be denoted as . The abnormal returns can then be represented in the following matrix
notation:
[
] . (16)
Each row of this matrix represents a cross-sectional overview of the abnormal returns on a specific time
whereas each column represents a time series of abnormal returns for a specific stock.
Assuming the training window is large (MacKinlay 1997), the variance of the abnormal return of stock
on time can be estimated by:
∑
(17)
where is the average abnormal return for stock i over the training window. As the abnormal return
in the training window equals the estimation error and OLS, by design, equalises the expected
estimation error to zero, equation (17), under the assumption of no serial correlation, simplifies to:
∑
(18)
which is equal to saying that the estimated variation of the abnormal returns on every time is,
assuming homoscedasticity, equal to the sum of squared estimation residuals obtained in the training
window divided by T-1.
The parameters described above correspond to a single observation of the abnormal return matrix
shown in equation (16). However, a single observation of abnormal returns might be distorted by other
factors influencing the stock price. Abnormal returns can be aggregated over the time and the
observation dimension of the abnormal return matrix to vastly the performance of event studies. For
example, abnormal returns can be averaged over different observations (i.e. different FDA/EMEA

44|Event study analysis
announcements). The unweighted cross-sectional average abnormal returns on time are then simply
given by:
∑
(19)
and the variance associated with this average abnormal return, assuming all abnormal returns are cross-
sectionally uncorrelated and cross-sectionaly homoscedastic on time t ( ), is:
∑
(20)
However, often one is not interested in the (average) abnormal returns on a given time , but rather in
the cumulative abnormal return over a certain period. Consider for example the anticipation period
prior to the announcement date; the abnormal return on a specific moment in the anticipation window
is not very informative, however, the cumulative abnormal return on a specific time-point is. Cumulative
abnormal returns for a single stock for the period [ ] are given by:
∑
(21)
Similarly, cumulative returns can be calculated by aggregating average returns over time. Cumulative
average abnormal returns can also be obtained by cross-section ally aggregating cumulative abnormal
returns. For example, the average cumulative abnormal return for a sample of events over the period
[ ] is given by:
∑
∑
(22)
As the variance of a sum of parameters is the sum of the variances (remember no serial correlation was
assumed), the variance of cumulative abnormal return for stock over the period [ ] is:
( ) . (23)
Similarly, the variance of the cumulative average abnormal return over the period [ ] is:
( )
. (24)

Methodology|45
Up until now, the variance was assumed to be homoscedastic over the time dimension, but also cross-
sectional. This assumes all abnormal returns of the matrix in equation (16) have the same variance. This
assumption is too strong and can easily be corrected (De Jong 2007). Rather than using the abnormal
return, the normalized abnormal return of stock at time can be defined as follows:
(25)
where the abnormal return can be calculated using the single-factor model or the Fama-French model.
The estimated standard deviation can be calculated using the abnormal returns in the training window
according to equation (18). Equation (25) effectively normalizes the standard deviation of the abnormal
returns to 1.
Different observations at time can now easily be aggregated and averaged over observations to an
average normalized abnormal return at time . The variance of this normalized average abnormal return
is still assumed homoscedastic over time and equal to:
(26)
6.1.4. STATISTICAL TESTING FOR SIGNIFICANCE
Individual abnormal returns can be tested for statistical significance, under the null hypothesis of no
abnormal returns:
(27)
using the following test-statistic, assuming the training window is large:
√
(28)
where abnormal returns and estimated variance can be calculated using for example equation (15) and
(18) respectively.
Average abnormal returns can be tested for statistical significance, under the null hypothesis of no
average abnormal returns:
(29)
using the following test-statistic:

46|Event study analysis
√
(30)
where corresponds to the estimated variance of a single observation which can be calculated using
equation (18). Daily stock returns typically do not follow a normal distribution, but are rather leptokurtic
or ‘fat tailed’.
This means equation (30) does not hold the proposed distribution, in theory. However, under the
assumptions the components of the average abnormal return have the same variance and is large, the
test-statistic follows a normal distribution asymptotically.
Cumulative average abnormal returns for the period [ ] can be tested for statistical significance,
under the null hypothesis of no cumulative average abnormal returns:
(31)
using the following test-statistic:
√
(32)
As demonstrated before, the assumption of cross-sectional homoscedasticity is too strong. However,
abnormal returns can easily be normalized to have cross-sectional homoscedasticity and a variance of 1.
Both equation (30) and (32) assume cross-sectional homoscedasticity and can be altered to take
normalized abnormal returns into account.
The test-statistic for the normalized average abnormal return becomes:
√
(33)
and the test-statistic for the normalized cumulative average abnormal return becomes:
√
(34)
6.2. RESULTS AND DISCUSSION
6.2.1. MODEL SELECTION
As outlined above, normal (benchmark) returns can be calculated using different models and different
reference indexes. Switching from a single-factor model to the Fama-French model always improves the
Results and discussion|47
average coefficient of determination obtained in the regressions when using NASDAQ Assets data.
Besides the two standard reference indexes used in the previous sections (^NBI and ^IXIC), an additional
reference index was tested; the NASDAQ Health Care index (^IXHC). Both in the single-factor model and
the Fama-French model, using ^NBI gives the best results (Figure 10). The best coefficient of
determination for the NYSE Assets is obtained using the Fama-French model and the ^DRG (data not
shown). Consequently, analyses are carried out using the Fama-French model using either ^NBI or ^DRG.
The training window is defined from 140 to 90 trading days prior to the announcement date. Due to
data availability problems and the inclusion of an anticipation window, the training window is relatively
short. Other event studies often use longer training windows or training windows which are located a
longer period of time prior to the event of interest (De Jong 2007). However, for the stocks where data
was available in longer training windows it was verified that regression results, using the Fama-French
model with the ^NBI or ^DRG, do not change dramatically when changing both the length and the
location of the training window (see Appendix 10).
6.2.2. FDA - NASDAQ
Cumulative average abnormal returns ( ) in the anticipation window (starting at day -60) are similarly
positive for both the FDA positive and FDA negative NASDAQ Assets. However, in both cases cumulative
returns are not significantly larger than 0 (data not shown). The cumulative average abnormal return
calculated using both positive and negative announcements is also not significantly larger than 0 in the
anticipation window (also see Appendix 12). The reaches a minimal p-value at = -29
(although the p-value is not significant at the 5% level) (see Figure 11).
The results in the anticipation window do differ between positive and negative FDA announcements in
approximately the last 10 days prior to the announcement. There is only 1 trading day with a significant
abnormal return in the 10 trading days preceding a positive FDA announcement compared to 7 out of 10
in the case of a negative FDA announcement (Table 5). The cumulative abnormal returns are not
significantly negative in the case of negative FDA announcement when calculated over the 10 days
preceding the announcement. However, when calculating the cumulative abnormal return over a
shorter period, values become significantly negative with being 0.0494 and
being 0 for example (Appendix 12). These results indicate investors are anticipating the bad news,
potentially indicating illegal insider-trading. However, these results clearly go against earlier findings
that negative announcements are preceded by significant negative results over a longer horizon

48|Event study analysis
(Rothenstein, Tomlinson et al. 2011). Both positive and negative announcements generate the same
positive anticipation and only diverge approximately 8 days prior to the announcement date.
Figure 10: Distributions of R
2-values of different models used to determine benchmark behaviour of NASDAQ returns. ‘Factor’
indicates where the single-factor model was used, ‘Fama-French’ indicates where the Fama-French model was used. ‘NBI’, ‘IXIC’,
and ‘IXHC’ indicate where the NASDAQ Biotechnology Index, the NASDAQ Composite, and the NASDAQ Health Care Index were
used to determine market returns in the models. Mean and variance (Var.) of the distribution are shown in the top right corner
of each panel.
In correspondence with the results obtained in earlier sections, there are significant abnormal returns
on the announcement day; positive abnormal returns in case of positive FDA announcements, negative

Results and discussion|49
abnormal returns in case of negative FDA announcements. In both cases the test-statistics are very
large, confirming earlier findings that daily returns in the announcement window are real tail events
with significant wealth effects (Table 5).
Figure 11: Evolution of the normalized cumulative average abnormal return of FDA positive and negative NASDAQ Assets
combined Vertical dashed lines demarcate the anticipation, announcement window, and post-announcement window. Diagonal
dashed lines indicate confidence intervals at different levels.
Furthermore, investors seem to be overoptimistic, always. There are significant negative abnormal
results up to two trading days following a positive FDA announcement and up to seven days following a
negative announcement. These results partially contradict research by Sarkar and de Jong who detected
only significant abnormal returns on day 0 and +1 following negative FDA announcements (Sarkar and
de Jong 2006). However, other studies have also detected longer period of significant negative abnormal
returns following negative FDA announcements (Bosch and Lee 1994).
This also contradcits earlier research results that showed the market is inefficient and investors tend to
overreact to dramatic and unexpected news (De Bondt and Thaler 1985). However, my results indicate
investors tend to underreact to negative FDA announcements with significant negative abnormal returns
in the aftermath of the negative announcement. The observation that the market is inefficient still does

50|Event study analysis
stand, however. These findings clearly contradict that the market is always efficient and no money is to
be made from reversal strategies (Conrad, Gultekin et al. 1997). Other researchers have indicated there
are several psychological explanations for this observed inefficiency such as overconfidence and biased
self-attribution (Daniel, Hirshleifer et al. 1998). Recent research has also demonstrated that the
combination of overreaction to good news and underreaction to bad news is of particular importance
for technology stocks, possibly explaining the observed stock price reaction (Akhigbe, Larson et al.
2002).
However, it appears many professional investors are aware of this seemingly inefficient market
behaviour. In case of a positive regulatory announcement, public disclosure announcements often
indicate large short positions of institutional investors or hedge funds (Remy 2013). These investors
often cite reasonably explanations for the initiation of their short position such as overenthusiasm of
smaller investors or irrational expectations of the market in regards to the earning potential of
developed products.
6.2.3. FDA – NYSE
No significant abnormal individual daily returns are found in the entire anticipation window for FDA
positive NYSE Assets. As a consequence, there are also no periods with significant cumulative abnormal
returns in the anticipation window (Table 6). Similar insignificant results are obtained for the Big Pharma
and Standard subsamples of the positive FDA announcements21.
There are 3 significant (2 negative and 1 positive) daily abnormal returns in the entire anticipation
window for FDA negative NYSE assets. However, there are no significant cumulative abnormal returns
close to the announcement date (Table 6).
21
Both subsamples are defined in the same way as before. See section 4: Stock price anticipation – averaged cumulative returns.

Results and discussion|51
Table 5: Overview of the event study statistics of FDA positive and FDA negative NASDAQ Asset calculated using the Fama-French model and the NASDAQ Biotechnology Index.
Day Positive Negative Positive + Negative
Daily Cumulative Daily Cumulative Daily Cumulative
AR t CAR t AR t CAR t AR t CAR t
-10 -0.1032 -0.7152 -0.1032 -0.7152 0.2075 1.3607 0.2075 1.3607 0.0436 0.4159 0.0436 0.4159 -9 -0.0895 -0.6198 -0.1927 -0.6675 -0.2566 -1.6824 -0.0491 -0.1608 -0.1684 -1.6066 -0.1248 -0.5953 -8 -0.1070 -0.7412 -0.2997 -0.6921 -0.0150 -0.0985 -0.0641 -0.1400 -0.0635 -0.6060 -0.1883 -0.5989 -7 -0.1510 -1.0462 -0.4507 -0.7806 -0.3273 -2.1461 -0.3914 -0.6416 -0.2343 -2.2351 -0.4227 -1.0080 -6 0.2242 1.5530 -0.2265 -0.3139 0.2406 1.5775 -0.1508 -0.1977 0.2319 2.2123 -0.1907 -0.3639 -5 -0.2591 -1.7950 -0.4856 -0.5607 -0.2929 -1.9204 -0.4436 -0.4849 -0.2750 -2.6238 -0.4658 -0.7406 -4 -0.0346 -0.2395 -0.5202 -0.5149 -0.3245 -2.1279 -0.7681 -0.7196 -0.1716 -1.6367 -0.6374 -0.8686 -3 0.1111 0.7696 -0.4091 -0.3543 0.3875 2.5409 -0.3807 -0.3120 0.2417 2.3056 -0.3957 -0.4718 -2 0.1270 0.8797 -0.2821 -0.2172 -0.9348 -6.1301 -1.3155 -0.9585 -0.3748 -3.5750 -0.7704 -0.8166 -1 0.0423 0.2929 -0.2398 -0.1662 -1.1630 -7.6264 -2.4785 -1.6253 -0.5273 -5.0297 -1.2977 -1.2379
0 0.2505 1.7353 0.2505 1.7353 -2.6363 -17.2876 -2.6363 -17.2876 -1.1136 -10.6233 -1.1136 -10.6233 +1 2.1888 15.1643 2.4392 8.4498 -3.2025 -21.0000 -5.8388 -19.1438 -0.3587 -3.4221 -1.4724 -7.0227
+2 -0.3847 -2.6654 -0.3847 -2.6654 -0.7091 -4.6500 -0.7091 -4.6500 -0.5380 -5.1322 -0.5380 -5.1322 +3 -0.2873 -1.9906 -0.6720 -2.3280 -0.3436 -2.2532 -1.0527 -3.4516 -0.3139 -2.9946 -0.8519 -4.0634 +4 0.1797 1.2451 -0.4923 -1.1370 -0.4275 -2.8035 -1.4803 -3.2356 -0.1072 -1.0229 -0.9592 -3.0499 +5 0.0059 0.0408 -0.4864 -0.8425 -0.0975 -0.6391 -1.5777 -2.5865 -0.0429 -0.4097 -1.0021 -2.3899 +6 -0.1216 -0.8422 -0.6080 -0.8424 -0.5934 -3.8912 -2.1711 -2.8474 -0.3445 -3.2864 -1.3466 -2.5692 +7 -0.2894 -2.0049 -0.8974 -1.0362 0.1822 1.1945 -1.9890 -2.1737 -0.0666 -0.6350 -1.4132 -2.2468 +8 -0.0544 -0.3767 -0.9517 -0.9420 0.0740 0.4853 -1.9150 -1.7939 0.0063 0.0600 -1.4069 -1.9173 +9 -0.1515 -1.0493 -1.1032 -0.9554 0.0693 0.4547 -1.8456 -1.5128 -0.0471 -0.4495 -1.4540 -1.7338 +10 0.1539 1.0665 -0.9493 -0.7307 0.1136 0.7446 -1.7321 -1.2620 0.1349 1.2865 -1.3192 -1.3982 +11 -0.0339 -0.2351 -0.9832 -0.6812 -0.0449 -0.2943 -1.7769 -1.1652 -0.0391 -0.3730 -1.3583 -1.2957 +12 -0.1002 -0.6944 -1.0834 -0.6824 -0.1794 -1.1762 -1.9563 -1.1662 -0.1376 -1.3129 -1.4959 -1.2973 +13 0.0623 0.4317 -1.0211 -0.5895 -0.4795 -3.1440 -2.4358 -1.3310 -0.1937 -1.8477 -1.6896 -1.3431 +14 -0.1610 -1.1157 -1.1821 -0.6300 0.0897 0.5881 -2.3461 -1.1834 -0.0426 -0.4060 -1.7321 -1.2710 +15 -0.2008 -1.3912 -1.3829 -0.6844 -0.1077 -0.7060 -2.4538 -1.1493 -0.1568 -1.4957 -1.8889 -1.2871
Dashed lines demarcate the anticipation window, event window, and post-event windows. AR indicates average abnormal returns, CAR indicates cumulative average abnormal returns, t indicates the value of the
test-statistic. CAR for the anticipation window are calculated starting at day -10, starting at day 0, and starting at day +2 for the anticipation, event, and post-event window respectively. Dotted underlined values
are significant at the 10% level, underlined values at the 5% level, and underlined bold values at the 1% level. Critical values were calculated using the normal. All critical values are two-tailed.

52|Event study analysis
There are no abnormal returns in the announcement window for FDA positive NYSE Assets, clearly
contradicting earlier research results which detected significant positive results. However, Sarkar and de
Jong, in their 2006 study, analysed NASDAQ, AMEX, and NYSE listed companies together. When
analysing their results in more detail, they found that the major determinants of the abnormal returns
were the market capitalization and the novicity of a firm. Sarkar and de Jong concluded that small
companies which successfully developed a new product for the first time experience the highest
abnormal returns on the announcement day (Sarkar and de Jong 2006). Clearly, small pharmaceutical
and biotech companies listed on the NASDAQ meet these criteria better than large NYSE listed
pharmaceutical companies. Recent research has also shown that large pharmaceutical companies, to
cope with the patent cliff, are eager to buy small and innovative companies with approved products,
rather than developing new products themselves. Small NASDAQ companies with an approved product
might be a takeover target, partially explaining the pronounced difference in stock price response to
positive FDA announcements between NASDAQ and NYSE listed companies (Armenean 2012).
Furthermore, the final FDA approval resolves only a small degree of uncertainty, as most of this
uncertainty is resolved previously while the clinical trial and FDA approval process progresses. Large
pharmaceutical companies are especially good in communicating on the progress of their products
under development, leading to a low degree of uncertainty regarding the final outcome decision by the
FDA (Sarkar and de Jong 2006). As the final outcome is highly anticipated, all information is already
priced into the stock price, resulting in no significant abnormal return on the day of the actual
announcement. This efficiency also leads to no significant returns or cumulative returns in the period
following the FDA announcement.
For negative announcements, suprisingly, a significant positive return is found on day +1, but a
significant negative abnormal return on day +2. These results are robust as they are similar when
different reference indexes are used in the Fama-French model or even when the single-factor model is
used (data not shown). These results clearly contradict intuition and earlier research (Bosch and Lee
1994; Sarkar and de Jong 2006). However, one should bear in mind that only 8 negative FDA
announcements were available. The returns on day +1 and day +2 partially offset each other and result
in no significant cumulative effect. As observed in the case of positive announcements, and
contradicting results observed in the case of the NASDAQ Assets, the behaviour in the post-
announcement window is not significant, indicating efficient behaviour. If day +2 is not taken into
account the becomes virtually zero (Table 6).
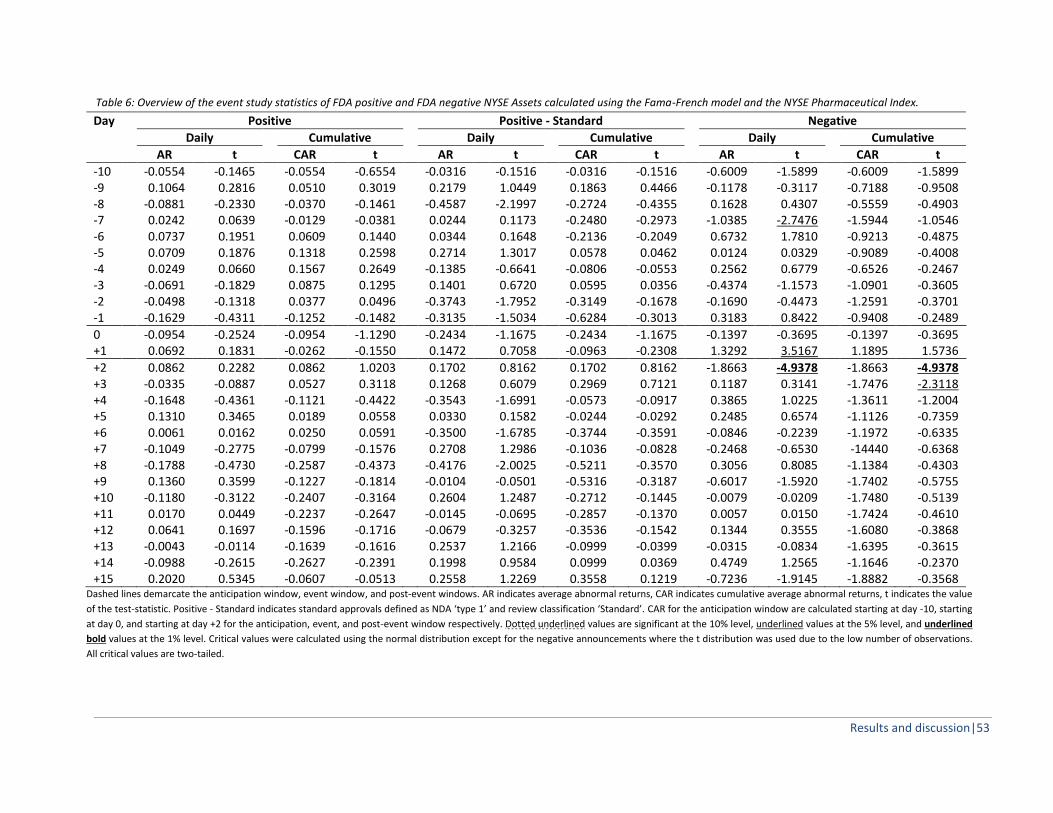
Results and discussion|53
Table 6: Overview of the event study statistics of FDA positive and FDA negative NYSE Assets calculated using the Fama-French model and the NYSE Pharmaceutical Index.
Day Positive Positive - Standard Negative
Daily Cumulative Daily Cumulative Daily Cumulative
AR t CAR t AR t CAR t AR t CAR t
-10 -0.0554 -0.1465 -0.0554 -0.6554 -0.0316 -0.1516 -0.0316 -0.1516 -0.6009 -1.5899 -0.6009 -1.5899 -9 0.1064 0.2816 0.0510 0.3019 0.2179 1.0449 0.1863 0.4466 -0.1178 -0.3117 -0.7188 -0.9508 -8 -0.0881 -0.2330 -0.0370 -0.1461 -0.4587 -2.1997 -0.2724 -0.4355 0.1628 0.4307 -0.5559 -0.4903 -7 0.0242 0.0639 -0.0129 -0.0381 0.0244 0.1173 -0.2480 -0.2973 -1.0385 -2.7476 -1.5944 -1.0546 -6 0.0737 0.1951 0.0609 0.1440 0.0344 0.1648 -0.2136 -0.2049 0.6732 1.7810 -0.9213 -0.4875 -5 0.0709 0.1876 0.1318 0.2598 0.2714 1.3017 0.0578 0.0462 0.0124 0.0329 -0.9089 -0.4008 -4 0.0249 0.0660 0.1567 0.2649 -0.1385 -0.6641 -0.0806 -0.0553 0.2562 0.6779 -0.6526 -0.2467 -3 -0.0691 -0.1829 0.0875 0.1295 0.1401 0.6720 0.0595 0.0356 -0.4374 -1.1573 -1.0901 -0.3605 -2 -0.0498 -0.1318 0.0377 0.0496 -0.3743 -1.7952 -0.3149 -0.1678 -0.1690 -0.4473 -1.2591 -0.3701 -1 -0.1629 -0.4311 -0.1252 -0.1482 -0.3135 -1.5034 -0.6284 -0.3013 0.3183 0.8422 -0.9408 -0.2489
0 -0.0954 -0.2524 -0.0954 -1.1290 -0.2434 -1.1675 -0.2434 -1.1675 -0.1397 -0.3695 -0.1397 -0.3695 +1 0.0692 0.1831 -0.0262 -0.1550 0.1472 0.7058 -0.0963 -0.2308 1.3292 3.5167 1.1895 1.5736
+2 0.0862 0.2282 0.0862 1.0203 0.1702 0.8162 0.1702 0.8162 -1.8663 -4.9378 -1.8663 -4.9378 +3 -0.0335 -0.0887 0.0527 0.3118 0.1268 0.6079 0.2969 0.7121 0.1187 0.3141 -1.7476 -2.3118 +4 -0.1648 -0.4361 -0.1121 -0.4422 -0.3543 -1.6991 -0.0573 -0.0917 0.3865 1.0225 -1.3611 -1.2004 +5 0.1310 0.3465 0.0189 0.0558 0.0330 0.1582 -0.0244 -0.0292 0.2485 0.6574 -1.1126 -0.7359 +6 0.0061 0.0162 0.0250 0.0591 -0.3500 -1.6785 -0.3744 -0.3591 -0.0846 -0.2239 -1.1972 -0.6335 +7 -0.1049 -0.2775 -0.0799 -0.1576 0.2708 1.2986 -0.1036 -0.0828 -0.2468 -0.6530 -14440 -0.6368 +8 -0.1788 -0.4730 -0.2587 -0.4373 -0.4176 -2.0025 -0.5211 -0.3570 0.3056 0.8085 -1.1384 -0.4303 +9 0.1360 0.3599 -0.1227 -0.1814 -0.0104 -0.0501 -0.5316 -0.3187 -0.6017 -1.5920 -1.7402 -0.5755 +10 -0.1180 -0.3122 -0.2407 -0.3164 0.2604 1.2487 -0.2712 -0.1445 -0.0079 -0.0209 -1.7480 -0.5139 +11 0.0170 0.0449 -0.2237 -0.2647 -0.0145 -0.0695 -0.2857 -0.1370 0.0057 0.0150 -1.7424 -0.4610 +12 0.0641 0.1697 -0.1596 -0.1716 -0.0679 -0.3257 -0.3536 -0.1542 0.1344 0.3555 -1.6080 -0.3868 +13 -0.0043 -0.0114 -0.1639 -0.1616 0.2537 1.2166 -0.0999 -0.0399 -0.0315 -0.0834 -1.6395 -0.3615 +14 -0.0988 -0.2615 -0.2627 -0.2391 0.1998 0.9584 0.0999 0.0369 0.4749 1.2565 -1.1646 -0.2370 +15 0.2020 0.5345 -0.0607 -0.0513 0.2558 1.2269 0.3558 0.1219 -0.7236 -1.9145 -1.8882 -0.3568
Dashed lines demarcate the anticipation window, event window, and post-event windows. AR indicates average abnormal returns, CAR indicates cumulative average abnormal returns, t indicates the value
of the test-statistic. Positive - Standard indicates standard approvals defined as NDA ‘type 1’ and review classification ‘Standard’. CAR for the anticipation window are calculated starting at day -10, starting
at day 0, and starting at day +2 for the anticipation, event, and post-event window respectively. Dotted underlined values are significant at the 10% level, underlined values at the 5% level, and underlined
bold values at the 1% level. Critical values were calculated using the normal distribution except for the negative announcements where the t distribution was used due to the low number of observations.
All critical values are two-tailed.

54|Event study analysis
6.2.4. EMEA
NASDAQ and NYSE Assets have a positive stock price anticipation prior to the actual EMEA
announcement, largely driven by the stock price response following the CHMP Opinion announcement.
A significant daily abnormal return is found for both NASDAQ (p < 0.0001) and NYSE (p = 0.0385) listed
companies at day -48, the trading day corresponding approximately with CHMP Opinion announcement
day. In the entire 60 day anticipation window, there are both significant positive and negative abnormal
returns, but none resulting in significant cumulative abnormal returns (Table 7). NYSE listed companies
have 10 significant abnormal daily returns in the entire anticipation window, however not resulting in
significant cumulative returns as there is an equal number of significant positive and negative returns.
Table 7: Overview of the event study statistics of EMEA positive NASDAQ and NYSE Assets calculated using the Fama-
French model and the NASDAQ Biotech Index and NYSE Pharmaceutical Index respectively.
Day Positive - NASDAQ Positive - NYSE
Daily Cumulative Daily Cumulative
AR t CAR t AR t CAR t
-10 0.1745 0.6978 0.1745 0.6978 -0,1880 -2.2404 -0.1880 -2.2404 -9 0.2194 0.8775 0.3938 0.7877 0,0579 0.6901 -0.1301 -0.7752 -8 -0.2858 -1.1430 0.1081 0.1441 0,1349 1.6075 0.0048 0.0190 -7 -0.1279 -0.5115 -0.0198 -0.0198 -0,1221 -1.4550 -0.1173 -0.3495 -6 -0.3109 -1.2436 -0.3307 -0.2646 -0,2042 -2.4328 -0.3215 -0.7661 -5 -0.1720 -0.6882 -0.5028 -0.3352 -0,2045 -2.4369 -0.5260 -1.0446 -4 -0.9014 -3.6056 -1.4042 -0.8024 0,2127 2.5348 -0.3133 -0.5333 -3 0.6109 2.4435 -0.7933 -0.3966 -0,1099 -1.3102 -0.4232 -0.6304 -2 0.0939 0.3756 -0.6994 -0.3108 -0,0484 -0.5770 -0.4716 -0.6244 -1 0.2155 0.8620 -0.4839 -0.1936 0,0596 0.7101 -0.4120 -0.4910
0 -0.5443 -2.1772 -0.5443 -2.1772 -0,0838 -0.9991 -0.0838 -0.9991 +1 -0.0184 -0.0736 -0.5627 -1.1254 -0,1496 -1.7827 -0.2334 -1.3909
+2 -0.4279 -1.7115 -0.4279 -1.7115 -0,0135 -0.1610 -0.0135 -0.1610 +3 -0.0655 -0.2622 -0.4934 -0.9869 -0,1256 -1.4964 -0.1391 -0.8287 +4 0.8430 3.3721 0.3496 0.4661 -0,0280 -0.3332 -0.1670 -0.6635 +5 0.5572 2.2288 0.9068 0.9068 -0,0740 -0.8823 -0.2411 -0.7182 +6 -0.4311 -1.7243 0.4757 0.3806 0,1186 1.4134 -0.1225 -0.2919 +7 0.0174 0.0696 0.4931 0.3287 -0,2175 -2.5913 -0.3399 -0.6751 +8 0.2323 0.9292 0.7254 0.4145 -0,1853 -2.2083 -0.5253 -0.8942 +9 -0.1856 -0.7425 0.5398 0.2699 0,0131 0.1565 -0.5121 -0.7628 +10 0.4547 1.8188 0.9945 0.4420 -0,0136 -0.1615 -0.5257 -0.6960 +11 -0.2532 -1.0129 0.7412 0.2965 -0,0269 -0.3209 -0.5526 -0.6585 +12 0.1007 0.4029 0.8420 0.3062 -0,2249 -2.6800 -0.7775 -0.8423 +13 0.1322 0.5286 0.9741 0.3247 -0,0774 -0.9226 -0.8549 -0.8490 +14 0.1506 0.6023 1.1247 0.3461 -0,0066 -0.0783 -0.8615 -0.7897 +15 0.4752 1.9008 1.5999 0.4571 0,0061 0.0727 -0.8554 -0.7281 Dashed lines demarcate the anticipation window, event window, and post-event windows. AR indicates average abnormal returns, CAR
indicates cumulative average abnormal returns, t indicates the value of the test-statistic. CAR for the anticipation window are calculated
starting at day -10, starting at day 0, and starting at day +2 for the anticipation, event, and post-event window respectively. Dotted
underlined values are significant at the 10% level, underlined values at the 5% level, and underlined bold values at the 1% level. Critical
values were calculated using the normal distribution except for the NASDAQ Assets where the t distribution was used due to the low
number of observations. All critical values are two-tailed.

Results and discussion|55
Both EMEA positive NASDAQ and NYSE Assets exhibit significant negative abnormal returns in the
announcement event window. These results are quite puzzling and can only be explained by anecdotal
trading strategies such as ‘buy the rumour, sell the news’. The stock price in the post-announcement
window shows both significant positive and negative abnormal returns, but no significant cumulative
returns (Table 7).
In general, there appears to be no significant ‘logical’ response of NASDAQ and NYSE listed companies to
official EMEA announcements. This could be explained by two different reasons. First, the sample under
study contains only NYSE and NASDAQ listed companies. It is not unreasonable to assume investors of
such companies are more focussed on the decisions made by the American FDA than by the European
EMEA. Second, the CHMP Opinion seems to be a more important decision than the official
announcement made later by the EMEA. However, I did not have access to an extensive dataset of
CHMP Opinion dates as only the official final EMEA announcement dates are publicly available. Further
research could focus on EMEA Opinion announcement dates, rather than final EMEA announcements
dates.


Methodology|57
7. BENEFITING FROM THE INSIGHTS – TRADING SIMULATIONS I simulated several trading strategies to test whether profitable trading strategies can be devised using
the insights obtained with respect to the stock price anticipation, immediate stock price response, and
post-announcement stock price behaviour. The simulated trading strategies were relatively simple as a
stock was always bought or sold a fixed number of days prior to or past the announcement date. The
performance of the trading strategies was benchmarked against index tracking investment returns.
The results pointing to possible profitable trading strategies are limited to FDA positive and FDA
negative NASDAQ related announcements. As a consequence, only these announcements events are
investigated for profitable trading strategies.
7.1. METHODOLOGY
Given a specific FDA announcement event, a virtual trading agent was given a 50% choice to either use
the event or not use the event as a trading opportunity. This simulates a real trading environment of a
retail investor which can only use a certain percentage of trading opportunities. Furthermore, this allows
for some variability in the returns which enables additional statistics to be determined rather than just
the average returns of trading all the announcement events. Once the virtual trading agent had decided
to initiate a trading position given the announcement event, the agent was allowed to invest a
maximum of 50% of the available funds in case of a ‘long’ investmet. In case of a short investment, the
trading agent was obliged to keep 100% of the short investment as margin; the agent could have a
maximum of 50% of the available funds as margin for a single short investment.
Furthermore, it is assumed the stocks were liquid enough to allow the trades to take place and that the
trades did not influence the stock behaviour due to perfect competition. Stocks were bought and sold at
the closing price and a 1% transaction cost was deducted from the invested funds each time a
transaction took place. Uninvested funds (excess liquidity) could be invested in the ^NBI or ^IXIC.
Indexes were purchased at the day high and sold at the day low price; this ‘spread crossing’ acts as the
transaction fee.
Several scenarios were analysed in which the trading agent could buy or sell a stock on a fixed number
of days prior to or past the announcement date. The trading agent was allowed to take both long (i.e.
buy in the hope to sell at a higher price) and short (i.e. sell in the hope to buy back a lower price)
positions.
58|Benefiting from the insights – trading simulations
A virtual trading portfolio was initiated with $10,000 at 1 November 2007. Holding period returns
according to equation (1) were calculated at 1 September 2012. For each of the different scenarios,
1,000 simulations were performed of which the HPR, the average HPR, variance of the HPR, excess
returns and an Excess Performance was calculated.
The Excess Performance (EP) index, similar to the Sharpe ratio, was calculated as following:
(35)
where is the simulated holding period return averaged over all simulations, the holding
period return of either the ^NBI or ^IXIC, and the standard error of the excess returns.
7.2. RESULTS AND DISCUSSION
7.2.1. INDEX RETURNS
Holding period returns were calculated for the entire period (1 November 2007 – 1 September 2012) for
both the ^NBI and ^IXIC. The holding period return was 61.69% for the ^NBI and 12.76% for the ^IXIC.
7.2.2. ANTICIPATION WINDOW
Buying NASDAQ Assets 60 days prior to the announcement date and selling them 5 days prior to the
announcement date results in an average HPR of 182.68%, clearly outperforming both the ^NBI and
^IXIC (Table 8). The distribution of HPRs is not symmetrical; returns larger than 600% could be obtained
using this trading strategy. This trading strategy never results in negative returns and almost always
performs better than the HPR obtained by investing in ^NBI or ^IXIC (Figure 12). Consequently, selling
NASDAQ Assets 60 days prior to the announcement date and buying them back 5 days prior to the
announcement date results in a loss larger than 99 % (Table 9).
Investing the excess liquidity in an index lowers the variance of the obtained returns, but at a cost of a
lower average return. The EP index either changes slightly in a positive direction or changes a lot in a
negative direction. Most of the time, most of the money is invested, making the incurred transaction
costs responsible for the negative impact of this investment strategy. For example the window between
60 and 5 trading days prior the announcement date is 55 trading days long and there are 91 FDA events
which are traded in these simulations; periods of excess liquidity are very short and the amounts of
excess liquidity very small. However, the returns of the simulations using liquidity investment depend
largely on the cost factor applied to step in and out of index investments. When costs are doubled per

Results and discussion|59
opening/closing trade, the average return drops from 179.47% to 141.06%. Although still significantly
outperforming both the ^NBI and ^IXIC, a significant reduction in returns is observed.
Figure 12: Distribution of simulated trading returns using an anctipation trading strategy where NASDAQ listed stocks are
purchased 60 days prior to an FDA announcement and sold 5 days prior to an FDA announcement. The short dashed line
indicates the holding period return of the ^NBI, the long dashed line the holding period return ofthe ^IXIC.
7.2.3. ANNOUNCEMENT EVENT
A strategy where an investor does not know whether the FDA announcement will be positive or
negative cannot earn money with either a long or short strategy when initiating the trading position 60
days prior to the announcement date. A strategy where trading positions are initiated 60 days prior to
the announcement date will be able to capture the stock price increase in the entire anticipation

60|Benefiting from the insights – trading simulations
window. However, the large stock price reaction (both negative or positive) will wipe out a large portion
of the invested funds. Once a large majority of the money is wiped out by a bad investment, it is difficult
to earn back a sizeable capital (see Table 8 for long strategies and Table 9 for short strategies). This
means an investor cannot earn money by blindly ‘placing bets’, unless he has some method to
determine the actual outcome of the announcements in advance.
A strategy where an investor buys 5 days prior to the announcement date will not be profitable as the
anticipation is completely priced in already. However, as was noticed before (Sharma and Lacey 2004)
and is evident from the research conducted in this thesis, responses to FDA announcements are highly
assymetric; i.e. negative announcements have a far more negative impact than the positive impact of
positive news. Bearing this in mind, a profitable trading strategy can be found in going short prior to all
announcements (-5 days) and closing the position immediately after the announcement (+2 days). This
strategy results in an average HPR of 172 %. However, as this strategy relies on the ratio of the number
of positive and negative FDA announcements, which is unknown ex-ante, this remains a risky strategy. A
situation where only positive FDA announcements are used in this shorting strategy results in losses of
69.40%.
Table 8: Summary statistics of trading simulations using different 'long' strategies.
Buy/Sell Liq.
[-60; -5]** None 182.68% 120.58% 168.59% 130.26% 1.0565 1.4860 NBI 179.47% 117.78% 166.80% 119.89% 1.07842 1.5272 IXIC 145.09% 83.408% 132.43% 110.66% 0.7929 1.2588
[-60; +2] None -4.54% -66.23% -17.21% 48.59% -0.9500 -0.2469 NBI -10.60% -72.29% -23.70% 37.50% -1.1804 -0.3799 IXIC -19.52% -81.21% -32.19% 45.59% -1.2444 -0.4932
[-60; +15] None -0.63% -62.32% -13.30% 40.34% -0.9812 -0.2094 NBI -1.81% -63.50% -14.48% 34.98% -1.0736 -0.2448 IXIC -16,15% -77.84% -28.82% 25.83% -1.5314 -0.5669
[-5; +2] None -89.68% -151.37% -102.35% 0.13% -41.8802 -28.3182 NBI -90.61% -152.30% -103.28% 0.18% -22.8665 -15.3003 IXIC -89.20% -150.89% -101.87% 0.17% -36.9287 -24.9319
[+1; +15] None -84.55% -146.23% -97.22% 0.29% -27.201 -18.0831 NBI -75.05% -138.56% -89.55% 0.69% -16.6946 -10.7888 IXIC -83.74% -145.43% -96.41% 0.30% -26.7509 -17.7343 * Indicate profitable strategies, ** indicates profitable strategies outperforming index tracking investments.
Liq. Indicates wherein the excess liquidy funds were invested.

Concluding remarks|61
Table 9: Summary statistics of trading simulations using different 'short' strategies.
Sell/Buy Liq.
[-60, -5] None -99.12% -160.08% -111.779% 4.15% -7.8943 -5.4879 [-60; +2] None -99.39% -161.07% -112.06% 40.07% -2.5446 -1.7702 [-60; +15] None -99.45% -161.13% -112.12% 46.27% -2.3689 -1.6483 [-5, +2]N** None 415.16% 353.47% 402.49% 486.28% 1.6029 1.8252 [-5; +2]P None -69.40% -131.09% -82.07% 3.15% -7.3889 -4.6259 [-5; +2]** None 172.26% 110.57% 159.59% 355.15% 0.5867 0.8468 [+1; +15]N* None 60.93% -0.76% 48.26% 14.84% -0.0196 1.2531 [+1; +15]P* None 8.99% -52.69% -3.67% 9.31% -1.7262 -0.1204 [+1, +15]** None 68.29% 6.61% 55.62% 35.21% 0.1113 0.9374 P and N correspond to positive and negative announcements respectively. * Indicates profitable strategies, ** indicates profitable strategies outperforming index tracking investments.
Liq. Indicates wherein the excess liquidy funds were invested.
7.2.4. POST-ANNOUNCEMENT
Anecdotal evidence suggests many retail investors are frustrated with an apparent rational trading
strategy. Relatively risk-averse retail investors are attracted by the high returns of small biotech firms
induced by positive regulatory decisions. However, in an effort to avoid the risk imposed by the
regulatory decision, many investors purchase after the announcement. However, in previous sections it
has been demonstrated there are significant negative returns in the trading days following the
announcement for NASDAQ Assets.
Indeed, a trading strategy where stocks are purchased 2 days after the announcement has been made
and sold 15 days after the announcement results in an average HPR of -84.55% with a variance of 0.29%,
a certain but losing strategy (Table 8). However, a short strategy where stocks are shorted immediately
after the announcement (day +1) and bought back a short period later (day +15) results in an average
HPR of 60.93%. The result is more outspoken when this strategy is only applied to negative
announcements. The strategy is profitable and outperforming an ^IXIC investment, but not an ^NBI
investment though (Table 9).
7.3. CONCLUDING REMARKS
This section demonstrated the insights obtained in this thesis can indeed result in profitable trading
strategies when considering FDA positive and negative NASDAQ Assets. A strategy where an investors
goes long 60 days prior the announcement date and closes the position 5 days prior to the
announcement date results in average returns outperforming index tracking investments. So does a
strategy where an investor goes short 5 days prior to the announcement date and closes the position 2
days past the announcement date. Furthermore, a strategy where an investor goes short immediately

62|Benefiting from the insights – trading simulations
after the announcement and closes the position 15 days later, results in positive returns which are not
larger than index tracking investments.
Further research could focus on more advanced trading strategies combining the insights from this
section. Furthermore, analyses could be performed, similar to the analyses carried out by Sharpe in his
seminal market timing parper, where an investor has the ability to guess a certain percentage of
outcomes correctly (Sharpe 1975). This way, a relationship could be determined between the
profitability of certain trading strategies and the ability to ‘predict’ regulatory announcements.

Concluding remarks|63
8. CONCLUSIONS AND FUTURE PERSPECTIVES The stock price response of NASDAQ and NYSE listed companies to 403 regulatory decisions by the US
Food and Drug Administration (FDA) and European Medicine Agency (EMEA) between January 2008 and
September 2012 was investigated in this study. There are clear differences between stock price
responses to FDA and EMEA decisions and between NASDAQ and NYSE listed companies. The stock price
of NASDAQ listed companies shows a significant positive anticipation over a 60 day window leading up
to both positive and negative FDA announcements. Trading strategies exploiting this positive
anticipation result in significant excess positive returns. In case of negative FDA announcements,
NASDAQ listed companies show a significant short-term decline prior to the actual announcement. This
is probably the result of particular investors selling the stock in anticipation of the actual negative
announcement, possibly having non-public information regarding the decision.
NASDAQ listed companies show significant instantaneous stock price responses on the day of the FDA
announcement. However, responses are clearly asymetrical; negative news comes more as a shock than
positive news. Overall, managers should be very careful at considering the signals they send to the
markets before final approvals since negative surprises are heavenly sanctioned by financial markets.
Again, trading strategies exploiting this asymetry result in significant excess returns.
The stock price of NASDAQ listed companies do not respond efficiently to FDA announcements;
investors seem to have been overoptimistic immediately following an announcement. Both following
positive and negative FDA announcements, the stock price of NASDAQ listed companies show significant
negative returns. The stock price of NYSE listed companies show some positive anticipation leading up
to positive FDA announcements. However, there is no significant response on the announcement day or
the days following the announcement.
These findings only partially partially correspond with earlier results. However, the period under
consideration (2008-2012) was atypical and contained both periods of high and low volatility and high
and low stock investor confidence. Further research will need to be carried out to verify whether these
observed results are typical for the period under consideration or are also present in future time
periods. Furthermore, futurer research could also focus on the different subperiods in the 2008-2012
period where periods of global market enthusiasm were followed by periods of severe global market
pessimism.
64|Conclusions and future perspectives
Both NASDAQ and NYSE listed companies do not seem to systematically anticipate or respond to
positive EMEA announcements. These differences between the response to FDA and EMEA
announcements is striking and could be the subject of more detailed future research. However, this
study focussed solely on companies listed on American exchanges, probably focussing more on the
American market. Companies listed on European exchanges might be more responsive to European
regulatory announcements than American companies or to American regulatory announcements.

References|65
REFERENCES Adams, C. P. and V. V. Brantner (2010). "Spending on new drug development." Health Economics 19(2): 130-141. Akhigbe, A., S. J. Larson, et al. (2002). "Market underreaction and overreaction of technology stocks." Journal of
Psychology and Financial Markets 3(3): 141-151. Andrew, J. (2012). "Pharma tries to avoid falling off ‘patent cliff’." Financial Times Retrieved 12/03/2013, from
http://www.ft.com/intl/cms/s/0/572ea510-9452-11e1-bb47-00144feab49a.html#axzz2MZCcSs00. Armenean, A. (2012). Market reaction to FDA announcements in the context of Patent Cliff. Barber, B. M. and T. Odean (2011). All that glitters: The effect of attention and news on the buying behavior of
individual and institutional investors. The Handbook of News Analytics in Finance, John Wiley & Sons, Ltd.: 173-210.
Bartlett, M. S. (1937). "Properties of sufficiency and statistical tests." Proceedings of the Royal Society of London. Series A - Mathematical and Physical Sciences 160(901): 268-282.
Bastin, V. and G. Hübner (2006). "Concentrated announcements on clustered data: An event study on biotechnology stocks." Financial Management 35(1): 129-157.
Berkman, H., P. D. Koch, et al. (2012). "Informed trading through the accounts of children." Journal of Finance Forthcoming.
Bosch, J.-C. and I. Lee (1994). "Wealth effects of food and drug administration (FDA) decisions." Managerial and Decision Economics 15(6): 589-599.
Bren, L. (2001). "Frances Oldham Kelsey: FDA medical reviewer leaves her mark on history." FDA Retrieved 12/03/2013, from http://permanent.access.gpo.gov/lps1609/www.fda.gov/fdac/features/2001/201_kelsey.html.
Brown, S. J. and J. B. Warner (1985). "Using daily stock returns: The case of event studies." Journal of Financial Economics 14(1): 3-31.
Canivet, J. (2010). "Small cap analyst coverage: An "under-the-radar" dilemma." World Federation of Exchanges Retrieved 10/04/2013, from http://www.world-exchanges.org/insight/views/small-cap-analyst-coverage-under-radar-dilemma.
Chen, N.-F., R. Roll, et al. (1986). "Economic forces and the stock market." The Journal of Business 59(3): 383-403. Cohen, S. (1960). "Sleep regulation with thalidomide." American Journal of Psychiatry 116: 1030-1031. Conrad, J., M. N. Gultekin, et al. (1997). "Profitability of short-term contrarian strategies: Implications for market
efficiency." Journal of Business & Economic Statistics 15(3): 379-386. Cox Gad, S. (2009). Clinical trials handbook. Hoboken, NJ, USA, John Wiley and Sons. Cozens, S. (2005). Advanced Perl programming. Sebastopol, CA, USA, O'Reilly & Associates. Daniel, K., D. Hirshleifer, et al. (1998). "Investor psychology and security market under- and overreactions." The
Journal of Finance 53(6): 1839-1885. Danzon, P. M. and M. F. Furukawa (2011). "Cross-national evidence on generic pharmaceuticals: pharmacy vs.
physician-driven markets." SSRN working paper 17226. De Bondt, W. F. M. and R. Thaler (1985). "Does the stock market overreact?" The Journal of Finance 40(3): 793-
805. De Jong, F. (2007). Event studies methodology. Dedman, E., S. W. J. Lin, et al. (2008). "Voluntary disclosure and its impact on share prices: Evidence from the UK
biotechnology sector." Journal of Accounting and Public Policy 27(3): 195-216. Del Guercio, D., E. R. Odders-White, et al. (2011). "An analysis of the price and liquidity effects of illegal insider
trading." SSRN working paper 1784528. DiMasi, J. A., R. W. Hansen, et al. (2003). "The price of innovation: new estimates of drug development costs."
Journal of Health Economics 22(2): 151-185. Downing, N. S., J. A. Aminawung, et al. (2012). "Regulatory review of novel therapeutics: Comparison of three
regulatory agencies." New England Journal of Medicine 366(24): 2284-2293. Eriksson, T., S. Bjorkman, et al. (1995). "Stereospecific determination, chiral inversion in vitro and
pharmacokinetics in humans of the enantiomers of thalidomide." Chirality 7: 44-52. Fama, E. F. and K. R. French (1993). "Common risk factors in the returns on stocks and bonds." Journal of Financial
Economics 33(1): 3-56.

66|References
FDA (2010). Is the U.S. really slower than Europe in approving new drugs? FDA. (2013). "U.S. Food and Drugs Administration: How drugs are developed and approved." 08/04/2013, from
http://www.fda.gov/drugs/developmentapprovalprocess/howdrugsaredevelopedandapproved/approvalapplications/investigationalnewdrugindapplication/default.htm.
Foy, B. D. (2007). Mastering Perl. Sebastopol, CA, USA, O'Reilly & Associates. Franks, M. E., G. R. Macpherson, et al. (2004). "Thalidomide." The Lancet 363: 1802-1811. French, C. W. (2003). "The Treynor Capital Asset Pricing Model." Journal of Investment Management 1(2): 60-72. Gaoa, X., J. R. Ritterb, et al. (2012). "Where have all the IPOs gone?" SSRN working paper 1954788. Giroud, A., H. Tuchmann-Duplessis, et al. (1962). "Observations on the teratogenic repercussions of thalidomide in
the mouse and rabbit [French]." Comptes Rendus des Seances de la Societe de Biologie et de ses Filiales 156: 765-768.
Goldstein, S. (2012). "SEC alleges largest-ever insider-trading scheme." MarketWatch Retrieved 12/03/2013, from http://www.marketwatch.com/story/sec-alleges-largest-ever-insider-trading-scheme-2012-11-20.
Goozner, M. (2011). "Stocks’ study renews concerns over insider trading on oncology drugs." Journal of the National Cancer Institute 103(22): 1652-1655.
Guagliano, C., N. Linciano, et al. (2013). "The impact of financial analyst reports on small caps prices in Italy." CONSOB working paper 73.
Heavey, S. (2012). "Groups urge FDA to release info on rejected drugs." Reuters Retrieved 12/03/2013, from http://www.reuters.com/article/2009/06/24/us-fda-data-idUSTRE55N65220090624.
Herper, M. (2012). "The truly staggering cost of inventing new drugs." Forbes Retrieved 12/03/2013, from http://www.forbes.com/sites/matthewherper/2012/02/10/the-truly-staggering-cost-of-inventing-new-drugs/.
Herper, M. and R. Langreth. (2008). "Cancer drug winners and losers." Forbes Retrieved 03/04/2013, from http://www.forbes.com/2008/06/02/asco-novartis-cancer-biz-healthcare-cx_mh_0602asco.html.
Himmelmann, A. and D. Schiereck (2012). "Drug approval decisions: A note on stock liquidity effects." Journal of Empirical Finance 19(5): 640-652.
Huberman, G. and T. Regev (2001). "Contagious speculation and a cure for cancer: A nonevent that made stock prices soar." The Journal of Finance 56(1): 387-396.
Issa, D. (2012). FDA’s contribution to the drug shortage crisis. U.S. House of Representatives: Committee on oversight and government reform.
Johnson-Pratt, L. R. (2010). Phase IV drug development: Post-marketing studies. Principles and Practice of Pharmaceutical Medicine, Wiley-Blackwell: 124-130.
Lakonishok, J., A. Shleifer, et al. (1992). "The impact of institutional trading on stock prices." Journal of Financial Economics 32(1): 23-43.
Ledford, H. (2013). "Insider trading sparks concerns." Nature 493(23325185): 280-281. MacKinlay, A. C. (1997). "Event studies in economics and finance." Journal of Economic Literature 35(1): 13-39. Makarov, I. and D. Papanikolaou (2007). "Sources of systematic risk." SSRN working paper 968229. Markowitz, H. (1952). "Portfolio selection." The Journal of Finance 7(1): 77-91. Matthews, S. J. and C. McCoy (2003). "Thalidomide: a review of approved and investigational uses." Clinical
Therapeutics 25: 342-395. Meinert, C. L. and S. Tonascia (1986). Clinical trials: design, conduct, and analysis. New York, USA, Oxford
University Press. Overgaard, C. B., R. A. van den Broek, et al. (2000). "Biotechnology stock prices before public announcements:
evidence of insider trading?" Journal of Investigative Medicine 48(10736971): 118-124. Pierson, R. (2012). "Bristol-Myers results lag as Plavix sales evaporate." Reuters Retrieved 08/04/2013, from
http://www.reuters.com/article/2012/10/24/us-bristolmyers-results-idUSBRE89N0NL20121024. Remy, F. (2013). "ThromboGenics à la merci des short sellers?" L'Echo Retrieved 15/04/2013, from
http://www.lecho.be/actualite/marche_placements_marches/ThromboGenics_a_la_merci_des_short_sellers.9325466-3459.art?ckc=1.
Ross, S. A. and R. W. Westerfield (2002). Fundamentals of corporate finance, sixth edition, alternate edition. New York City, NY, USA, McGraw−Hill Primis.
Rothenstein, J. M., G. Tomlinson, et al. (2011). "Company stock prices before and after public announcements related to oncology drugs." Journal of the National Cancer Institute 103(21949081): 1507-1512.

References|67
Roy, A. S. A. (2012). Stifling new cures: The true cost of lengthy clinical drug trials. Project FDA. Rozelman, E. (2011). "Volatility rattles biotechnology sector." Genetic Engineering & Biotechnology News
Retrieved 4/4/2013, from http://www.genengnews.com/gen-articles/volatility-rattles-biotechnology-sector/3903/.
Sarkar, J. and P. J. de Jong (2006). "Market response to FDA announcements." The Quarterly Review of Economics and Finance 46(4): 586-597.
Scannel, K. (2012). "Insider trading probe broadens to pharma stocks." Financial Times Retrieved 12/03/2013, from http://www.ft.com/intl/cms/s/0/46116d38-624f-11e1-872e-00144feabdc0.html#axzz2MZCcSs00.
Schwartz, R. L. and T. Phoenix (2003). Learning Perl objects, references & modules. Sebastopol, CA, USA, O'Reilly & Associates.
Schwert, G. W. (1981). "Measuring the effects of regulation: evidence from the capital markets." Journal of Law and Economics 25: 121-145.
Sharma, A. and N. Lacey (2004). "Linking product development outcomes to market valuation of the firm: The case of the U.S. pharmaceutical industry." Journal of Product Innovation Management 21(5): 297-308.
Sharpe, W. F. (1964). "Capital asset prices: A theory of market equilibrium under conditions of risk." The Journal of Finance 19(3): 425-442.
Sharpe, W. F. (1975). "Likely gains from market timing." Financial Analysts Journal 31(2): 60-69. Siddiqui, Z. (2013). "Dynavax may have to repitch hepatitis B vaccine for smaller market." Reuters Retrieved
4/4/2013, from http://www.reuters.com/article/2013/02/25/us-dynavax-fda-idUSBRE91O0F320130225. Somers, G. F. (1960). "Pharmacological properties of thalidomide (alpha-phthalimido glutarimide), a new sedative
hypnotic drug." British Journal of Pharmacology and Chemotherapy 15: 111-116. Speirs, A. L. (1962). "Thalidomide and congenital abnormalities." The Lancet 1: 303-305. Steinbrook, R. (2005). "Wall Street and clinical trials." New England Journal of Medicine 353(11): 1091-1093. The Lancet (2009). "Phase 0 trials: a platform for drug development?" The Lancet 374(9685): 176. United States. (2007). "Title V - intellectual property." Patent and Trademark Office Retrieved 12/03/2013, from
http://www.uspto.gov/web/offices/com/doc/uruguay/uraaact.html. Voreacos, D. (2012). "Ex-SAC manager was ‘pupil’ of doctor accused of tips." Bloomberg Retrieved 12/03/2013,
from http://www.bloomberg.com/news/2012-11-20/ex-sac-manager-was-pupil-of-doctor-accused-of-tips.html.
Voreacos, D. (2012). "Insider mulls suicide as health care tipping wave grows." Bloomberg Retrieved 12/03/2013, from http://www.bloomberg.com/news/2012-11-12/insider-mulls-suicide-as-health-care-tipping-wave-grows.html.
Webb, J. F. (1963). "Canadian thalidomide experience." Canadian Medical Association Journal 89: 987-992. Weston, J. F. and P. Halpern (1983). "Corporate acquisitions: A theory of special cases? A review of event studies
applied to acquisitions." The Journal of Finance 38(2): 297-317. Wilcoxon, F. (1945). "Individual comparisons by ranking methods." Biometrics Bulletin 1(6): 80-83.

Appendices|69
APPENDICES Appendix 1: Overview of the Big Pharma (BP) companies subsample used in different analyses. ............................. 71
Appendix 2: Overview of the FDA event data ............................................................................................................. 73
Appendix 3: Descriptive statistics of the companies of which the FDA approved or refused products between
January 2008 and September 2012. ............................................................................................................................ 77
Appendix 4: Descriptive statistics of the companies of which the EMEA approved or refused products between
January 2008 and September 2012. ............................................................................................................................ 79
Appendix 5: Overview of the analysis framework ....................................................................................................... 81
Appendix 6: Distribution of normalized daily NASDAQ and NYSE returns. ................................................................. 85
Appendix 7: 16 Members of the NYSE Pharmaceutical (DRG) index ........................................................................... 87
Appendix 8: Return ranking distributions of the event window split per day ............................................................. 89
Appendix 9: Return prediction correlations of Fama-French R2s obtained using different training windows. ........... 93
Appendix 10: Event study training regression parameters ......................................................................................... 95
Appendix 11: Additional CAR calculations in the anticipation window for FDA NASDAQ Assets. ............................... 97

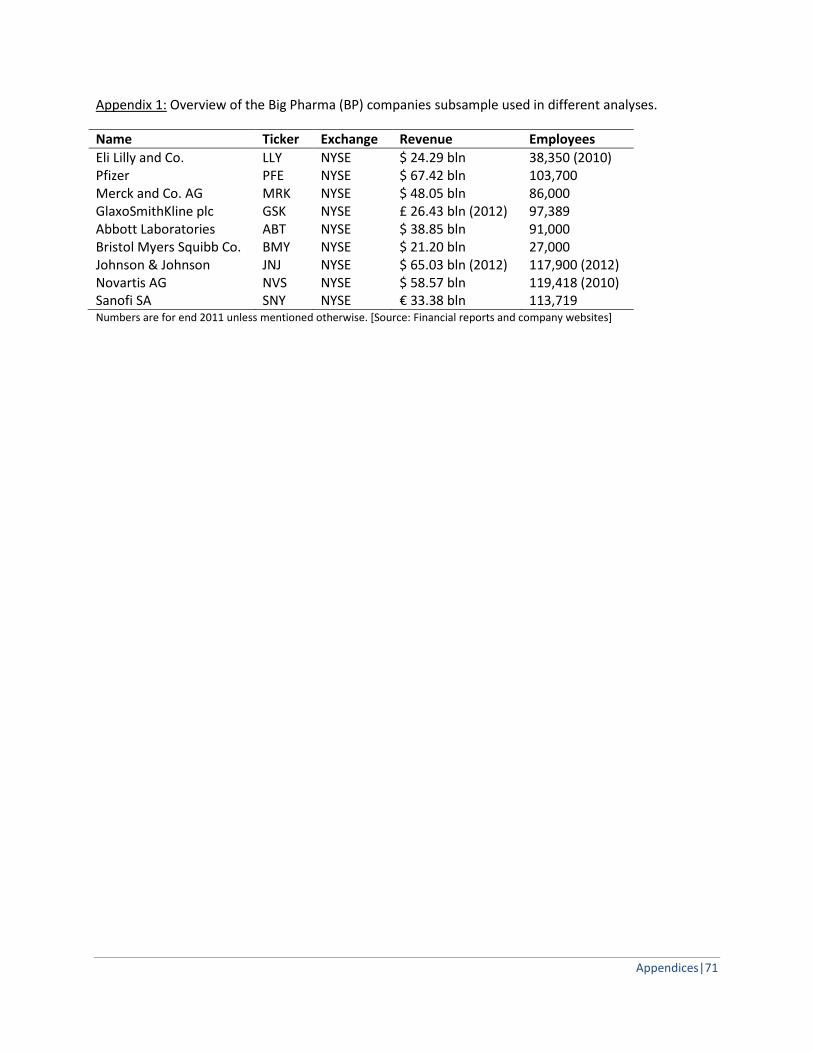
Appendices|71
Appendix 1: Overview of the Big Pharma (BP) companies subsample used in different analyses.
Name Ticker Exchange Revenue Employees
Eli Lilly and Co. LLY NYSE $ 24.29 bln 38,350 (2010) Pfizer PFE NYSE $ 67.42 bln 103,700 Merck and Co. AG MRK NYSE $ 48.05 bln 86,000 GlaxoSmithKline plc GSK NYSE £ 26.43 bln (2012) 97,389 Abbott Laboratories ABT NYSE $ 38.85 bln 91,000 Bristol Myers Squibb Co. BMY NYSE $ 21.20 bln 27,000 Johnson & Johnson JNJ NYSE $ 65.03 bln (2012) 117,900 (2012) Novartis AG NVS NYSE $ 58.57 bln 119,418 (2010) Sanofi SA SNY NYSE € 33.38 bln 113,719 Numbers are for end 2011 unless mentioned otherwise. [Source: Financial reports and company websites]

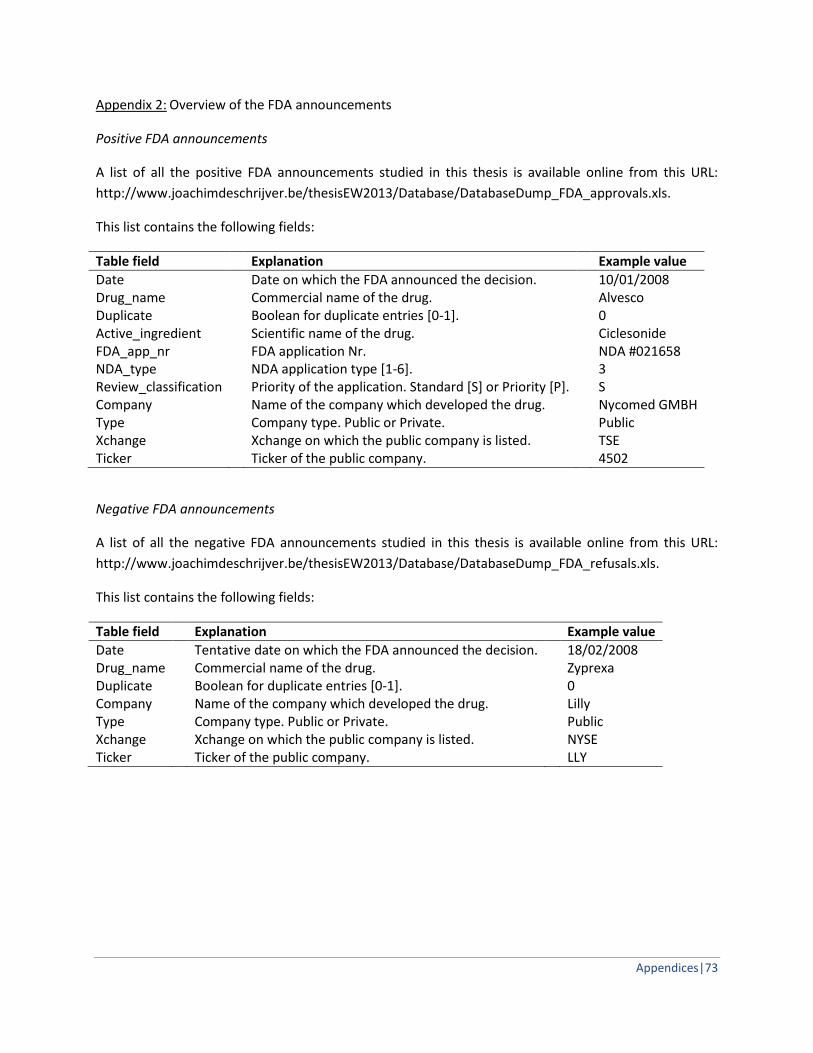
Appendices|73
Appendix 2: Overview of the FDA announcements
Positive FDA announcements
A list of all the positive FDA announcements studied in this thesis is available online from this URL:
http://www.joachimdeschrijver.be/thesisEW2013/Database/DatabaseDump_FDA_approvals.xls.
This list contains the following fields:
Table field Explanation Example value
Date Date on which the FDA announced the decision. 10/01/2008 Drug_name Commercial name of the drug. Alvesco Duplicate Boolean for duplicate entries [0-1]. 0 Active_ingredient Scientific name of the drug. Ciclesonide FDA_app_nr FDA application Nr. NDA #021658 NDA_type NDA application type [1-6]. 3 Review_classification Priority of the application. Standard [S] or Priority [P]. S Company Name of the company which developed the drug. Nycomed GMBH Type Company type. Public or Private. Public Xchange Xchange on which the public company is listed. TSE Ticker Ticker of the public company. 4502
Negative FDA announcements
A list of all the negative FDA announcements studied in this thesis is available online from this URL:
http://www.joachimdeschrijver.be/thesisEW2013/Database/DatabaseDump_FDA_refusals.xls.
This list contains the following fields:
Table field Explanation Example value
Date Tentative date on which the FDA announced the decision. 18/02/2008 Drug_name Commercial name of the drug. Zyprexa Duplicate Boolean for duplicate entries [0-1]. 0 Company Name of the company which developed the drug. Lilly Type Company type. Public or Private. Public Xchange Xchange on which the public company is listed. NYSE Ticker Ticker of the public company. LLY


Appendices|75
Appendix 3: Overview of the EMEA announcements
A list of all the EMEA announcements studied in this thesis is available online from this URL:
http://www.joachimdeschrijver.be/thesisEW2013/Database/DatabaseDump_EMEA_all.xls.
This list contains the following fields:
Table field Explanation Example value
Medicine Name Commercial name of the drug Tesavel Product Number EMEA number of the drug application EMEA/H/C/000910 Active Substance Scientific name of the drug sitagliptin Common name Common name of the drug sitagliptin ATC code ATC code designation L04AA06 Status Status of the application (authorised/refused) Authorised Revision numer Number of revision 6 Authorization date Date of decision 20/05/2008 Condition Approval Boolean for conditional approval [0-1] 0 Exceptional Boolean for exceptional circumstances [0-1] 0 Is Orphan Boolean for orphan medicine [0-1] 0 Is Generic Boolean for generic medicine [0-1] 0 Is Biosimilar Boolean for biosimiliar medicine [0-1] 0 Duplicate Boolean for duplicate entries [0-1]. 0 Company Name of the company which developed the drug. Lilly Type Company type. Public or Private. Public Xchange Xchange on which the public company is listed. NYSE Ticker Ticker of the public company. LLY


Appendices|77
Appendix 4: Descriptive statistics of the companies of which the FDA approved or refused products
between January 2008 and September 2012.
FDA approvals
Type Trading place Count Percentage
Private 130 29.6 % Public 308 70.4 %
NYSE New York Stock Exchange, USA 153 49.7 % NASDAQ NASDAQ, USA 60 19.5 % NSE National Stock Exchange, India 24 7.8 % TSE Tokyo Stock Exchange, Japan 23 7.5 % LSE London Stock Exchange, UK 11 3.6 % FWB Frankfurt Stock Exchange, Germany 7 2.3 % OMX STO Stockholm Stock Exchange, Sweden 5 1.6 % EBR Euronext Brussels, Belgium 5 1.6 % OTC Over-The-Counter Market, USA 4 1.3 % SIX SIX Swiss Exchange, Switzerland 4 1.3 % TSX Toronto Stock Exchange, Canada 4 1.3 % OMX CPH Copenhagen Stock Exchange, Denmark 3 1.0 % ASX Australian Stock Exchange 2 1.0 % ERP Euronext Paris, France 1 0.5 % BI MI Borsa Italia Milan, Italy 1 0.5 % STU Stuttgart Stock Exchange, Germany 1 0.5 %
Grand total 438 100 %
FDA refusals
Type Trading place Count Percentage
Private 8 11.6 % Public 61 88.4 %
NASDAQ New York Stock Exchange, USA 44 72.1 % NYSE NASDAQ, USA 8 11.6 % AMEX National Stock Exchange, India 3 4.9 % OTC Over-The-Counter Market, USA 3 4.9 % ASX Australian Stock Exchange 1 1.6 % FWB Frankfurt Stock Exchange, Germany 1 1.6 % ERP Euronext Paris, France 1 1.6 %
Grand total 69 100 %

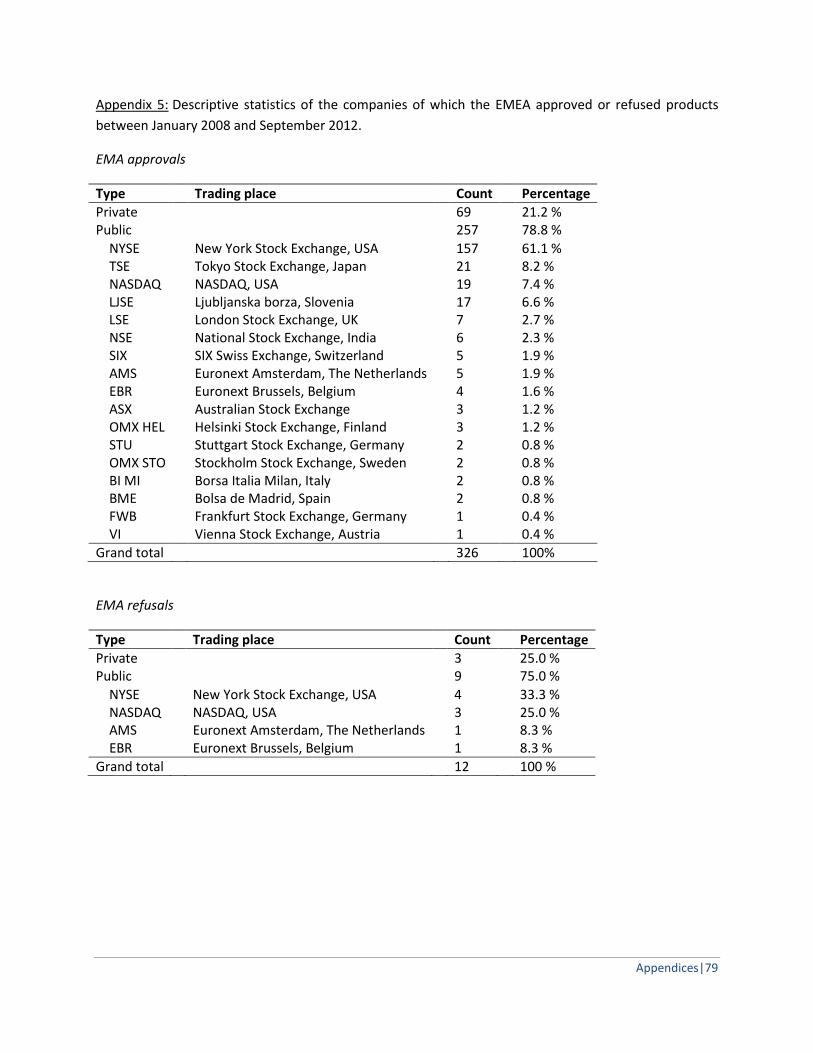
Appendices|79
Appendix 5: Descriptive statistics of the companies of which the EMEA approved or refused products
between January 2008 and September 2012.
EMA approvals
Type Trading place Count Percentage
Private 69 21.2 % Public 257 78.8 %
NYSE New York Stock Exchange, USA 157 61.1 % TSE Tokyo Stock Exchange, Japan 21 8.2 % NASDAQ NASDAQ, USA 19 7.4 % LJSE Ljubljanska borza, Slovenia 17 6.6 % LSE London Stock Exchange, UK 7 2.7 % NSE National Stock Exchange, India 6 2.3 % SIX SIX Swiss Exchange, Switzerland 5 1.9 % AMS Euronext Amsterdam, The Netherlands 5 1.9 % EBR Euronext Brussels, Belgium 4 1.6 % ASX Australian Stock Exchange 3 1.2 % OMX HEL Helsinki Stock Exchange, Finland 3 1.2 % STU Stuttgart Stock Exchange, Germany 2 0.8 % OMX STO Stockholm Stock Exchange, Sweden 2 0.8 % BI MI Borsa Italia Milan, Italy 2 0.8 % BME Bolsa de Madrid, Spain 2 0.8 % FWB Frankfurt Stock Exchange, Germany 1 0.4 % VI Vienna Stock Exchange, Austria 1 0.4 %
Grand total 326 100%
EMA refusals
Type Trading place Count Percentage
Private 3 25.0 % Public 9 75.0 %
NYSE New York Stock Exchange, USA 4 33.3 % NASDAQ NASDAQ, USA 3 25.0 % AMS Euronext Amsterdam, The Netherlands 1 8.3 % EBR Euronext Brussels, Belgium 1 8.3 %
Grand total 12 100 %


Appendices|81
Appendix 6: Overview of the analysis framework
A large quantity of data needed to be analysed and aggregated; this for different agencies (FDA and
EMEA), different exchanges (NASDAQ and NYSE), and different announcements (positive and negative).
To ensure an identical analysis methodology over all different datasets, avoid human errors, speed up
analyses, and automate analyses in general, a computational analysis framework was developed in Perl
(Schwartz and Phoenix 2003; Cozens 2005; Foy 2007) and R which allows each of these goals to be met.
The analysis framework can be divided into two main parts: 1) the event part and 2) the prices part, as
shown in the image below. Both the daily price information of all the stocks of interest and the FDA and
EMEA announcements of interest are stored in a relational MySQL database. Using the
query_events functionality, a user can fill an EventBackpack object with
SingleDecisionEvent objects. For example, a searching query can be defined as agency = ‘FDA’,
announcement type = ‘authorised’, and trading exchange = ‘NASDAQ’. Using these parameters, the
EventBackpack will be filled with all the announcement events (=SingleDecisionEvent
objects) satisfying these conditions.
Each of these SingleDecisionEvent objects can then be converted to an EventDayChain
object using the pricing information which is queried from the price database through
SingleTradingDay objects. Eventually, an EventDayChain object becomes an object which
contains a series of pricing information in a user defined window around the actual announcement date.
For example, a typical analysis script wants to retrieve stock price information from -60 trading days to -
1 trading day in respect to the actual announcement day; and this only for companies listed on for
example NASDAQ having products approved by the FDA . Using the data contained in a
SingleDecisionEvent object, and specifying -60 to -1 days, pricing information will be
automatically retrieved from the database and organised in such a way so that future analyses are
straightforward (using the retrieve_SingleTradingDays_around_window functionality).
Once all data on a single announcement is stored in a single EventDayChain object, users can attach
reference indexes using the attach_index_reference functionality. Again, all pricing information
is automaticall retrieved from the database, checked for consistency with the stock price information,
and prepared for future analyses. Once a reference is attached, the user can automatically regress
observed returns on a number of explanatory variables such as for example index returns (i.e. calculate
factor model coefficients) or Fama-French parameters. Once these regressions are carried out, the user

82|Appendices
can retrieve the value of the coefficients, but also t-statistics or p-values to test significance. Once these
coefficients are determined, normal returns, cumulative normal returns, abnormal returns, variance of
returns, cumulative abnormal returns, normalized abnormal returns etc can easily be calculated.
Important to note is that all these operations are carried out on the entire chain of prices
(EventDayChain object). It is only a small step to aggregate the results over different events and
come up with aggregated conclusions for an entire EventBackpack object. After the data has been
exported, most figures in this thesis were generated using the statistical program R.
The analysis framework was completely custom built in Perl using a variety of existing small modules
where applicable. Basic statistical features such as medians, variances, standard deviations were
calculated using the Perl module Statistics::Descriptive and Statistics::Basic.
Standard multiple (matrix based) ordinary least squares regressions were carried out using the Perl
module Statistics::Regression. Simple regressions (e.g. the single-factor model) were carried
out using the faster Perl modules PDL and PDL::Stats. Bartlett testing for equality of variances was
carried out using Statistics::Distributions::Bartlett and Wilcoxon rank-sum testing
using Statistics::Test::WilcoxonRankSum. Database interactions were performed using
DBI and DBD::mysql. Debugging and error reporting are carried out using Data::Dumper and
Carp. Many of the images were generated in R, where distribution were analysed using the tseries
package (calculating skewness and JarqueBera coefficients) and the e1071 package (distributional
calculations).
It is interesting to note that as long as an index and stock ticker is available, together with a date of an
event of interest, the length of the different windows, the model to be used in analyses (factor model or
Fama-French), all the analyses can be carried out in approximately 20 lines of coding. These events can
be any event of interest such as dividend pay days, earnings announcements, news announcements etc
as long as a specific date is available.
All the developed modules, scripts, and analysis pipelines are freely available online at
http://www.joachimdeschrijver.be/thesisEW2013/scripts/.

Appendices|83


Appendices|85
Appendix 7: Distribution of normalized daily NASDAQ and NYSE returns.
Daily stock price returns for all the companies included in the study were calculated for each trading day
between 140 and 90 prior to the FDA or EMEA announcement date. Using these daily returns, an event
specific sample standard deviation was calculated which was used to normalize these 50 daily returns.
This set of 50 daily returns was calculated for each of the stocks associated with the 403 announcement
events under study and then grouped per trading exchange.
The distribution of normalized NASDAQ returns was constructed using 5,500 normalized daily returns,
the distribution of normalized NYSE returns was constructed using 14,650 normalized daily returns (as
shown in the figure below). Both distributions are clearly non-normal as the means are not equal to 0,
they are slightly skewed and heavily leptokurtic (“fat tails”), resulting in significant JarqueBera values for
non-normality (p-values are twice 0). Also note that the black lines indicate a real normal distribution.


Appendices|87
Appendix 8: 16 Members of the NYSE Pharmaceutical (DRG) index
Ticker Company name
ABT Abbott Laboratories AGN Allergan Inc. AZN AstraZeneca PLC BMY Bristol-Myers Squibb Company FRX Forest Laboratories Inc. GSK GlaxoSmithKline plc JNJ Johnson & Johnson LLY Eli Lilly and Company
MRK Merck & Co. Inc. NVO Novo Nordisk A/S NVS Novartis AG PFE Pfizer Inc.
SHPG Shire plc SNY Sanofi
TEVA Teva Pharmaceutical Industries Limited VRX.TO Valeant Pharmaceuticals International,
Inc. [Source: http://finance.yahoo.com/q/cp?s=%5EDRG]


Appendices|89
Appendix 9: Return ranking distributions of the event window split per day
NASDAQ - FDA positive
The distribution of return ranks at day 0 and +1 separately of FDA positive NASDAQ Assets do not
significantly differ from the ^NBI return ranks (day 0: p = 0.416; day +1: p =0.1007). Note that in this
approach the bias disappears. Also note the ‘fat tails’ of the index rankings disappear and the
distribution is almost completely flat.

90|Appendices
NASDAQ - FDA negative
The distribution of return ranks at day 0 and +1 separately of FDA negative NASDAQ Assets do
significantly differ from the ^NBI return ranks (day 0: p = 0.0402; day +1: p =0.0231). An explanation can
be that negative news comes more as a shock as the prices clearly anticipate a positive outcome,
resulting in a faster and severer downward pressure on stock prices.

Appendices|91
NYSE – FDA positive
The distribution of return ranks at day 0 and +1 separately of FDA positive NYSE Assets do not
significantly differ from the ^NBI return ranks (day 0: p = 0.7453; day +1: p = 0.5658).

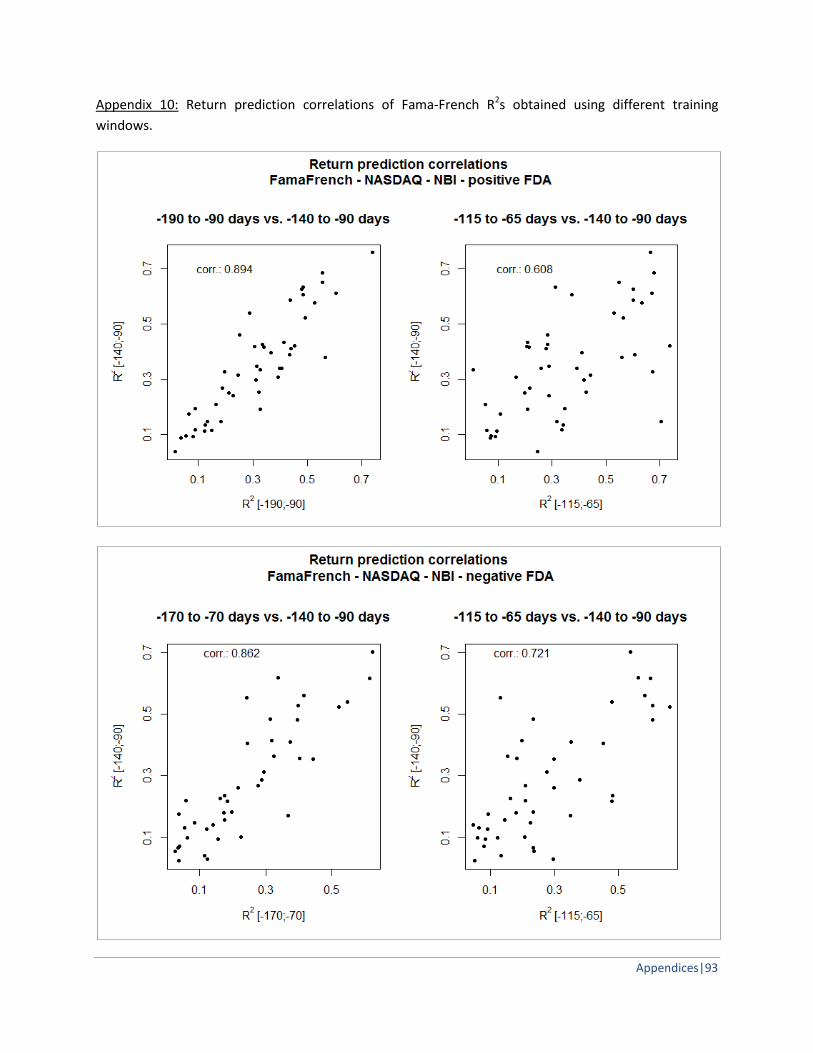
Appendices|93
Appendix 10: Return prediction correlations of Fama-French R2s obtained using different training
windows.

94|Appendices

Appendices|95
Appendix 11: Event study training regression parameters
Fama-French model parameters were estimated in the training window [-140;-90] using the following
equation:
Estimation parameters are available online: http://www.joachimdeschrijver.be/thesisEW/estimations/.


Appendices|97
Appendix 12: Additional CAR calculations in the anticipation window for FDA NASDAQ Assets.
Additional cumulative returns calculated starting at a variable starting point and ending 1 day prior to
the announcement date. Both FDA positive and FDA negative NASDAQ Assets were used in the
calculations.
CAR type CAR t p-value
CAR(-60,-1) 1,6608 0,2641 0,79233928 CAR(-10,-1) -2.4785 -1.6253 0.10756524 CAR(-9,-1) -2.6860 -1.9570 0.05340777 CAR(-8,-1) -2.4295 -1.9914 0.04943864 CAR(-7,-1) -2.4144 -2.2618 0.02609225 CAR(-6,-1) -2.0872 -2.2811 0.02487853 CAR(-5,-1) -2.3277 -3.0528 0.00297245 CAR(-4,-1) -2.0349 -3.3359 0.00123215 CAR(-3,-1) -1.7104 -3.7385 0.00032311 CAR(-2,-1) -2.0978 -6.8782 0.00000000 CAR(-1,-1) -1.1630 -7.6264 0.00000000 P-values are calculated using two-tailed student t-distribution.