analysis of statistics 2018 - echr.coe.int · 1 compared to 753 in 2017). 3,794 applications were...
TRANSCRIPT

Analysis of statistics 2018
January 2019

ECHR – Analysis of Statistics 2018
2/60
Table of Contents Overview of the Court’s statistics in 2018 .............................................................................................. 4
A. New applications ........................................................................................................................ 4 B. Applications disposed of judicially and pending applications .................................................... 4 C. Processing of applications .......................................................................................................... 4
1. Pre-allocation .......................................................................................................................... 4 2. Inadmissibility or strike out decisions .................................................................................... 4 3. Communicated applications ................................................................................................... 4 4. Judgments ............................................................................................................................... 5 5. Requests for interim measures (Rule 39 of the Rules of Court) ............................................. 5
D. Priority policy ............................................................................................................................. 5 E. Conclusion ..................................................................................................................................... 5
General information ............................................................................................................................... 6 Number of applications allocated to a judicial formation ................................................................ 7 Processing of applications ................................................................................................................ 9
Country-specific information ................................................................................................................ 14 Albania ............................................................................................................................................ 14 Andorra ........................................................................................................................................... 15 Armenia .......................................................................................................................................... 16 Austria ............................................................................................................................................. 17 Azerbaijan ....................................................................................................................................... 18 Belgium ........................................................................................................................................... 19 Bosnia and Herzegovina.................................................................................................................. 20 Bulgaria ........................................................................................................................................... 21 Croatia ............................................................................................................................................. 22 Cyprus ............................................................................................................................................. 23 Czech Republic ................................................................................................................................ 24 Denmark ......................................................................................................................................... 25 Estonia ............................................................................................................................................ 26 Finland ............................................................................................................................................ 27 France ............................................................................................................................................. 28 Georgia ............................................................................................................................................ 29 Germany ......................................................................................................................................... 30 Greece ............................................................................................................................................. 31 Hungary ........................................................................................................................................... 32 Iceland ............................................................................................................................................. 33 Ireland ............................................................................................................................................. 34 Italy ................................................................................................................................................. 35 Latvia ............................................................................................................................................... 36 Liechtenstein ................................................................................................................................... 37 Lithuania ......................................................................................................................................... 38 Luxembourg .................................................................................................................................... 39

ECHR – Analysis of Statistics 2018
3/60
Malta ............................................................................................................................................... 40 Republic of Moldova ....................................................................................................................... 41 Monaco ........................................................................................................................................... 42 Montenegro .................................................................................................................................... 43 Netherlands .................................................................................................................................... 44 Norway ............................................................................................................................................ 45 Poland ............................................................................................................................................. 46 Portugal ........................................................................................................................................... 47 Romania .......................................................................................................................................... 48 Russian Federation ......................................................................................................................... 49 San Marino ...................................................................................................................................... 50 Serbia .............................................................................................................................................. 51 Slovakia ........................................................................................................................................... 52 Slovenia ........................................................................................................................................... 53 Spain ............................................................................................................................................... 54 Sweden ........................................................................................................................................... 55 Switzerland ..................................................................................................................................... 56 “The former Yugoslav Republic of Macedonia” .............................................................................. 57 Turkey ............................................................................................................................................. 58 Ukraine ............................................................................................................................................ 59 United Kingdom .............................................................................................................................. 60

ECHR – Analysis of Statistics 2018
4/60
Overview of the Court’s statistics in 2018 Contrary to last two years the Court’s statistics for 2018 disclose a lower number of incoming applications allocated to a judicial formation. This can be explained principally by a decrease in the number of applications allocated coming from Turkey, Romania and Hungary.
In 2017 the productivity had increased spectacularly mainly due to large groups of applications that were adjudicated in particular concerning a few countries. In 2018 the productivity was almost as high as the number of allocated applications. As a result the number of pending applications is stable.
A. New applications In 2018 43,100 applications were allocated to a judicial formation, an overall decrease of 32% compared with 2017 (63,350). 29,300 of these were identified as Single-Judge cases likely to be declared inadmissible (a decrease of 41% in relation to 2017). Single judge applications continue to be processed as soon as they are identified as qualifying for such a procedure. 13,800 applications were identified as probable Chamber or Committee cases (a decrease of 1%).
B. Applications disposed of judicially and pending applications 42,761 applications were disposed of judicially, a decrease of 50% in relation to 2017 (85,951). The number of cases allocated exceeded those disposed of by little more than 300. As a result, the stock of allocated applications pending before the Court was stable over the year, from 56,250 to 56,350.
C. Processing of applications
1. Pre-allocation
As at 31 December 2018 the number of applications pending at the pre-judicial stage stood at 9,750, a decrease of 23% in relation to the same date the previous year (12,600). The number of applications disposed of administratively in 2018 was 19,550, a decrease of 14%. 60% of these files were disposed of for failure to comply with the requirements of Rule 47 of the Rules of Court (contents of an individual application).
2. Inadmissibility or strike out decisions
In 2018 40,023 applications were declared inadmissible or struck out of the list of cases by a Single Judge, a Committee, a Chamber or a Grand Chamber, a 43% decrease compared with 2017 (70,356).
The Single-Judge formation decided 33,181 applications in 2018, a decrease of 50% compared with 2017 (66,156).
In 2018, 3,048 applications were struck out by a Chamber or a Committee, in a decision, following a friendly settlement or a unilateral declaration, an increase of 34% (2,282 in 2017). Friendly settlements (2,184) increased by 43% (1,529 in 2017) and unilateral declarations increased by 15% (8660F
1 compared to 753 in 2017). 3,794 applications were declared inadmissible by a Grand Chamber, Chamber or a Committee or struck out by these formations on other grounds.
3. Communicated applications
In 2018 7,644 applications were communicated (an increase of 6% compared to 2017 when 7,225 applications were communicated).
1 Two applications were struck out after a unilateral declaration in the form of a judgment in 2018.

ECHR – Analysis of Statistics 2018
5/60
4. Judgments
Judgments were delivered in respect of 2,738 applications (compared with 15,595 in 2017 – a decrease of 82%)1F
2. A large proportion of these applications were joined, with the result that the number of judgments actually delivered was 1,014, a decrease of 5%. 537 judgments (in respect of 2,000 applications) were adopted by a three-judge Committee formation (+ 3% compared to 2017). Committee judgments accounted for 73% of the applications decided by a judgment (17% in 2017).
5. Requests for interim measures (Rule 39 of the Rules of Court)
The total number of decisions on interim measures (1,540) decreased by 8% compared with 2017 (1,683). The Court granted requests for interim measures in 143 cases (an increase of 22% compared to 117 in 2017) and dismissed them in 486 cases (9% less than the 533 in 2017). The remainder fell outside the scope of Rule 39 of the Rules of Court. 59% of the requests granted concerned expulsion or immigration cases.
D. Priority policy 2F
3 The essence of this policy is to concentrate more resources on the most important cases, namely the cases falling within the top three categories (“priority applications”). At 31 December 2018 there were 20,613 applications in these categories (an increase of 15% compared to the beginning of the year). This increase can be explained mainly by the higher number of applications allocated concerning conditions of detention in Russia and the lawfulness of detentions in Turkey.
The number of priority applications dealt with at different stages of the procedure in 2018 increased by 45% compared to 2017 (4,594 in 2017 and 6,652 in 2018). This can be explained by an increase in the number of applications processed against Russian, Romania and Hungary concerning conditions of detention and against Turkey concerning unlawful detention and killing by security forces.
12% more priority applications were communicated to the respondent Governments in comparison with 2017 (2,555 in 2017 and 2,871 in 2018). The number of priority applications declared inadmissible or struck out of the list of cases by a Chamber or Committee increased by 160% (905 in 2017 and 2,357 in 2018). The number of priority applications struck out following a friendly settlement or a unilateral declaration increased from 479 in 2017 to 1,051 in 2018. The number of priority applications giving rise to a judgment increased by 26% in 2018 (1,134 in 2017 and 1,424 in 2018).
E. Conclusion If 2017 figures were exceptional due to cases being repatriated to the national system in one form or another (non-exhaustion of a new domestic remedy or strike out in the context of an on-going pilot procedure). 2018 has continued to see an influx of priority applications. The challenge of reducing the backlog of non-repetitive Chamber cases/priority cases remains. In this context the Court and its Registry continue to test and implement new working methods and procedures intended to streamline processing of this part of its case-load. In particular after almost 60 years of Court judgments, there is well-established case-law in many fields and as a consequence more applications can and will be adjudicated by Committees.
2 This difference in percentage is explained by the fact that in 2017 the Grand Chamber struck out 12,148 applications in a single judgment. 3 An explanation of the Court’s priority policy can be found on the Court’s internet site http://www.echr.coe.int/Documents/Priority_policy_ENG.pdf

ECHR – Analysis of Statistics 2018
6/60
General information
Table 1 General statistical information
43100 63350 -32%
2018 2017 +/-
7644 7225 6%
2018 2017 +/-
42761 85951 -50%
2738 15595 -82%
40023 70356 -43%
31/12/2018 1/1/2018 +/-
56350 56250 0%
22250 26250 -15%
29350 25700 14%
4750 4300 10%
31/12/2018 1/1/2018 +/-
9750 12600 -23%
2018 2017 +/-
19550 22650 -14%
Applications at a pre-judicial stage
Applications communicated to respondent Government
1. Applications allocated to a judicial formation
By decision or judgment
Applications pending before a judicial formation
- Chamber and Grand Chamber
- Committee
Applications allocated
2. Interim procedural events
2018 2017 +/-[round figures (50)]
Applications disposed of administratively
3. Applications decided
4. Pending applications [round figures (50)]
5. Pre-judicial applications [round figures (50)]
- by judgment delivered
- by decision (inadmissible or struck out)
- Single-Judge formation

ECHR – Analysis of Statistics 2018
7/60
Number of applications allocated to a judicial formation3F
4
Chart 1 Applications allocated to a judicial formation per year
Chart 2 Applications pending before a judicial formation
4 Figures represent the total number of applications, including joined applications. The document generally gives round figures.
0
10000
20000
30000
40000
50000
60000
70000
2004 2005 2006 2007 2008 2009 2010 2011 2012 2013 2014 2015 2016 2017 2018
3250035300
3920041500
49600
5700061100
6420064900 65800
56200
40500
53400
63400
43100
50000
56800
66500
79400
97300
119300
139650151600
128100
99900
69900
64850
79750
56250
56350
0
20000
40000
60000
80000
100000
120000
140000
160000
2004 2005 2006 2007 2008 2009 2010 2011 2012 2013 2014 2015 2016 2017 2018

ECHR – Analysis of Statistics 2018
8/60
Chart 3 High case-count States
Chart 4 The Court’s total caseload by stage of proceedings and judicial formation4F
5
5 The “Pending Government action” category was created to monitor applications following a judgment applying the pilot procedure.
Russia1175020,9%
Romania850015,1%Ukraine
725012,9%
Turkey710012,6%
Italy40507,2%
Azerbaijan20503,6%
Armenia19003,4%
Georgia18503,3%
Serbia18003,2%
Poland13002,3%
remaining 37 States880015,6%
Total number of pending applications: 56,350
Single Judge or Committee
(cat. VI - VII)47188%
Chamber or Committee -awaiting first examination
(cat. I - V)2948152%
Communicated1560528%
Pending Government action603611%
Admissible5251%
Total applications56,350

ECHR – Analysis of Statistics 2018
9/60
Chart 5 The Court’s total caseload by priority category
Processing of applications
Chart 6 Major procedural steps in processing of applications
Cat. I830
1,5%
Cat. II231
0,4%
Cat. III1962134,8%
Cat. IV1742630,9%
Cat. V1344223,8%
Cat. VI-VII48158,5%
Total applications56,350
0
20000
40000
60000
80000
100000
120000
2004 2005 2006 2007 2008 2009 2010 2011 2012 2013 2014 2015 2016 2017 2018Applications
judgment delivered 816 1208 1719 1734 1880 2393 2607 1511 1678 3661 2388 2441 1927 15595 2738
Applicationscommunicated 2447 2956 3232 3456 4416 6203 6674 5360 5236 7931 7895 15964 9533 7225 7644
Applicationsinadmissibleor struck out
20350 27612 28160 27059 30163 33067 38575 50677 86201 89739 83680 43133 36579 70356 40023

ECHR – Analysis of Statistics 2018
10/60
Chart 7 Number of judgments since 2004
Chart 8 Applications in categories I, II and III processed from 2015 to 2018
0
200
400
600
800
1000
1200
1400
1600
1800
2004 2005 2006 2007 2008 2009 2010 2011 2012 2013 2014 2015 2016 2017 2018
718
1105
15601503 1543
16251499
11571093
916 891 823
9931068
1014
0
500
1000
1500
2000
2500
3000
3500
4000
2015 2016 2017 2018
2392
3972
2555
2871
680
1067 905
2357
691898
1134
1424
communicated decision judgment

ECHR – Analysis of Statistics 2018
11/60
Table 2 Applications allocated per Contracting State and population
The Council of Europe member States had a combined population of about 833 million inhabitants on 1 January 2018. The average number of applications allocated per 10,000 inhabitants was 0.52 in 2018.
State
2015 2016 2017 2018 1.1.2015 1.1.2016 1.1.2017 1.1.2018 2015 2016 2017 2018
Albania 147 146 95 99 2892 2886 2886 2870 0,51 0,51 0,33 0,34Andorra 6 4 2 3 76 72 73 72 0,79 0,56 0,27 0,42Armenia 122 753 356 167 3017 2999 2986 2973 0,40 2,51 1,19 0,56Austria 261 236 228 239 8576 8690 8773 8822 0,30 0,27 0,26 0,27Azerbaijan 268 331 679 313 9593 9706 9810 9898 0,28 0,34 0,69 0,32Belgium 202 184 153 177 11209 11311 11366 11413 0,18 0,16 0,13 0,16Bosnia and Herzegovina
908 1030 866 898 3825 3516 3510 3502 2,37 2,93 2,47 2,56
Bulgaria 1031 882 582 774 7202 7154 7102 7050 1,43 1,23 0,82 1,10Croatia 812 764 723 669 4225 4191 4154 4105 1,92 1,82 1,74 1,63Cyprus 32 33 31 52 847 848 855 864 0,38 0,39 0,36 0,60Czech Republic 340 338 385 349 10538 10554 10579 10610 0,32 0,32 0,36 0,33Denmark 44 47 58 37 5660 5707 5749 5781 0,08 0,08 0,10 0,06Estonia 190 206 156 132 1313 1316 1316 1319 1,45 1,57 1,19 1,00Finland 177 196 181 174 5472 5487 5503 5513 0,32 0,36 0,33 0,32France 1087 916 887 871 66415 66760 67024 67222 0,16 0,14 0,13 0,13Georgia 80 74 89 99 4490 3720 3718 3730 0,18 0,20 0,24 0,27Germany 789 676 586 489 81198 82176 82800 82850 0,10 0,08 0,07 0,06Greece 457 337 422 420 10858 10784 10757 10739 0,42 0,31 0,39 0,39Hungary 4234 5568 1952 902 9856 9830 9798 9778 4,30 5,66 1,99 0,92Iceland 10 24 27 24 329 333 338 348 0,30 0,72 0,80 0,69Ireland 18 26 54 30 4629 4725 4775 4838 0,04 0,06 0,11 0,06Italy 1885 1409 1374 1692 60796 60666 60589 60484 0,31 0,23 0,23 0,28Latvia 244 255 275 259 1986 1969 1950 1934 1,23 1,30 1,41 1,34Liechtenstein 13 10 9 9 37 38 38 38 3,51 2,63 2,37 2,37Lithuania 376 405 401 438 2921 2889 2848 2809 1,29 1,40 1,41 1,56Luxembourg 22 38 38 35 563 576 591 602 0,39 0,66 0,64 0,58Malta 24 25 22 30 429 434 440 476 0,56 0,58 0,50 0,63Republic of Moldova 1011 834 758 814 3555 3553 3553 3547 2,84 2,35 2,13 2,29Monaco 9 6 7 5 38 38 38 38 2,37 1,58 1,84 1,32Montenegro 129 165 138 318 622 622 622 622 2,07 2,65 2,22 5,11Netherlands 495 494 532 429 16901 16979 17082 17181 0,29 0,29 0,31 0,25Norway 73 90 123 84 5166 5214 5258 5296 0,14 0,17 0,23 0,16Poland 2178 2422 2066 1941 38006 37967 37973 37977 0,57 0,64 0,54 0,51Portugal 233 152 197 149 10375 10341 10310 10291 0,22 0,15 0,19 0,14Romania 4604 8192 6509 3369 19871 19760 19638 19524 2,32 4,15 3,31 1,73Russia 6003 5587 7957 12148 143667 143667 143667 143667 0,42 0,39 0,55 0,85San Marino 4 13 11 4 33 33 33 33 1,21 3,94 3,33 1,21Serbia 1235 1330 1431 2128 7114 7076 7040 7001 1,74 1,88 2,03 3,04Slovakia 353 309 425 390 5421 5426 5435 5443 0,65 0,57 0,78 0,72Slovenia 213 239 374 274 2063 2064 2066 2067 1,03 1,16 1,81 1,33Spain 552 627 669 592 46450 46440 46529 46659 0,12 0,14 0,14 0,13Sweden 212 138 150 194 9747 9851 9995 10120 0,22 0,14 0,15 0,19Switzerland 318 258 266 272 8238 8327 8418 8482 0,39 0,31 0,32 0,32"The former Yugoslav Republic of Macedonia"
362 339 345 305 2069 2071 2074 2075 1,75 1,64 1,66 1,47
Turkey 2212 8303 25978 6717 77696 78741 79815 80810 0,28 1,05 3,25 0,83Ukraine 6007 8644 4387 3207 45246 45246 45246 45246 1,33 1,91 0,97 0,71United Kingdom 575 372 415 354 64875 65383 65809 66238 0,09 0,06 0,06 0,05Total 40557 53427 63369 43075 826105 828136 830929 832957 0,49 0,65 0,76 0,52
SOURCES 2014 and 2018: Internet sites of United Nations Statistics Division and Eurostat service (“Population and social conditions” )
Applications allocated to a judicial formation
Population (1000)
Allocated/population(10000)

ECHR – Analysis of Statistics 2018
12/60
Table 3 The Court’s total caseload by stage of proceedings and judicial formation
State
Single Judge or
Committee (cat. VI - VII)
Chamber or Committee - awaiting first examination
(cat. I - V)
CommunicatedPending
Government action
Admissible TOTAL
Albania 12 354 205 0 1 572Andorra 1 0 1 0 0 2Armenia 57 1670 166 0 8 1901Austria 17 21 23 0 1 62Azerbaijan 5 1428 598 0 19 2050Belgium 29 215 60 0 5 309Bosnia and Herzegovina 102 299 387 0 60 848Bulgaria 54 356 98 0 6 514Croatia 85 188 253 0 5 531Cyprus 16 26 11 0 1 54Czech Republic 26 31 43 0 0 100Denmark 0 9 3 0 2 14Estonia 16 20 21 0 11 68Finland 10 2 8 0 0 20France 75 194 142 0 23 434Georgia 4 1738 126 0 5 1873Germany 62 41 42 0 9 154Greece 26 438 237 0 8 709Hungary 76 270 588 0 31 965Iceland 0 35 14 0 2 51Ireland 2 13 6 0 0 21Italy 151 2201 1674 13 12 4051Latvia 52 89 37 0 1 179Liechtenstein 1 0 0 0 0 1Lithuania 43 57 70 0 15 185Luxembourg 1 3 3 0 0 7Malta 1 25 22 0 4 52Republic of Moldova 84 740 270 95 15 1204Monaco 1 1 1 0 0 3Montenegro 73 14 30 0 2 119Netherlands 83 65 31 0 0 179Norway 21 20 7 0 1 49Poland 251 828 236 0 8 1323Portugal 13 94 49 0 2 158Romania 220 650 1708 5917 8 8503Russia 1212 5135 5235 11 152 11745San Marino 1 0 7 0 2 10Serbia 575 844 371 0 3 1793Slovakia 26 85 39 0 6 156Slovenia 36 26 23 0 3 88Spain 155 33 75 0 16 279Sweden 32 9 8 0 1 50Switzerland 41 54 43 0 4 142"The former Yugoslav Republic of Macedonia"
35 195 106 0 3 339
Turkey 658 4797 1597 0 55 7107Ukraine 247 6117 893 0 10 7267United Kingdom 30 51 38 0 5 124
ALL STATES 4718 29481 15605 6036 525 56365

ECHR – Analysis of Statistics 2018
13/60
Table 4 Unilateral declarations and friendly settlements from 2016 to 2018
State
2016 2017 2018 2016 2017 2018Albania 1 2 0 10 2 0Andorra 0 0Armenia 1 0Austria 0 7 2 3Azerbaijan 1 9 4 0Belgium 1 9 2 2Bosnia and Herzegovina 3 0 4 5 6Bulgaria 4 1 2 11 5 4Croatia 2 2 0 11 5 6Cyprus 1 1 0Czech Republic 0 2 1Denmark 0 0Estonia 0 2 1 0Finland 0 0France 2 2 2 6 2Georgia 1 7 5 4 1 1Germany 2 1 4 4 1 0Greece 15 20 26 146 115 27Hungary 2 10 98 83 456Iceland 0 0 0 0Ireland 1 0 0Italy 811 17 273 279 36 243Latvia 4 0 1 2 0Liechtenstein 1 0 0Lithuania 4 4 2 4 21Luxembourg 0 0Malta 1 1 1 1 0Republic of Moldova 3 4 5 1 11Monaco 1 0 0Montenegro 8 2 2 23 7 1Netherlands 1 2 8 2 2Norway 0 0Poland 12 170 124 27 347 278Portugal 5 0 36 6 13Romania 110 46 141 353 221 691Russia 215 202 98 354 305 151San Marino 0 0Serbia 3 1 2 5 32 33Slovakia 5 4 3 18 18 15Slovenia 1 1 1 0Spain 0 1 0Sweden 0 0Switzerland 0 0"The former Yugoslav Republic of Macedonia" 10 2 2 26 5 10Turkey 65 52 146 103 65 205Ukraine 482 210 1 456 237 0United Kingdom 2 1 6 2Grand Total 1766 753 866 2006 1529 2184
Unilateral declaration Friendly settlement

ECHR – Analysis of Statistics 2018
14/60
Country-specific information
Albania
Chart 9 The Court’s caseload by stage of proceedings and decision body
Graph 10 Major procedural steps in processing applications
Single Judge or Committee
(cat. VI - VII)12
2,1%
Chamber or Committee -awaiting first examination
(cat. I - V)354
61,9%
Communicated205
35,8%
Admissible1
0,2%
Total applications572
0
20
40
60
80
100
120
140
160
2016 2017 2018
146
95 99
44
56
45
25
11
1822
09
Applications allocated to a judicialformation
Applications declared inadmissible orstruck out
Applications communicated to theGovernment
Applications in which judgments delivered

ECHR – Analysis of Statistics 2018
15/60
Andorra
Chart 11 The Court’s caseload by stage of proceedings and decision body
Graph 12 Major procedural steps in processing applications
Single Judge or Committee
(cat. VI - VII)1
50%Communicated
150%
Total applications2
0
0,5
1
1,5
2
2,5
3
3,5
4
2016 2017 2018
4
2
3
4
3
2
1
0 0
2
0 0
Applications allocated to a judicialformation
Applications declared inadmissible orstruck out
Applications communicated to theGovernment
Applications in which judgments delivered

ECHR – Analysis of Statistics 2018
16/60
Armenia
Chart 13 The Court’s caseload by stage of proceedings and decision body
Graph 14 Major procedural steps in processing applications
Single Judge or Committee
(cat. VI - VII)57
3,0%
Chamber or Committee -awaiting first examination
(cat. I - V)167087,8%
Communicated166
8,7%
Admissible8
0,5%
Total applications1,901
0
100
200
300
400
500
600
700
800
2016 2017 2018
753
356
167133 109
7241 44 4916 12 16
Applications allocated to a judicialformation
Applications declared inadmissible orstruck out
Applications communicated to theGovernment
Applications in which judgments delivered

ECHR – Analysis of Statistics 2018
17/60
Austria
Chart 15 The Court’s caseload by stage of proceedings and decision body
Graph 16 Major procedural steps in processing applications
Single Judge or Committee
(cat. VI - VII)17
27%
Chamber or Committee -awaiting first examination
(cat. I - V)21
34%
Communicated23
37%
Admissible1
2%
Total applications62
0
50
100
150
200
250
300
2016 2017 2018
236 228 239239
260
232
1625
71127
8
Applications allocated to a judicialformation
Applications declared inadmissible orstruck out
Applications communicated to theGovernment
Applications in which judgments delivered

ECHR – Analysis of Statistics 2018
18/60
Azerbaijan
Chart 17 The Court’s caseload by stage of proceedings and decision body
Graph 18 Major procedural steps in processing applications
Single Judge or Committee
(cat. VI - VII)5
0,2% Chamber or Committee -awaiting first examination
(cat. I - V)142869,7%
Communicated598
29,2%
Admissible19
0,9%
Total applications2,050
0
100
200
300
400
500
600
700
2016 2017 2018
331
679
313
136
210261
164 168
238
5097
43
Applications allocated to a judicialformation
Applications declared inadmissible orstruck out
Applications communicated to theGovernment
Applications in which judgments delivered

ECHR – Analysis of Statistics 2018
19/60
Belgium
Chart 19 The Court’s caseload by stage of proceedings and decision body
Graph 20 Major procedural steps in processing applications
Single Judge or Committee
(cat. VI - VII)299%
Chamber or Committee -awaiting first examination
(cat. I - V)21570%
Communicated60
19%
Admissible5
2%
Total applications309
0
20
40
60
80
100
120
140
160
180
200
2016 2017 2018
184
153
177
158
177 182
8
35 43
1116
10
Applications allocated to a judicialformation
Applications declared inadmissible orstruck out
Applications communicated to theGovernment
Applications in which judgments delivered

ECHR – Analysis of Statistics 2018
20/60
Bosnia and Herzegovina
Chart 21 The Court’s caseload by stage of proceedings and decision body
Graph 22 Major procedural steps in processing applications
Single Judge or Committee
(cat. VI - VII)10212%
Chamber or Committee -awaiting first examination
(cat. I - V)29935%
Communicated38746%
Admissible607%
Total applications848
0
200
400
600
800
1000
1200
1400
1600
2016 2017 2018
1030
866 898
596
1449
683
8818
442
2 43 12
Applications allocated to a judicialformation
Applications declared inadmissible orstruck out
Applications communicated to theGovernment
Applications in which judgments delivered

ECHR – Analysis of Statistics 2018
21/60
Bulgaria
Chart 23 The Court’s caseload by stage of proceedings and decision body
Graph 24 Major procedural steps in processing applications
Single Judge or Committee
(cat. VI - VII)54
11%
Chamber or Committee -awaiting first examination
(cat. I - V)35669%
Communicated98
19%
Admissible6
1%
Total applications514
0
100
200
300
400
500
600
700
800
900
1000
2016 2017 2018
882
582
774
907
622
841
47
735342 62 38
Applications allocated to a judicialformation
Applications declared inadmissible orstruck out
Applications communicated to theGovernment
Applications in which judgments delivered

ECHR – Analysis of Statistics 2018
22/60
Croatia
Chart 25 The Court’s caseload by stage of proceedings and decision body
Graph 26 Major procedural steps in processing applications
Single Judge or Committee
(cat. VI - VII)85
16%
Chamber or Committee -awaiting first examination
(cat. I - V)18835%
Communicated25348%
Admissible5
1%
Total applications531
0
100
200
300
400
500
600
700
800
2016 2017 2018
764723
669639
786
618
83 9357
39 28 25
Applications allocated to a judicialformation
Applications declared inadmissible orstruck out
Applications communicated to theGovernment
Applications in which judgments delivered

ECHR – Analysis of Statistics 2018
23/60
Cyprus
Chart 27 The Court’s caseload by stage of proceedings and decision body
Graph 28 Major procedural steps in processing applications
Single Judge or Committee
(cat. VI - VII)16
30%
Chamber or Committee -awaiting first examination
(cat. I - V)26
48%
Communicated11
20%
Admissible1
2%
Total applications54
0
10
20
30
40
50
60
2016 2017 2018
3331
52
3430
42
63 44
3
7
Applications allocated to a judicialformation
Applications declared inadmissible orstruck out
Applications communicated to theGovernment
Applications in which judgments delivered

ECHR – Analysis of Statistics 2018
24/60
Czech Republic
Chart 29 The Court’s caseload by stage of proceedings and decision body
Graph 30 Major procedural steps in processing applications
Single Judge or Committee
(cat. VI - VII)26
26%
Chamber or Committee -awaiting first examination
(cat. I - V)31
31%
Communicated43
43%
Total applications100
0
50
100
150
200
250
300
350
400
450
2016 2017 2018
338
385
349339
423
333
8 14 77 8 14
Applications allocated to a judicialformation
Applications declared inadmissible orstruck out
Applications communicated to theGovernment
Applications in which judgments delivered

ECHR – Analysis of Statistics 2018
25/60
Denmark
Chart 31 The Court’s caseload by stage of proceedings and decision body
Graph 32 Major procedural steps in processing applications
Chamber or Committee -awaiting first examination
(cat. I - V)9
64%
Communicated3
22%
Admissible2
14%
Total applications14
0
10
20
30
40
50
60
2016 2017 2018
47
58
37
51
60
38
24 23 2
5
Applications allocated to a judicialformation
Applications declared inadmissible orstruck out
Applications communicated to theGovernment
Applications in which judgments delivered

ECHR – Analysis of Statistics 2018
26/60
Estonia
Chart 33 The Court’s caseload by stage of proceedings and decision body
Graph 34 Major procedural steps in processing applications
Single Judge or Committee
(cat. VI - VII)16
23,5%
Chamber or Committee -awaiting first examination
(cat. I - V)20
29,4%
Communicated21
30,9%
Admissible11
16,2%
Total applications68
0
50
100
150
200
250
2016 2017 2018
206
156
132
210
150
129
815 145 2 4
Applications allocated to a judicialformation
Applications declared inadmissible orstruck out
Applications communicated to theGovernment
Applications in which judgments delivered

ECHR – Analysis of Statistics 2018
27/60
Finland
Chart 35 The Court’s caseload by stage of proceedings and decision body
Graph 36 Major procedural steps in processing applications
Single Judge or Committee
(cat. VI - VII)10
50%
Chamber or Committee -awaiting first examination
(cat. I - V)2
10%
Communicated8
40%
Total applications20
0
50
100
150
200
250
2016 2017 2018
196
181174
157
217
170
2 0 51 2 0
Applications allocated to a judicialformation
Applications declared inadmissible orstruck out
Applications communicated to theGovernment
Applications in which judgments delivered

ECHR – Analysis of Statistics 2018
28/60
France
Chart 37 The Court’s caseload by stage of proceedings and decision body
Graph 38 Major procedural steps in processing applications
Single Judge or Committee
(cat. VI - VII)75
17%
Chamber or Committee -awaiting first examination
(cat. I - V)19445%
Communicated14233%
Admissible235%
Total applications434
0
100
200
300
400
500
600
700
800
900
1000
2016 2017 2018
916 887 871874 909
776
58 63 5827 17 37
Applications allocated to a judicialformation
Applications declared inadmissible orstruck out
Applications communicated to theGovernment
Applications in which judgments delivered

ECHR – Analysis of Statistics 2018
29/60
Georgia
Chart 39 The Court’s caseload by stage of proceedings and decision body
Graph 40 Major procedural steps in processing applications
Single Judge or Committee
(cat. VI - VII)4
0,2%
Chamber or Committee -awaiting first examination
(cat. I - V)173892,8%
Communicated126
6,7%
Admissible5
0,3%
Total applications1,873
0
50
100
150
200
250
2016 2017 2018
7489
99
148
232
141
76
2515
4 12 10
Applications allocated to a judicialformation
Applications declared inadmissible orstruck out
Applications communicated to theGovernment
Applications in which judgments delivered

ECHR – Analysis of Statistics 2018
30/60
Germany
Chart 41 The Court’s caseload by stage of proceedings and decision body
Graph 42 Major procedural steps in processing applications
Single Judge or Committee
(cat. VI - VII)62
40%
Chamber or Committee -awaiting first examination
(cat. I - V)41
27%
Communicated42
27%
Admissible9
6%
Total applications154
0
100
200
300
400
500
600
700
2016 2017 2018
676
586
489
658621
478
4819 1419 19 23
Applications allocated to a judicialformation
Applications declared inadmissible orstruck out
Applications communicated to theGovernment
Applications in which judgments delivered

ECHR – Analysis of Statistics 2018
31/60
Greece
Chart 43 The Court’s caseload by stage of proceedings and decision body
Graph 44 Major procedural steps in processing applications
Single Judge or Committee
(cat. VI - VII)264%
Chamber or Committee -awaiting first examination
(cat. I - V)43862%
Communicated23733%
Admissible8
1%
Total applications709
0
50
100
150
200
250
300
350
400
450
500
2016 2017 2018
337
422 420455
388
370
275
186
137
65 43 38
Applications allocated to a judicialformation
Applications declared inadmissible orstruck out
Applications communicated to theGovernment
Applications in which judgments delivered

ECHR – Analysis of Statistics 2018
32/60
Hungary
Chart 45 The Court’s caseload by stage of proceedings and decision body
Graph 46 Major procedural steps in processing applications
Single Judge or Committee
(cat. VI - VII)76
7,9%Chamber or Committee -awaiting first examination
(cat. I - V)270
28,0%
Communicated58861%
Admissible31
3,2%
Total applications965
0
1000
2000
3000
4000
5000
6000
7000
8000
2016 2017 2018
5568
1952
9021125
7353
3318
498 330
836
100 26 91
Applications allocated to a judicialformation
Applications declared inadmissible orstruck out
Applications communicated to theGovernment
Applications in which judgments delivered

ECHR – Analysis of Statistics 2018
33/60
Iceland
Chart 47 The Court’s caseload by stage of proceedings and decision body
Graph 48 Major procedural steps in processing applications
Chamber or Committee -awaiting first examination
(cat. I - V)35
69%
Communicated14
27%
Admissible2
4%
Total applications51
0
5
10
15
20
25
30
2016 2017 2018
2427
24
15
6
15
7
3
9
0
7
3
Applications allocated to a judicialformation
Applications declared inadmissible orstruck out
Applications communicated to theGovernment
Applications in which judgments delivered

ECHR – Analysis of Statistics 2018
34/60
Ireland
Chart 49 The Court’s caseload by stage of proceedings and decision body
Graph 50 Major procedural steps in processing applications
Single Judge or Committee
(cat. VI - VII)2
9%Chamber or Committee -awaiting first examination
(cat. I - V)13
62%
Communicated6
29%
Total applications21
0
10
20
30
40
50
60
2016 2017 2018
26
54
30
19
45
26
51
5
0 2 2
Applications allocated to a judicialformation
Applications declared inadmissible orstruck out
Applications communicated to theGovernment
Applications in which judgments delivered

ECHR – Analysis of Statistics 2018
35/60
Italy
Chart 51 The Court’s caseload by stage of proceedings and decision body
Graph 52 Major procedural steps in processing applications
Single Judge or Committee
(cat. VI - VII)151
3,7%
Chamber or Committee -awaiting first examination
(cat. I - V)220154,3%
Communicated167441,3%
Pending Government action
130,3%
Admissible12
0,3%
Total applications4,051
0
500
1000
1500
2000
2500
3000
2016 2017 2018
1409 1374
1692
2695
1973
2256
763
1441
499
35133
27
Applications allocated to a judicialformation
Applications declared inadmissible orstruck out
Applications communicated to theGovernment
Applications in which judgments delivered

ECHR – Analysis of Statistics 2018
36/60
Latvia
Chart 53 The Court’s caseload by stage of proceedings and decision body
Graph 54 Major procedural steps in processing applications
Single Judge or Committee
(cat. VI - VII)52
29%
Chamber or Committee -awaiting first examination
(cat. I - V)89
49,7%
Communicated37
20,7%
Admissible1
0,6%
Total applications179
0
50
100
150
200
250
300
2016 2017 2018
255
275259
228
261
234
206 1017 20
3
Applications allocated to a judicialformation
Applications declared inadmissible orstruck out
Applications communicated to theGovernment
Applications in which judgments delivered

ECHR – Analysis of Statistics 2018
37/60
Liechtenstein
Chart 55 The Court’s caseload by stage of proceedings and decision body
Graph 56 Major procedural steps in processing applications
Single Judge or Committee
(cat. VI - VII)1
100%Total applications
1
0
2
4
6
8
10
12
14
2016 2017 2018
10
9 9
14
8
9
0 0 0
1
0 0
Applications allocated to a judicialformation
Applications declared inadmissible orstruck out
Applications communicated to theGovernment
Applications in which judgments delivered

ECHR – Analysis of Statistics 2018
38/60
Lithuania
Chart 57 The Court’s caseload by stage of proceedings and decision body
Graph 58 Major procedural steps in processing applications
Single Judge or Committee
(cat. VI - VII)43
23%
Chamber or Committee -awaiting first examination
(cat. I - V)57
31%
Communicated70
38%
Admissible158%
Total applications185
0
50
100
150
200
250
300
350
400
450
500
2016 2017 2018
405 401
438453 451429
5576
43
22 3341
Applications allocated to a judicialformation
Applications declared inadmissible orstruck out
Applications communicated to theGovernment
Applications in which judgments delivered

ECHR – Analysis of Statistics 2018
39/60
Luxembourg
Chart 59 The Court’s caseload by stage of proceedings and decision body
Graph 60 Major procedural steps in processing applications
Single Judge or Committee
(cat. VI - VII)1
14%
Chamber or Committee -awaiting first examination
(cat. I - V)3
43%
Communicated3
43%
Total applications7
0
10
20
30
40
50
60
2016 2017 2018
38 38
35
22
52
35
6
1 20 1 1
Applications allocated to a judicialformation
Applications declared inadmissible orstruck out
Applications communicated to theGovernment
Applications in which judgments delivered

ECHR – Analysis of Statistics 2018
40/60
Malta
Chart 61 The Court’s caseload by stage of proceedings and decision body
Graph 62 Major procedural steps in processing applications
Single Judge or Committee
(cat. VI - VII)1
2%
Chamber or Committee -awaiting first examination
(cat. I - V)25
48%
Communicated22
42%
Admissible4
8%
Total applications52
0
5
10
15
20
25
30
2016 2017 2018
25
22
30
14 15
1919
9
14
10
5
14
Applications allocated to a judicialformation
Applications declared inadmissible orstruck out
Applications communicated to theGovernment
Applications in which judgments delivered

ECHR – Analysis of Statistics 2018
41/60
Republic of Moldova
Chart 63 The Court’s caseload by stage of proceedings and decision body
Graph 64 Major procedural steps in processing applications
Single Judge or Committee
(cat. VI - VII)847%
Chamber or Committee -awaiting first examination
(cat. I - V)740
61,5%
Communicated270
22,4%
Pending Government action
957,9%
Admissible15
1,2%
Total applications1,204
0
100
200
300
400
500
600
700
800
900
2016 2017 2018
834
758814
750
633
858
4167
5427 17 44
Applications allocated to a judicialformation
Applications declared inadmissible orstruck out
Applications communicated to theGovernment
Applications in which judgments delivered

ECHR – Analysis of Statistics 2018
42/60
Monaco
Chart 65 The Court’s caseload by stage of proceedings and decision body
Graph 66 Major procedural steps in processing applications
Single Judge or Committee
(cat. VI - VII)1
34%
Chamber or Committee -awaiting first examination
(cat. I - V)1
33%
Communicated1
33%
Total applications3
0
1
2
3
4
5
6
7
8
2016 2017 2018
6
7
55
8
4
0 0
1
0
1
0
Applications allocated to a judicialformation
Applications declared inadmissible orstruck out
Applications communicated to theGovernment
Applications in which judgments delivered

ECHR – Analysis of Statistics 2018
43/60
Montenegro
Chart 67 The Court’s caseload by stage of proceedings and decision body
Graph 68 Major procedural steps in processing applications
Single Judge or Committee
(cat. VI - VII)73
61%
Chamber or Committee -awaiting first examination
(cat. I - V)14
12%
Communicated30
25%
Admissible2
2%
Total applications119
0
50
100
150
200
250
300
350
2016 2017 2018
165
138
318
220
154
264
23 13 104 16 13
Applications allocated to a judicialformation
Applications declared inadmissible orstruck out
Applications communicated to theGovernment
Applications in which judgments delivered

ECHR – Analysis of Statistics 2018
44/60
Netherlands
Chart 69 The Court’s caseload by stage of proceedings and decision body
Graph 70 Major procedural steps in processing applications
Single Judge or Committee
(cat. VI - VII)83
47%
Chamber or Committee -awaiting first examination
(cat. I - V)65
36%
Communicated31
17%
Total applications179
0
100
200
300
400
500
600
2016 2017 2018
494532
429
500
573
459
12 24 1711 3 4
Applications allocated to a judicialformation
Applications declared inadmissible orstruck out
Applications communicated to theGovernment
Applications in which judgments delivered
ECHR – Analysis of Statistics 2018
45/60
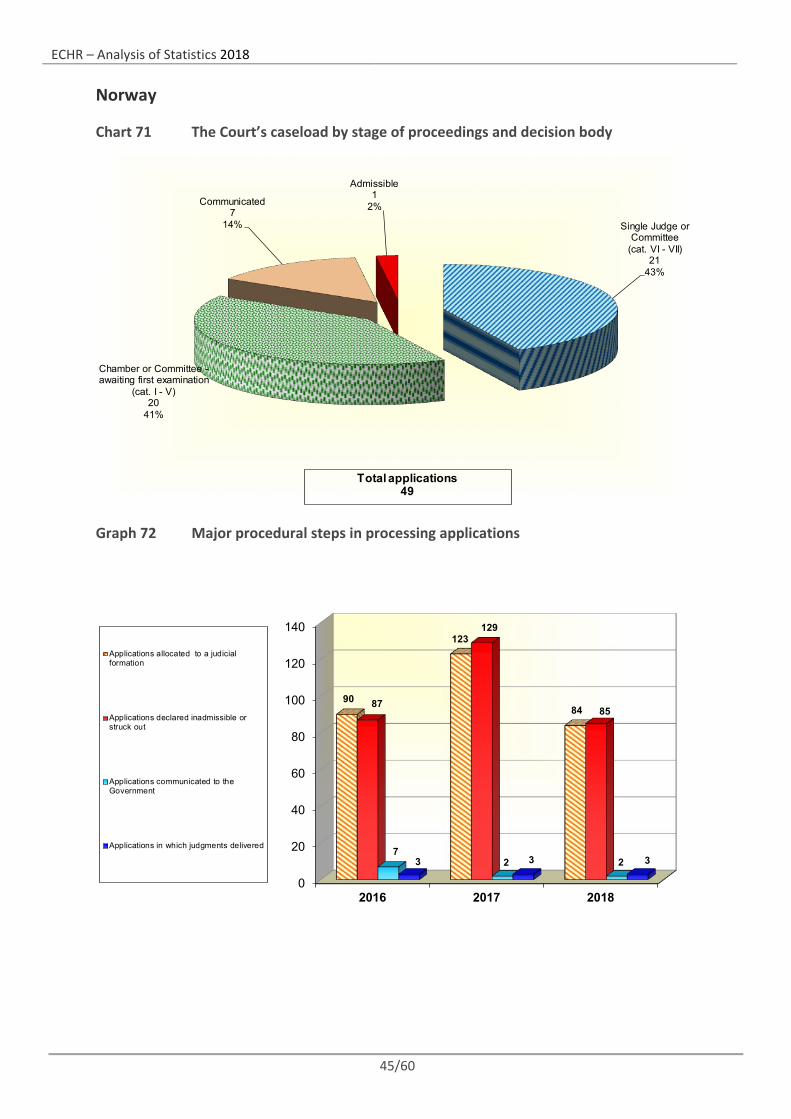
Norway
Chart 71 The Court’s caseload by stage of proceedings and decision body
Graph 72 Major procedural steps in processing applications
Single Judge or Committee
(cat. VI - VII)21
43%
Chamber or Committee -awaiting first examination
(cat. I - V)20
41%
Communicated7
14%
Admissible1
2%
Total applications49
0
20
40
60
80
100
120
140
2016 2017 2018
90
123
8487
129
85
72 23 3 3
Applications allocated to a judicialformation
Applications declared inadmissible orstruck out
Applications communicated to theGovernment
Applications in which judgments delivered

ECHR – Analysis of Statistics 2018
46/60
Poland
Chart 73 The Court’s caseload by stage of proceedings and decision body
Graph 74 Major procedural steps in processing applications
Single Judge or Committee
(cat. VI - VII)25119%
Chamber or Committee -awaiting first examination
(cat. I - V)82862%
Communicated23618%
Admissible8
1%
Total applications1,323
0
500
1000
1500
2000
2500
2016 2017 2018
2422
2066 1941
2246
2446
2000
68
404
11529 20 24
Applications allocated to a judicialformation
Applications declared inadmissible orstruck out
Applications communicated to theGovernment
Applications in which judgments delivered

ECHR – Analysis of Statistics 2018
47/60
Portugal
Chart 75 The Court’s caseload by stage of proceedings and decision body
Graph 76 Major procedural steps in processing applications
Single Judge or Committee
(cat. VI - VII)138%
Chamber or Committee -awaiting first examination
(cat. I - V)94
60%
Communicated49
31%
Admissible2
1%
Total applications158
0
50
100
150
200
250
300
2016 2017 2018
152
197
149
269
209
131
14 25 2233
14 9
Applications allocated to a judicialformation
Applications declared inadmissible orstruck out
Applications communicated to theGovernment
Applications in which judgments delivered

ECHR – Analysis of Statistics 2018
48/60
Romania
Chart 77 The Court’s caseload by stage of proceedings and decision body
Graph 78 Major procedural steps in processing applications
Single Judge or Committee
(cat. VI - VII)220
2,6%
Chamber or Committee -awaiting first examination
(cat. I - V)650
7,6%
Communicated170820,1%
Pending Government action591769,6%
Admissible8
0,1%
Total applications8,503
0
1000
2000
3000
4000
5000
6000
7000
8000
9000
2016 2017 2018
8192
6509
3369
4089 3767 4182
2195
495 250259 214519
Applications allocated to a judicialformation
Applications declared inadmissible orstruck out
Applications communicated to theGovernment
Applications in which judgments delivered

ECHR – Analysis of Statistics 2018
49/60
Russian Federation
Chart 79 The Court’s caseload by stage of proceedings and decision body
Graph 80 Major procedural steps in processing applications
Single Judge or Committee
(cat. VI - VII)121210,3%
Chamber or Committee -awaiting first examination
(cat. I - V)513543,7%
Communicated523544,6%
Pending Government action
110,1%
Admissible152
1,3%
Total applications11,745
0
2000
4000
6000
8000
10000
12000
14000
2016 2017 2018
5587
7957
12148
63656889 7258
1765 19532926
6451156 908
Applications allocated to a judicialformation
Applications declared inadmissible orstruck out
Applications communicated to theGovernment
Applications in which judgments delivered

ECHR – Analysis of Statistics 2018
50/60
San Marino
Chart 81 The Court’s caseload by stage of proceedings and decision body
Graph 82 Major procedural steps in processing applications
Single Judge or Committee
(cat. VI - VII)1
10%
Communicated7
70%
Admissible2
20%
Total applications10
0
2
4
6
8
10
12
14
2016 2017 2018
13
11
45
10
8
0
6
4
0
1
0
Applications allocated to a judicialformation
Applications declared inadmissible orstruck out
Applications communicated to theGovernment
Applications in which judgments delivered

ECHR – Analysis of Statistics 2018
51/60
Serbia
Chart 83 The Court’s caseload by stage of proceedings and decision body
Graph 84 Major procedural steps in processing applications
Single Judge or Committee
(cat. VI - VII)57532%
Chamber or Committee -awaiting first examination
(cat. I - V)844
47,1%
Communicated371
20,7%
Admissible3
0,2%
Total applications1,793
0
500
1000
1500
2000
2500
2016 2017 2018
13301431
2128
1220
1594
1224
76 92
282
66 37 45
Applications allocated to a judicialformation
Applications declared inadmissible orstruck out
Applications communicated to theGovernment
Applications in which judgments delivered

ECHR – Analysis of Statistics 2018
52/60
Slovakia
Chart 85 The Court’s caseload by stage of proceedings and decision body
Graph 86 Major procedural steps in processing applications
Single Judge or Committee
(cat. VI - VII)26
17%
Chamber or Committee -awaiting first examination
(cat. I - V)85
54%
Communicated39
25%
Admissible6
4%
Total applications156
0
50
100
150
200
250
300
350
400
450
2016 2017 2018
309
425390
318
377
420
42 4732
10 18 19
Applications allocated to a judicialformation
Applications declared inadmissible orstruck out
Applications communicated to theGovernment
Applications in which judgments delivered

ECHR – Analysis of Statistics 2018
53/60
Slovenia
Chart 87 The Court’s caseload by stage of proceedings and decision body
Graph 88 Major procedural steps in processing applications
Single Judge or Committee
(cat. VI - VII)36
41%
Chamber or Committee -awaiting first examination
(cat. I - V)26
30%
Communicated23
26%
Admissible3
3%
Total applications88
0
200
400
600
800
1000
1200
1400
1600
1800
2000
2016 2017 2018
239
374274299
1818
303
18 7 154 13 10
Applications allocated to a judicialformation
Applications declared inadmissible orstruck out
Applications communicated to theGovernment
Applications in which judgments delivered

ECHR – Analysis of Statistics 2018
54/60
Spain
Chart 89 The Court’s caseload by stage of proceedings and decision body
Graph 90 Major procedural steps in processing applications
Single Judge or Committee
(cat. VI - VII)15555%
Chamber or Committee -awaiting first examination
(cat. I - V)33
12%
Communicated75
27%
Admissible166%
Total applications279
0
100
200
300
400
500
600
700
2016 2017 2018
627669
592
557
635
476
1652
1818 7 19
Applications allocated to a judicialformation
Applications declared inadmissible orstruck out
Applications communicated to theGovernment
Applications in which judgments delivered

ECHR – Analysis of Statistics 2018
55/60
Sweden
Chart 91 The Court’s caseload by stage of proceedings and decision body
Graph 92 Major procedural steps in processing applications
Single Judge or Committee
(cat. VI - VII)32
64%
Chamber or Committee -awaiting first examination
(cat. I - V)9
18%
Communicated8
16%
Admissible1
2%
Total applications50
0
20
40
60
80
100
120
140
160
180
200
2016 2017 2018
138150
194
141154
169
81 84 1 3
Applications allocated to a judicialformation
Applications declared inadmissible orstruck out
Applications communicated to theGovernment
Applications in which judgments delivered

ECHR – Analysis of Statistics 2018
56/60
Switzerland
Chart 93 The Court’s caseload by stage of proceedings and decision body
Graph 94 Major procedural steps in processing applications
Single Judge or Committee
(cat. VI - VII)41
29%
Chamber or Committee -awaiting first examination
(cat. I - V)54
38%
Communicated43
30%
Admissible4
2,8%
Total applications142
0
50
100
150
200
250
300
2016 2017 2018
258 266272
230
263 265
15 18 1110 10 8
Applications allocated to a judicialformation
Applications declared inadmissible orstruck out
Applications communicated to theGovernment
Applications in which judgments delivered

ECHR – Analysis of Statistics 2018
57/60
“The former Yugoslav Republic of Macedonia”
Chart 95 The Court’s caseload by stage of proceedings and decision body
Graph 96 Major procedural steps in processing applications
Single Judge or Committee
(cat. VI - VII)35
10,3%
Chamber or Committee -awaiting first examination
(cat. I - V)195
57,5%
Communicated106
31,3%
Admissible3
0,9%
Total applications339
0
50
100
150
200
250
300
350
2016 2017 2018
339 345
305321
286263
65 59 36
16 10 15
Applications allocated to a judicialformation
Applications declared inadmissible orstruck out
Applications communicated to theGovernment
Applications in which judgments delivered

ECHR – Analysis of Statistics 2018
58/60
Turkey
Chart 97 The Court’s caseload by stage of proceedings and decision body
Graph 98 Major procedural steps in processing applications
Single Judge or Committee
(cat. VI - VII)6589%
Chamber or Committee -awaiting first examination
(cat. I - V)479768%
Communicated159722%
Admissible551%
Total applications7,107
0
5000
10000
15000
20000
25000
30000
35000
2016 2017 2018
8303
25978
67174042
30063
6789
14991005 804
118 991 320
Applications allocated to a judicialformation
Applications declared inadmissible orstruck out
Applications communicated to theGovernment
Applications in which judgments delivered

ECHR – Analysis of Statistics 2018
59/60
Ukraine
Chart 99 The Court’s caseload by stage of proceedings and decision body
Graph 100 Major procedural steps in processing applications
Single Judge or Committee
(cat. VI - VII)247
3,4%
Chamber or Committee -awaiting first examination
(cat. I - V)6117
84,2%
Communicated893
12,3%
Admissible10
0,1%
Total applications7,267
0
2000
4000
6000
8000
10000
12000
14000
2016 2017 2018
8644
4387
3207
4188
29752753
1326
288 435116
12438
290
Applications allocated to a judicialformation
Applications declared inadmissible orstruck out
Applications communicated to theGovernment
Applications in which judgments delivered

ECHR – Analysis of Statistics 2018
60/60
United Kingdom
Chart 101 The Court’s caseload by stage of proceedings and decision body
Graph 102 Major procedural steps in processing applications
Single Judge or Committee
(cat. VI - VII)30
24%
Chamber or Committee -awaiting first examination
(cat. I - V)51
41%
Communicated38
31%
Admissible5
4%
Total applications124
0
100
200
300
400
500
600
2016 2017 2018
372
415
354360
507
358
144
2139
5 4
Applications allocated to a judicialformation
Applications declared inadmissible orstruck out
Applications communicated to theGovernment
Applications in which judgments delivered