analysis of socioeconomic vulnerability of street …um.ase.ro/no152/4.pdf · 2020-04-30 · sector...
TRANSCRIPT

Esayas E. & Mulugeta S.
ANALYSIS OF SOCIOECONOMIC VULNERABILITY OF STREET VENDORS: CASE STUDY FOR DIRE DAWA CITY, EASTERN ETHIOPIA
49
Theor
etica
l and
Empirical Rese
arc
hes
in U
rban
Mana
gement
Volum
e 1
5
Iss
ue 2
/ M
ay 2
020
Theor
etica
l and
Empirica
l Rese
arc
hes
in U
rban
Mana
gement
ANALYSIS OF SOCIOECONOMIC VULNERABILITY OF STREET VENDORS: CASE
STUDY FOR DIRE DAWA CITY, EASTERN ETHIOPIA
Engida ESAYAS Geography & Environmental Studies, Dilla University, Ethiopia
Solomon MULUGETA
Geography and Environmental Studies, Addis Ababa University, Ethiopia
Abstract The study sought to empirically analyse the socioeconomic vulnerability of street vendors in Dire Dawa city, Eastern Ethiopia. A cross-sectional survey was conducted with 198 vendors who were selected using multi-stage Time-Location Sampling procedures from six street vending cluster sites and included the itinerant vendors in the city. Data were analysed using Dabir-Alai’s (Dabir-Alai, 2004) and Brata’s (Brata, 2010) vulnerability analysis frameworks; but with little modification. This study; however, departs from the above two as it included more elements of vulnerability, has used descriptive statistics such as mean and standard deviation to determine the level of vulnerability and inferential statistics i.e. Chi-Squares to test whether vulnerability is associated with some physical, demographic, and socioeconomic characteristics of vendors. The results showed that vulnerability was higher for street vendors as higher proportion of vendors lay on the high end of the spectrum of vulnerability. However, it was varied with sex, type of goods vended, frequency of attendance of vending cluster sites and type of goods; but, not with the location of vending. At the end, the article discusses the need for proper understanding of vulnerability of vendors and implementation of inclusive and participatory approaches in management and governance of urban public spaces upon which the livelihoods of vendors largely depend in the city. Keywords: street vending, livelihoods, vulnerability, time-location sampling, Dire Dawa
1. INTRODUCTION
Research on the urban informal economy has relatively long tradition in cities of the global south. Since
its discovery by Keith Hart in a study conducted in urban Ghana (Hart, 1973); and the International Labour
Office (ILO) study of the sector in Kenya (ILO, 1972), it has received a considerable attention and hence
extensive studies have been published since then (For Example, Portes, 1985; De Soto, 1989; Brown,
2006; Bhowmik, 2010; Chen, 2012; Neuwirth, 2012; William & Youssef, 2014). For almost five decades,
one of the most popular concerns in urban informality literature is the vulnerability of workers in the sector
(Steel, 2008; Etzold, 2015; Dasgupta & Lloyd-Jones, 2018). Recent developments have revealed that the

50
Esayas E. & Mulugeta S.
ANALYSIS OF SOCIOECONOMIC VULNERABILITY OF STREET VENDORS: CASE STUDY FOR DIRE DAWA CITY, EASTERN ETHIOPIA
Theor
etica
l and
Empirical Rese
arc
hes
in U
rban
Mana
gement
Volum
e 1
5
Iss
ue 2
/ M
ay 2
020
Theor
etica
l and
Empirica
l Rese
arc
hes
in U
rban
Mana
gement
sector is an integral element of and a positive force in the overall urban socioeconomic development
(Bhowmik, 2010; Neuwirth, 2012). Nevertheless, the illegal and informal status of workers in the sector
makes their working condition precarious and their livelihood more vulnerable in cities of the developing
countries (Njaya, 2014).
There are numerous studies that documented the vulnerability of the informal sector workers, in general,
and street vendors, in particular, in cities of the developing countries (Suharto, 2002; Dabir-Alai, 2004;
Amis, 2005; Kayuni & Tambulasi, 2009; Brata, 2010; Njaya,2014; Etzold, 2015; Nzeandibe ,& Mbah,
2015; Dasgupta,& Lloyd-Jones, 2018). For example, a pioneer empirical study by Dabir-Alai (2004) on
the economics of vulnerability of street vendors in Delhi in the late 1990s came up with an interesting
quantitative analysis of the vulnerability of vendors. This study has found various levels of venerability for
different groups of street vendors selling various goods and services. Similarly, a study based on survey
of food vendors, non-food vendors and service providers by Brata (2010) in Yogyakarta, Indonesia, was
another step forward in the analysis of the vulnerability of street vendors. This study has revealed that
most of street vendors in Yogyakarta experienced moderate level of vulnerability. But, vulnerability of food
vendors tend to be higher than other vendors and it varied among the locations of vending in Yogyakarta.
Çarkoglu and Eder (2006) have found that many factors could determine the informality and economic
vulnerability of the informal sector. For instance, as to Africa Centre for People Institutions and Society
[ACEPIS] (2018), the vulnerability of the sector in Nairobi was a reflection of neglect of the sector and
exclusive social and economic policies. In line with this, Asiedu and Agyei-Mensah (2008) have explored
the vulnerability of street vendors where most of them were continuously ‘on the run’ to escape
harassment, assault and seizure of goods by the city authorities in Accra. In Tanzania, confrontations
between street traders and local authorities was common which has more often led to the loss of the
vendor’s products and money, making them vulnerable to income poverty (Mramba, 2015). In Malawi, the
vulnerability of vendors was associated with political transitions where political transitions (for example,
election times) make them more vulnerable than other times (Kayuni & Tambulasi, 2009). Jimu (2004)
acknowledges that the street vendors were vulnerable to income irregularities and other socioeconomic
shocks, social dislocation, sexual violence and crime. Unlike some Asian researches (For example, Dabir-
Alai, 2002; Brata, 2010), the existing studies on African cities largely focused on describing the
vulnerability of vendors.
In Ethiopia, informality is rampant in almost all sectors in the urban areas (Fransen and Van Djik, 2008;
Central Statistical Agency (CSA), 2018). However, there are few studies that documented the types of
risks and the vulnerability of street vendors in larger urban centres, like Addis Ababa, Hawassa, Mekele,
Dessie and Jimma (For example, Jonga, 2012; Bizuneh, 2012; Sebsib, 2015). Jonga (2012) has observed

Esayas E. & Mulugeta S.
ANALYSIS OF SOCIOECONOMIC VULNERABILITY OF STREET VENDORS: CASE STUDY FOR DIRE DAWA CITY, EASTERN ETHIOPIA
51
Theor
etica
l and
Empirical Rese
arc
hes
in U
rban
Mana
gement
Volum
e 1
5
Iss
ue 2
/ M
ay 2
020
Theor
etica
l and
Empirica
l Rese
arc
hes
in U
rban
Mana
gement
that though street vending was pervasive at Megenagna Square, one of the sites of street vendor
agglomerations in Addis Ababa; vending was found to be precarious informal activity. This is because of
municipal regulations governing public spaces and business. Consequently, vendors have always been
harassed by the police, established businessmen and subjected to confiscation of their merchandises
and frequent evictions from vending spaces. In line with this, Bizuneh (2012) has pointed out the neglect
of informal sector in the national development policies, strategies and initiatives that consider street
vending as an illegal and unproductive activity. Nevertheless, there is limited understanding of the level
of vulnerability of vendors in the context of the cities and towns of Ethiopia. The extent of vulnerability of
street vendors, for example in Addis Ababa, was observed and well explained in The Reporter Newspaper
as follows:
….at certain moment you would notice that all street vendors have collected
their goods on display and running in different directions, that is when they have
sighted security people coming. Those who caught beg for mercy or even offer
bribes to the security officers to have their seized merchandise released while
the rest of them are trying to hide. The street vendors will do anything to escape
from the security; they even jump in front of a moving car because they want to
make it home with their merchandise safe with them. But, once the security
people have left, the vendors return to their places and start calling out for
buyers (The Reporter, 16 May, 2015).
The Reporter’s observation clearly demonstrates the day-to-day vulnerability of vendors and strategies
they employ to sustain their livelihood by earning from vending on the streets of the city. As it is true in
many cities of the global south, this is due to “their position is often fragile, dependent not only on
uncertainties of passing trade but also vulnerable to exploitative behaviours of those with power to enforce
oppressive regulations” (Amis, 2005:145). This is a clear indication that their livelihoods are vulnerable
almost daily. This is due to the fact that, most of the time; they are on the move when confronting with city
agents, the police and code enforcement personnel. In Ethiopia, there remains little understanding of the
livelihood trajectories of vendors and their needs and challenges remain unaddressed as no empirical
study has attempted to analyse the level of vulnerability of vendors in Ethiopian cities.
This article therefore analyses the socioeconomic vulnerability of street vendors in Dire Dawa city, Eastern
Ethiopia. In order to empirically determine their socioeconomic vulnerability, the researcher has followed
Dabir-Alai’s (Dabir-Alai, 2004) and Brata’s (Brata, 2010) frameworks of vulnerability analyses but with
little modification. This article attempts to reveal the level of vulnerability of street vendors to livelihood
risks, insecurities and adversities. Following Yatmo (2008), we argue that though street vendors make

52
Esayas E. & Mulugeta S.
ANALYSIS OF SOCIOECONOMIC VULNERABILITY OF STREET VENDORS: CASE STUDY FOR DIRE DAWA CITY, EASTERN ETHIOPIA
Theor
etica
l and
Empirical Rese
arc
hes
in U
rban
Mana
gement
Volum
e 1
5
Iss
ue 2
/ M
ay 2
020
Theor
etica
l and
Empirica
l Rese
arc
hes
in U
rban
Mana
gement
significant contributions to the urban economy, being treated as out of place urban elements, they largely
remain highly vulnerable as individual economic agents and group of people. It is hypothesised that their
vulnerability partly may emanate from their overall condition (social, economic, personal characteristics)
and partly from the institutional and legislative frameworks which is reflected in governance and
management of public spaces and businesses of the city. This study attempts to address this gap by
empirically analysing the level of vulnerability of vendors in Dire Dawa city.
2. STUDY CONTEXT AND METHODOLOGY
2.1. Context
The study was conducted in 2016 in Dire Dawa city, with a follow-up field work during March 2019 as part
of Urban Studies Foundation (USF) International Fellowship Programme, at about 505kms to East of
Addis Ababa. The city was founded as a railway station following the completion of Ethio-Djibouti railway
line in 1908 (Baldet, 1970). It is the second largest city next to Addis Ababa having a total population of
about 465,592 (CSA, 2013, forecast for 2017). It is a multiethnic city where no single ethnic group
constitutes more than half of the total population of the city (Asnake, 2014) and has cosmopolitan nature
as people from different backgrounds including foreign nationals used to live in peace (Shiferaw, 1989).
Most of the people of the city are migrants from different parts of the country (Dire Dawa Administration
Bureau of Finance and Economic Development [DDA BoFED], 2017). The most dominant functions of
the city are transport and commerce (Solomon, 2008). It is particularly known for informal cross-border
contraband trade in Eastern Ethiopia. Street vending, on the average, accounts for 33 percent of total
informal employment in Dire Dawa city (CSA, 2018).
In this study, vulnerability context implies the insecurity or wellbeing of individuals in the face of changing
social, economic, political and environmental conditions. It is exposure to sudden shocks, long term trends
or seasonal cycles (Moser, 1996). In other words, it is the context in which people engage in various
livelihoods. Thus, it can shape the external environment in connection with certain livelihoods activities
and affects the livelihoods of the people and the poor. In connection with the above, the city of Dire Dawa
has been prone to flash flooding that overflows the spaces where vendors tend to concentrate. For
instance, in 2006, it had a devastating effect on all businesses including vending as most markets are
located in prone areas.
The prevalence of high unemployment coupled with high influx of youth in-migrants are the other aspects
of vulnerability. The city has not been able to provide adequate employment opportunities the growing
Esayas E. & Mulugeta S.
ANALYSIS OF SOCIOECONOMIC VULNERABILITY OF STREET VENDORS: CASE STUDY FOR DIRE DAWA CITY, EASTERN ETHIOPIA
53
Theor
etica
l and
Empirical Rese
arc
hes
in U
rban
Mana
gement
Volum
e 1
5
Iss
ue 2
/ M
ay 2
020
Theor
etica
l and
Empirica
l Rese
arc
hes
in U
rban
Mana
gement
labour force. Despite the efforts made to create jobs mainly in the Micro and Small Enterprises (MSEs),
unemployment levels remained the highest among the major urban centres of the country.
2.2. Research Methodology
The data for this study was generated by using survey in Dire Dawa city. As street vendors are difficult to
capture using conventional sampling procedures, a different technique has been suggested to study them
(Verma, 1999; 2013). Thus, multi-stage Time-Location Sampling (TLS) procedure was employed in this
study. Time-Location Sampling has been used to study hard-to-reach segments of the population,
predominantly in demographic and public health studies (Karon, 2005; Population Service International
(PSI), 2007; Kalton, 2009; Karon & Weijnert, 2012). In Ethiopia, it was used to investigate the role of social
capital for the informal sector workers (example, Getahun and Odela, 2014). Based on initial field
observation, it appeared that street vending is location-sensitive business which is associated to a higher
degree with the specific function of the area. Thus, three major principles that dictated the selection of
vending cluster sites. Firstly, the intention was to include the major street vending cluster sites indentified
through initial field observation. Secondly, itinerant vendors should be included. Thirdly, as much as
possible the selection procedure should ensure representatives which had to make statistical inference
possible.
The approximate number of street vendors who vend in the identified places, based on data from
municipal offices was about 1650. This is used as sampling frame to draw sample street vendors. It was,
again, assumed that the above vendors attend respective places during peak hours of vending. It was
identified that street vendors work the whole week but their concentration is higher in the morning from
10:00am to 1:00pm and in the afternoon from 4:00pm to 7:00pm for both weekdays and weekends. The
sampling framework thus consisted of Venue-Day-Time Units (VDT) or Primary Sampling Units (PSUs)
since these considered representing the potential universe (vendors) of venues, days and times.
The primary data collection involved observation, questionnaire survey with 198 street vendors. Analysis
of data was made using quantitative techniques. Survey data was analysed using descriptive statistics
and Chi-Square (χ2) test was used to analyse the vulnerability based on various socioeconomic,
demographic and physical elements.
DEMOGRAPHIC & SOCIOECONOMIC PROFILE OF VENDORS
Survey results reveal that sex distribution of respondents was overwhelmingly male (62.1%) versus
female (37.9%). In terms of age distribution, the majority of the respondents (60%) were young, below
thirty years, when the 31-40 age group is included, the figure goes slightly over 4/5th of the total and the
remaining, 16.7% of the respondents were in 41 years and above. Looking into marital status, slightly
54
Esayas E. & Mulugeta S.
ANALYSIS OF SOCIOECONOMIC VULNERABILITY OF STREET VENDORS: CASE STUDY FOR DIRE DAWA CITY, EASTERN ETHIOPIA
Theor
etica
l and
Empirical Rese
arc
hes
in U
rban
Mana
gement
Volum
e 1
5
Iss
ue 2
/ M
ay 2
020
Theor
etica
l and
Empirica
l Rese
arc
hes
in U
rban
Mana
gement
over half of the respondents were single (54%) while slightly over one-third (33 %) were married, (3%)
were divorced, separated (3%) and the widowed (7%). The religious affiliation of respondents showed
that 45.3 % were Muslim, 28.3 % were followers of Orthodox Christianity, 17.7% were Protestants, 3%
were Catholic and 5.6 % do not fall under either of the above categories. Illiterate street vendors
accounted for about 22% while 11% were able to read and write. Among literate ones, those who have
some primary education were over one-third (36%), followed by those with secondary education (27%)
and some tertiary education (4%). Previous occupation of vendors shows that about 31% of the selected
street vendors were students, 21% were private employees, 16% were famers, 14 % were merchants
(Engida, 2017).
CONSTRUCTING VULNERABILITY INDEX
Probably the first empirical analysis of vulnerability was made by Dabir-Alai (2004) on street vendors in
Delhi in the late1990s. He used seven elements for constructing the vulnerability index. These included
earnings, bullying, dependants, formal education, long hours, relationship with supplier/creditor line and
spatial isolation from the kin. Age, gender, migration status and principal/agent status were also
considered in the analysis. On the other hand, a study by Brata (2010) made some modifications to Dabir-
Alai’s variable and added three elements to make the total elements ten. The added elements included
distance from the house to work place, not full ownership of business and not membership in vending
association (both formal and informal).
In this study, however, little modifications were made to the above and eight important elements were
added to empirically analyse vulnerability of street vendors in the city. Totally, eighteen variables/elements
were included in this study. The full list elements include no/low education, has dependants, is migrant,
not owner of the house, no prior business experience, not full owner of the business, has poor relationship
with supplier/creditor, work long hours, faced harassment, eviction or seizure/confiscation, does not save,
not member in association, earnings lower than average, few of stay in vending business, young or old,
not married, ethnic Amhara or Oromo and vending away from the existing market centres.
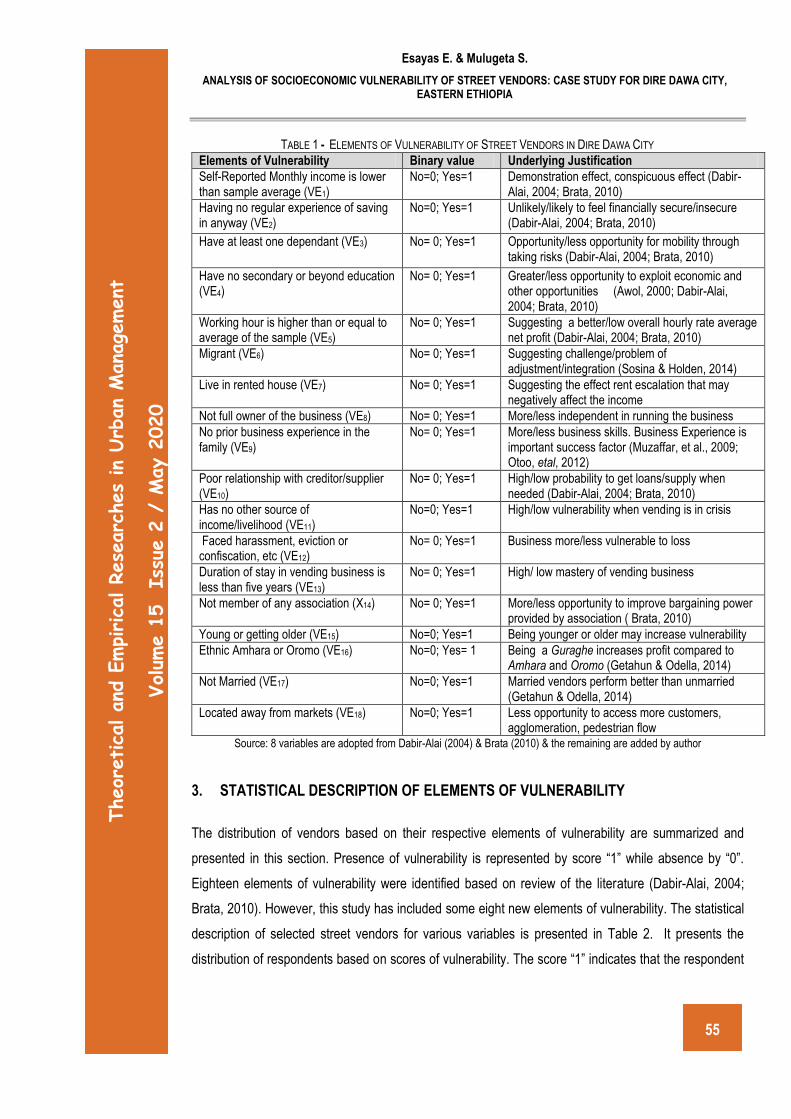
Based on binary counts of vulnerability elements, a simple formula was used to compute a composite
index of vulnerability. The index is, therefore, calculated as the sum total of binary values for each vendor.
For example, if a vendor’s value for all elements is 1, then the index will be eighteen. If all elements are
“0”, then the index will be zero, since the index consist of eighteen elements, it is recalculated by dividing
the total number of vulnerability elements to make the highest value “1”. For the sake of simplicity, these
ranks were grouped into six classes: acutely vulnerable, extremely vulnerable, strongly vulnerable,
vulnerable, mildly vulnerable and weakly vulnerable. The binary elements of vulnerability index are
provided in the Table 1.
Esayas E. & Mulugeta S.
ANALYSIS OF SOCIOECONOMIC VULNERABILITY OF STREET VENDORS: CASE STUDY FOR DIRE DAWA CITY, EASTERN ETHIOPIA
55
Theor
etica
l and
Empirical Rese
arc
hes
in U
rban
Mana
gement
Volum
e 1
5
Iss
ue 2
/ M
ay 2
020
Theor
etica
l and
Empirica
l Rese
arc
hes
in U
rban
Mana
gement
TABLE 1 - ELEMENTS OF VULNERABILITY OF STREET VENDORS IN DIRE DAWA CITY
Elements of Vulnerability Binary value Underlying Justification
Self-Reported Monthly income is lower than sample average (VE1)
No=0; Yes=1 Demonstration effect, conspicuous effect (Dabir-Alai, 2004; Brata, 2010)
Having no regular experience of saving in anyway (VE2)
No=0; Yes=1 Unlikely/likely to feel financially secure/insecure (Dabir-Alai, 2004; Brata, 2010)
Have at least one dependant (VE3) No= 0; Yes=1 Opportunity/less opportunity for mobility through taking risks (Dabir-Alai, 2004; Brata, 2010)
Have no secondary or beyond education (VE4)
No= 0; Yes=1 Greater/less opportunity to exploit economic and other opportunities (Awol, 2000; Dabir-Alai, 2004; Brata, 2010)
Working hour is higher than or equal to average of the sample (VE5)
No= 0; Yes=1 Suggesting a better/low overall hourly rate average net profit (Dabir-Alai, 2004; Brata, 2010)
Migrant (VE6) No= 0; Yes=1 Suggesting challenge/problem of adjustment/integration (Sosina & Holden, 2014)
Live in rented house (VE7) No= 0; Yes=1 Suggesting the effect rent escalation that may negatively affect the income
Not full owner of the business (VE8) No= 0; Yes=1 More/less independent in running the business
No prior business experience in the family (VE9)
No= 0; Yes=1 More/less business skills. Business Experience is important success factor (Muzaffar, et al., 2009; Otoo, etal, 2012)
Poor relationship with creditor/supplier (VE10)
No= 0; Yes=1 High/low probability to get loans/supply when needed (Dabir-Alai, 2004; Brata, 2010)
Has no other source of income/livelihood (VE11)
No=0; Yes=1 High/low vulnerability when vending is in crisis
Faced harassment, eviction or confiscation, etc (VE12)
No= 0; Yes=1 Business more/less vulnerable to loss
Duration of stay in vending business is less than five years (VE13)
No= 0; Yes=1 High/ low mastery of vending business
Not member of any association (X14) No= 0; Yes=1 More/less opportunity to improve bargaining power provided by association ( Brata, 2010)
Young or getting older (VE15) No=0; Yes=1 Being younger or older may increase vulnerability
Ethnic Amhara or Oromo (VE16) No=0; Yes= 1 Being a Guraghe increases profit compared to Amhara and Oromo (Getahun & Odella, 2014)
Not Married (VE17) No=0; Yes=1 Married vendors perform better than unmarried (Getahun & Odella, 2014)
Located away from markets (VE18) No=0; Yes=1 Less opportunity to access more customers, agglomeration, pedestrian flow
Source: 8 variables are adopted from Dabir-Alai (2004) & Brata (2010) & the remaining are added by author
3. STATISTICAL DESCRIPTION OF ELEMENTS OF VULNERABILITY
The distribution of vendors based on their respective elements of vulnerability are summarized and
presented in this section. Presence of vulnerability is represented by score “1” while absence by “0”.
Eighteen elements of vulnerability were identified based on review of the literature (Dabir-Alai, 2004;
Brata, 2010). However, this study has included some eight new elements of vulnerability. The statistical
description of selected street vendors for various variables is presented in Table 2. It presents the
distribution of respondents based on scores of vulnerability. The score “1” indicates that the respondent

56
Esayas E. & Mulugeta S.
ANALYSIS OF SOCIOECONOMIC VULNERABILITY OF STREET VENDORS: CASE STUDY FOR DIRE DAWA CITY, EASTERN ETHIOPIA
Theor
etica
l and
Empirical Rese
arc
hes
in U
rban
Mana
gement
Volum
e 1
5
Iss
ue 2
/ M
ay 2
020
Theor
etica
l and
Empirica
l Rese
arc
hes
in U
rban
Mana
gement
is completely vulnerable in that specific variable while score “0” indicates the complete absence of
vulnerability on the respective element of vulnerability considered.
TABLE 2 - DISTRIBUTION OF RESPONDENTS BASED ON ELEMENTS OF VULNERABILITY
Elements of Vulnerability No of respondents with score “1” or vulnerable
Number of respondents with score “0” or not vulnerable
No % No %
Monthly income ≤sample average 98 49.5 100 50.5
Has no some or regular experience of saving 92 46.5 106 53.5
Has at least one dependent 117 59.1 81 40.9
Has no secondary education 71 35.9 127 64.1
Working hour ≥ sample average 102 51.5 96 48.5
Is Migrant 123 62.1 75 37.8
Live in a rented house 138 69.7 60 30.3
Not full owner of the business 97 49.0 101 51.0
No prior business experience in the family 168 84.8 30 15.2
Has no other source of livelihood/income 161 81.3 37 18.7
Has poor relationship with creditor or supplier 45 22.7 153 77.3
Has faced harassment, eviction, confiscation, etc 83 41.9 115 58.1
Duration of stay in vending < five years 110 55.6 88 44.4
Not a member of any association 153 77.3 45 22.7
Young or getting older 48 24.2 150 75.8
Ethnic Amhara & Oromo 67 33.8 131 66.2
Not Married 133 67.2 65 32.8
Vend away from the market centers 80 40.4 118 59.6
Source: Based on field survey 2016
As presented in Table 2, most street vendors are male, constituting 62%. Women vendors were
widespread and usually operate in the morning and evenings. The study focused on six street vending
cluster sites and the time used for selection of vendors in the sample was the peak hour of vending. This
has lead to the over-representation of male vendors in the landscape of street vending in this study.
Another interesting feature is that most of the vendors are rural migrants from other regions. A migrant is
defined, in this study, as a person whose birth place is outside of Dire Dawa while recent migrant is
defined as a person who migrated to the city within the last five years. Migrants altogether accounted for
about 62% of the total sample. This also indicates that street vending is a livelihood option for new
entrants, which has low entry barrier in terms of human and financial capitals requirements (Sosina and
Holden, 2014).
The dominant ethnic groups engaged in street vending in the city include Guraghe, Oromo, and Somali
which accounted 28.2%, 22.2% and 13.6% respectively. Though the Guraghe ethnic group is not among
the dominant ones in the city or administration, only accounts for about seven percent; it is among the
dominant ethnic groups who engage in street vending in the city (DDA BoFED, 2017). The mean monthly
income from vending is 988 Ethiopian Birr (ETB) ($40 i.e. $1.3 per day) which is meagre and makes the
livelihood of most vendors precarious. About 70% of respondents reported that they live in rented private

Esayas E. & Mulugeta S.
ANALYSIS OF SOCIOECONOMIC VULNERABILITY OF STREET VENDORS: CASE STUDY FOR DIRE DAWA CITY, EASTERN ETHIOPIA
57
Theor
etica
l and
Empirical Rese
arc
hes
in U
rban
Mana
gement
Volum
e 1
5
Iss
ue 2
/ M
ay 2
020
Theor
etica
l and
Empirica
l Rese
arc
hes
in U
rban
Mana
gement
houses. However, about half of the respondents own the business. For most respondents, the year of
stay in vending was less than five years. Most of the vendors have primary education (36%). This
contradicts with the widely held view that states vendors have low education, poor skills, and have low
human capital (ILO, 1972; Hart, 1973; Chen, 2012).
Another feature that reveals the precariousness of vendors in the city is that they work for long hours. The
average hours worked in a day by a typical vendor is 8.6hrs while they work on the average 6.3 days in
a week. Despite the meagre income they earn from vending, they work for longer hours and days to help
themselves and their families. About 42% of respondents reported that they experienced either
harassment, confiscation of merchandise, paid fines, or evicted from working spaces in the last six
months. Another issue that worth considering is there is no vendor’s association which could help bargain
or negotiate access to space with city authorities and on issues related to formalization and registration
and licensing. The above prevalent and persistent condition would put the livelihood of vendor in jeopardy
in the city.
From all elements of vulnerability, nine appear to be the most important ones having over half of the score
“1”, i.e. vulnerable. The remaining were having score “0”, i.e. not vulnerable. The top three elements of
vulnerability having over 75% of score “1” include lack of prior business experience (84.8%), no other
source of livelihoods (81.3%) and not a member of any association (77.3%). Living in rented house, not
married and being migrant were also found to be the sources of vulnerability having 69.7%, 67.2% and
62.6% respectively. The remaining three major sources of vulnerability for vendors include at least has
one dependent to be supported, duration of stay in vending for less than five years and working hour per
day is equal to or greater than the average for the sample.
3.1. Level of vulnerability of vendors in Dire Dawa City
Vulnerability of street vendors has been analyzed using the eighteen elements mentioned in previous
section. First, the sum total of the scores computed. Then, the value for each individual has been divided
by the total number of elements of vulnerability to the make the value one or less for the sake of simplicity
of presentation. Vulnerability was computed using the following formula where “VE” represent each of
the vulnerability elements while “N” refers to the total number of vulnerability elements. Thus, the
vulnerability index was computed using the following formula.
𝑉 =𝑉𝐸1+𝑉𝐸2+𝑉𝐸3+.…….……...+𝑉𝐸18
𝑁 Where:
V refers to a composite vulnerability index.
VE1,2 3..are vulnerability elements.
N refers to the total number of vulnerability elements.

58
Esayas E. & Mulugeta S.
ANALYSIS OF SOCIOECONOMIC VULNERABILITY OF STREET VENDORS: CASE STUDY FOR DIRE DAWA CITY, EASTERN ETHIOPIA
Theor
etica
l and
Empirical Rese
arc
hes
in U
rban
Mana
gement
Volum
e 1
5
Iss
ue 2
/ M
ay 2
020
Theor
etica
l and
Empirica
l Rese
arc
hes
in U
rban
Mana
gement
Then, descriptive statistics computed. Accordingly, the mean vulnerability was 0.53 while the standard
deviation is 0.13. Thus, using the mean and standard deviation, the level of vulnerability of vendors was
determined as mean plus or minus standard deviation. The cut point values are determined based on the
above.
When the computed value of vulnerability lies below 0.14 that means the vendor is not vulnerable, if it is
between 0.15-0.27, the vendor is mildly vulnerable, if it is between 0.41-0.53, the vendors is vulnerable,
if the value is greater than the 0.53, then the vendors is either strongly, extremely or acutely vulnerable
as presented in Table 3.
TABLE 3 - DETERMINATION OF LEVEL OF VULNERABILITY OF VENDORS IN DIRE DAWA CITY
Formula (Mean ± (X)SD)
Description of computation (cut-points)
Range of vulnerability
Descriptor of Vulnerability Level
Mean-3 (SD) 0.53-3(0.13)=0.14 0.00-0.14 Not Vulnerable Mean-2 (SD) 0.53-2(0.13)=0.27 0.15-0.27 Weakly Vulnerable Mean-1 (SD) 0.53-1(0.13)=0.40 0.28-0.40 Mildly Vulnerable Mean+1 (SD) 0.53+1(0.13)=0.66 0.41-0.53 Vulnerable Mean+2 (SD) 0.53+2(0.13)=0.79 0.54-0.66 Strongly vulnerable Mean+3 (SD) 0.53+3(0.13)=0.92 0.67-0.79 Extremely vulnerable Mean +3(SD)+ 0.53+3(0.13)+ 0.80-1.00 Acutely vulnerable
Source: Computed based on vulnerability elements
Figure1 shows the level of vulnerability of vendors in the city. As expected, greater portion of street
vendors found to be vulnerable.
FIGURE 1 - DISTRIBUTION OF THE VULNERABILITY OF VENDORS IN DIRE DAWA CITY
Source: Computed based on vulnerability elements
It appears from Figure 1 that most vendors found to be vulnerable. If we specifically combine the last four
(from vulnerable to acutely vulnerable) altogether, it accounts for about 80 percent. This finding
contradicts with that of Dabir-Alai (2004) and that of Brata (2010) where they found that street vendors
were vulnerable to the ‘medium level’ in Delhi and Yogyakarta cities respectively. The findings, in this
1%18%
24%
31%
22%
4%
Weakly vulnerable
Mildly vulnerable
Vulnerable
Strongly vulnerable
Extremely vulnerable
Acutely vulnerable

Esayas E. & Mulugeta S.
ANALYSIS OF SOCIOECONOMIC VULNERABILITY OF STREET VENDORS: CASE STUDY FOR DIRE DAWA CITY, EASTERN ETHIOPIA
59
Theor
etica
l and
Empirical Rese
arc
hes
in U
rban
Mana
gement
Volum
e 1
5
Iss
ue 2
/ M
ay 2
020
Theor
etica
l and
Empirica
l Rese
arc
hes
in U
rban
Mana
gement
study, suggest that the livelihoods of vendors in Dire Dawa city vulnerable due to their demographic,
socioeconomic and business characteristics. Vulnerability is found to be low for 19 percent of respondents
as about 18 percent were mildly vulnerable and only one percent of them were weakly vulnerable. When
seen separately, about 31 percent of vendors were strongly vulnerable, 24 percent were vulnerable, 22
percent were extremely vulnerable and only 4 percent of respondents were acutely vulnerable. A more
detailed level of vulnerability of street vendors shall be discussed in the following section. The detailed
elucidation was made primarily on account of sex, location, type of goods/services, and frequency of
attendance of vending cluster site.
3.2. Vulnerability of vendors based on Vending Location
In many cities, street vendors choose to be in most convenient/profitable/accessible locations in the city
where they would get large number of potential customers. These locations provide best prospect for
vendors to take advantage of pedestrian flow and traffic jam by slowing them down. These kinds of places,
in most cases, include areas near the Central Business District (CBD), close to the formal market centres,
transport nodes, bus stations, areas close to institutions like hospitals, schools and religious institutions
like churches and mosques. The level of access to these spaces and use thereof could largely determine
the level of vulnerability of vendors. Table 4 presents the level of vulnerability of vendors based on vending
location-whether they vend close to or away from the existing markets in Dire Dawa city.
TABLE 4 - VULNERABILITY OF VENDORS BASED ON VENDING LOCATION
Vending away from existing markets
Level of vulnerability
Weakly vulnerable
Mildly vulnerable
Vulnerable Strongly vulnerable
Extremely vulnerable
Acutely vulnerable
Total
Yes 0 (0.0) 11 (13.8) 14 (17.5) 29 (36.2) 23 (28.8) 3 (3.8) 80(100)
No 2 (1.7) 24 (20.3) 34 (28.8) 32 (27.1) 21 (17.8) 5 (4.2) 118(100)
Total 2 (1.7) 35 (17.7) 48 (24.21) 61(30.8) 44 (22.2) 8 (4.0) 198(100)
NB: Values in parentheses are percentages and 100% value refers to row total.
In Dire Dawa city as street vendors usually tend to concentrate near the formal established markets, here
an effort has been made to check whether vending close to the markets was associated with level of
vulnerability. Accordingly, vendors who work close to the markets were compared with those who work
away from. A chi-square test was performed and no association was found between level of vulnerability
of vendors and location of vending (χ2=8.94; df =5; P<0.112). The result suggest that working either close
to the existing markets or away from these could not bring any substantial difference in the level of
vulnerability of vendors in the city. In other words, vulnerability of vendors depends not only on proximity
of vending site to the market but also other socioeconomic, demographic and business characteristics.

60
Esayas E. & Mulugeta S.
ANALYSIS OF SOCIOECONOMIC VULNERABILITY OF STREET VENDORS: CASE STUDY FOR DIRE DAWA CITY, EASTERN ETHIOPIA
Theor
etica
l and
Empirical Rese
arc
hes
in U
rban
Mana
gement
Volum
e 1
5
Iss
ue 2
/ M
ay 2
020
Theor
etica
l and
Empirica
l Rese
arc
hes
in U
rban
Mana
gement
This further indicates that regardless of the location where they frequently vend, street vendors are more
or less equally vulnerable in Dire Dawa city.
3.3. Level of vulnerability by type of goods vended
The type of goods and services vended by vendors could possibly be the source of their vulnerability. The
starting proposition is that level of vulnerability varies by type of goods and services vended in the city.
Thus, type goods and services vended by vendors was crosstabulated against level of vulnerability and
presented in Table 5.
TABLE 5 - LEVEL OF VULNERABILITY OF VENDORS BY TYPE OF GOODS VENDED
Level of vulnerability
Type of items vended
Fruits & vegetables
Food & drinks
Goods (new and second hand)
Total
Weakly vulnerable 0(0.0) 0(0.0) 2 (100) 2 (100)
Mildly vulnerable 6 (17.1) 10(28.6) 19(54.3) 35(100)
Vulnerable 12(25.0) 4(8.3) 32(66.7) 48(100)
Strongly vulnerable 8(13.1) 4(6.6) 49(80.3) 61(100)
Extremely vulnerable 0(0.0) 3(6.8) 41(93.3) 44(100)
Acutely vulnerable 0(0.0) 2(25.0) 6(75.0) 8(100) NB: Values in parentheses are percentages and 100% value refers to row total.
As Table 5 presents, vulnerability was found to be higher for vendors of goods (consumer durables) than
fruits and vegetables and food and drinks vendors in Dire Dawa city. The chi-square result revealed that
there is significant association between level of vulnerability and type of items vended (χ2 =30.24; df =10;
P <0.001). This might be for the reason that consumables have better market than consumer durables in
the city. It appears that this finding contradicts with the same study conducted in Delhi, India by Dabir-
Alai (2004) and Yogyakarta, Indonesia by Brata (2010). They found that food vendors were more
vulnerable than non-food vendors. But in the context of Dire Dawa city, non-food vendors are more
vulnerable than food and drinks and vegetable and fruits vendors.
3.4. Level of Vulnerability by Sex of Respondents
Sex of vendors thought to be the source of their vulnerability. Women are usually considered to be more
vulnerable than men (ILO, 2002). Here the purpose was to check whether male or female vendors were
more vulnerable. Table 6 presents the level of vulnerability for female and male vendors in the city.
TABLE 6 - LEVEL OF VULNERABILITY BY SEX OF RESPONDENTS
Sex of respondent
Level of vulnerability
Weakly vulnerable
Mildly vulnerable
Vulnerable Strongly
vulnerable Extremely vulnerable
Acutely vulnerable
Total
Male 1 (0.8) 11 (8.9) 27 (22.0) 46(37.4) 32 (26.0) 6 (4.9) 123(100)
Female 1 (1.3) 24(32.0) 31 (28.0) 15 (20.0) 12 (16.0) 2 (2.7) 75(100)
Total 2 (1.0) 35 (17.7) 48(24.21) 61(30.8) 44 (22.2) 8 (4.0) 198(100) NB: Values in parentheses are percentages and 100% value refers to row total.

Esayas E. & Mulugeta S.
ANALYSIS OF SOCIOECONOMIC VULNERABILITY OF STREET VENDORS: CASE STUDY FOR DIRE DAWA CITY, EASTERN ETHIOPIA
61
Theor
etica
l and
Empirical Rese
arc
hes
in U
rban
Mana
gement
Volum
e 1
5
Iss
ue 2
/ M
ay 2
020
Theor
etica
l and
Empirica
l Rese
arc
hes
in U
rban
Mana
gement
The result reveals that there is significant association between gender and level of vulnerability as it has
been attested by the chi-square test (χ2 =22.09; df =5; P <0.001). As male vendors are overrepresented
in the study they tend to be more vulnerable than their female counterparts and the finding contradicts
with many studies conducted in the context of developing countries (Chen, 2012).
3.5. Level of Vulnerability by Attendance of Vending Site
Access to and use of streets could possibly be associated with the level of vulnerability of vendors. More
specifically, the frequency of attendance of a particular vending cluster site could determine the level of
vulnerability of vendors given vending is the sole livelihood for the majority of vendors. Thus, an attempt
has been made to check whether there is difference among vendors based on their frequency of
attendance of the vending cluster sites in which they most often vend. Table 7 presents the level of
vulnerability of vendors by their respective frequency of attendance of the particular vending cluster site.
As it has been presented in Table 7, there has been a showcase that clearly demonstrates the decrease
in the level of vulnerability of vendors by frequency of attendance of vending cluster sites. Thus, those
who regularly attend, five to six days in a week, are the least vulnerable group of vendors while those who
reportedly attend one to two days in a week found to be the most vulnerable groups. As streets or public
spaces are vital sources, being the most important spatial capital, found to profoundly affect the level of
vulnerability of vendors in Dire Dawa city. Chi-square result revealed that the level of vulnerability has
significant association with frequency of attendance of particular vending site vendors (χ2 =28.39; df =15;
P < 0.05). This finding suggests that those who regularly attend vending cluster sites are less likely to be
vulnerable in the city.
TABLE 7 -LEVEL OF VULNERABILITY OF VENDORS BY FREQUENCY OF ATTENDANCE OF VENDING SITE
Frequency of Attendance of vending site in
a week
Level of vulnerability
Weakly vulnerable
Mildly vulnerable
Vulnerable Strongly
vulnerable Extremely vulnerable
Acutely vulnerable
Total
Daily 5-6 days 3-4 days 1-2 days Total
1 (1.4) 17 (24.3) 23 (32.9) 20 (28.6) 9 (12.9) 0 (0.0) 70(100)
1(1.8) 12(21.1) 13 (22.8) 11(19.3) 16(28.1) 4(7.0) 57(100)
0 (0.0) 6 (13.6) 6 (13.6) 19 (43.2) 10 (22.7) 3 (6.8) 44(100)
0(0.0) 0(0.0) 6(22.2)) 11(40.7) 9(33.3) 1 (3.7) 27(100)
2 (1.0) 35 (17.7) 48 (24.21) 61 (30.8) 44 (22.2) 8 (4.0) 198(100)
NB: Values in parentheses are percentages and 100% value refers to row total.
4. CONCLUSIONS AND IMPLICATIONS
This study has empirically analyzed the vulnerability of street vendors in Dire Dawa city, Eastern Ethiopia.
Examining street vendors’ activities and livelihoods, mainly their socio-spatial position making them

62
Esayas E. & Mulugeta S.
ANALYSIS OF SOCIOECONOMIC VULNERABILITY OF STREET VENDORS: CASE STUDY FOR DIRE DAWA CITY, EASTERN ETHIOPIA
Theor
etica
l and
Empirical Rese
arc
hes
in U
rban
Mana
gement
Volum
e 1
5
Iss
ue 2
/ M
ay 2
020
Theor
etica
l and
Empirica
l Rese
arc
hes
in U
rban
Mana
gement
vulnerable and the institutional and legislative structures were constraining their livelihoods capabilities in
the city. The analysis has revealed that street vendors of Dire Dawa are highly vulnerable. The chi-square
test has shown that vulnerability varied with type of goods vended, sex, and frequency of attendance of
vending site, however, not with the location of vending. The analysis surfaced the potential of the
framework used to empirically determine vulnerability in different contexts and at different times.
In Dire Dawa city, street vendors tend to congregate on the road junctions near the existing formal open
markets to take the advantage of passing pedestrians who visit these markets. Therefore, provision of
on-site and off-site vending sites for vendors by the city authorities is highly recommended. This is
because subtle control over the vending activities by establishing code enforcement offices and deploying
personnel considering and treating them as illegals may not necessarily and adequately help alleviate the
perceived problems happen to cause due to vendors.
The right to work and right to the city (to space) should be the focus of the strategies and policies adopted
to help informal sector workers. For instance, street vendors prefer to work on the streets which are the
most profitable location for them to make their livelihoods. Restricting them from accessing public spaces
such as streets could not help. For example, relocation of vendors from streets to popular indoor markets
has increased the precariousness of the political and social conditions of vendors (Carrieri and Murta,
2011). Therefore, streets are assets for them. This should be properly managed by planning interventions
or negotiated.
There should be a move from recognition of the sector in the national surveys and some policy documents
to harnessing its transformative role for urban socioeconomic development. Primarily, it can act as a
seedbed for near future micro and small entrepreneurs and in the long run owners of medium and large
companies. Hence, it can help reduce poverty, unemployment, inequality and generate income and
contribute positively towards sustainable development. Ruzek (2015) argues that the informal economy
is and can be a catalyst for sustainability. According to him, it can provide social capital, promote local
economies, create jobs and help ensure sustainable future. By doing so, it can provide a viable alternative
path of development that is needed for sustainable future.
ACKNOWLEDGEMENT
The corresponding author is grateful to the Urban Studies Foundation (USF) of the University of Glasgow
for generous support. The USF International Fellowship (2018) helped the author to take a visiting Scholar
position in the School of Geography and Planning at Cardiff University to refine the article (January-June
2019).

Esayas E. & Mulugeta S.
ANALYSIS OF SOCIOECONOMIC VULNERABILITY OF STREET VENDORS: CASE STUDY FOR DIRE DAWA CITY, EASTERN ETHIOPIA
63
Theor
etica
l and
Empirical Rese
arc
hes
in U
rban
Mana
gement
Volum
e 1
5
Iss
ue 2
/ M
ay 2
020
Theor
etica
l and
Empirica
l Rese
arc
hes
in U
rban
Mana
gement
REFERENCES
ACEPIS. (2018). Exploring Vulnerability among Small Scale Traders in the Informal Sector in Nairobi, Kenya, a paper presented to The Institute for Social Accountability, Retrieved January 21, 2018, from https://www.tisa.or.ke/images/uploads/Draft_Report_Exploring_Vulnerability_of_Informal_ Traders_ in_Nairobi.pdf
Amis, P.(2005). Regulating the informal sector: Voice and Bad Governance, in Carole Rakodi& Tony Lloyd (ed.) 2005: Urban Livelihoods: A People-centred Approach to Reducing Poverty. London: Earthscan Publications Limited.
Asiedu, A. B., & Agyei-Mensah, S. (2008). Traders on the run: Activities of street vendors in the Accra Metropolitan Area. Norwegian Journal of Geography, 62(3), 191-202.
Asnake, K. (2014). Ethnic Decentralization and the Challenges of Inclusive Governance in Multiethnic Cities: The Case of Dire Dawa, Ethiopia. Regional and Federal Studies, 24 (5), 589-605.
Baldet, H. (1970). Urban Study of Dire Dawa. Unpublished BA Thesis in Geography, Haile Selassie I University.
Brata,A, G.(2010). Vulnerability of the Urban Informal sector: Street Vendors in Yogyakara, Indonesia. Theoretical and Empirical Researches in Urban Management, 5(5), 47-58.
Bhowmik, S. (2010). Street Vendors in the Global Urban Economy. New Delhi: Rutledge.
Brown A. (2006). Contested Space: Street trading, Public space, and Livelihoods in Developing Cities, Warwickshire, UK: Intermediate Technology Publications Ltd.
Çarkoglu,A.&Eder,M.(2006).Urban Informality and Economic vulnerability: The Case of Turkey, Retrieved June 15, 2017, from http://research.sabanciuniv.edu/28/1/stvkaf01670.pdf
Carrieri,A., &Murta, I. (2011). Cleaning Up the City: A Study on the Removal of street vendors from Downtown Belo Horizonte, Brazil. Canadian Journal of Administration Science, 28, 217-225.
Chen, M. (2012). The Informal Economy: Definitions, Theories and Policies, WIEGO Working Paper:WIEGO. Retrieved May 12, 2017, from https://www.wiego.org/sites/default/files/publications/files/Chen_WIEGO_WP1.pdf
CSA. (2008). The 2007 Population and Housing Census Report, FDRE, Addis Ababa .
CSA .( July 2013) Population Projections for Ethiopia 2007-2037, Addis Ababa.
CSA .(2018). Statistical Report on The 2018 Urban Employment Unemployment Survey, Statistical Bulletin 586, Addis Ababa
Dabir-Alai, P. (2004). The Economics of Street Vending: An Empirical Framework for measuring vulnerability in Delhi in the late 1990s, a paper presented at EGDI and UNU-WIDER Conference, Unlocking Human Potential: Linking the informal and formal sector, 17-18 September, 2004, Helsinki, Finland.
Dasgupta, N. & Lloyd-Jones,T. (2018). Heterogeneity and vulnerability in the urban informal economy: Reworking the problem in the current context. The case of Uganda, World Development Perspectives, 10–12 (2018) 64–72
DDA BoFED. (2017). Development Indicators of Dire Dawa Administration from 2009/10-2015/16. Dire Dawa: Author

64
Esayas E. & Mulugeta S.
ANALYSIS OF SOCIOECONOMIC VULNERABILITY OF STREET VENDORS: CASE STUDY FOR DIRE DAWA CITY, EASTERN ETHIOPIA
Theor
etica
l and
Empirical Rese
arc
hes
in U
rban
Mana
gement
Volum
e 1
5
Iss
ue 2
/ M
ay 2
020
Theor
etica
l and
Empirica
l Rese
arc
hes
in U
rban
Mana
gement
De Soto, H. (1989). The Other Path: The invisible Revolution in the Third World. New York: Herper and Row Publishers.
Engida E. (2017). Spatio-temporal Patterns and Management of street vending in Dire Dawa, Eastern Ethiopia, PhD Dissertation, Addis Ababa University.
Etzold, B. (2015): Selling in Insecurity – Living with Violence: Eviction Drives against Street Food Vendors in Dhaka & the Informal Politics of Exploitation. In: Ha, N. & K. Graaf (Ed.): Street Vending in the Neoliberal City: A Global Perspective on the Practices & Policies of a Marginalized Economy. (Berghahn Books) New York:164-190.
Fransen,J.& Van Djik,P.(2008). Informality in Addis Ababa, Institute of Housing Studies, Rotterdam.
Gehahun, F. & Odella, F. (2014). The Economic Returns of Network Resources to the Urban Informal Economy: Evidences from Street Vendors in Addis Ababa, Ethiopia. European Journal of Sustainable Development, 3(3), 357-372.
Hart, K. (1973). Informal Income Opportunities and Urban Employment in Ghana. The Journal of Modern African Studies, 11, 65-89.
ILO. (1972). Employment, income and inequality: A strategy for increasing productive, London :Commonwealth Secretariat.
ILO .(2002). Decent Work and the Informal Economy Report, VI, ILO, 90th Session, Geneva
Jimu,I. (2004). An exploration of street vending’s contribution towards Botswana’s Vision of Prosperity for all by 2016. Pula: Botswana Journal of African Studies, 18 (1), 19-30.
Jonga, W. (2012). Street Vending at Megenagna (Ethiopia): Challenges and Prospects. Review of Management Innovation and Creativity, 5(15), 50-69.
Kalton, G. (2009). Methods for Oversampling Rare Subpopulations in Social Surveys. Survey Methodology, 35 (2), 125-141.
Karon, G.(2005). The Analysis of Time-Location Sampling Study Data, ASA Section on Research Methods. Retrieved May 15, 2015 from https://www.researchgate.net /publication/ 254807771_ The_Analysis_of_Time-location_Sampling_Study_Data
Karon, J. &Weijnert, C. (2012). Statistical Methods for the Analysis of Time-Location Sampling Data. Journal of Urban Health: Bulletin of New York Academy of Medicine, 89 (3), 565-86.
Kayuni,H,M. and Tambulasi,R. (2009). Political Transitions and Vulnerability of Street Vending in Malawi, Theoretical and Empirical Researches in Urban Management, 4, 3 (12):79-96
Mariamawit, E. (2015, May 16). Ethiopia: The street vendors of Addis Ababa, The Reporter. Addis Ababa
Moser, C.( 1996). Confronting Crisis: A Comparative Study of Household Responses To Poverty and Vulnerability in Four Urban Communities, Washington: The World Bank.
Muzaffar,A., Huq,I., Mallik, B. (2009). Enterpreneurs of the Streets: An analytical frameworks on the street food vendors of Dhaka City, International Journal of Business and Management, 4 (2), 80-88
Neuwirth, R. (2012). Stealth of Nations: The Global Rise of Informal Economy. New York: Pantheon.
Njaya,T. (2014). Coping with Informality and Illegality: The case of street entrepreneurs of Harare Metropolitan, Zimbabwe. Asian Journal of Economic Modeling, 2(2), 93-102.
Esayas E. & Mulugeta S.
ANALYSIS OF SOCIOECONOMIC VULNERABILITY OF STREET VENDORS: CASE STUDY FOR DIRE DAWA CITY, EASTERN ETHIOPIA
65
Theor
etica
l and
Empirical Rese
arc
hes
in U
rban
Mana
gement
Volum
e 1
5
Iss
ue 2
/ M
ay 2
020
Theor
etica
l and
Empirica
l Rese
arc
hes
in U
rban
Mana
gement
Nzeandibe, T.C.,&Mbah,P.O.(2015). Beyond Urban Vulnerability: Interrogating the social sustainability of
a livelihood in the informal economy in Nigerian Cities. Review of African Political Economy, 42 (144), 279-298.
Otoo, M., Ibro, G., Fulton, J., &Lowenberg-Deboer. (2012). Micro-entrepreneurship in Niger: Factors Affecting the success of Women Street Food Vendors, Journal of African Business, 13 (1), 16-28
PSI. (2007).Sampling Hard-to-reach Populations, Washington: Author.
Portes, A. (1985). The Informal Sector and the World Economy: Notes on the Structure of Poverty Reduction: A Handbook for Policy Makers and Other Stakeholders, Earthscan Publications Limited: London.
Richmond, A;Myers,I; Namuli, H. (2018). Urban Informality and Vulnerability: A Case Study in Kampala, Uganda, Urban Science, 2 (22), 1-13.
Ruzek, W. (2015). The Informal Economy as Catalyst for Sustainability, Sustainability, 7,23-34
Sebsib H. (2015).Women in the Informal sector: Retrospect’s and Socioeconomic Response in Dessie town, Ethiopia: the case of parallel trading. International Journal of Developing Societies, 4 (2), 85-94.
Shiferaw B. (1989), Aspects of the History of Dire Dawa (1902–1936), Proceedings of the Fourth Seminar of the Department of History. Addis Ababa: Addis Ababa University.
Solomon M. (2008). The Economic Bases of Ethiopian Urban Centers, Journal of Ethiopian Studies, 41(1/2) (June-December 2008), 9-25.
Sosina B. & Holden T. (2014). Rural-Urban Youth Migration and Informal Self- Employment in Ethiopia, Technical Report, Norwegian University of Life Sciences (NMBU).
Steel, G. (2008). Vulnerable Careers: Tourism and Livelihood Dynamics among Street Vendors in Cusco, Peru, PhD Dissertation, University of Utrecht.
Suharto, G. (2002). Profiles and Dynamics of the Urban Informal Sector in Indonesia: A study of PedagangKakilima in Bandung, PhD Dissertation in Development Studies, Massey University.
Tamirat M. and Nega J. (2015). Street vending as the safety-net for the disadvantaged people: The case of Jimma Town. International Journal of Sociology and Anthropology, 7 (5), 123-137.
Verma, V. (1999). Sample design considerations for informal sector surveys, ILO: Retrieved June 2017 from http://www.stat.fi/isi99/proceedings.html
Verma, V. (2013). Sampling Elusive Populations: Applications to studies of Child Labour.Geneva: ILO.
Williams, C. (2006). The Hidden Enterprise Culture: Entrepreneurship in the underground Economy, Cheltenham: Edward Elgar.
Yatmo, Y. (2008). Street Vendors as ‘Out of Place’ Urban Elements. Journal of Urban Design, 13(3), 387-402.
Yeneneh B. (2012). The Contribution of Street Vending to urban livelihoods of street vendors in Jimma Town, Unpublished MA Thesis in Urban Management, Ethiopian Civil Service University.