analysis of scada data from offshore wind farms · •scada means supervisory control and data...
TRANSCRIPT


DTU Wind Energy, Technical University of Denmark
CV – Kurt S. Hansen – Senior Scientist
• Department of Wind Energy/DTU ≥ 240 Employees
– DTU/WE educate 40-60 students on master level annually
– My working area: research & education
• ≥ 40 years of experience with wind energy
– Initial projects: (large) proto wind turbines, design & testing.
– Data analysis as part of research projects.
– Flow analysis in onshore and offshore wind farms based on SCADA data
– Analysis of structural loads on single wind turbines and turbines in clusters
• 15 years of experience with education of students of master level in wind turbine measurement technique.
2 Wakebench - Tokyo 2018 17. April 2018
ORCID: 0000-0001-7109-3855

DTU Wind Energy, Technical University of Denmark
Outline
• Objectives
• SCADA data
– Qualification
– Inflow conditions
• Definition of wake losses
– Power deficit
– Park efficiency
• Wind farms
– Benchmarks
– Cluster effect
– Structural loads
• Acknowledgement
3 17. April 2018Wakebench - Tokyo 2018

DTU Wind Energy, Technical University of Denmark
Objectives
• Optimisation of wind turbine layout
– Energy production & turbine loading
• Wind speed distribution, wind rose (& stratification)
• Spacing, turbulence & wake effects
• Investigate coastal effects
• Validate wind farm tools
– Engineering models (WAsP, FUGA,..)
– CFD tools based on RANS, LES,.. models
• Benchmarking of flow models
– EU-Upwind (HR1, Nysted,..)
– IEA-Annex 31: Wakebench (HR1, Lillgrund,..)
– EERA-DTOC (HR1, Lillgrund, Nysted/Rødsand2,..)
4 Wakebench - Tokyo 2018 17. April 2018

DTU Wind Energy, Technical University of Denmark
SCADA data
• SCADA means Supervisory Control And Data Acquisition and is used to log all parameters recorded through the control system.
• SCADA was pioneered in the industry, as the need for remote access and control of manufacturing grew in the 1960th.
• The turbine SCADA data of interest from a wind turbine includes the basic operational parameters: Active power, Rotor speed, Pitch angle(s), wind speed and wind direction on nacelle and yaw position averaged for 600 seconds.
• The SCADA data from all wind turbines are stored in huge databases and used for supervision of the wind farm operation.
5 Wakebench - Tokyo 2018 17. April 2018
DTU Wind Energy, Technical University of Denmark
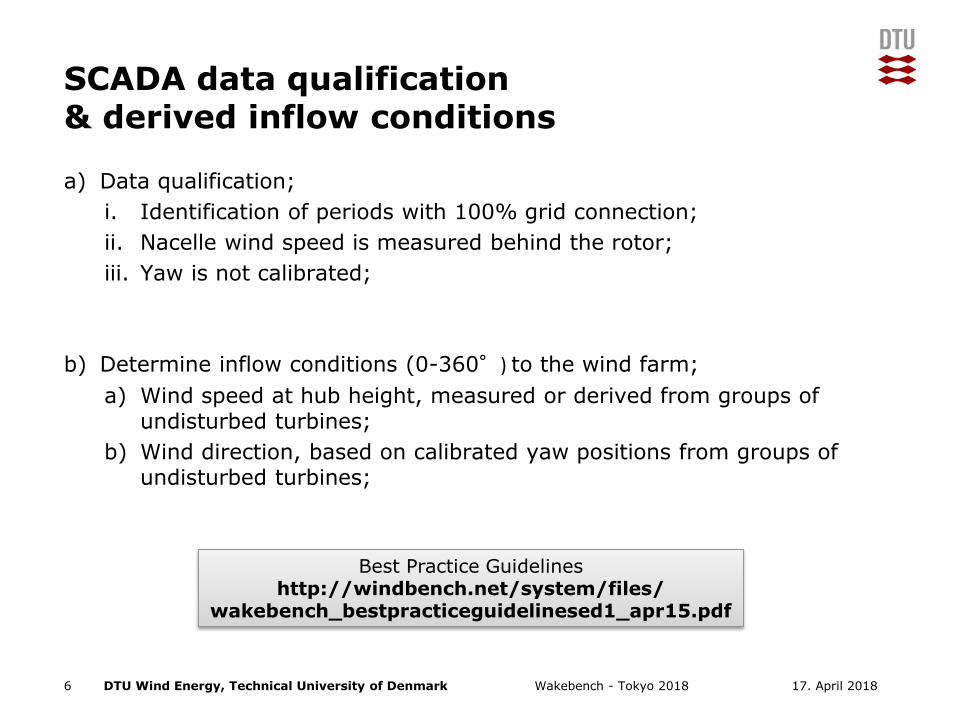
SCADA data qualification & derived inflow conditions
a) Data qualification;
i. Identification of periods with 100% grid connection;
ii. Nacelle wind speed is measured behind the rotor;
iii. Yaw is not calibrated;
b) Determine inflow conditions (0-360°) to the wind farm;
a) Wind speed at hub height, measured or derived from groups of undisturbed turbines;
b) Wind direction, based on calibrated yaw positions from groups of undisturbed turbines;
6 Wakebench - Tokyo 2018 17. April 2018
Best Practice Guidelineshttp://windbench.net/system/files/
wakebench_bestpracticeguidelinesed1_apr15.pdf

DTU Wind Energy, Technical University of Denmark
Wake losses Determination of power deficit
7 Wakebench - Tokyo 2018 17. April 2018
Definition of power deficit = 1 – power ratio = 1 – Pwake/Pfree

DTU Wind Energy, Technical University of Denmark
Power deficit along a row of turbines
8 Wakebench - Tokyo 2018 17. April 2018
Hansen KS, RJ Barthelmie, LE Jensen and A Sommer, The impact of turbulence intensity and atmospheric stability on power deficits due to wind turbine wakes at Horns Rev wind farm. Wind Energy, 2012. WE-10-0149
Increasedsector size, ∆
Ex: HR1

DTU Wind Energy, Technical University of Denmark
Park efficiency
• Manufacturers power curve represent the power as function of ambient, undisturbed wind speed, measured at hub height is: 𝑃𝑖 = 𝑓(𝑈𝑖).
• Theoretical park power is: 𝑃𝑃𝑎𝑟𝑘,𝑖 = 𝑛𝑝𝑎𝑟𝑘 × 𝑃𝑖 where i represent the wind
speed interval.
• Definitions of park efficiency: 𝑃𝐸𝑖 = 100 × 𝑗=1
𝑛𝑝𝑎𝑟𝑘𝑃𝑖,𝑗
𝑛𝑝𝑎𝑟𝑘×𝑃𝑤𝑡,𝑖
9 Wakebench - Tokyo 2018 17. April 2018
Park efficiency @ 8 m/s; ∆=10°
Ex: HR1

DTU Wind Energy, Technical University of Denmark
Horns Rev 1 (HR1) offshore wind farm80 x 2 MW, 7 – 10 D spacing
10 Wakebench - Tokyo 2018 17. April 2018
N
• Regular 8 x 10 WF layout
• Free, undisturbed inflow S-W-N
• Coastal effect: E
• 2 wake masts
©Christian Steinness 2008

DTU Wind Energy, Technical University of Denmark
HR1 benchmarks
11 Wakebench - Tokyo 2018 17. April 2018
Objectives are to investigate flow during waked operation.
1) Averaged power deficit along a single row of turbines;
2) Average power deficit as function of
a) Wind direction;
b) Turbulence intensity (peak deficit);
3) Averaged power deficit along a single row of turbines
a) as function of stratification (stable, neutral or unstable);
b) as function of spacing;
4) Park efficiency;

DTU Wind Energy, Technical University of Denmark
Lillgrund offshore wind farm48 x 2.3 MW-93m SWP, spacing 3.3-4.3-7 D
• Location: Between Denmark-Sweden
• 2 missing turbines
• Very small spacing
12 Wakebench - Tokyo 2018 17. April 2018
©Kurt S. Hansen 2012
Objectives were to investigate flows during waked operation for very small spacing

DTU Wind Energy, Technical University of Denmark
Lillgrund benchmarks
1) Averaged power deficit - as function of inflow direction for a pair of turbines with 3.3D spacing;
2) Peak power deficit – as function of turbulence intensity for both 3.3D & 4.3 D spacing;
3) Averaged power deficit along a row of turbines for both 3.3D & 4.3 D spacing;
4) Averaged power deficit along a row of turbines for 3.3D & 4.3 D spacing – based on rows with ”missing” wind turbines;
5) Park efficiency.
13 Wakebench - Tokyo 2018 17. April 2018

DTU Wind Energy, Technical University of Denmark
Lillgrund benchmark results
14 Wakebench - Tokyo 2018 17. April 2018
SCADA

DTU Wind Energy, Technical University of Denmark
Wind farm clustering effects
Objectives: - Investigate the interaction between 2 neighbouring wind farms
1) Nysted: Bonus 2.3-82.4 m, 2-speed, active stallPrincipal spacing: 10.1 & 5.6 D
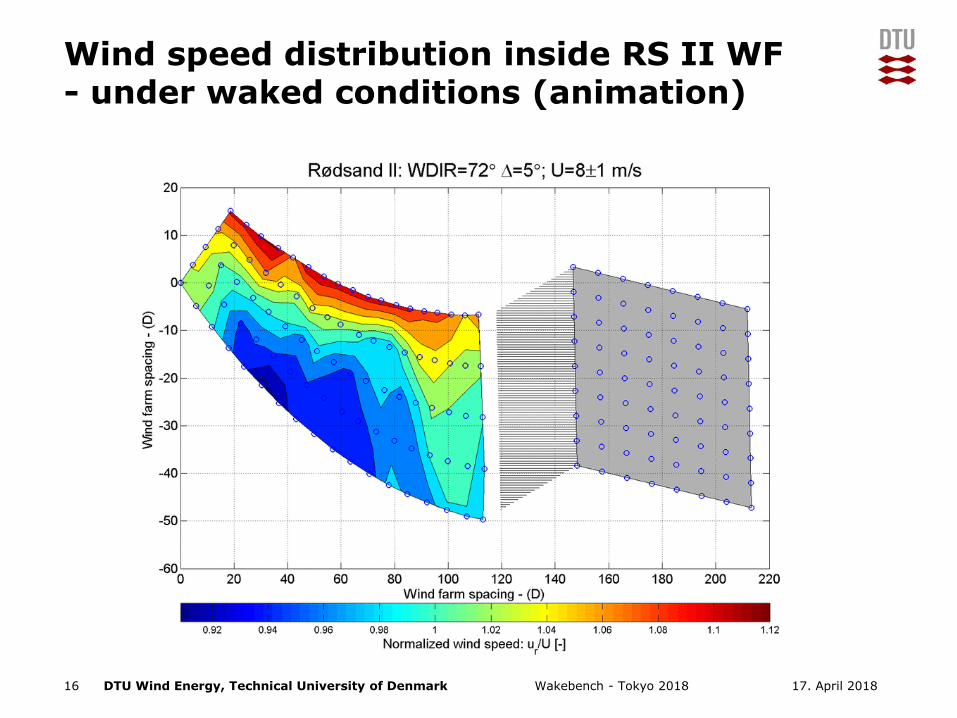
2) Rødsand II:SWP: 2.3-92.6m, VS & VPSpacing: variable 5 –6 –7 -10D
15 Wakebench - Tokyo 2018 17. April 2018
Reference: Simulation of wake effects between two wind farms KS Hansen et al 2015 J. Phys.: Conf. Ser. 625 012008
Objectives: Model and validate the cluster effects.
DTU Wind Energy, Technical University of Denmark
Wind speed distribution inside RS II WF - under waked conditions (animation)
16 Wakebench - Tokyo 2018 17. April 2018

DTU Wind Energy, Technical University of Denmark
Anholt offshore wind farm - ANH
17 17. April 2018
Photo courtesy: DONG Energy A/S
Wakebench - Tokyo 2018
Objectives: Model and validate of coastal effects on a large wind farm.
Peña et.al. On wake modeling, wind-farm gradients and AEP predictions at the Anholt wind farm. Wind Energy Science 2018
Photo courtesy: DONG Energy A/S

DTU Wind Energy, Technical University of Denmark
ANH-Location
18 17. April 2018
ANHOLTOffshore Wind farm
DONG Energy
111 x SWT - 3.6-120, HH=82m
Wakebench - Tokyo 2018

DTU Wind Energy, Technical University of Denmark
ANH – operationalstatistics in 2014 summary
• Average [technical] availability of SCADA systems: 98% (range 94-98%)
• Averaged availability of all turbines: 97% (range 88-98%)
• Average CF of all turbines: 52% (range 43 – 54%)
19 17. April 2018Wakebench - Tokyo 2018
Relative deviation from averaged CF

DTU Wind Energy, Technical University of Denmark
ANH: Gradient analysis=>Westerly inflow
20 17. April 2018Wakebench - Tokyo 2018

DTU Wind Energy, Technical University of Denmark
ANH: Wind speed gradient for westerly inflow
21 17. April 2018Wakebench - Tokyo 2018

DTU Wind Energy, Technical University of Denmark
Structural load analysis for wind turbines operating in wind farms
• Load analysis for single turbines have been performed for several wind farms.
a) Horns Rev 1 offshore wind farm
b) Egmod an Zee offshore wind farm
c) Lillgrund offshore wind farm- in progress;
22 Wakebench - Tokyo 2018 17. April 2018
TJ Larsen et.al Validation of the dynamic wake meander model for loads and power production in the Egmond aan Zee wind farmWIND ENERGY 2013; 16:605–624 DOI: 10.1002/we.1563
Objectives are to validate the structural wind turbine loads for waked operation.

DTU Wind Energy, Technical University of Denmark
Acknowledgements
We acknowledge E•ON, Ørsted (formerly DONG Energy) and Vattenfall for having the access to the SCADA data from the Rødsand II, Nysted, Horns Rev, Anholt, Egmond aan Zee and Lillgrund offshore wind farms.
23 Wakebench - Tokyo 2018 17. April 2018

DTU Wind Energy, Technical University of Denmark
Thanks for your attention
24 Wakebench - Tokyo 2018 17. April 2018
by courtesy of E•ON