analysis of phytoplankton bloom phenology by ... · analysis of phytoplankton bloom phenology by...
TRANSCRIPT
Analysis of phytoplankton bloom phenology
by identification of Gaussian mixture
for the period 1989-2014
in the southern bight of the North Sea.
Lefebvre A.1 and Poisson-Caillault E.1,2
1 Ifremer, Laboratoire Environnement et Ressources,
150 quai Gambetta, 62200, Boulogne sur Mer,
France. E-mail: [email protected]
2 Univ. Littoral Côte d’Opale, LISIC - Laboratoire d'Informatique
Signal Image de la Côte d'Opale,
62228 Calais, France. E-mail: [email protected]
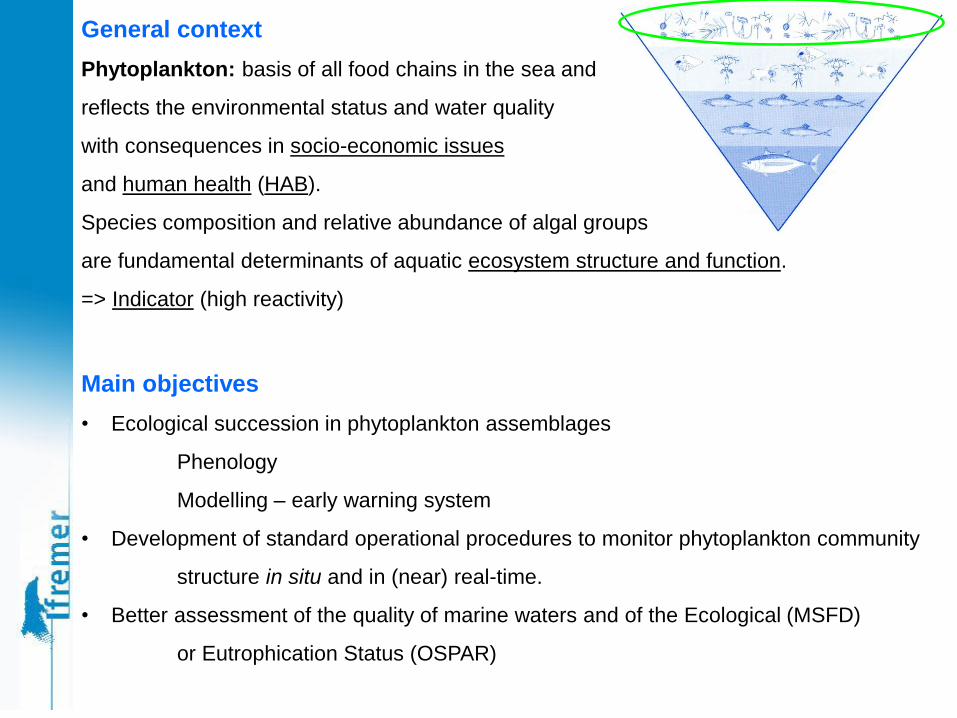
General context
Phytoplankton: basis of all food chains in the sea and
reflects the environmental status and water quality
with consequences in socio-economic issues
and human health (HAB).
Species composition and relative abundance of algal groups
are fundamental determinants of aquatic ecosystem structure and function.
=> Indicator (high reactivity)
Main objectives
• Ecological succession in phytoplankton assemblages
Phenology
Modelling – early warning system
• Development of standard operational procedures to monitor phytoplankton community
structure in situ and in (near) real-time.
• Better assessment of the quality of marine waters and of the Ecological (MSFD)
or Eutrophication Status (OSPAR)
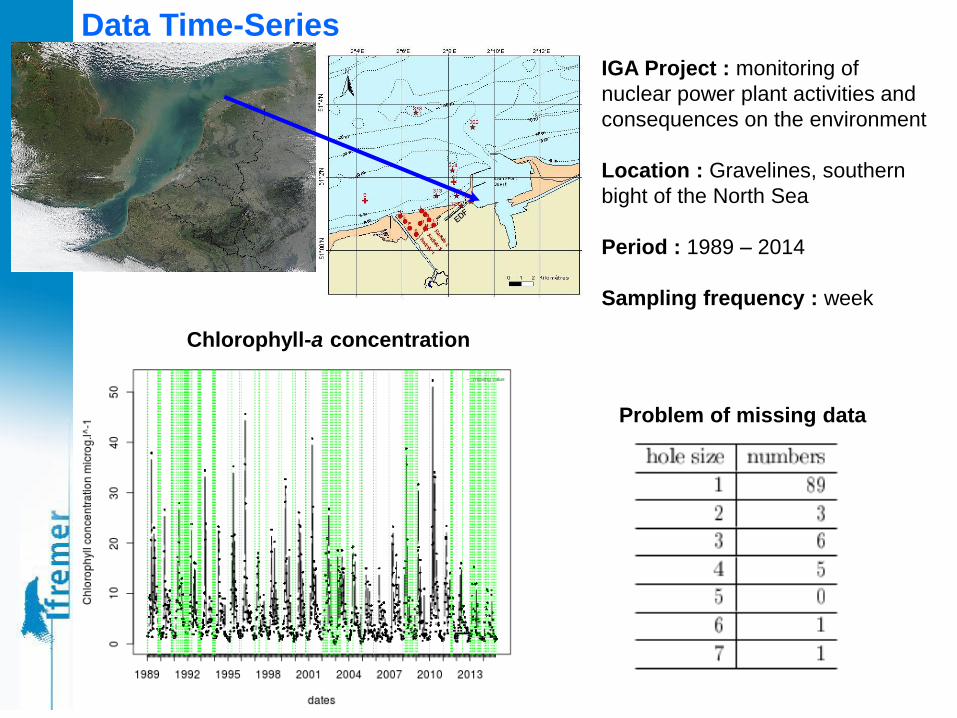
Data Time-Series
IGA Project : monitoring of
nuclear power plant activities and
consequences on the environment
Location : Gravelines, southern
bight of the North Sea
Period : 1989 – 2014
Sampling frequency : week
Chlorophyll-a concentration
Problem of missing data
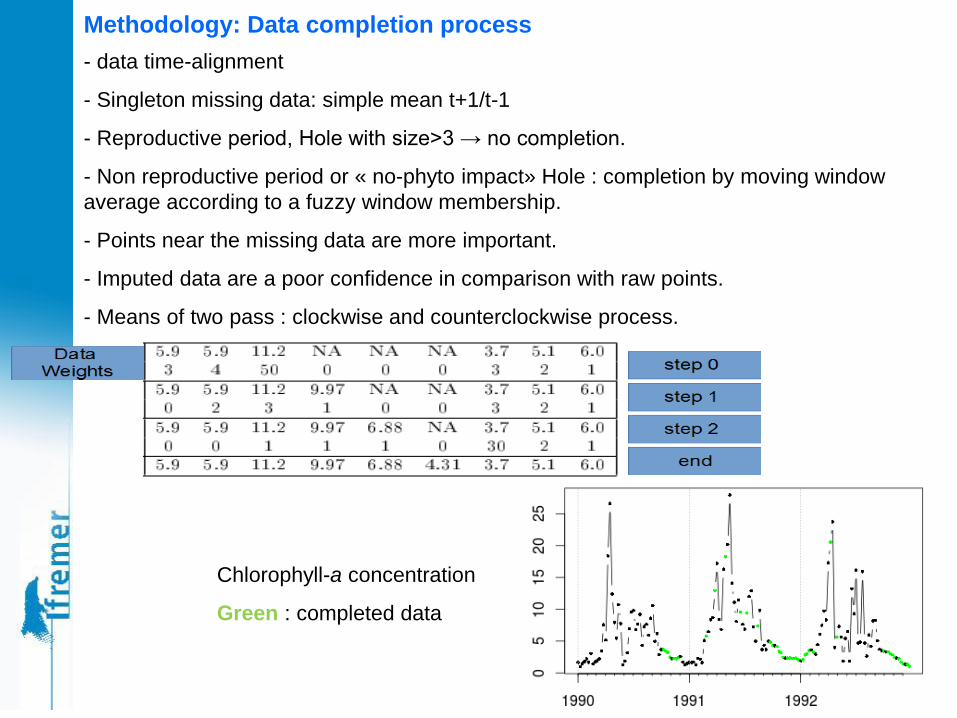
- data time-alignment
- Singleton missing data: simple mean t+1/t-1
- Reproductive period, Hole with size>3 → no completion.
- Non reproductive period or « no-phyto impact» Hole : completion by moving window
average according to a fuzzy window membership.
- Points near the missing data are more important.
- Imputed data are a poor confidence in comparison with raw points.
- Means of two pass : clockwise and counterclockwise process.
Methodology: Data completion process
Chlorophyll-a concentration
Green : completed data
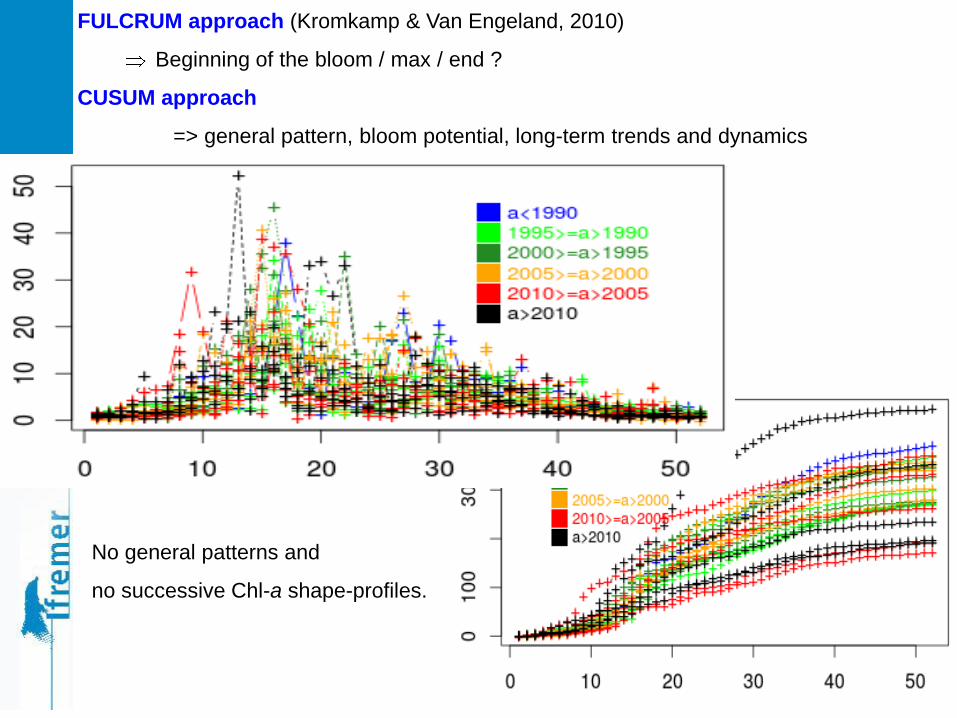
FULCRUM approach (Kromkamp & Van Engeland, 2010)
Beginning of the bloom / max / end ?
CUSUM approach
=> general pattern, bloom potential, long-term trends and dynamics
No general patterns and
no successive Chl-a shape-profiles.
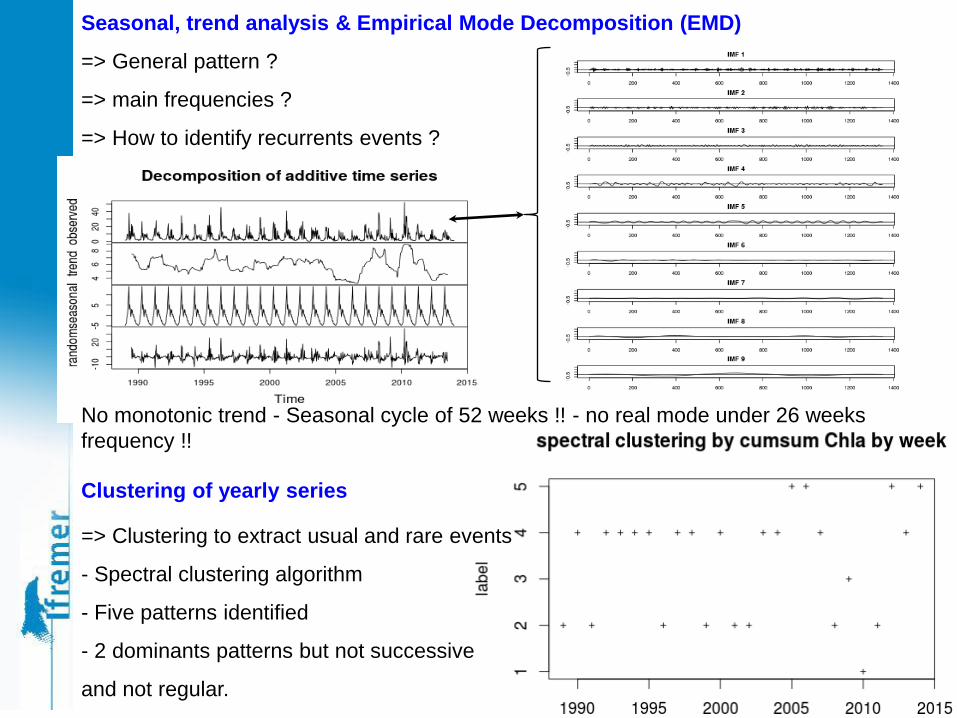
Seasonal, trend analysis & Empirical Mode Decomposition (EMD)
=> General pattern ?
=> main frequencies ?
=> How to identify recurrents events ?
No monotonic trend - Seasonal cycle of 52 weeks !! - no real mode under 26 weeks
frequency !!
Clustering of yearly series
=> Clustering to extract usual and rare events
- Spectral clustering algorithm
- Five patterns identified
- 2 dominants patterns but not successive
and not regular.
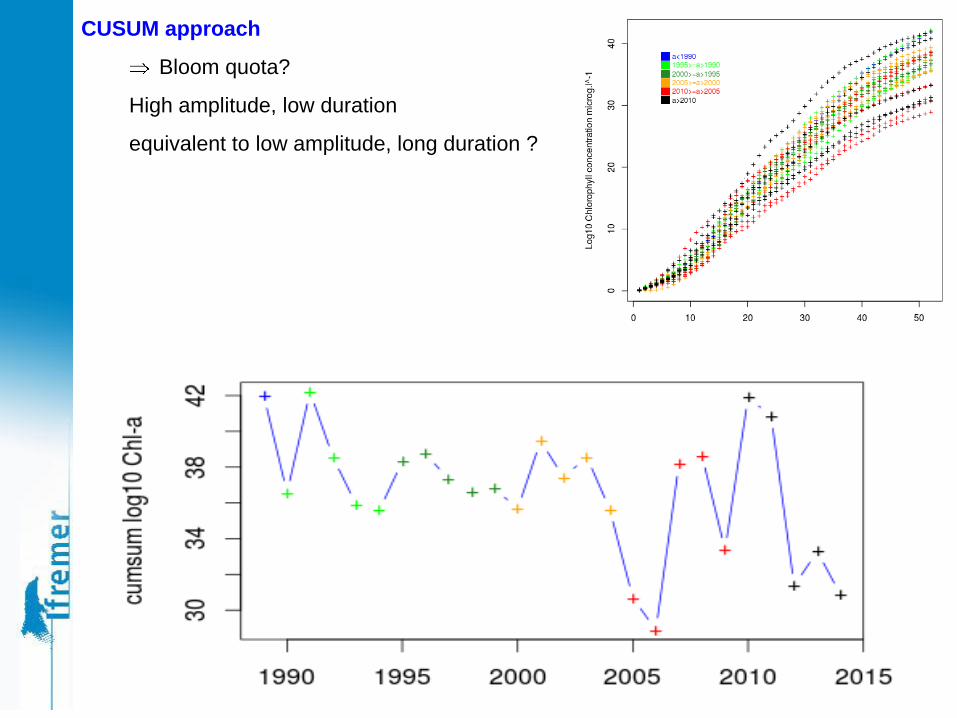
CUSUM approach
Bloom quota?
High amplitude, low duration
equivalent to low amplitude, long duration ?
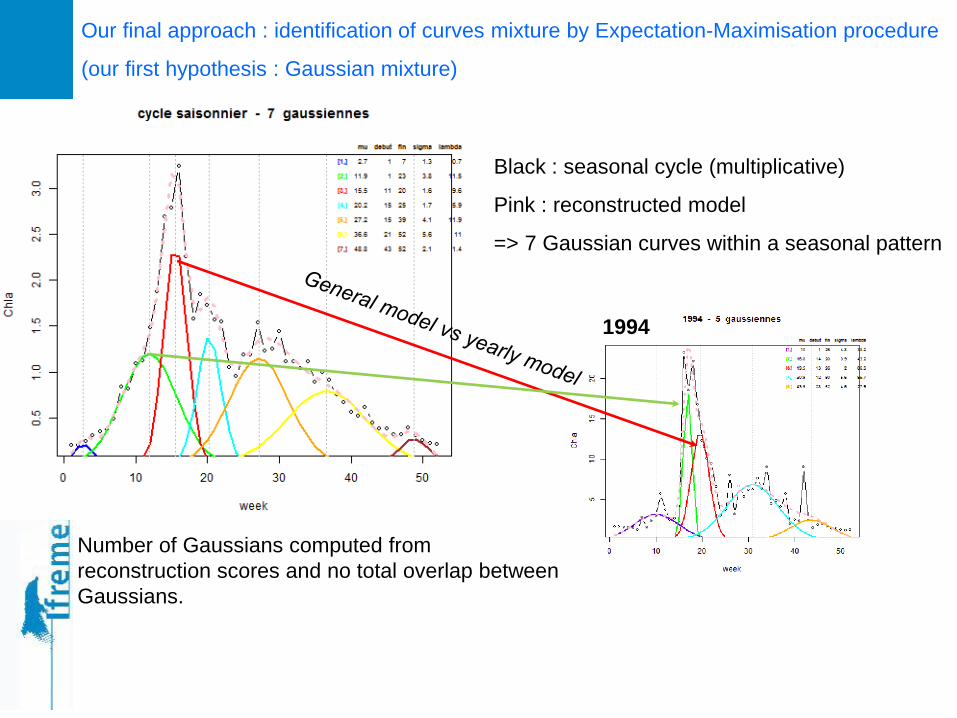
Our final approach : identification of curves mixture by Expectation-Maximisation procedure
(our first hypothesis : Gaussian mixture)
Black : seasonal cycle (multiplicative)
Pink : reconstructed model
=> 7 Gaussian curves within a seasonal pattern
Number of Gaussians computed from
reconstruction scores and no total overlap between
Gaussians.
1994
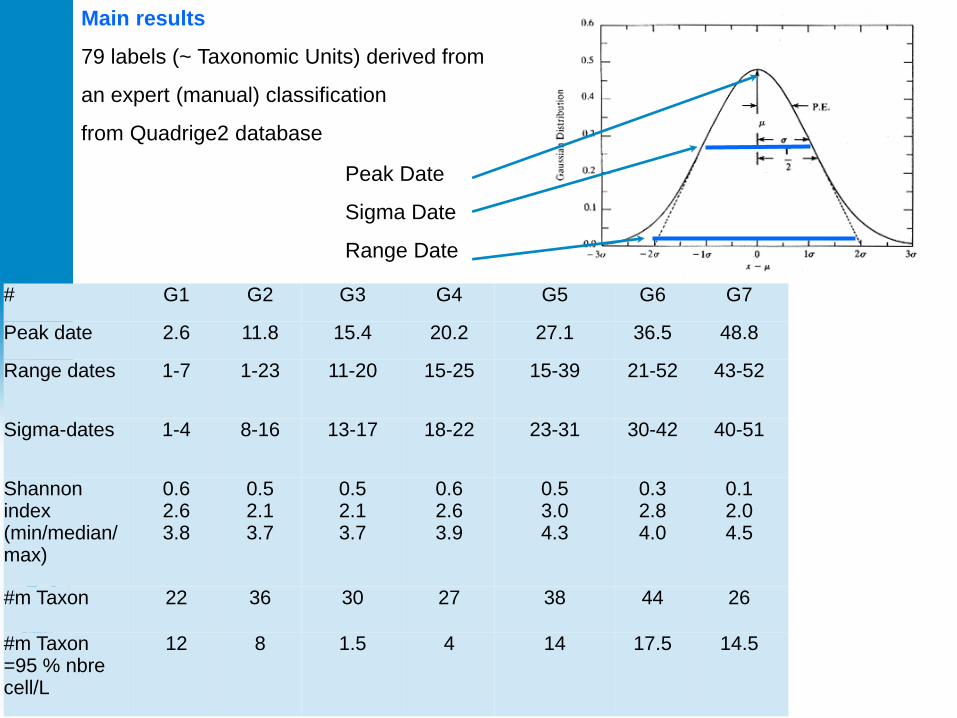
Main results
79 labels (~ Taxonomic Units) derived from
an expert (manual) classification
from Quadrige2 database
# G1 G2 G3 G4 G5 G6 G7
Peak date 2.6 11.8 15.4 20.2 27.1 36.5 48.8
Range dates 1-7 1-23 11-20 15-25 15-39 21-52 43-52
Sigma-dates 1-4 8-16 13-17 18-22 23-31 30-42 40-51
Shannon index(min/median/max)
0.62.63.8
0.52.13.7
0.52.13.7
0.62.63.9
0.53.04.3
0.32.84.0
0.12.04.5
#m Taxon 22 36 30 27 38 44 26
#m Taxon =95 % nbre cell/L
12 8 1.5 4 14 17.5 14.5
Peak Date
Sigma Date
Range Date
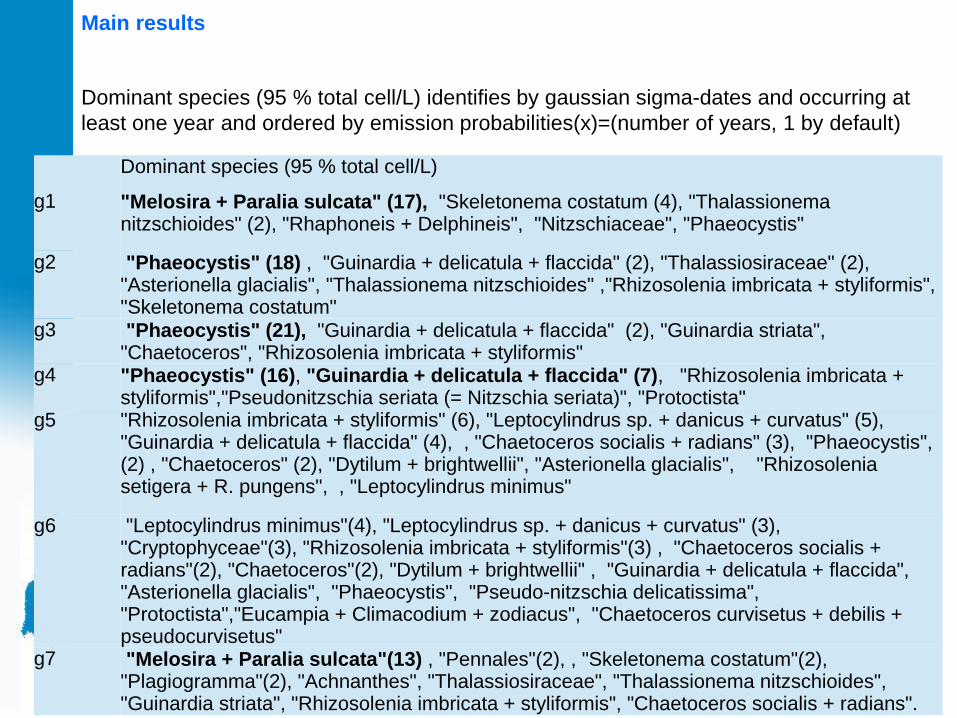
Dominant species (95 % total cell/L) identifies by gaussian sigma-dates and occurring at
least one year and ordered by emission probabilities(x)=(number of years, 1 by default)
Dominant species (95 % total cell/L)
g1 "Melosira + Paralia sulcata" (17), "Skeletonema costatum (4), "Thalassionema nitzschioides" (2), "Rhaphoneis + Delphineis", "Nitzschiaceae", "Phaeocystis"
g2 "Phaeocystis" (18) , "Guinardia + delicatula + flaccida" (2), "Thalassiosiraceae" (2), "Asterionella glacialis", "Thalassionema nitzschioides" ,"Rhizosolenia imbricata + styliformis", "Skeletonema costatum"
g3 "Phaeocystis" (21), "Guinardia + delicatula + flaccida" (2), "Guinardia striata", "Chaetoceros", "Rhizosolenia imbricata + styliformis"
g4 "Phaeocystis" (16), "Guinardia + delicatula + flaccida" (7), "Rhizosolenia imbricata + styliformis","Pseudonitzschia seriata (= Nitzschia seriata)", "Protoctista"
g5 "Rhizosolenia imbricata + styliformis" (6), "Leptocylindrus sp. + danicus + curvatus" (5), "Guinardia + delicatula + flaccida" (4), , "Chaetoceros socialis + radians" (3), "Phaeocystis",(2) , "Chaetoceros" (2), "Dytilum + brightwellii", "Asterionella glacialis", "Rhizosolenia setigera + R. pungens", , "Leptocylindrus minimus"
g6 "Leptocylindrus minimus"(4), "Leptocylindrus sp. + danicus + curvatus" (3), "Cryptophyceae"(3), "Rhizosolenia imbricata + styliformis"(3) , "Chaetoceros socialis + radians"(2), "Chaetoceros"(2), "Dytilum + brightwellii" , "Guinardia + delicatula + flaccida", "Asterionella glacialis", "Phaeocystis", "Pseudo-nitzschia delicatissima", "Protoctista","Eucampia + Climacodium + zodiacus", "Chaetoceros curvisetus + debilis + pseudocurvisetus"
g7 "Melosira + Paralia sulcata"(13) , "Pennales"(2), , "Skeletonema costatum"(2), "Plagiogramma"(2), "Achnanthes", "Thalassiosiraceae", "Thalassionema nitzschioides", "Guinardia striata", "Rhizosolenia imbricata + styliformis", "Chaetoceros socialis + radians".
Main results
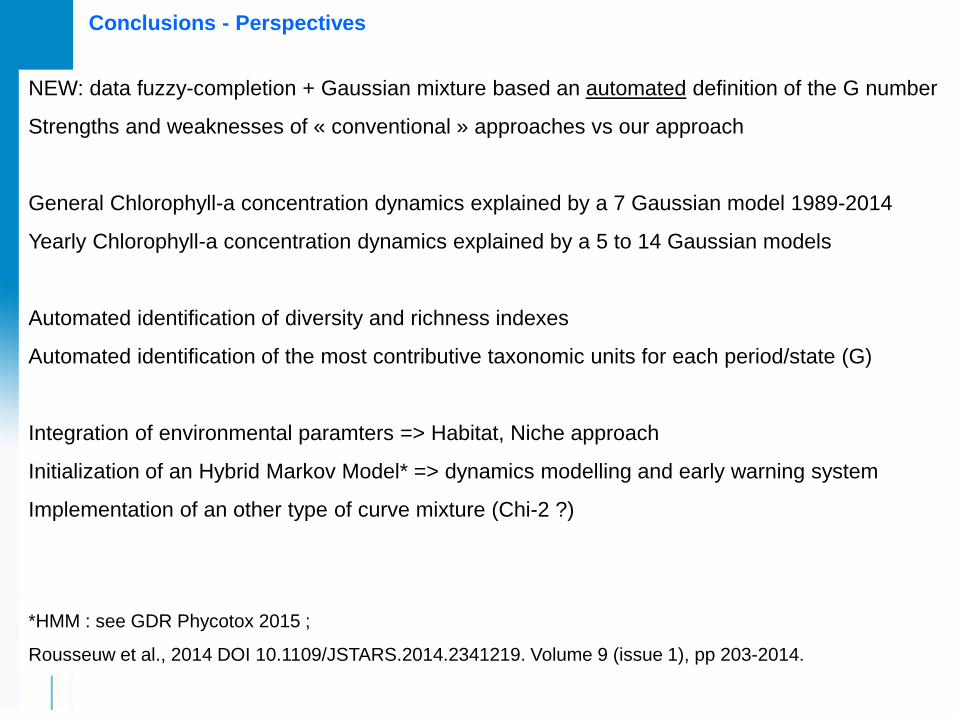
Conclusions - Perspectives
NEW: data fuzzy-completion + Gaussian mixture based an automated definition of the G number
Strengths and weaknesses of « conventional » approaches vs our approach
General Chlorophyll-a concentration dynamics explained by a 7 Gaussian model 1989-2014
Yearly Chlorophyll-a concentration dynamics explained by a 5 to 14 Gaussian models
Automated identification of diversity and richness indexes
Automated identification of the most contributive taxonomic units for each period/state (G)
Integration of environmental paramters => Habitat, Niche approach
Initialization of an Hybrid Markov Model* => dynamics modelling and early warning system
Implementation of an other type of curve mixture (Chi-2 ?)
*HMM : see GDR Phycotox 2015 ;
Rousseuw et al., 2014 DOI 10.1109/JSTARS.2014.2341219. Volume 9 (issue 1), pp 203-2014.
12
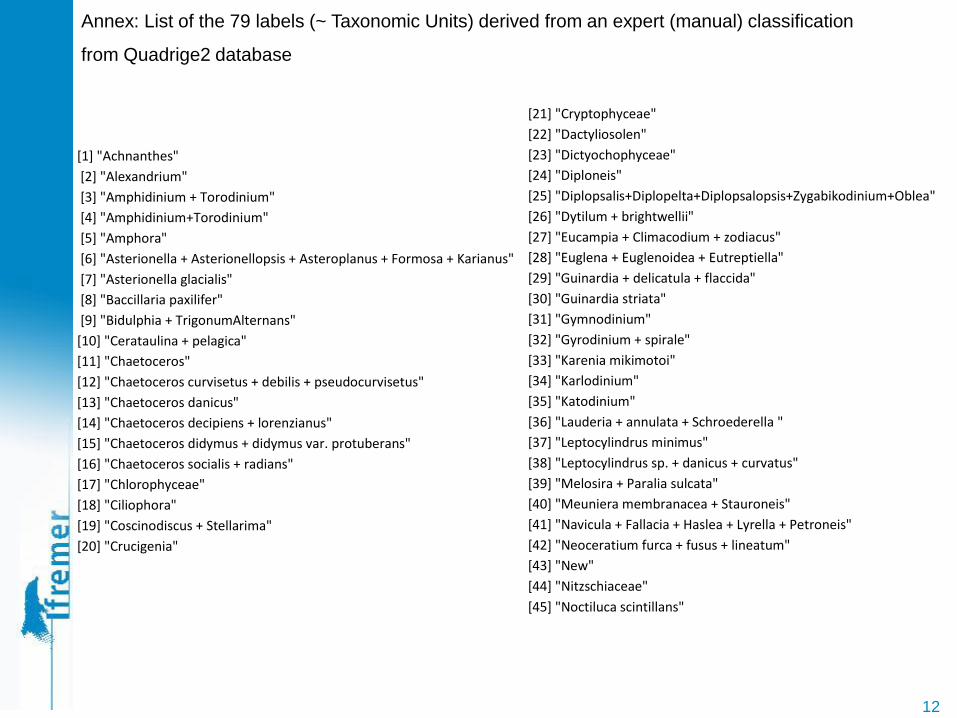
[1] "Achnanthes"
[2] "Alexandrium"
[3] "Amphidinium + Torodinium"
[4] "Amphidinium+Torodinium"
[5] "Amphora"
[6] "Asterionella + Asterionellopsis + Asteroplanus + Formosa + Karianus"
[7] "Asterionella glacialis"
[8] "Baccillaria paxilifer"
[9] "Bidulphia + TrigonumAlternans"
[10] "Cerataulina + pelagica"
[11] "Chaetoceros"
[12] "Chaetoceros curvisetus + debilis + pseudocurvisetus"
[13] "Chaetoceros danicus"
[14] "Chaetoceros decipiens + lorenzianus"
[15] "Chaetoceros didymus + didymus var. protuberans"
[16] "Chaetoceros socialis + radians"
[17] "Chlorophyceae"
[18] "Ciliophora"
[19] "Coscinodiscus + Stellarima"
[20] "Crucigenia"
[21] "Cryptophyceae"
[22] "Dactyliosolen"
[23] "Dictyochophyceae"
[24] "Diploneis"
[25] "Diplopsalis+Diplopelta+Diplopsalopsis+Zygabikodinium+Oblea"
[26] "Dytilum + brightwellii"
[27] "Eucampia + Climacodium + zodiacus"
[28] "Euglena + Euglenoidea + Eutreptiella"
[29] "Guinardia + delicatula + flaccida"
[30] "Guinardia striata"
[31] "Gymnodinium"
[32] "Gyrodinium + spirale"
[33] "Karenia mikimotoi"
[34] "Karlodinium"
[35] "Katodinium"
[36] "Lauderia + annulata + Schroederella "
[37] "Leptocylindrus minimus"
[38] "Leptocylindrus sp. + danicus + curvatus"
[39] "Melosira + Paralia sulcata"
[40] "Meuniera membranacea + Stauroneis"
[41] "Navicula + Fallacia + Haslea + Lyrella + Petroneis"
[42] "Neoceratium furca + fusus + lineatum"
[43] "New"
[44] "Nitzschiaceae"
[45] "Noctiluca scintillans"
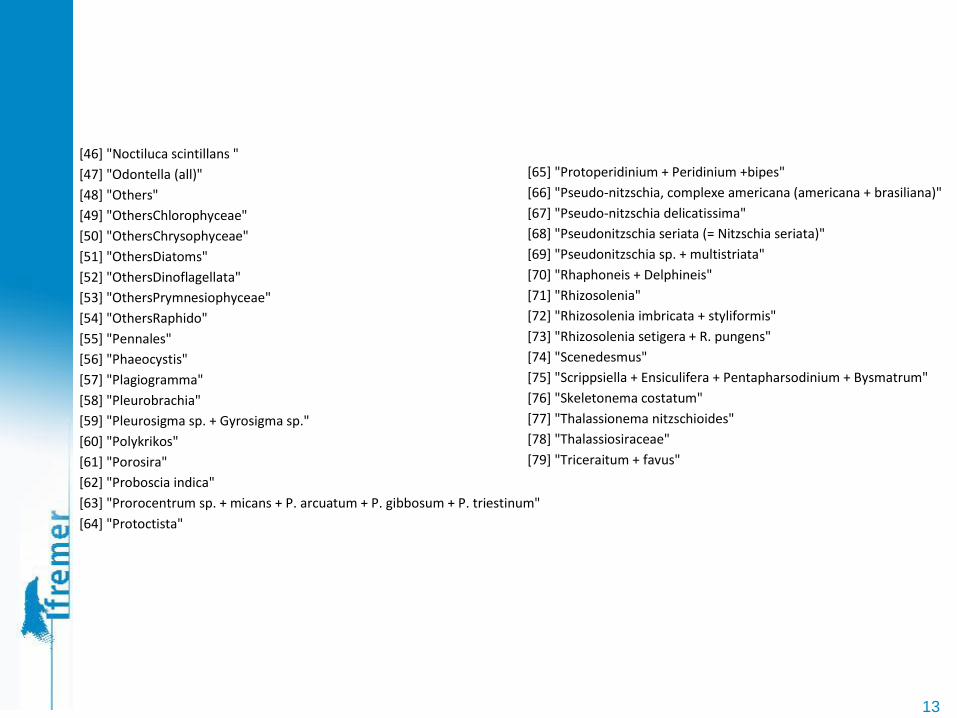
Annex: List of the 79 labels (~ Taxonomic Units) derived from an expert (manual) classification
from Quadrige2 database
13
[46] "Noctiluca scintillans "
[47] "Odontella (all)"
[48] "Others"
[49] "OthersChlorophyceae"
[50] "OthersChrysophyceae"
[51] "OthersDiatoms"
[52] "OthersDinoflagellata"
[53] "OthersPrymnesiophyceae"
[54] "OthersRaphido"
[55] "Pennales"
[56] "Phaeocystis"
[57] "Plagiogramma"
[58] "Pleurobrachia"
[59] "Pleurosigma sp. + Gyrosigma sp."
[60] "Polykrikos"
[61] "Porosira"
[62] "Proboscia indica"
[63] "Prorocentrum sp. + micans + P. arcuatum + P. gibbosum + P. triestinum"
[64] "Protoctista"
[65] "Protoperidinium + Peridinium +bipes"
[66] "Pseudo-nitzschia, complexe americana (americana + brasiliana)"
[67] "Pseudo-nitzschia delicatissima"
[68] "Pseudonitzschia seriata (= Nitzschia seriata)"
[69] "Pseudonitzschia sp. + multistriata"
[70] "Rhaphoneis + Delphineis"
[71] "Rhizosolenia"
[72] "Rhizosolenia imbricata + styliformis"
[73] "Rhizosolenia setigera + R. pungens"
[74] "Scenedesmus"
[75] "Scrippsiella + Ensiculifera + Pentapharsodinium + Bysmatrum"
[76] "Skeletonema costatum"
[77] "Thalassionema nitzschioides"
[78] "Thalassiosiraceae"
[79] "Triceraitum + favus"