analysis of passenger vehicle driver restraint use in
TRANSCRIPT
DOT HS 811 829 September 2013
Analysis of Passenger Vehicle Driver Restraint Use in Fatal Crashes

DISCLAIMER
This publication is distributed by the U.S. Department of Transportation, National Highway
and conclusions expressed in this publication are those of the authors and not necessarily those
The United States Government assumes no liability for its contents or use thereof. If trade names,
to the object of the publication and should not be construed as an endorsement. The United States Government does not endorse products or manufacturers.
Suggested APA Format Citation:
Pickrell, T. M. (2013, September). Analysis of passenger vehicle driver restraint use in fatal crashes. (Report No. DOT HS 811 829). Washington, DC: National Highway Traffic Safety Administration.

i
Technical Report Documentation Page
1. Report No. DOT HS 811 829
2. Government Accession No.
3. Recipient's Catalog No.
4. Title and Subtitle Analysis of Passenger Vehicle Driver Restraint Use in Fatal Crashes
5. Report Date September 2013 6. Performing Organization Code NVS-421
7. Author(s) Timothy M. Pickrell
8. Performing Organization Report No.
9. Performing Organization Name and Address Mathematical Analysis Division, National Center for Statistics and Analysis National Highway Traffic Safety Administration U.S. Department of Transportation NVS-421, 1200 New Jersey Avenue SE. Washington, DC 20590
10. Work Unit No. (TRAIS) 11. Contract or Grant No.
12. Sponsoring Agency Name and Address Mathematical Analysis Division, National Center for Statistics and Analysis National Highway Traffic Safety Administration U.S. Department of Transportation NVS-421, 1200 New Jersey Avenue SE. Washington, DC 20590
13. Type of Report and Period Covered NHTSA Technical Report 14. Sponsoring Agency Code
15. Supplementary Notes Abstract This report examines the relationship between passenger vehicle driver seat belt use status (restrained or unrestrained) and the following factors: blood alcohol concentration (BAC), age group, previous driving while intoxicated (DWI) conviction, driver license status, estimated vehicle speed, number of vehicle occupants, driver sex, day of week, season, geographic region, State seat belt law status, time of day and rural/urban status. Using NHTSA’s Fatality Analysis Reporting System (FARS) data from the years 2001 to 2010, the report estimates the relationship between driver seat belt use status and the above-listed factors with a logistic regression model. The factors most strongly associated with unrestrained driving are high BAC (greater than .15 g/dL), speeding, and the driver’s license status. High-BAC drivers’ odds of being unbelted were four times greater than drivers who had no alcohol. Speeding drivers had odds of unrestrained driving twice those of non-speeding drivers. Drivers with invalid licenses odds of unrestrained driving were 1.6 times those of drivers with valid licenses.
17. Key Words Restraint use, alcohol-impaired driving, BAC, night vs. day, invalid driver license, speeding, logistic regression
18. Distribution Statement
Document is available to the public from the National Technical Information Service www.ntis.gov
19. Security Classif. (of this report) Unclassified
20. Security Classif. (of this page) Unclassified
21. No. of Pages 12
22. Price
Form DOT F 1700.7 (8-72) Reproduction of completed page authorized

ii
TABLE OF CONTENTS
I. Executive Summary .......................................................................................................1
II. Introduction ....................................................................................................................1
III. Data and Methodology ...................................................................................................2
IV. Results ............................................................................................................................3
V. Limitations .....................................................................................................................6
VI. Conclusion .....................................................................................................................7
LIST OF FIGURES AND TABLES Figure 1: Passenger Vehicle Occupant Fatalities in Crashes by
Known Restraint Use, 2001-2010 ....................................................................................1
Table 1: Odds Ratio Estimates .........................................................................................................4
Table 2: Logistic Regression Analysis Parameter Estimates ...........................................................6

1
EXECUTIVE SUMMARY This report examines factors associated with passenger vehicle driver restraint use status in fatal crashes. Given that seat belt use is an important countermeasure against injury or death in vehicle crashes, the National Highway Traffic Safety Administration is interested in understanding factors associated with restraint use. This analysis models the relationship between passenger vehicle driver restraint use in fatal crashes and the following crash-related factors reported to NHTSA’s Fatality Analysis Reporting System (FARS) 2001-2010: driver blood alcohol concentration (BAC), age group, previous DWI conviction, driver license status, estimated vehicle speed, number of vehicle occupants, driver sex, day of week, season, geographic region, time of day, and rural/urban status. The factors most strongly associated with unrestrained driving are: high BAC (greater than .15 g/dL), speeding, and the driver’s license status. High-BAC drivers’ odds of being unbelted were four times greater than drivers who had no alcohol. Speeding drivers’ odds of unrestrained driving were twice those of restrained drivers. Drivers with invalid licenses had odds of unrestrained driving 1.6 times those of drivers with valid licenses. INTRODUCTION During the period 2001 to 2010, known passenger vehicle occupant restraint use in fatal crashes increased from 40 percent in 2001 to 48 percent in 2010. Passenger vehicles include cars, pickup trucks, vans and SUVs. Known unrestrained occupant fatalities decreased from 59 percent in 2001 to 51 percent in 2010.
Source: NCSA, NHTSA, FARS 2001-2010 Final NHTSA research has found that seat belts reduce the risk of fatal injury to front-seat passenger vehicle occupants by 45 percent and the risk of moderate-to-critical injury by 50 percent. Seat belts are also effective at preventing total ejections, as only 1 percent of restrained occupants were totally ejected in fatal crashes. Moreover, seat belts saved an estimated 12,546 lives in 2010 (among occupants passenger vehicle occupants age 5 and older).1 Since seat belt use is clearly an important traffic safety countermeasure, this report examines factors associated with seat belt use in fatal crashes in order to increase usage and hopefully prevent or minimize future injuries or fatalities. In order to understand the pattern of passenger vehicle occupant seat belt use more fully, this report explores the relationship between driver seat belt use in fatal crashes with various associated factors. In
1 National Highway Traffic Safety Administration. (2012, May). Traffic Safety Facts 2010 – Occupant Protection. (Report No. DOT HS 811 619). Washington, DC: Author.
37.00
42.00
47.00
52.00
57.00
62.00
2000 2001 2002 2003 2004 2005 2006 2007 2008 2009 2010 2011
Figure 1: Passenger Vehicle Occupant Fatalities in Crashes By Known Restraint Use, 2001-2010
% knownrestrained
% knownunrestrained
2
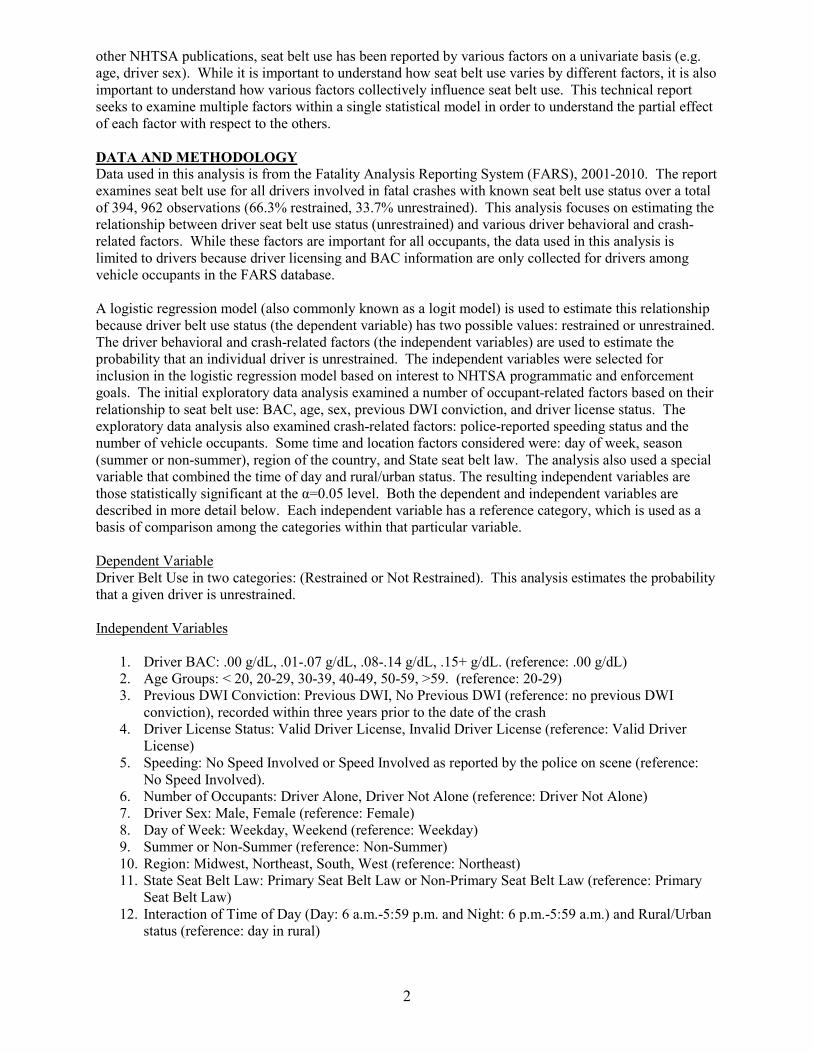
other NHTSA publications, seat belt use has been reported by various factors on a univariate basis (e.g. age, driver sex). While it is important to understand how seat belt use varies by different factors, it is also important to understand how various factors collectively influence seat belt use. This technical report seeks to examine multiple factors within a single statistical model in order to understand the partial effect of each factor with respect to the others. DATA AND METHODOLOGY Data used in this analysis is from the Fatality Analysis Reporting System (FARS), 2001-2010. The report examines seat belt use for all drivers involved in fatal crashes with known seat belt use status over a total of 394, 962 observations (66.3% restrained, 33.7% unrestrained). This analysis focuses on estimating the relationship between driver seat belt use status (unrestrained) and various driver behavioral and crash-related factors. While these factors are important for all occupants, the data used in this analysis is limited to drivers because driver licensing and BAC information are only collected for drivers among vehicle occupants in the FARS database. A logistic regression model (also commonly known as a logit model) is used to estimate this relationship because driver belt use status (the dependent variable) has two possible values: restrained or unrestrained. The driver behavioral and crash-related factors (the independent variables) are used to estimate the probability that an individual driver is unrestrained. The independent variables were selected for inclusion in the logistic regression model based on interest to NHTSA programmatic and enforcement goals. The initial exploratory data analysis examined a number of occupant-related factors based on their relationship to seat belt use: BAC, age, sex, previous DWI conviction, and driver license status. The exploratory data analysis also examined crash-related factors: police-reported speeding status and the number of vehicle occupants. Some time and location factors considered were: day of week, season (summer or non-summer), region of the country, and State seat belt law. The analysis also used a special variable that combined the time of day and rural/urban status. The resulting independent variables are those statistically significant at the α=0.05 level. Both the dependent and independent variables are described in more detail below. Each independent variable has a reference category, which is used as a basis of comparison among the categories within that particular variable. Dependent Variable Driver Belt Use in two categories: (Restrained or Not Restrained). This analysis estimates the probability that a given driver is unrestrained. Independent Variables
1. Driver BAC: .00 g/dL, .01-.07 g/dL, .08-.14 g/dL, .15+ g/dL. (reference: .00 g/dL) 2. Age Groups: < 20, 20-29, 30-39, 40-49, 50-59, >59. (reference: 20-29) 3. Previous DWI Conviction: Previous DWI, No Previous DWI (reference: no previous DWI
conviction), recorded within three years prior to the date of the crash 4. Driver License Status: Valid Driver License, Invalid Driver License (reference: Valid Driver
License) 5. Speeding: No Speed Involved or Speed Involved as reported by the police on scene (reference:
No Speed Involved). 6. Number of Occupants: Driver Alone, Driver Not Alone (reference: Driver Not Alone) 7. Driver Sex: Male, Female (reference: Female) 8. Day of Week: Weekday, Weekend (reference: Weekday) 9. Summer or Non-Summer (reference: Non-Summer) 10. Region: Midwest, Northeast, South, West (reference: Northeast) 11. State Seat Belt Law: Primary Seat Belt Law or Non-Primary Seat Belt Law (reference: Primary
Seat Belt Law) 12. Interaction of Time of Day (Day: 6 a.m.-5:59 p.m. and Night: 6 p.m.-5:59 a.m.) and Rural/Urban
status (reference: day in rural)

3
Estimates of alcohol-impaired driving used in the logistic regression model were generated using BAC values both directly reported to FARS and BAC values imputed for unknown values. It is important to note that the term alcohol-impaired does not indicate that a particular crash or fatality was caused by alcohol impairment, merely that the driver was impaired by alcohol at the time of the crash. Also, given that FARS has both directly reported and imputed values for BAC, this report employed a special technique to derive the estimated logistic regression coefficients. The combined estimated coefficients were derived using the SAS software procedure MIanalyze, which averages the estimates across the number of imputations. Unreported BAC values in the FARS database have 10 imputed values and thus SAS procedure MIanalyze performed 10 separate logistic regression analyses and then averaged the respective coefficients into a single final model, representative of the array of imputed values. RESULTS This section presents the logistic regression model used to estimate the relationship between driver seat belt use and the various factors already described. To illustrate the relationship between driver belt use status and the independent variables, the analysis uses the concept of odds ratios. The odds of a particular driver being unrestrained is defined as:
Pr / 1 Pr Similarly, the odds of a driver being restrained is defined as:
Pr / 1 Pr The odds ratio, denoted OR, is defined as the ratio of the odds for an unrestrained driver to the odds for a restrained driver, as follows:
Pr / 1 Pr
Pr / 1 Pr
Table 1 (below) displays the odds ratios for each level of each independent variable. The odds ratios displayed are the difference in odds relative to the reference category for each independent variable that drivers in those categories are unbelted. The interpretation of these odds ratios is presented for each model variable in the next paragraph. The levels of the categorical variables used in the analysis and their reference categories (in parentheses) are listed in Table 1. The independent variables were all significant at the α=0.05 level.

4
The odds ratios in Table 1 show the odds that a driver involved in a fatal crash in a particular category was not restrained divided by the odds that a driver in the same category was restrained, holding all other independent variables constant. For example, the odds of a driver with a previous DWI being unrestrained are 1.47 times greater than the odds of a driver without a previous DWI, holding other factors constant. Another way to state this result is that, on average, the odds of a driver with a previous DWI being unrestrained are 47 percent greater (derived from the odds ratios as follows: 1.47-1.0= .47, translated to a percentage, 47%) than a driver without a previous DWI. The results of the logistic regression analysis are presented by variable below: BAC Group The odds ratios for the BAC group variable show that the odds of being unrestrained increase as BAC increases. For example, the odds of drivers with BACs in the .01 g/dL to .07 g/dL range being unbelted are 2.14 times greater than the odds of drivers with BACs of .0o g/dL being unbelted. Furthermore, the odds of drivers with BACs in excess of .15 g/dL being unbelted were more than 4 times greater than the odds of drivers with BACs of .00 g/dL being unbelted. Age Group Older drivers generally have lower odds for being unbelted, compared to younger drivers. For example, the odds of drivers in the 50-59 age group of being unbelted are .80 times less than the odds of drivers in the 20-29 age group.
Parameter OR OR (L95)
OR (U95)
BAC group: .01-.07 vs. .00 2.14 2.03 2.25BAC group: .08-.14 vs. .00 2.74 2.62 2.86BAC group: > .15 vs. .00 4.07 3.96 4.18Age group: <20 vs. 20-29 1.15 1.12 1.18Age group: 30-39 vs. 20-29 0.90 0.88 0.92Age group: 40-49 vs. 20-29 0.83 0.81 0.85Age group: 50-59 vs. 20-29 0.80 0.78 0.83Age group: >59 vs. 20-29 0.89 0.87 0.92DWI Status: Previous DWI vs. No Previous DWI 1.47 1.41 1.54Driver License Status: Invalid Driver License vs. Valid Driver License 1.64 1.60 1.68Speeding: Speed Involved vs. No Speed Involved 2.18 2.14 2.22Number of Occupants: Driver Not Alone vs. Driver Alone 1.36 1.34 1.38Driver Sex: Male vs. Female 1.41 1.38 1.43Day of Week: Weekday vs. Weekend 1.05 1.04 1.07Season: Non-Summer vs. Summer 1.06 1.04 1.08Geographic Region: Midwest vs. Northeast 1.13 1.10 1.17Geographic Region: South vs. Northeast 1.09 1.07 1.12Geographic Region: West vs. Northeast 0.55 0.53 0.56Seat Belt Law Status: Non-Primary Belt Law vs. Primary Belt Law 1.48 1.46 1.51Time/Urbanicity: Day/Urban vs. Day/Rural 0.64 0.63 0.65Time/Urbanicity: Night/Rural vs. Day/Rural 1.16 1.13 1.18Time/Urbanicity: Night/Urban vs. Day/Rural 0.64 0.63 0.66
Table 1: Odds Ratio Estimates
5
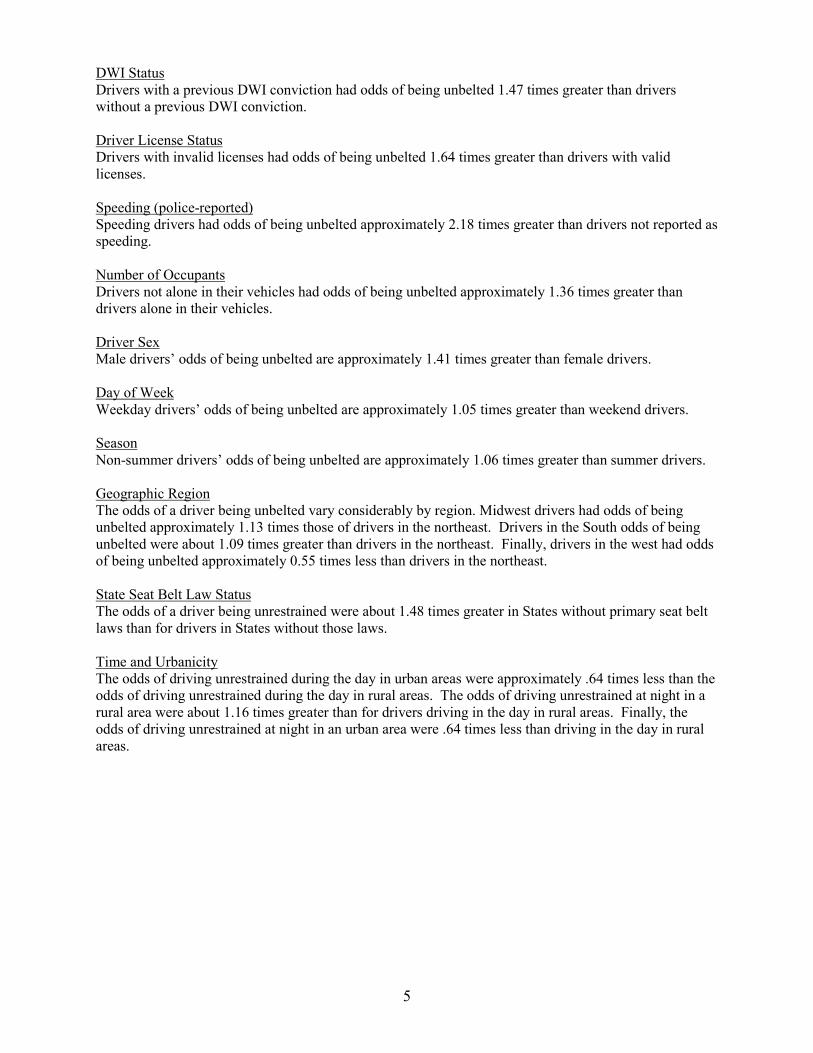
DWI Status Drivers with a previous DWI conviction had odds of being unbelted 1.47 times greater than drivers without a previous DWI conviction. Driver License Status Drivers with invalid licenses had odds of being unbelted 1.64 times greater than drivers with valid licenses. Speeding (police-reported) Speeding drivers had odds of being unbelted approximately 2.18 times greater than drivers not reported as speeding. Number of Occupants Drivers not alone in their vehicles had odds of being unbelted approximately 1.36 times greater than drivers alone in their vehicles. Driver Sex Male drivers’ odds of being unbelted are approximately 1.41 times greater than female drivers. Day of Week Weekday drivers’ odds of being unbelted are approximately 1.05 times greater than weekend drivers. Season Non-summer drivers’ odds of being unbelted are approximately 1.06 times greater than summer drivers. Geographic Region The odds of a driver being unbelted vary considerably by region. Midwest drivers had odds of being unbelted approximately 1.13 times those of drivers in the northeast. Drivers in the South odds of being unbelted were about 1.09 times greater than drivers in the northeast. Finally, drivers in the west had odds of being unbelted approximately 0.55 times less than drivers in the northeast. State Seat Belt Law Status The odds of a driver being unrestrained were about 1.48 times greater in States without primary seat belt laws than for drivers in States without those laws. Time and Urbanicity The odds of driving unrestrained during the day in urban areas were approximately .64 times less than the odds of driving unrestrained during the day in rural areas. The odds of driving unrestrained at night in a rural area were about 1.16 times greater than for drivers driving in the day in rural areas. Finally, the odds of driving unrestrained at night in an urban area were .64 times less than driving in the day in rural areas.

6
Table 2 shows the parameter estimates from the logistic regression analysis. These estimates demonstrate that the factors that contribute most to unrestrained driving are: high driver BAC (.08 or greater), speeding, and driver license status.
Table 2: Logistic Regression Coefficients
Parameter est. s.e. t-stat. p-value
Intercept -1.74 0.02 -90.46 <.0001BAC group: .01-.07 vs. .00 0.76 0.03 28.72 <.0001BAC group: .08-.14 vs. .00 1.01 0.02 45.20 <.0001BAC group: > .15 vs. .00 1.40 0.01 105.27 <.0001Age group: <20 vs. 20-29 0.14 0.01 10.54 <.0001Age group: 30-39 vs. 20-29 -0.11 0.01 -8.88 <.0001Age group: 40-49 vs. 20-29 -0.18 0.01 -14.91 <.0001Age group: 50-59 vs. 20-29 -0.22 0.01 -15.44 <.0001Age group: >59 vs. 20-29 -0.11 0.01 -9.10 <.0001DWI Status: Previous DWI vs. No Previous DWI 0.39 0.02 17.57 <.0001Driver License Status: Invalid Driver License vs. Valid Driver License 0.50 0.01 41.24 <.0001Speeding: Speed Involved vs. No Speed Involved 0.78 0.01 82.35 <.0001Number of Occupants: Driver Not Alone vs. Driver Alone 0.31 0.01 39.88 <.0001Driver Sex: Male vs. Female 0.34 0.01 40.34 <.0001Day of Week: Weekday vs. Weekend 0.05 0.01 6.50 <.0001Season: Non-Summer vs. Summer 0.06 0.01 6.64 <.0001Geographic Region: Midwest vs. Northeast 0.13 0.01 8.99 <.0001Geographic Region: South vs. Northeast 0.09 0.01 7.15 <.0001Geographic Region: West vs. Northeast -0.60 0.01 -41.78 <.0001Seat Belt Law Status: Non-Primary Belt Law vs. Primary Belt Law 0.39 0.01 49.19 <.0001Time/Urbanicity: Day/Urban vs. Day/Rural -0.45 0.01 -40.77 <.0001Time/Urbanicity: Night/Rural vs. Day/Rural 0.14 0.01 13.52 <.0001Time/Urbanicity: Night/Urban vs. Day/Rural -0.44 0.01 -39.06 <.0001 An important note about the parameter estimates is that they provide the basis for the odds ratios presented earlier. The relationship between the odds ratios and the parameter estimates is described by the following equation:
Where refers to a specific parameter estimate. A specific example, showing the derivation of the odds ratio for driver sex (male vs. female) follows:
. 1.4061 Thus, when the parameter estimate for driver sex (male vs. female) is exponentiated it equals the odds ratio for that particular category, 1.4061. LIMITATIONS The FARS data are a census of fatal crashes collected from State-level police accident report files, which may vary by State for certain variables. For those drivers not killed in fatal crashes, there may be some self-reporting bias for their restraint use status.
7
CONCLUSION The logistic regression modeled the relationship between driver seat belt use and the following factors: BAC, age group, previous DWI conviction, driver license status, estimated vehicle speed, number of vehicle occupants, driver gender, day of week, season, region of the country, and an interaction between time of day and rural/urban. Each of these factors was significant at the α=0.05 level. The parameter estimates and associated odds ratios demonstrated that the following factors were most predictive of driver restraint use: high driver BAC values, speeding, and the driver’s license status. These results are important to traffic safety programs and enforcement efforts to encourage seat belt use.

DOT HS 811 829 September 2013
9745-091713-v3a