analysis of parallel program using performance tools · analysis of parallel program using...
TRANSCRIPT

Analysis of Parallel Program Using
Performance Tools
Haihang You
Meng-Shiou Wu
Kwai Wong
NICS Scientific Computing Group
OCLF/NICS Spring Cray XT5 Hex-Core Workshop
May 10-12, 2010

Why use Performance Tools
HPC systems are
expensive resources.
Solve bigger
problem.
Solve problem
quicker.

What to expect from
Performance Tools
Automatic instrumentation
Performance data
Timing, hardware counter, profiling, tracing
Performance report
Text, graphics

Profiling & Tracing
Profiling
Call tree / call graph
Number of invocations of a routine
Inclusive / Exclusive running time of a routine
HW counts
Memory and communication message size
Tracing
A log of time-stamped events
A log of MPI events, when & where
Huge amount of data.

Timing: Inclusive & Exclusive
Inclusive time
time_foo
Exclusive time
time_foo – time_foo1
– time_foo2
foo() time_foo
{
int i;
double q[1000000];
foo1(); time_foo1
for(i=0; i<1000000;i++)
q[i] = i*i;
foo2(); time_foo2
}

What’s PAPI?
Middleware to provide a consistent programming interface for the performance counter hardware found in most major micro-processors.
Countable events are defined in two ways: Platform-neutral preset events
Platform-dependent native events
Presets can be derived from multiple native events
All events are referenced by name and collected in EventSets for sampling
Events can be multiplexed if counters are limited
Statistical sampling implemented by: Hardware overflow if supported by the platform
Software overflow with timer driven sampling

Hardware Counters
Hardware performance counters available on most
modern microprocessors can provide insight into:
Whole program timing
Cache behaviors
Branch behaviors
Memory and resource access patterns
Pipeline stalls
Floating point efficiency
Instructions per cycle
Hardware counter information can be obtained with:
Subroutine or basic block resolution
Process or thread attribution

3rd Party and GUI Tools
PAPI HARDWARE SPECIFIC
LAYER
PAPI PORTABLE LAYER
Kernel Extension
Operating System
Perf Counter Hardware
Low Level
User APIHigh Level
User API
PAPI Counter InterfacesPAPI provides 3 interfaces to the
underlying counter hardware:
1.A Low Level API manages
hardware events in user
defined groups called
EventSets, and provides
access to advanced features.
2.A High Level API provides the
ability to start, stop and read
the counters for a specified
list of events.
3.Graphical and end-user tools
provide facile data collection and
visualization.
Level 2 CachePAPI_L2_DCH: Level 1 data cache hits
PAPI_L2_DCA: Level 1 data cache accesses
PAPI_L2_DCR: Level 1 data cache reads
PAPI_L2_DCW: Level 1 data cache writes
PAPI_L2_DCM: Level 1 data cache misses
PAPI_L2_ICH: Level 1 instruction cache hits
PAPI_L2_ICA: Level 1 instruction cache accesses
PAPI_L2_ICR: Level 1 instruction cache reads
PAPI_L2_ICW: Level 1 instruction cache writes
PAPI_L2_ICM: Level 1 instruction cache misses
PAPI_L2_TCH: Level 1 total cache hits
PAPI_L2_TCA: Level 1 total cache accesses
PAPI_L2_TCR: Level 1 total cache reads
PAPI_L2_TCW: Level 1 total cache writes
PAPI_L2_TCM: Level 1 cache misses
PAPI_L2_LDM: Level 1 load misses
PAPI_L2_STM: Level 1 store misses
Level 3 CachePAPI_L3_DCH: Level 1 data cache hits
PAPI_L3_DCA: Level 1 data cache accesses
PAPI_L3_DCR: Level 1 data cache reads
PAPI_L3_DCW: Level 1 data cache writes
PAPI_L3_DCM: Level 1 data cache misses
PAPI_L3_ICH: Level 1 instruction cache hits
PAPI_L3_ICA: Level 1 instruction cache accesses
PAPI_L3_ICR: Level 1 instruction cache reads
PAPI_L3_ICW: Level 1 instruction cache writes
PAPI_L3_ICM: Level 1 instruction cache misses
PAPI_L3_TCH: Level 1 total cache hits
PAPI_L3_TCA: Level 1 total cache accesses
PAPI_L3_TCR: Level 1 total cache reads
PAPI_L3_TCW: Level 1 total cache writes
PAPI_L3_TCM: Level 1 cache misses
PAPI_L3_LDM: Level 1 load misses
PAPI_L3_STM: Level 1 store misses
Cache Sharing
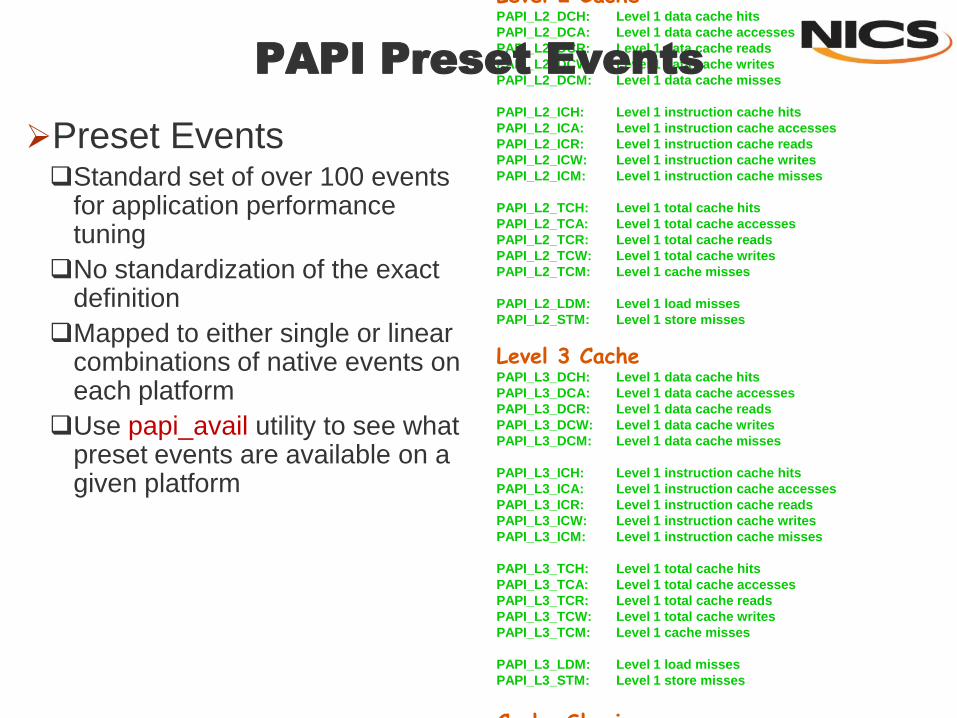
PAPI Preset Events
Preset EventsStandard set of over 100 events
for application performance tuning
No standardization of the exact definition
Mapped to either single or linear combinations of native events on each platform
Use papi_avail utility to see what preset events are available on a given platform
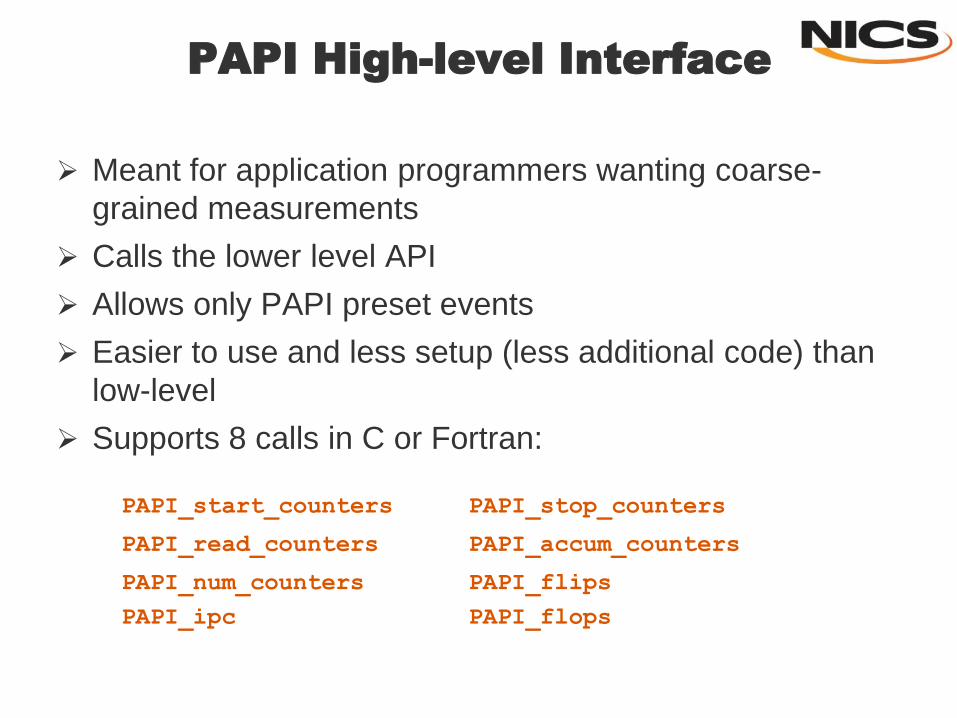
PAPI High-level Interface
Meant for application programmers wanting coarse-
grained measurements
Calls the lower level API
Allows only PAPI preset events
Easier to use and less setup (less additional code) than
low-level
Supports 8 calls in C or Fortran:
PAPI_start_counters PAPI_stop_counters
PAPI_read_counters PAPI_accum_counters
PAPI_num_counters
PAPI_ipc
PAPI_flips
PAPI_flops

PAPI High-level Example
#include "papi.h”
#define NUM_EVENTS 2
long_long values[NUM_EVENTS];
unsigned int
Events[NUM_EVENTS]={PAPI_TOT_INS,PAPI_TOT_CYC};
/* Start the counters */
PAPI_start_counters((int*)Events,NUM_EVENTS);
/* What we are monitoring… */
do_work();
/* Stop counters and store results in values */
retval = PAPI_stop_counters(values,NUM_EVENTS);

FPMPI – Fast Profiling library for MPI
FPMPI is a MPI profiling library. It intercepts MPI library calls via the MPI profiling interface.
CPU times
memory usage
performance counters
MPI calls statistics.
All profiling output is written by process rank 0. The default output file name is profile.txt but produce output only when program complete successfully
Use FPMPI on Kraken:
1. module load fpmpi_papi
2. relink with $FPMPI_LDFLAGS
3. export MPI_HWPC_COUNTERS=PAPI_FP_OPS
4. submit job and check for profile.txt

FPMPI Example – HPL
MPI_init called at: Tue Mar 23 23:20:12 2010
MPI_Finalize called at: Tue Mar 23 23:20:13 2010
Number of processors: 24
---- Process Stats min max avg imbl ranks
Wall Clock Time (sec) 1.725063 1.725897 1.725486 0% 21/13
User CPU Time (sec) 1.680105 1.752109 1.711773 4% 7/5
System CPU Time (sec) 0.112007 0.184011 0.147509 39% 5/7
I/O Read Time 0.000000 0.022161 0.000923 100% 1/0
I/O Write Time 0.000000 0.000131 0.000005 100% 1/0
MPI Comm Time (sec) 0.206312 0.279243 0.244430 26% 0/23
MPI Sync Time (sec) 0.030649 0.052847 0.040223 42% 12/1
MPI Calls 6794 7387 7070 8% 17/0
Total MPI Bytes 112652484 123302568 117878459 9% 21/14
Memory Usage (MB) 72.097656 72.339844 72.208659 0% 3/12
---- Performance Counters min max avg imbl ranks
OPS_ADD:OPS_ADD_PIPE_LO1.484772e+09 1.737513e+09 1.605853e+09 15% 21/14
OPS_MULTIPLY:OPS_MULTIP1.522243e+09 1.781054e+09 1.646220e+09 15% 21/14
OPS_STORE:OPS_STORE_PIP1.510631e+09 1.767395e+09 1.633547e+09 15% 21/14
PACKED_SSE_AND_SSE2 4.483819e+09 5.248205e+09 4.849793e+09 15% 21/14

FPMPI Example – HPL cont.
---- Barriers and Waits min max avg imbl ranks
MPI_Wait
Number of Calls 2130 2302 2215 7% 4/2
Communication Time 0.031781 0.058928 0.042610 46% 16/1
---- Message Routines min max avg imbl ranks
MPI_Send size 5-8B
Number of Calls 3 40 11 93% 7/0
Total Bytes 24 320 93 93% 7/0
Communication Time 0.000001 0.000090 0.000017 99% 23/8
MPI_Irecv size 65-128KB
Number of Calls 90 90 90 0% 0/0
Total Bytes 9216000 9230400 9218400 0% 0/3
Communication Time 0.004478 0.007619 0.005693 41% 18/15
---- Number Of Comm Partners min max avg imbl ranks
MPI_Send 4 7 5.8 43% 1/0
……………………………………….
======================================================================
T/V N NB P Q Time Gflops
---------------------------------------------------------------------------------------------------------------
WR00L2L2 6000 80 4 6 1.45 9.927e+01
---- Performance Counters min max avg imbl ranks
PAPI_FP_OPS 5.822562e+09 6.817514e+09 6.298254e+09 15% 21/14
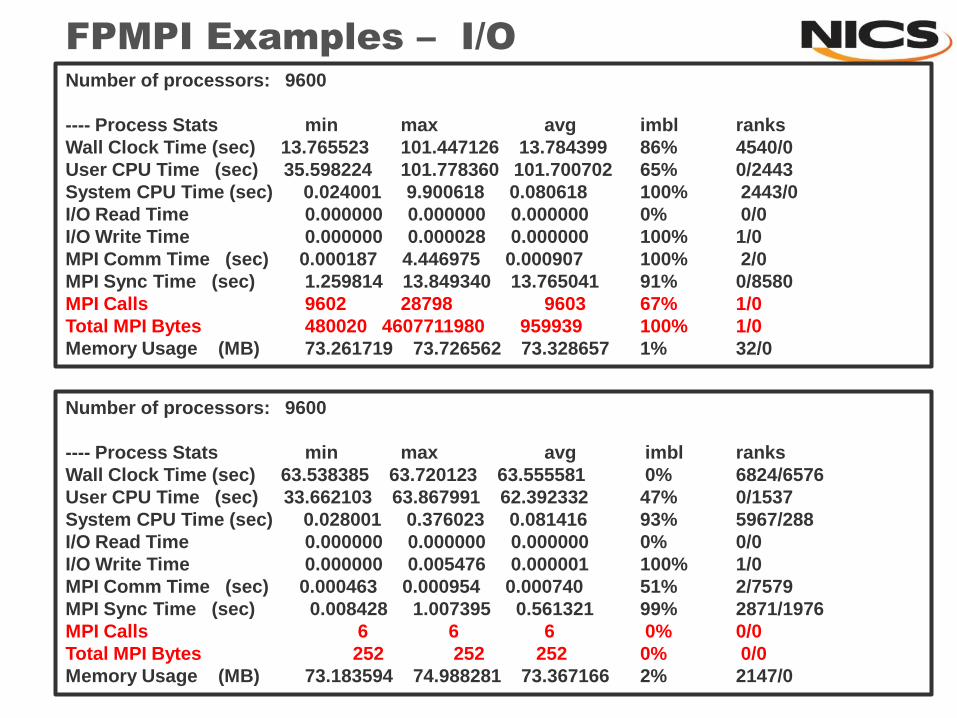
FPMPI Examples – I/O
Number of processors: 9600
---- Process Stats min max avg imbl ranks
Wall Clock Time (sec) 63.538385 63.720123 63.555581 0% 6824/6576
User CPU Time (sec) 33.662103 63.867991 62.392332 47% 0/1537
System CPU Time (sec) 0.028001 0.376023 0.081416 93% 5967/288
I/O Read Time 0.000000 0.000000 0.000000 0% 0/0
I/O Write Time 0.000000 0.005476 0.000001 100% 1/0
MPI Comm Time (sec) 0.000463 0.000954 0.000740 51% 2/7579
MPI Sync Time (sec) 0.008428 1.007395 0.561321 99% 2871/1976
MPI Calls 6 6 6 0% 0/0
Total MPI Bytes 252 252 252 0% 0/0
Memory Usage (MB) 73.183594 74.988281 73.367166 2% 2147/0
Number of processors: 9600
---- Process Stats min max avg imbl ranks
Wall Clock Time (sec) 13.765523 101.447126 13.784399 86% 4540/0
User CPU Time (sec) 35.598224 101.778360 101.700702 65% 0/2443
System CPU Time (sec) 0.024001 9.900618 0.080618 100% 2443/0
I/O Read Time 0.000000 0.000000 0.000000 0% 0/0
I/O Write Time 0.000000 0.000028 0.000000 100% 1/0
MPI Comm Time (sec) 0.000187 4.446975 0.000907 100% 2/0
MPI Sync Time (sec) 1.259814 13.849340 13.765041 91% 0/8580
MPI Calls 9602 28798 9603 67% 1/0
Total MPI Bytes 480020 4607711980 959939 100% 1/0
Memory Usage (MB) 73.261719 73.726562 73.328657 1% 32/0

IPM - Integrated Performance Monitoring
IPM is a lightweight profiling tool. Load banlance
Communication Balance
Message Buffer Sizes
Communication Topology
Switch Traffic
Memory Usage
Exec Info
Host list
Environment
Use IPM on Kraken:1. module load ipm2. relink with $IPM3. submit job and check for profile.txt4. generate report
ipm_parse -html <xml_file>

##IPMv0.980####################################################################
#
# command : ./xhpl-ipm (completed)
# host : nid15375/x86_64_Linux mpi_tasks : 48 on 4 nodes
# start : 05/04/10/13:13:01 wallclock : 125.681188 sec
# stop : 05/04/10/13:15:06 %comm : 0.81
# gbytes : 5.45075e+00 total gflop/sec : 1.91077e+01 total
#
##############################################################################
# region : * [ntasks] = 48
#
# [total] <avg> min max
# entries 48 1 1 1
# wallclock 4118.87 85.8098 82.1849 125.681
# user 4106.91 85.5607 82.2331 122.048
# system 18.6651 0.388857 0.044002 4.02025
# mpi 49.0138 1.02112 0.0168545 14.3788
# %comm 0.81247 0.020508 11.4408
# gflop/sec 19.1077 0.398077 3.64661e-07 4.83476
# gbytes 5.45075 0.113557 0.105663 0.200996
#
# PAPI_TOT_INS 1.71336e+13 3.56951e+11 3.10074e+11 6.82583e+11
# PAPI_FP_OPS 2.40148e+12 5.00308e+10 45831 6.07639e+11
# PAPI_L1_DCA 6.62643e+12 1.38051e+11 1.20294e+11 2.54606e+11
# PAPI_L1_DCM 1.37455e+11 2.86365e+09 1.37466e+09 3.45375e+09
#
# [time] [calls] <%mpi> <%wall>
# MPI_Recv 18.7131 25421 38.18 0.45
# MPI_Send 14.2269 764213 29.03 0.35
# MPI_Iprobe 10.4625 3.25614e+07 21.35 0.25
# MPI_Wait 4.72105 738792 9.63 0.11
# MPI_Irecv 0.888717 738792 1.81 0.02
# MPI_Comm_size 0.00111254 5166 0.00 0.00
# MPI_Comm_rank 0.000451038 4572 0.00 0.00
###############################################################################
IPM Report

Grid setting for PQ:
2x2


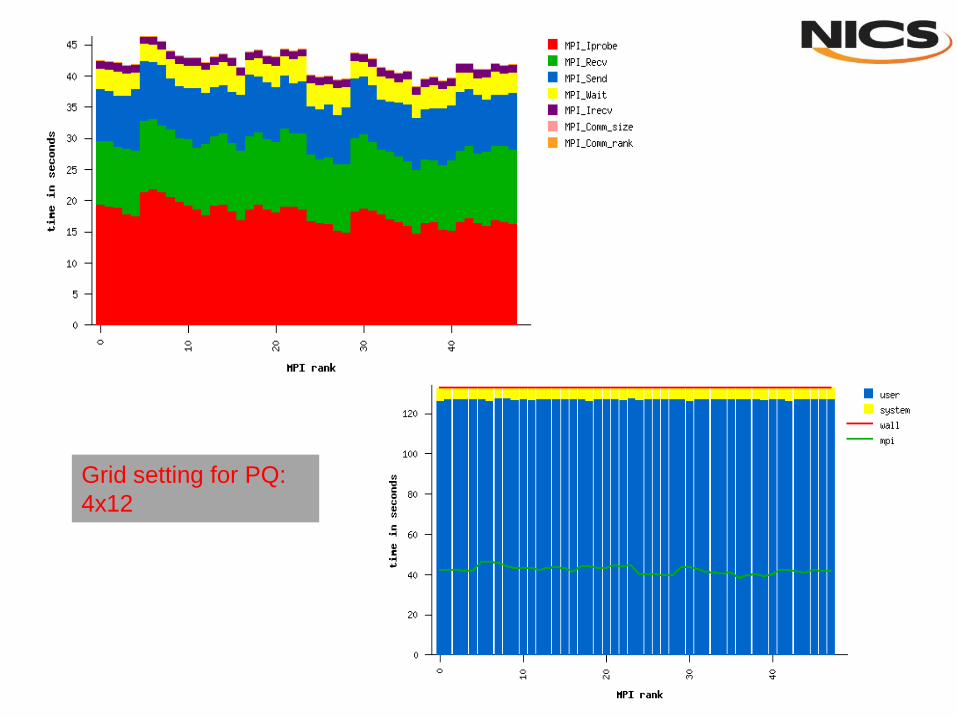
Grid setting for PQ:
4x12


CRAYPAT
pat_build
automatic instrumentation, no source code modification
pat_report
performance reports
apprentice
performance visualization tool
Performance statistics
Top time consuming routines
Load balance across computing resources
Communication overhead
Cache utilization
FLOPS
Vectorization (SSE instructions)
Ratio of computation versus communication

Automatic Profiling Analysis (APA)
1. Load CrayPat & Cray Apprentice2 module files– % module load xt-craypat apprentice2
2. Build application– % make clean– % make, NEED Object files
3. Instrument application for automatic profiling analysis– % pat_build –O apa a.out,– % pat_build –Drtenv=PAT_RT_HWPC=1 –g mpi,heap,io,blas a.out
You should get an instrumented program a.out+pat
4. Run application to get top time consuming routines– Remember to modify <script> to run a.out+pat– Remember to run on Lustre– % aprun … a.out+pat (or qsub <pat script>)
You should get a performance file (“<sdatafile>.xf”) or multiple files in a directory <sdatadir>
5. Generate .apa file– % pat_report –o my_sampling_report [<sdatafile>.xf | <sdatadir>]
creates a report file & an automatic profile analysis file <apafile>.apa

APA
6. Look at <apafile>.apa file
Verify if additional instrumentation is wanted
7. Instrument application for further analysis (a.out+apa)% pat_build –O <apafile>.apa
You should get an instrumented program a.out+apa
8. Run application Remember to modify <script> to run a.out+apa% aprun … a.out+apa (or qsub <apa script>)
You should get a performance file (“<datafile>.xf”) or multiple files in a directory <datadir>
9. Create text report% pat_report –o my_text_report.txt [<datafile>.xf | <datadir>]
Will generate a compressed performance file (<datafile>.ap2)
10. View results in text (my_text_report.txt) and/or with Cray Apprentice2
% app2 <datafile>.ap2

Example - HPL
# You can edit this file, if desired, and use it
# to reinstrument the program for tracing like this:
#
# pat_build -O xhpl+pat+27453-16285sdt.apa
# HWPC group to collect by default.
-Drtenv=PAT_RT_HWPC=1 # Summary with TLB metrics.
# Libraries to trace.
-g mpi,io,blas,math
• blas Linear Algebra
• heap dynamic heap
• io stdio and sysio
• lapack Linear Algebra
• math ANSI math
• mpi MPI
• omp OpenMP API
• omp-rtl OpenMP runtime library
• pthreads POSIX threads
• shmem SHMEM
Instrumented with:
pat_build -Drtenv=PAT_RT_HWPC=1 -g mpi,io,blas,math -w -o \
xhpl+apa /lustre/scratch/kwong/HPL/hpl-2.0/bin/Cray/xhpl
Runtime environment variables:
MPICHBASEDIR=/opt/cray/mpt/4.0.1/xt
PAT_RT_HWPC=1
MPICH_DIR=/opt/cray/mpt/4.0.1/xt/seastar/mpich2-pgi
Report time environment variables:
CRAYPAT_ROOT=/opt/xt-tools/craypat/5.0.1/cpatx
Operating system:
Linux 2.6.16.60-0.39_1.0102.4787.2.2.41-cnl #1 SMP Thu Nov 12 17:58:04 CST 2009

Table 1: Profile by Function Group and Function
Time % | Time |Imb. Time | Imb. | Calls |Group
| | | Time % | | Function
| | | | | PE='HIDE'
100.0% | 1.889359 | -- | -- | 313589.5 |Total
|-------------------------------------------------------------
| 39.9% | 0.753343 | -- | -- | 7830.5 | BLAS
||------------------------------------------------------------
|| 36.8% | 0.695245 | 0.054348 | 7.6% | 1047.5 |dgemm_
|| 2.4% | 0.045313 | 0.003840 | 8.2% | 1047.5 |dtrsm_
|| 0.5% | 0.008820 | 0.000541 | 6.0% | 524.3 |dgemv_
|| 0.1% | 0.001979 | 0.000800 | 30.0% | 2714.9 |dcopy_
||============================================================
| 31.4% | 0.593267 | -- | -- | 305749.0 | MPI
||------------------------------------------------------------
|| 18.8% | 0.355428 | 0.108507 | 24.4% | 211.3 |MPI_Recv
|| 4.6% | 0.087427 | 0.008492 | 9.2% | 292301.0 |MPI_Iprobe
|| 4.6% | 0.087252 | 0.011519 | 12.2% | 2427.2 |MPI_Send
||============================================================
| 28.3% | 0.534801 | -- | -- | 2.0 | USER
||------------------------------------------------------------
|| 28.3% | 0.534736 | 0.018405 | 3.5% | 1.0 |main
|| 0.0% | 0.000065 | 0.000001 | 2.2% | 1.0 |exit
||============================================================
| 0.4% | 0.007949 | -- | -- | 8.0 | IO
||------------------------------------------------------------
|| 0.4% | 0.007241 | 0.166543 | 100.0% | 1.3 |fgets
||============================================================
| 0.0% | 0.000000 | 0.000003 | 100.0% | 0.0 |MATH
|=============================================================

Totals for program
------------------------------------------------------------------------
Time% 100.0%
Time 1.889359 secs
Imb.Time -- secs
Imb.Time% --
Calls 0.166M/sec 313589.5 calls
PAPI_L1_DCM 16.023M/sec 30281456 misses
PAPI_TLB_DM 0.284M/sec 536336 misses
PAPI_L1_DCA 1688.295M/sec 3190654379 refs
PAPI_FP_OPS 3332.643M/sec 6298255922 ops
User time (approx) 1.890 secs 4913657415 cycles 100.0%Time
Average Time per Call 0.000006 sec
CrayPat Overhead : Time 11.4%
HW FP Ops / User time 3332.643M/sec 6298255922 ops 32.0%peak(DP)
HW FP Ops / WCT 3332.643M/sec
Computational intensity 1.28 ops/cycle 1.97 ops/ref
MFLOPS (aggregate) 79983.43M/sec
TLB utilization 5948.98 refs/miss 11.619 avg uses
D1 cache hit,miss ratios 99.1% hits 0.9% misses
D1 cache utilization (misses) 105.37 refs/miss 13.171 avg hits
========================================================================
BLAS
------------------------------------------------------------------------
Time 0.753343 secs
HW FP Ops / User time 8309.779M/sec 6265144313 ops 79.9%peak(DP)
========================================================================
BLAS / dgemm_
HW FP Ops / User time 8651.361M/sec 6017797050 ops 83.2%peak(DP)

Apprentice2
There are many
items in the toolbar;
you can see only
three of them by
default.

Overview Activity
Report
IO Rates Call Graph Traffic
Report
Mosaic
ReportHardware
Counters
Overview
Hardware
Counters
Plot
Environment
Report
Default Default set ‘–g io’
when using
pat_build
Default
Set PAT_RT_SUMMARY =0
Set
PAT_RT_HWPC
Set PAT_RT_HWPC
And
PAT_RT_SUMMARY
Apprentice2 Toolbar Summary

Apprentice2 - Overview
Default

Apprentice2 – Load Balance
Default
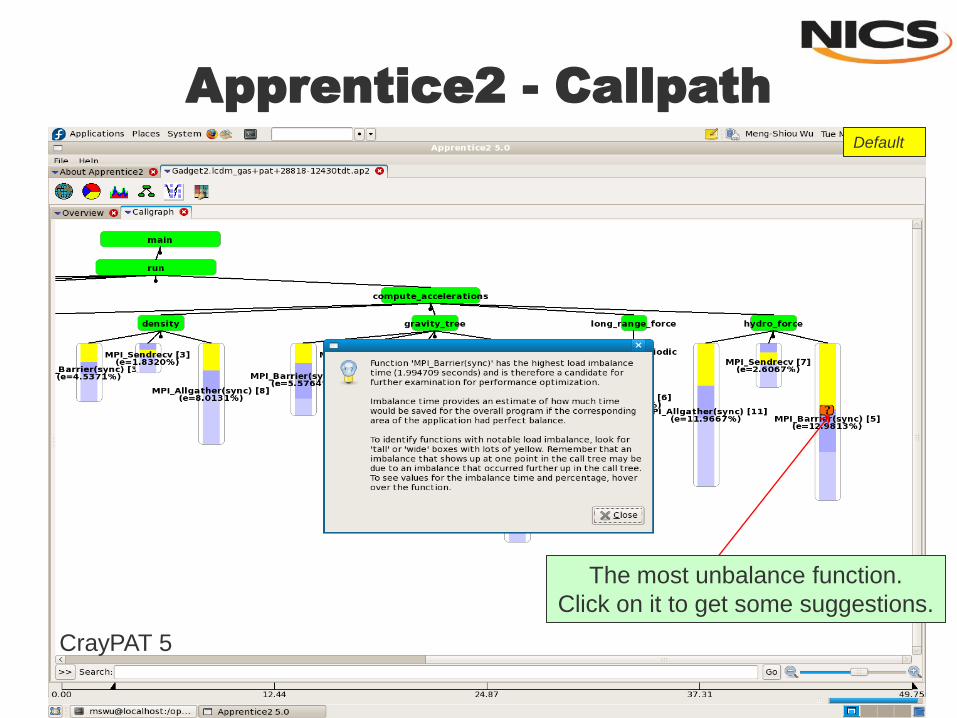
The most unbalance function.
Click on it to get some suggestions.
Apprentice2 - Callpath
CrayPAT 5
Default

Apprentice2 – Activity Report
Use the calipers to
filter out the startup
and close-out time.
Set PAT_RT_SUMMARY =0

Apprentice2 – Activity by PE
Set PAT_RT_SUMMARY =0

Apprentice2 – Mosaic Report
(Communication Matrix)
The default shows the average
communication time; can use this
tab to change to total times, total
calls, maximum time.
Set PAT_RT_SUMMARY =0

Apprentice2 – Traffic Report
NOTHING IS WRONG HERE!!!!
Set PAT_RT_SUMMARY =0

Apprentice2 – Traffic Report
Set PAT_RT_SUMMARY =0

Apprentice2 – Traffic Report
Set PAT_RT_SUMMARY =0
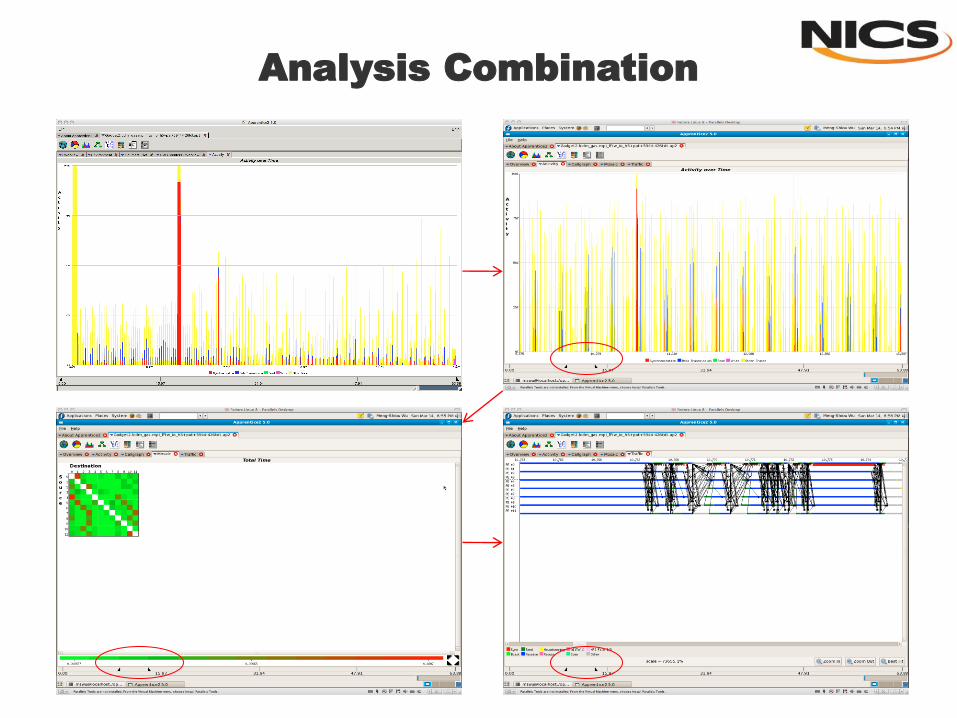
Analysis Combination

Apprentice2 – Hardware Counters
Hardware counter overview. There
are 20 groups (0~19); set PAT_RT_HWPC
to get the expect data.
Hardware counter plat.
Set PAT_RT_HWPC
Set PAT_RT_HWPC
And
PAT_RT_SUMMARY
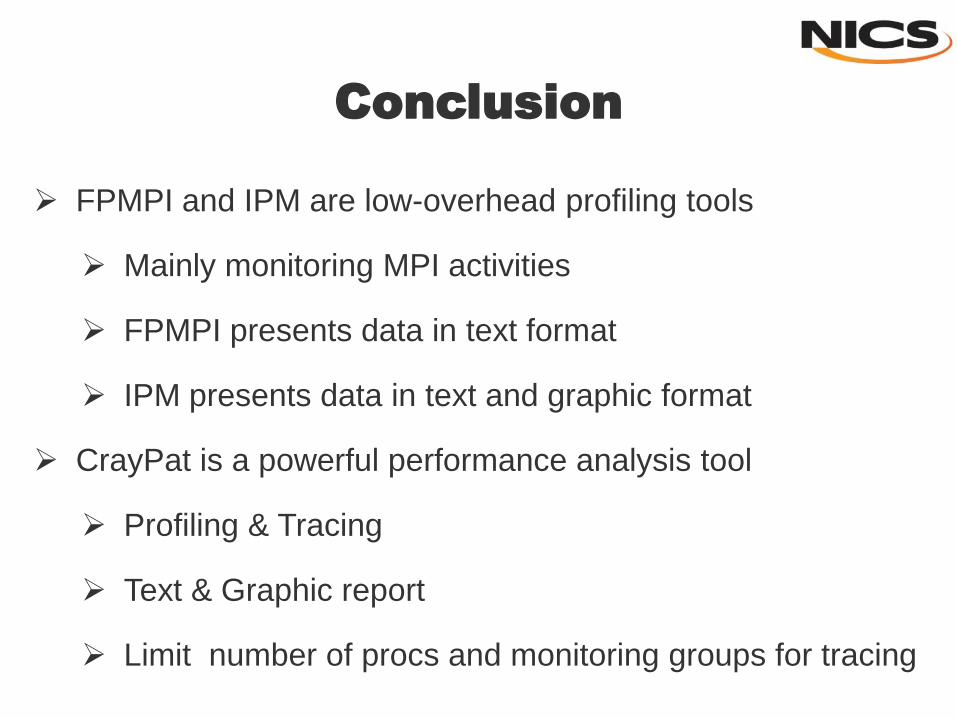
Conclusion
FPMPI and IPM are low-overhead profiling tools
Mainly monitoring MPI activities
FPMPI presents data in text format
IPM presents data in text and graphic format
CrayPat is a powerful performance analysis tool
Profiling & Tracing
Text & Graphic report
Limit number of procs and monitoring groups for tracing

Questions?