analysis of nyc government jobs
DESCRIPTION
This is a brief analysis of the job postings on the NYC Government website that I carried out as part of my project requirement for IS6030 Data Management class at The University of Cincinnati.TRANSCRIPT

DATA MANAGEMENT PROJECT REPORT ANALYSIS OF NEW YORK
CITY GOVERNMENT JOBS
Leon Corriea
IS6030 - Data Management
December 5, 2015

Table of Contents
Overview.................................................................................................................................... 1
Dataset Quality Analysis ........................................................................................................... 2
Database Normalization ........................................................................................................... 3
Summary Statistics .................................................................................................................... 4
Additional Insights and Visualizations Using Tableau ........................................................... 5
Forecasting Using Tableau ....................................................................................................... 8
Interactive Dashboards in Tableau ..........................................................................................9
Summary of Findings ............................................................................................................... 11
Appendix .................................................................................................................................. 12
PAGE 1
Overview
The New York City government employs 325,000 people, more than any city in the United
States and more than any other U.S. state apart from California, Texas, and the state of
New York itself. The government is more centralized than that of most other U.S. cities,
with the city government being responsible for public education, correctional institutions,
libraries, public safety, recreational facilities, sanitation, water supply, and welfare
services. (Source: Wikipedia)
The following project report gives a brief overview of the types of job opportunities
available at the New York City government, which are posted on their official job portal.
The data was taken from the NYC Open Data website (https://data.cityofnewyork.us/City-
Government/NYC-Jobs/kpav-sd4t). The type of data available in the dataset includes the
Job ID, Agency, the Posting Type (Internal/External), Number of Positions, Business Title,
Civil Service Title, Title Code No, Level, Salary Range (Min-Max), Salary Frequency, Work
Location, Division/Work Unit, Job Description, Minimum Qualification Requirements,
Preferred Skills, Any Additional Information, How To Apply, Hours/Shift, Residency
Requirement, Posting Date, Post Until Date, Posting Updated Date and Process Date.

PAGE 2
Dataset Quality Analysis
Overall, this is a very robust dataset which provides the users with almost all the
information that they may require to aid their job search or to perform any analysis on the
kind of jobs available at the New York City Government. However, like any other dataset,
this dataset was not perfect and had a number of issues.
Firstly, there were a lot of duplicate values in the dataset. The job postings were classified
into two types: Internal, i.e. the jobs which are open to only current employees of NYC
government and External, i.e. the jobs which are open to only those people who are
currently not employed by NYC government. However, while conducting a preliminary
analysis of the dataset, it was noticed that a number of job openings were open to both
Internal and External applicants. This resulted in the same job being listed twice. In order
to remove the duplicate entries, a third job posting type was created called ‘Both’ for the
jobs which were open to both Internal and External applicants. This reduced the number
of records from 3622 to 1876.
Secondly, the dataset was not normalized. There were multiple columns with
redundant/duplicate data. For example, the Agency column had only 39 Agencies spread
across 1876 job postings. Similar issues were found with other columns where multiple
entries for the same value existed. Using database normalization, these issues were fixed,
as detailed in the next section.
Other issues with the data set included missing values in some columns, column
duplication (such as two Work Location columns), columns with no data (Recruitment
Contact), data stored in incorrect data format (date stored as DATETIME), incomplete
addresses and random special characters throughout the data fields storing character
strings (Job Description, Minimum Qualification, etc.).
PAGE 3
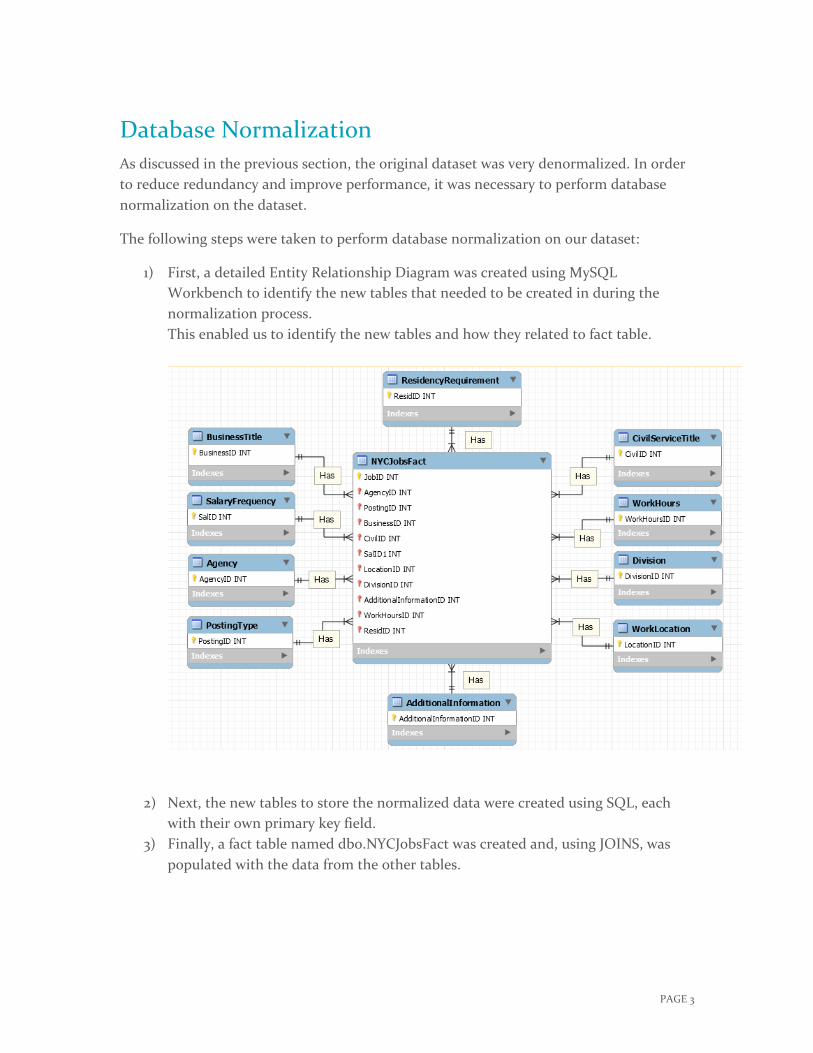
Database Normalization
As discussed in the previous section, the original dataset was very denormalized. In order
to reduce redundancy and improve performance, it was necessary to perform database
normalization on the dataset.
The following steps were taken to perform database normalization on our dataset:
1) First, a detailed Entity Relationship Diagram was created using MySQL
Workbench to identify the new tables that needed to be created in during the
normalization process.
This enabled us to identify the new tables and how they related to fact table.
2) Next, the new tables to store the normalized data were created using SQL, each
with their own primary key field.
3) Finally, a fact table named dbo.NYCJobsFact was created and, using JOINS, was
populated with the data from the other tables.

PAGE 4
Summary Statistics
After normalizing, the dataset, we used the new set of tables to perform some preliminary
analysis.
Below is a brief summary of the number and types of jobs that are currently available at
the New York City government.
In all, there are a total of 1876 job openings across various departments within the
NYC government.
Out of these, 149 are classified as Internal only (i.e. they are open only to current
employees of the NYC government).
1722 jobs are open for both Internal as well as External applicants.
Only 5 positions are classified as External only (i.e. open only to people who are
currently not employed by the NYC government).
The Department Of Health/Mental Hygiene has the maximum number of job
openings with 961 open positions.
Looking at a the data from a more relevant perspective, the number of open
positions that require a master’s degree as minimum qualification are 682 and
those that are suitable for Business Analytics professionals (Position Title with
either Business or Analyst in it) are 183.
This information is just a snapshot of the kind of analysis that can be conducted by job
seekers looking to work at the NYC government. We can obtain many more insights by
using advanced SQL queries in addition to these basic commands.

PAGE 5
Additional Insights and Visualizations Using Tableau
In addition to using SQL, Tableau was used to find some more insights and to create
visualizations of the data.
The same summary statistics identified in the previous section are provided below in a
more visually appealing manner. For example, the chart below identifies the top 10
agencies according to the total number of job postings.
The Human Rights Commission tops the list of agencies with the highest salary cap as well
as the highest variation between maximum and minimum salary.

PAGE 6
However, the Department of Sanitation has the highest median salary on an annual basis…
…while the position of the Deputy Chief City Medical Examiner pays the highest median
annual salary of approximately $220,000.

PAGE 7
In the past two years the median annual salary for positions that require a master’s degree
as minimum educational qualification has risen by almost $10,000.
Analytics professionals are in high demand and are well compensated as can be seen from
the chart below. The median annual salary has risen steeply since 2011 for job seekers with
analytics/finance as their background.

PAGE 8
Forecasting Using Tableau
The number of job openings at the NYC government has been on a steady rise over the
past year. Using the built-in forecasting capability of Tableau, it was predicted that the
number of available jobs will continue to grow in 2016.
The dark blue line indicates the actual data and the light blue line indicates the forecasted
value for 2016. The shaded area in the image above shows the 95% prediction interval for
the forecast. That is, the model has determined that there is a 95% likelihood that the
number of predicted jobs will be within the shaded area for the forecast period.

PAGE 9
Interactive Dashboards in Tableau
1) Using the dashboard functionality of Tableau, interactive dashboards were created
where the data can be filtered based on multiple conditions as per the user’s
requirement. Below is an example of a dashboard which shows data for the
number of job openings by Agency with the option of filtering by year of posting
and/or by each individual agency.

PAGE 10
2) Using an interactive map of New York City, a dashboard was created where a user
can also look at job openings by location and filter using specific location(s). The
bigger the size of the circle, the more number of job openings at that particular
location. Additionally, as the number of openings at a particular location increase,
the color of the circle goes from mild orange to dark orange.
By just hovering the pointer over a particular circle, the user will be able to see the
work location address and the number of job openings at that particular location.
Looking at the map above, it can be observed that a large number of jobs are
concentrated around the financial district in the borough of Manhattan in NYC.

PAGE 11
Summary of Findings
Working for the New York City government can be a very lucrative career choice. The
median salary across all the current job openings at the NYC government is approximately
$75,000. The outlook is even better if you are a job seeker with a master’s degree in one of
the business or analytics field.
On an average, a job seeker with a master’s degree can expect to earn a median salary of
up to $85,000 per annum.
If the job seeker has a master’s degree in the field of analytics or finance, they can expect
to earn a median annual salary of up to $81,000, which is approximately 8% higher than
the median salary across all the positions currently available at the NYC government.

PAGE 12
Appendix
NYC Government Information:
https://en.wikipedia.org/wiki/Government_of_New_York_City
NYC Government Job Portal:
http://www1.nyc.gov/jobs/index.page
NYC Open Data Website:
https://data.cityofnewyork.us/City-Government/NYC-Jobs/kpav-sd4t
Tableau Forecasting Steps:
http://onlinehelp.tableau.com/current/pro/online/windows/en-us/forecast_create.html
Latitude and Longitude Encoder for Street Addresses:
http://www.findlatitudeandlongitude.com/