analysis of leo faculty: revenue and expenses in context ... · • manageable debt levels given...
TRANSCRIPT
AnalysisofLEOFaculty:RevenueandExpensesin
ContextfortheUniversityofMichiganFinancialSituation
HowardBunsisProfessorofAccounting,EasternMichiganUniversity
PastChair,AAUPCollectiveBargainingCongress
1

2
ImportanceofLEOFacultyinEducatingtheStudentsatUM

ImportanceofLEOFaculty:AnnArbor
3
0%
10%
20%
30%
40%
50%
60%
TenureTrack Lecturers Clinicals GSIs
ShareofUndergradTeachingbyTypeofInstructor,UM-AnnArbor,2016-17
TotalSCHs SCHsinUndergradclasses SCHsin1st&2ndYr.UGclasses
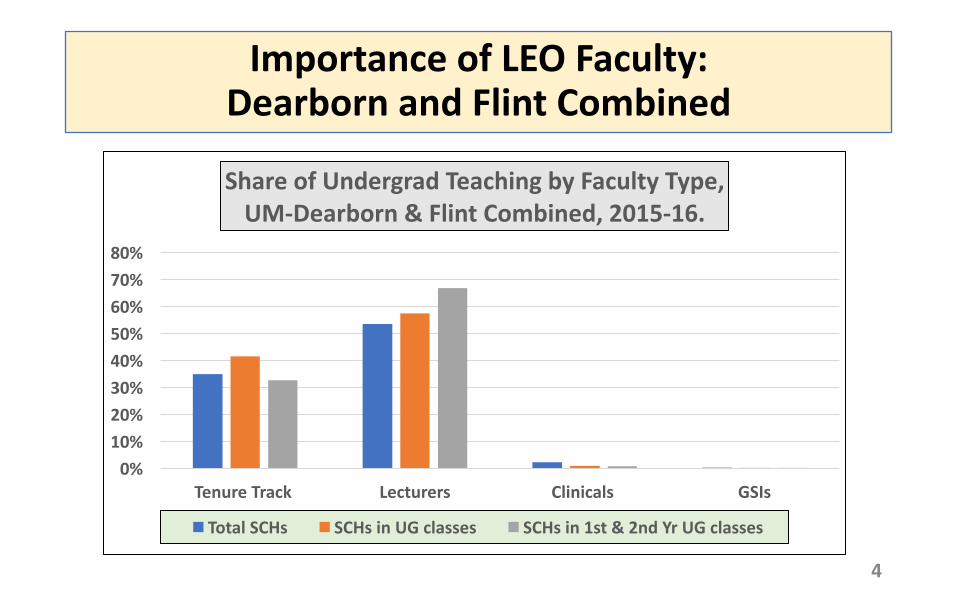
ImportanceofLEOFaculty:DearbornandFlintCombined
4
0%10%20%30%40%50%60%70%80%
TenureTrack Lecturers Clinicals GSIs
ShareofUndergradTeachingbyFacultyType,UM-Dearborn&FlintCombined,2015-16.
TotalSCHs SCHsinUGclasses SCHsin1st&2ndYrUGclasses

RevenueGeneratedbyLEOFaculty
5
0100200300400500600700800900
1,000
TTFaculty Lecturers Clinical GSIs
TuitionRevenuevs.TotalCompensationofUMFaculty($Millions),2016-17.
TuitionRevenue TotalCompensation

DeficitorSurplusofDifferentInstructionGroups
6
($350)
($11)
$75
$377
-$500-$400-$300-$200-$100
$0$100$200$300$400$500
TTFaculty Clinical GSIs Lecturers
NetContributionofTeachingtoUMRevenues,inMillions(TuitionRevenue– TotalCompensation)2016-17

7
LEOSalariesOverTime:ComparisontoOtherEmployeesatUM
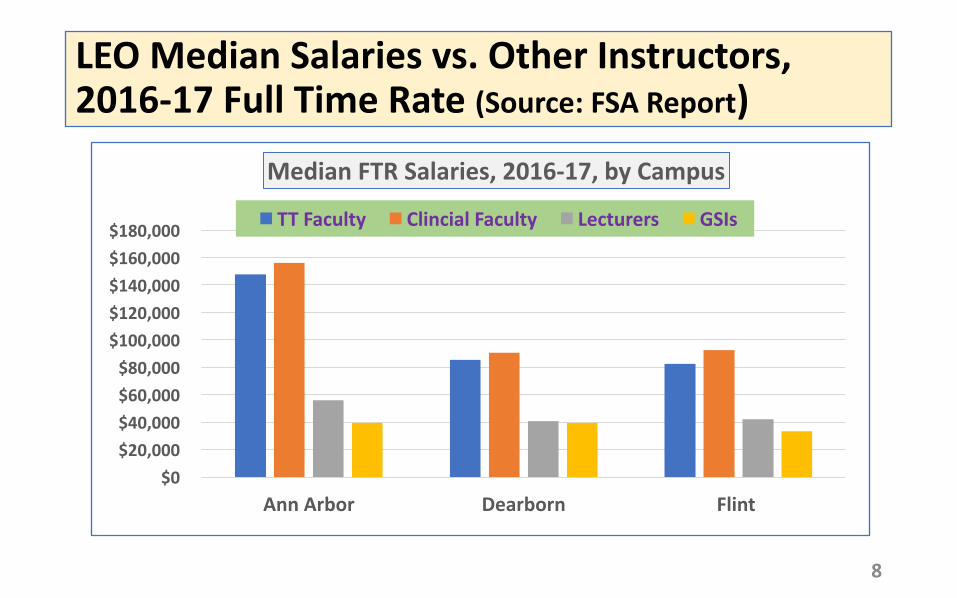
LEOMedianSalariesvs.OtherInstructors,2016-17FullTimeRate(Source:FSAReport)
8
$0$20,000$40,000$60,000$80,000$100,000$120,000$140,000$160,000$180,000
AnnArbor Dearborn Flint
MedianFTRSalaries,2016-17,byCampus
TTFaculty ClincialFaculty Lecturers GSIs

PercentageChangesinSalaries,2014to2017
9
6.6%6.1% 6.1%
3.9%
0%
1%
2%
3%
4%
5%
6%
7%
8%
Professor/Assoc./Asst. GraduateStudents AllClinicalFaculty LEOFaculty
SalaryPercentageChanges2014to2017,AllCampusesvs.Inflation(4.4%)
Change
Inflation
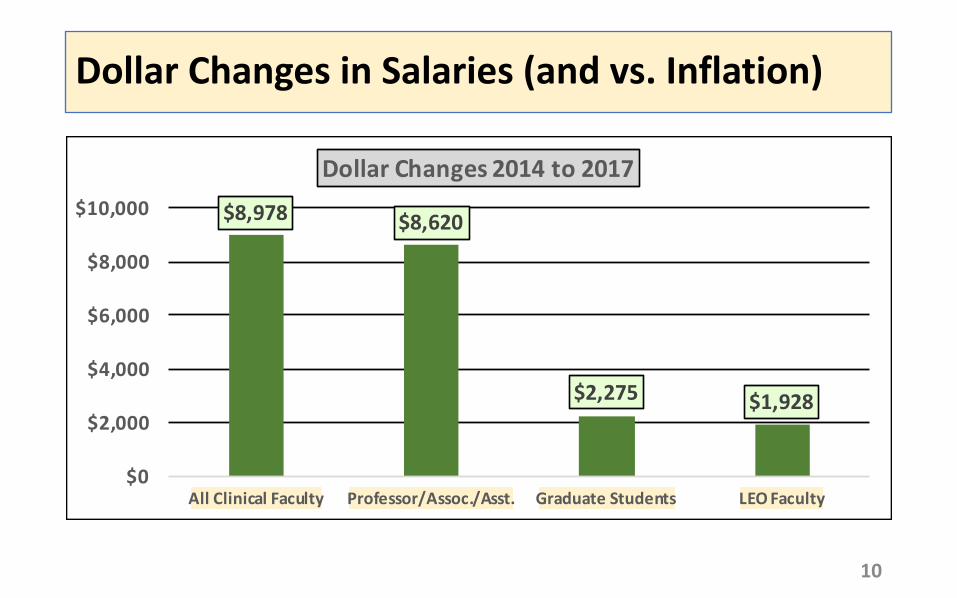
DollarChangesinSalaries(andvs.Inflation)
10
$8,978 $8,620
$2,275 $1,928
$0
$2,000
$4,000
$6,000
$8,000
$10,000
AllClinicalFaculty Professor/Assoc./Asst. GraduateStudents LEOFaculty
DollarChanges2014to2017
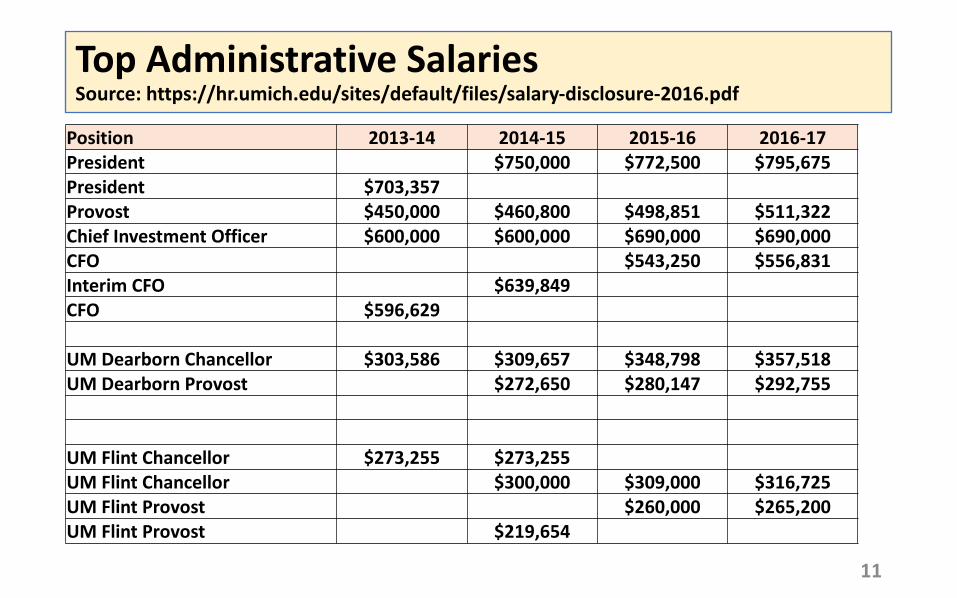
TopAdministrativeSalariesSource:https://hr.umich.edu/sites/default/files/salary-disclosure-2016.pdf
11
Position 2013-14 2014-15 2015-16 2016-17President $750,000 $772,500 $795,675President $703,357Provost $450,000 $460,800 $498,851 $511,322ChiefInvestmentOfficer $600,000 $600,000 $690,000 $690,000CFO $543,250 $556,831InterimCFO $639,849CFO $596,629
UMDearbornChancellor $303,586 $309,657 $348,798 $357,518UMDearbornProvost $272,650 $280,147 $292,755
UMFlintChancellor $273,255 $273,255UMFlintChancellor $300,000 $309,000 $316,725UMFlintProvost $260,000 $265,200UMFlintProvost $219,654

PercentageChangesinSalaries,2014to2017:LEOvs.TopAdministrators
12
13.1% 13.6%15.0%
17.8%15.9%
3.9%
0%2%4%6%8%10%12%14%16%18%20%
UMPresident UMProvost UMCIO UMDearbornChancellor
UMFlintChancellor
All LEOFaculty
2014to2017%Changes
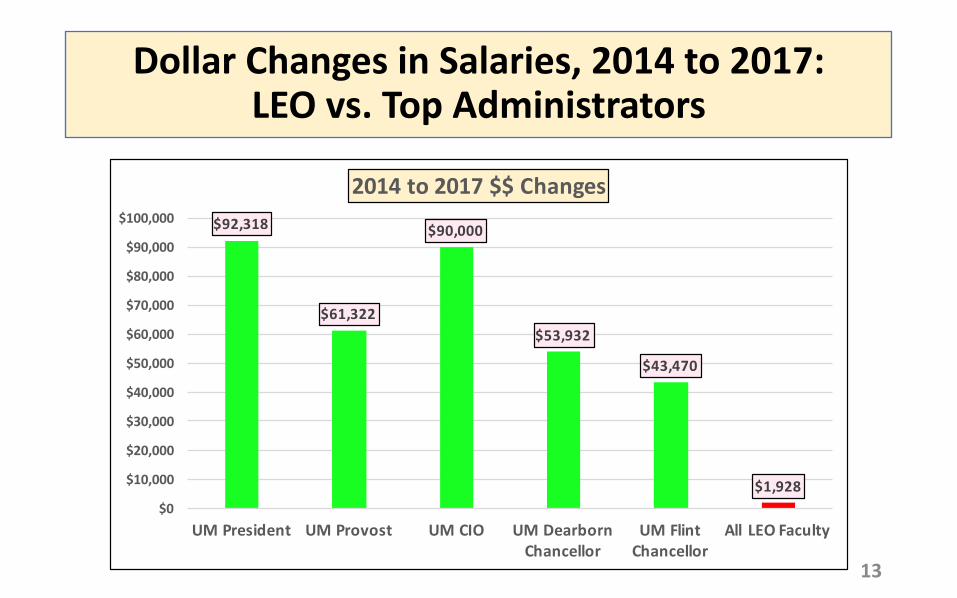
DollarChangesinSalaries,2014to2017:LEOvs.TopAdministrators
13
$92,318
$61,322
$90,000
$53,932
$43,470
$1,928$0
$10,000
$20,000
$30,000
$40,000
$50,000
$60,000
$70,000
$80,000
$90,000
$100,000
UMPresident UMProvost UMCIO UMDearbornChancellor
UMFlintChancellor
All LEOFaculty
2014to2017$$Changes

14
FinancialSituationoftheUniversityof
Michigan

UMFinancialSituation– BalanceSheetSource:UMAuditedFinancialStatements
15
02,000,0004,000,0006,000,0008,000,00010,000,00012,000,00014,000,00016,000,00018,000,00020,000,000
2008 2016
TotalAssets TotalLiabilities TotalNetAssets
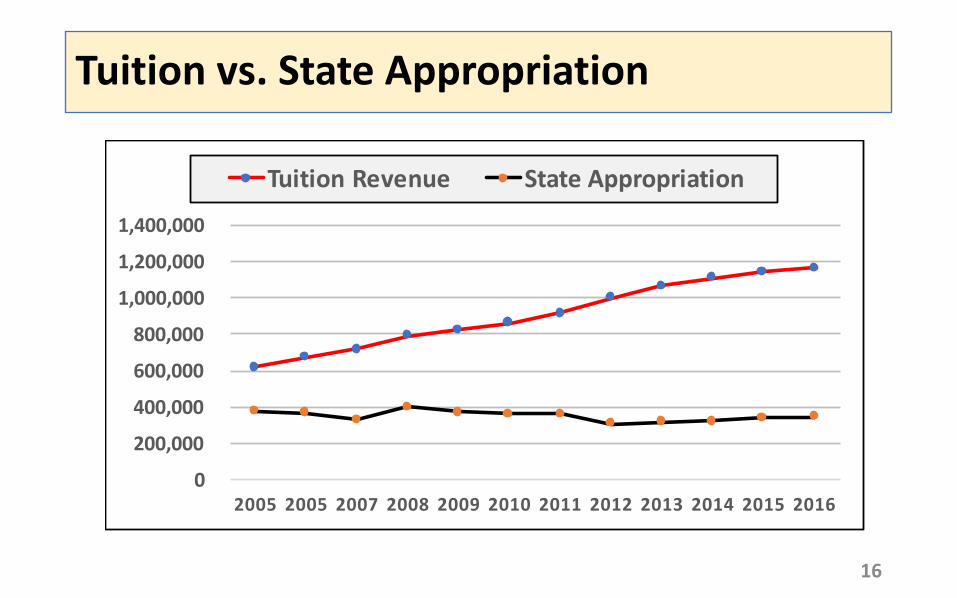
Tuitionvs.StateAppropriation
16
0
200,000
400,000
600,000
800,000
1,000,000
1,200,000
1,400,000
2005 2005 2007 2008 2009 2010 2011 2012 2013 2014 2015 2016
TuitionRevenue StateAppropriation
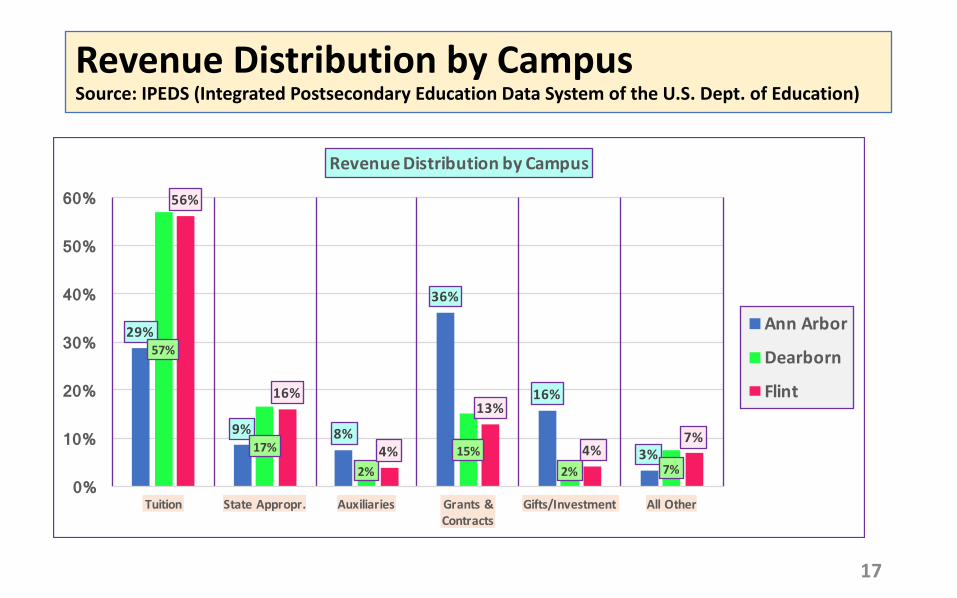
RevenueDistributionbyCampusSource:IPEDS(IntegratedPostsecondaryEducationDataSystemoftheU.S.Dept.ofEducation)
17
29%
9% 8%
36%
16%
3%
57%
17%
2%15%
2% 7%
56%
16%
4%
13%
4%7%
0%
10%
20%
30%
40%
50%
60%
Tuition StateAppropr. Auxiliaries Grants&Contracts
Gifts/Investment AllOther
RevenueDistributionbyCampus
AnnArbor
Dearborn
Flint

SalaryExpenseDistributionbyCampusperIPEDS
18
39%
25%
4%8%
23%59%
3% 2% 11%25%
56%
1% 4%
13%
26%
0%
10%
20%
30%
40%
50%
60%
70%
Instruction Research Auxiliary InstitutionalSupport
AllOther
SalaryComponentofExpenseDistributionbyCampus
AnnArbor
Dearborn
Flint

UnrestrictedReservesvs.SolidLevel(25%ofExpenses)InmillionsperAuditedFinancialStatements
19
$0
$500
$1,000
$1,500
$2,000
$2,500
$3,000
$3,500
$4,000
2010 2011 2012 2013 2014 2015 2016
Unrestricted Reserves
UnrestrictedReserves
SolidLevelofReserves

AnnualExcessCashFlows,inMillionsSource:AuditedFinancialStatements
20
$0
$100
$200
$300
$400
$500
$600
2010 2011 2012 2013 2014 2015 2016
SurplusCashFlows,inMillions

UMBondRating:AAA(Highest)
21
StrengthsperMoody’sReport:• Abilitytotranslateitsinternationalbrandintorevenuegrowth• Excellentstudentdemandandgrowingphilanthropicsupport• Largeanddiversifiedscaleofoperations• Considerablefinancialreserves• Manageabledebtlevelsgivenmultiplesourcesofcapitalfunding• Operatingperformanceshouldremainsound,bolsteredbycontinued
improvementatthehealthsystem• Stronginternalliquidity
ChallengeperMoody’sReport:• Highrelianceonpatientcarerevenuethatissusceptibletoregulatory
andgovernmentpayerchanges

22
5The Financial & Strategic Outlook for Private Colleges
Moody’s Rates Over 500 Universities in the USIncludes vast majority of sector debt
» Nearly 275 private colleges and universities» Over $85 billion of rated debt outstanding» Median rating of A3 by number of institutions» Median rating of Aa2 weighted by rated debt
» Over 230 four-year public universities» Almost $125 billion total rated debt outstanding» Median rating of A1 by number of institutions» Median rating of Aa1 weighted by rated debt
Source: Moody's, ratings as of December 29, 2014. S-T represents those with only a short-term rating
812
4146
69
22 19
82 0 3 1
0
10
20
30
40
50
60
70
80
Aaa Aa1 Aa2 Aa3 A1 A2 A3 Baa1 Baa2 Baa3 SG S-T
US Public University Ratings
1511
20
25
33
3840
33
26
21
12
00
5
10
15
20
25
30
35
40
45
Aaa Aa1 Aa2 Aa3 A1 A2 A3 Baa1 Baa2 Baa3 SG S-T
US Private University Ratings
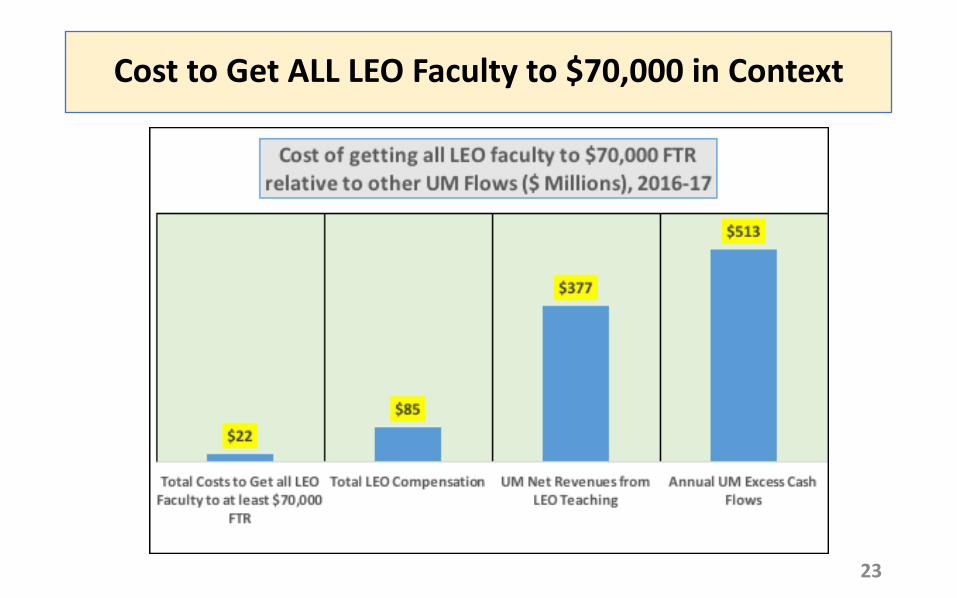
CosttoGetALLLEOFacultyto$70,000inContext
23