analysis of june-july measurements
DESCRIPTION
CERN, FiDeL meeting, 28 th September 2010. Analysis of June-July measurements. Nicholas Aquilina TE-MSC-MDA Acknowledgements : L. Fiscarelli , G. Montenero , L. Walckiers for measurements L. Bottura , N. Sammut , E. Todesco for fits and model. Contents. List of measurements - PowerPoint PPT PresentationTRANSCRIPT

Analysis of June-July measurements
Nicholas AquilinaTE-MSC-MDA
Acknowledgements:L. Fiscarelli, G. Montenero, L. Walckiers for measurements
L. Bottura, N. Sammut, E. Todesco for fits and model
CERN, FiDeL meeting, 28th September 2010

2
Contents
• List of measurements• Decay amplitude vs ramp rate• Scaling laws• Linear correlation• Difference between measurements• Baseline analysis
9/28/2010

3
List of measurements (1)
9/28/2010
Measurement dI/dt (A/s) IFT (A) tFT (s) tPRE (s)
1 10 2000 1000 10002 10 2000 1000 10003 10 2000 0 10004 10 2000 0 -5 10 2000 0 10006 10 2000 0 10008 2 4000 1000 10009 10 4000 1000 1000
10 2 6000 1000 100012 10 6000 1000 100013 2 6000 0 -14 10 6000 0 -15 2 6000 0 -16 10 6000 0 -
4
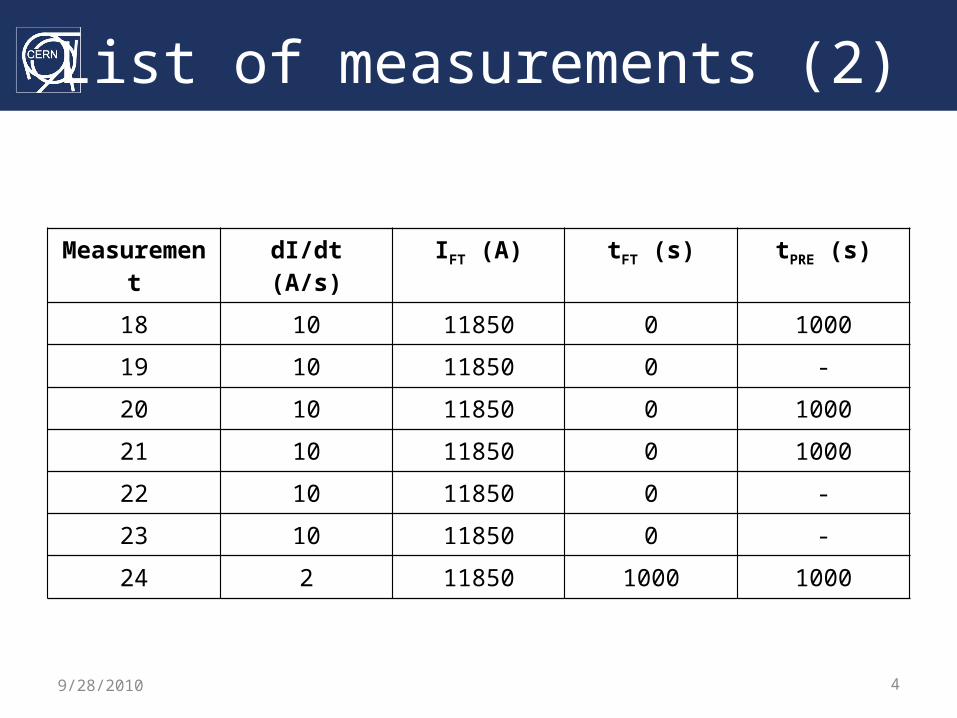
List of measurements (2)
9/28/2010
Measurement dI/dt (A/s) IFT (A) tFT (s) tPRE (s)
18 10 11850 0 100019 10 11850 0 -20 10 11850 0 100021 10 11850 0 100022 10 11850 0 -23 10 11850 0 -24 2 11850 1000 1000

5
Decay amplitude vs ramp rate
9/28/2010
• Decay amplitude is expected to increase from 2 A/s to 10 A/s by 50% to 75%
• MB2524 has been the first magnet to be measured at 2 A/s in June-July with FAME

6
Scaling law (1)
• Ramp rate of 10 A/s• Flattop current of 11850 A• Flattop time of 1000 s• Preparation time of 0 s
9/28/2010

7
Scaling law (2)
9/28/2010
0.00.10.20.30.40.50.60.70.8
0 2 4 6 8
∆b 3
IFT (kA)
b3
Ap 1
Ap 2
FiDeL model

8
Scaling law (3)
9/28/2010
0.0
0.5
1.0
1.5
2.0
2.5
0 10 20 30 40
∆b 3
dI/dt (A/s)
b3
Ap1
Ap2
FiDeL model
∆b3 vs dI/dt for 6 kA ramps
Note that the scaling law is not accurate at low ramp rate values (decay amplitude is factor 2 less, not 5)

9
Scaling law (4)
9/28/2010
∆b5 vs dI/dt for 6 kA ramps
0.00
0.05
0.10
0.15
0.20
0.25
0.30
0 10 20 30 40
∆b 5
dI/dt (A/s)
b5
Ap1
Ap2
FiDeL model
Note that the scaling law is not accurate at low ramp rate values

10
Scaling law (5)
9/28/2010
0.0
0.5
1.0
1.5
2.0
2.5
0 10 20 30 40
∆b 3
dI/dt (A/s)
b3
Ap1
Ap2
FiDeL model
∆b3 vs dI/dt for 4 kA ramps
Note that the scaling law is not accurate at low ramp rate values

11
Scaling law (6)
9/28/2010
∆b5 vs dI/dt for 4 kA ramps
0.00
0.05
0.10
0.15
0.20
0.25
0.30
0 10 20 30 40
∆b 5
dI/dt (A/s)
b5
Ap1
Ap2
FiDeL model
Note that the scaling law is not accurate at low ramp rate values

12
Linear correlation (1)• Snapback can be described by an exponential
fitting:
• Linear correlation:
9/28/2010

13
Linear correlation (2)
9/28/2010
0.0
0.1
0.2
0.3
0.4
0.5
0.6
0 1 2 3 4
∆b 3
∆I3
IFT
2 kA-Ap1
4 kA-Ap1
4 kA-Ap2
6 kA-Ap1
6 kA-Ap2
correlation (0.176)

14
Linear correlation (3)
9/28/2010
0.00
0.02
0.04
0.06
0.08
0.10
0.12
0.14
0.16
0.18
0 2 4 6 8
∆b 5
∆I5
IFT
2 kA-Ap1
4 kA-Ap1
4 kA-Ap2
6 kA-Ap1
6 kA-Ap2
correlation (0.028)

15
Linear correlation (4)
9/28/2010
0.0
0.1
0.2
0.3
0.4
0.5
0.6
0.7
0.8
0 1 2 3 4 5
∆b 3
∆I3
dI/dt
2 A/s, 4 kA
10 A/s, 4 kA
2 A/s, 6 kA
10 A/s, 6 kA
correlation (0.176)
16
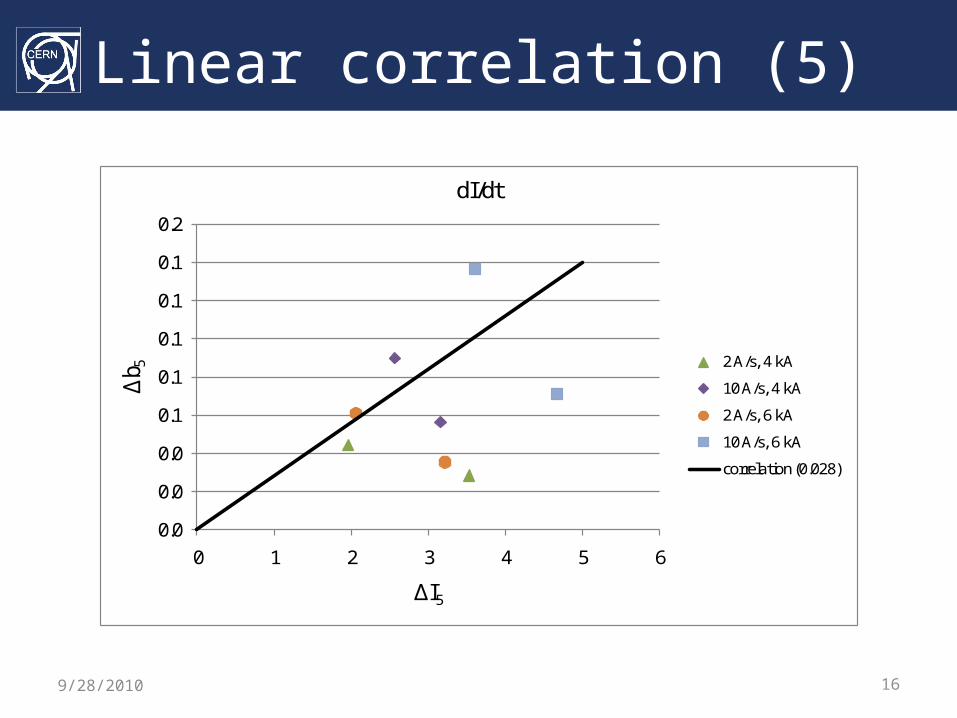
Linear correlation (5)
9/28/2010
0.0
0.0
0.0
0.1
0.1
0.1
0.1
0.1
0.2
0 1 2 3 4 5 6
∆b 5
∆I5
dI/dt
2 A/s, 4 kA
10 A/s, 4 kA
2 A/s, 6 kA
10 A/s, 6 kA
correlation (0.028)

17
Difference between measurements (1)
• Dec 09-Jan 10 measurements were compared with Jun-Jul 10 measurements
9/28/2010
Observations:
•Change by a factor of 1.5
•Campaign 1 (blue) refers to Dec 09-Jan 10 measurements
•Campaign 2 (black) refers to Jun-Jul 10 measurements
Comparison of the b3 component for a 6 kA ramp.

18
Difference between measurements (2)
9/28/2010
0 1000 2000 3000 4000 5000 6000 7000 80000
1000
2000
3000
4000
5000
6000
7000
Time (s)
Curr
ent (A
)
campaign 1campaign 2P: 2, 0.05
E: 0, 0L:10, 2P:-2, -0.05
P: 2, 0.82E: 0, 0L:10, 2P:-2, -0.82

19
Baseline (1)
• Stop for 0 s at 350 A• Stop for 1000 s at
500 A (pre-injection)• Stop for 1000 s at
757.2 A (injection)
9/28/2010
0
1000
2000
3000
4000
5000
6000
7000
0 1000 2000 3000 4000 5000 6000 7000 8000
Cu
rren
t (A
)
Time (s)
Pre-cycle and ramp
20
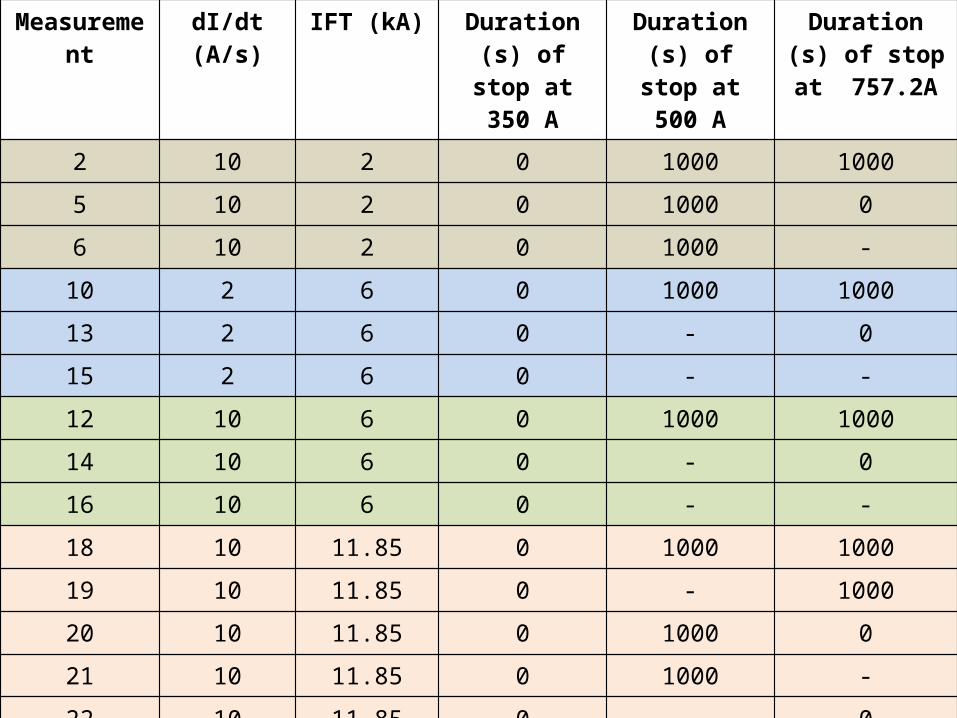
Baseline (2)
9/28/2010
Measurement dI/dt (A/s) IFT (kA) Duration (s) of stop at 350 A
Duration (s) of stop at 500 A
Duration (s) of stop at 757.2A
2 10 2 0 1000 1000
5 10 2 0 1000 0
6 10 2 0 1000 -
10 2 6 0 1000 1000
13 2 6 0 - 0
15 2 6 0 - -
12 10 6 0 1000 1000
14 10 6 0 - 0
16 10 6 0 - -
18 10 11.85 0 1000 1000
19 10 11.85 0 - 1000
20 10 11.85 0 1000 0
21 10 11.85 0 1000 -
22 10 11.85 0 - 0
23 10 11.85 0 - -

21
Baseline (3)
0 1000 2000 3000 4000 5000 6000 70000
200
400
600
800
1000
1200
1400
1600
1800
2000
Time (s)
Cur
rent
(A)
meas 2meas 5meas 6
9/28/2010
2 10 A/s 2 kA 0 s 1000 s 1000 s
5 10 A/s 2 kA 0 s 1000 s 0 s
6 10 A/s 2 ka 0 s 1000 s -

22
Baseline (4)
740 745 750 755 760 765 770 775 780 785 790
-2.75
-2.7
-2.65
-2.6
-2.55
-2.5
-2.45
-2.4
-2.35
-2.3
-2.25
Current (A)
b 3 (uni
ts)
meas 2meas 5meas 6
9/28/2010
Decay occurs even when stopping at injection for 0 s.Please note that PELP is changed and restarted when stopping for 0 s.

23
Baseline (5)
0 2000 4000 6000 8000 10000 12000 14000 16000 180000
1000
2000
3000
4000
5000
6000
Time (s)
Cur
rent
(A)
meas 10meas 13meas 15
9/28/2010
10 2 A/s 6 kA 0 s 1000 s 1000 s
13 2 A/s 6 kA 0 s - 0 s
15 2 A/s 6 kA 0 s - -

24
Baseline (6)
740 745 750 755 760 765 770 775 780 785 790
-2.75
-2.7
-2.65
-2.6
-2.55
-2.5
-2.45
-2.4
-2.35
-2.3
-2.25
Current (A)
b 3 (uni
ts)
meas 10meas 13meas 15
9/28/2010
Decay occurs even when stopping at injection for 0 s

25
Baseline (7)
0 1000 2000 3000 4000 5000 6000 7000 80000
1000
2000
3000
4000
5000
6000
Time (s)
Cur
rent
(A)
meas 12meas 14meas 16
9/28/2010
12 10 A/s 6 kA 0 s 1000 s 1000 s
14 10 A/s 6 kA 0 s - 0 s
16 10 A/s 6 kA 0 s - -

26
Baseline (8)
740 745 750 755 760 765 770 775 780 785 790-2.8
-2.7
-2.6
-2.5
-2.4
-2.3
-2.2
-2.1
-2
Current (A)
b 3 (uni
ts)
meas 12meas 14meas 16
9/28/2010
Decay occurs even when stopping at injection for 0 s

27
Baseline (9)
9/28/2010
0 1000 2000 3000 4000 5000 6000 7000 8000 9000 100000
2000
4000
6000
8000
10000
12000
Time (s)
Cur
rent
(A)
meas 18meas 19meas 20meas 21meas 22meas 23
18 10 A/s 11.85 kA 0 s 1000 s 1000 s
19 10 A/s 11.85 kA 0 s - 1000 s
20 10 A/s 11.85 kA 0 s 1000 s 0 s
21 10 A/s 11.85 kA 0 s 1000 s -
22 10 A/s 11.85 kA 0 s - 0 s
23 10 A/s 11.85 kA 0 s - -

28
Baseline (10)meas 18 meas 19 meas 20 meas 21 meas 22 meas 23 units
Flattop current, 11.85 kA for 0 0 0 0 0 0 s
Pre-cycle ramp-down
P -0.05 -0.05 -0.05 -0.05 -0.05 -0.05 As-2
E 0 0 0 0 0 0 sL -10 -10 -10 -10 -10 -10 As-1
P 0.05 0.05 0.05 0.05 0.05 0.05 As-2
Stop at 350 A for 0 0 0 0 0 0 s
Going to pre-injection
P 0.05 - 0.05 0.05 - - As-2
E 0 - 0 0 - - sL - - - - - - As-1
P -0.05 - -0.05 -0.05 - - As-2
Pre-injection porch, 500 A for 1000 - 1000 1000 - - s
Going to injection
P 1.5 1.5 1.5 - 1.5 - As-2
E 0 0 0 - 0 - sL 10 10 10 - 10 - As-1
P -1.5 -1.5 -1.5 - -1.5 - As-2
Injection plateau, 760 A for 1000 1000 0 - 0 - s
Ramp-up
P 0.0089 0.0089 0.0089 0.0089 0.089 1.5 As-2
E 0 0 300 0 300 0 sL 10 10 10 10 10 10 As-1
P -0.176 -0.176 -0.179 -0.18 -0.18 -1.5 As-2
Flattop current, 11.85 kA for 1000 1000 0 0 0 0 s
9/28/2010

29
Baseline (11)
9/28/2010
• Note how measurements 19, 22 and 23 take a different path then the others • This can be the effect of the fast PELP used to ramp up from 350 A to the next level • Measurements 18 and 20 join these three when using the same PELP• Decay occurs even when stopping at injection for 0 s
30
Conclusion
• Linear correlation has been confirmed once again• The flattop current scaling law has been confirmed• The ramp rate scaling law was extended to a lower value of
2 A/s, and it was found that the decay amplitude was a factor of 2 less, not 5.
• PELP values used to go from one plateau to the other (even between the pre-injection and the injection plateau) affects the amount of decay. – This was concluded after comparing two different ramps which
were used in two separate measurement campaigns.• Decay also occurs when a stop for 0 s followed by a slow
acceleration (restart of PELP) is done.9/28/2010

Analysis of August-September measurements
CERN, FiDeL meeting, 28th September 2010

32
List of measurementsMeasurement name DescriptionMeasurement 1 Actual pre-cycle up to 6kA (up-10A/s, down-10A/s), physics run up to 6kA (up-2A/s, down-
10A/s)Measurement 2 Physics run as pre-cycle (up-2A/s, down-10A/s), physics run up to 6kA (up-2A/s, down-
10A/s) (#1 and #2 are combined in 1 measurement)
Measurement 3 Actual pre-cycle up to 6kA (up-10A/s, down-10A/s), physics run up to 6kA (up-10A/s, down-10A/s)
Measurement 4 Physics run as pre-cycle (up-10A/s, down-10A/s), physics run up to 6kA (up-10A/s, down-10A/s) (#3 and #4 are combined in 1 measurement)
Measurement 5 Physics run as pre-cycle (up-10A/s, down-10A/s), physics run up to 6kA (up-10A/s, down-10A/s), normal with no E
Measurement 6 Physics run as pre-cycle (up-10A/s, down-10A/s), physics run up to 6kA (up-10A/s, down-10A/s), 2 times normal, no E
Measurement 7 Physics run as pre-cycle (up-10A/s, down-10A/s), physics run up to 6kA (up-10A/s, down-10A/s), 4 times normal, no E
Measurement 8 Physics run as pre-cycle (up-10A/s, down-10A/s), physics run up to 6kA (up-10A/s, down-10A/s), 4 times normal, no E, no flattop
Measurement 9 Physics run as pre-cycle (up-10A/s, down-10A/s), physics run up to 6kA (up-10A/s, down-10A/s), 4 times normal, no E, fast parabolic
9/28/2010

33
Aim of the measurements
• Difference between using an actual pre-cycle as a pre-cycle and using the previous physics run as a pre-cycle
• Effect of ramping up with 2 A/s and ramping down with 10 A/s.
• Modifying the PELP
9/28/2010

34
Aim of measurements 1 to 4
0 2000 4000 6000 8000 10000 12000 14000 16000 180000
1000
2000
3000
4000
5000
6000
7000
Time (s)
Cur
rent
(A)
meas 1+2
9/28/2010
• Difference between using an actual pre-cycle and a physics run as a pre-cycle• The effect of ramping up with 2 A/s and down with 10 A/s
• End of July, ramp up and ramp down rates of pre-cycle were 10 A/s, ramp up of physics run was 10 A/s and ramp down was 2 A/s
0 2000 4000 6000 8000 10000 12000 140000
1000
2000
3000
4000
5000
6000
7000
Time (s)
Cur
rent
(A)
meas 3+4

35
Results of measurements 1 to 4
• No difference between using an actual pre-cycle or a physics run as a pre-cycle (within 20%)
• Decay amplitude depends on the ramp down rate (not ramp up rate)
9/28/2010
740 745 750 755 760 765 770 775 780 785 790-5.1
-5
-4.9
-4.8
-4.7
-4.6
-4.5
-4.4
-4.3
Current (A)
b 3 (uni
ts)
meas 3meas 4
740 745 750 755 760 765 770 775 780 785 790
-5.7
-5.6
-5.5
-5.4
-5.3
-5.2
-5.1
-5
Current (A)
b 3 (uni
ts)
meas 2meas 4

36
Measurements 4 and 5
• Aim:– Exponential part of the ramp removed (PLP)
• Result– No effect on the decay amplitude
9/28/2010
0 2000 4000 6000 8000 10000 120000
1000
2000
3000
4000
5000
6000
7000
Time (s)
Cur
rent
(A)
meas 4meas 5
740 745 750 755 760 765 770 775 780 785 790-5.1
-5
-4.9
-4.8
-4.7
-4.6
-4.5
-4.4
-4.3
Current (A)
b 3 (uni
ts)
meas 4meas 5

37
Measurements 5 to 7
• Aim– Increasing the P term in the PLP
• Result– No difference in the decay amplitude
9/28/2010
0 1000 2000 3000 4000 5000 6000 7000 8000 9000 100000
1000
2000
3000
4000
5000
6000
7000
Time (s)
Cur
rent
(A)
meas 5meas 6meas 7

38
Measurements 7 and 9
• Aim– Acceleration term in all ramps (except the actual ramp) was increased
• Result– Decay amplitude increase by 65%
9/28/2010
0 1000 2000 3000 4000 5000 6000 7000 80000
1000
2000
3000
4000
5000
6000
7000
Time (s)
Cur
rent
(A)
meas 7meas 9
740 745 750 755 760 765 770 775 780 785 790-5.4
-5.2
-5
-4.8
-4.6
-4.4
-4.2
Current (A)
b 3 (uni
ts)
meas 7meas 9

39
Measurements 7 and 9
• Result– Different path taken by measurement 9 because of the fast
acceleration used9/28/2010