analysis of hospital oncology department pharmacy...
TRANSCRIPT

2012 Symposium on Human Factors and Ergonomics in Health Care
Analysis of Hospital Oncology Department Pharmacy Operations
Esa Rantanen, Joe Deeter, Sean Burke, and Yao Wang Rochester Institute of Technology, Rochester, NY
We performed a human reliability analysis of chemotherapy medication preparation for a comprehensive assessment of risks to both the pharmacy personnel and patients in a medium-sized hospital’s oncology de-partment. We employed techniques such as hierarchical task analysis, concept maps, Reason’s (1990) Ge-neric Error Modeling System (GEMS), and both qualitative and quantitative prospective Cognitive Relia-bility and Error Analysis Method (CREAM). Our results indicated that the pharmacist predominantly worked in tactical control mode, resulting in generally high performance reliability. We nevertheless identi-fied several issues for risk mitigation and made recommendations for further improvement of safety of the pharmacy operation. This project highlights the benefits of systematic analyses of apparently routine opera-tions. It also allowed us to evaluate both relative and combined merits of the methods used and test the fea-sibility of a novel technique, CREAM, in a healthcare application.
INTRODUCTION
Antineoplastic pharmaceutical agents (chemotherapy medications) are among the most toxic drugs used by healthcare providers to treat various forms of cancer (NIOSH, 2004). Healthcare workers are at great risk of exposure to the-se toxic chemical substances. Effects of exposure include can-cer, organ toxicity, fertility problems, genetic damage, and birth defects (OSHA, 2010a).
In addition to worker exposure to toxic chemicals, errors in chemotherapy medication preparation pose a severe risk to patients. Kloth (2009) reported an error rate of 3% in orders examined. Of those errors, only 45% were caught by pharma-cists or nurses before the drugs were administered to patients. A pharmacist was recently indicted for reckless homicide and involuntary manslaughter for a mistake made in preparing chemotherapy treatment for a pediatric patient in Ohio (Insti-tute for Safe Medicine Practices, 2009).
OSHA first published guidelines for the management of antineoplastic pharmaceutical agents in 1986 as a result of surveys, which found a lack of use of engineering controls and personal protective equipment in the workplace. Information provided in the OSHA Technical Manual outlines the scien-tific knowledge supporting their recommendations for the safe handling of antineoplastic agents. Worker exposure to toxic drugs occurs from inhalation, absorption, and ingestion. An OSHA survey of oncology clinics in the U.S. found a lack of standardization in work practices, equipment, and training for personnel (OSHA, 2010b). OSHA reported that nurses were less protected than pharmacists.
The research reported in this paper was performed as part of a graduate engineering psychology course at Rochester In-stitute of Technology. We had an opportunity to observe the work of a pharmacist in a medium-sized hospital’s oncology department and interview the department personnel about their practices of chemotherapy drug preparation and administration to the patients. We used several methods to examine the relia-bility of the pharmacy operations and estimate the probabili-ties of human error in preparation and administration of chem-otherapy drugs. These methods included concept maps, hierar-chical task analysis, analyses of human error by the skills, rules, and knowledge (SRK) framework of Rasmussen (1983), Reason’s (1990) generic error modeling system (GEMS), and
analysis using the Cognitive Reliability and Error Analysis Method (CREAM) developed by Hollanagel (1998). We also analyzed the usability of the computer interface for handling drug orders from physicians treating the patients.
METHOD
Observations
Observations of the pharmacist in the hospital oncology department were conducted by four separate observers on four different occasions. The observation periods spanned a week and lasted between two and four hours. Pharmacist actions were noted on a paper template by activity and task. We also had the opportunity between orders to hear the pharmacist ex-plain the procedures and tasks performed and ask clarifying questions. Analyses
Concept maps. Individual observations were compiled to form a representation of the system image using a concept map (Novak, & Cañas, 2008). The concept map was created by the CmapTools software available from the Florida Insti-tute for Human and Machine Cognition (IHMC).
Hierarchical task analysis. HTA was used to illustrate and represent goals and actions of the pharmacist and other personnel involved in chemotherapy drug preparation and ad-ministration. HTA is a widely used technique that has been employed by experts in task analysis for over 40 years (Stan-ton, 2002). We performed detailed HTA was performed on two processes: (1) Processing a medication order and (2) Pre-paring a medication. We also included SRK and GEMS anal-yses within the HTA tables.
Prospective CREAM analysis. A qualitative and quantita-tive (extended-method) analysis using the CREAM technique was used to identify probable failures. The CREAM Navigator tool (Serwy & Rantanen, 2007) was used to rate Common Per-formance Conditions (CPCs) and identify the likely operator control mode (given the context provided by the CPCs). CPC ratings indicated which conditions were likely to result in re-duced performance, improved performance, or have no signif-icant effect on performance. These predictions of reliability
Cop
yrig
ht 2
012
Hum
an F
acto
rs a
nd E
rgon
omic
s S
ocie
ty. A
ll rig
hts
rese
rved
. 10.
1518
/HC
S-2
012.
9452
8940
1.00
5
27

2012 Symposium on Human Factors and Ergonomics in Health Care
were associated with classification groups within a human, technology, and organization (HTO) triad within CREAM, which connote associations between CPCs and human-centered, technological-centered, and organization-centered factors. These classification group associations were used to prioritize likely paths for analyses.
To begin the qualitative prospective analysis, a set of ini-tiating events was described. Taking in consideration the con-text (as described by the CPC ratings) and the likely operator control mode, a set of initiating events was identified from the HTAs. These initiating events were possible system failures. Using the "main forward links between classification groups" table (Hollnagel, 1998, p. 228), causes (general antecedents) were selected and matched to effects (general consequents). General consequents were either specific error modes or other classification groups. Where the general consequent was an-other classification group, the effect (general consequent) was considered the cause (general antecedent) for the next step in the analysis. These links were pursued until only possible er-ror modes were reached. The result of the qualitative analysis was a general description of likely paths from the initiating event through classification groups to likely error modes.
The quantitative prospective analysis (extended-method) builds upon the qualitative prospective analysis. A Cognitive Demands Profile was constructed for each HTA using the "list of critical cognitive activities" table (Hollnagel, 1998, p. 246). The cognitive demands profile allows for a systematic way to consider possible failure modes. The cognitive activities iden-tified in the Cognitive Demands Profile were grouped accord-ing to the general Contextual Control Model (COCOM) func-tions as listed in the "generic cognitive-activity-by-cognitive-demand matrix" table (Hollnagel, 1998, p 248). The COCOM functions are the four categories of functions that are influ-enced in each cognitive activity. For each task, the predomi-nant type of Cognitive Function Failure (CFF) was identified as "most likely" and matched to the associated task in the cog-nitive demands profile (in a one-to-one match). From these, CFFs were evaluated to be "credible" or "not credible" in the given context. Cogitive Failure Probabilities (CFPs) were used from the "nominal values and uncertainty bounds for cognitive function failures" table (Hollnagel, 1998, p. 252) to calculate the base CFP for each CFF. (The CFP's in CREAM take into account the effect of the operator control mode on each of the COCOM functions.) Weights were applied to the base CFPs from the "weighting factors for CPCs" table (Hollnagel, 1998, p. 255) to arrive at the adjusted CFP for each CFF. (Weights are the sum of the influence of each CPC rating on the COCOM functions.) The result of the quantita-tive analysis was a list of likely cognitive failure modes with associated probabilities for occurrence. These results can be used to identify failure modes and prioritize risk in order to develop action plans for risk mitigation. Interviews
Interviews were conducted with infusion center pharma-cists and nurses to obtain clarification on activities observed, identify unobservable cognitive activities, and validate accura-cy of the HTA's produced from direct observation. We spoke
with another pharmacist (different from the one we had ob-served) and other staff at the oncology department.
RESULTS
Concept Maps
We began the analysis by creating a concept map of the pharmacy operations using the IHMC CmapTools software. The workflow and process of chemotherapy drugs preparation and administration is depicted in Figure 1. There are several redundancies in the process that help in detection of any hu-man errors. For example, the pharmacist receives the order for a drug for an individual patient from a hand-filled order form that the pharmacist then enters into the computerized system. The system already contains information about the patient and the prescribing physician
Figure 1. A concept map showing the workflow of chemo-therapy drug preparation and administration to the patient. Hierarchical Task Analyses
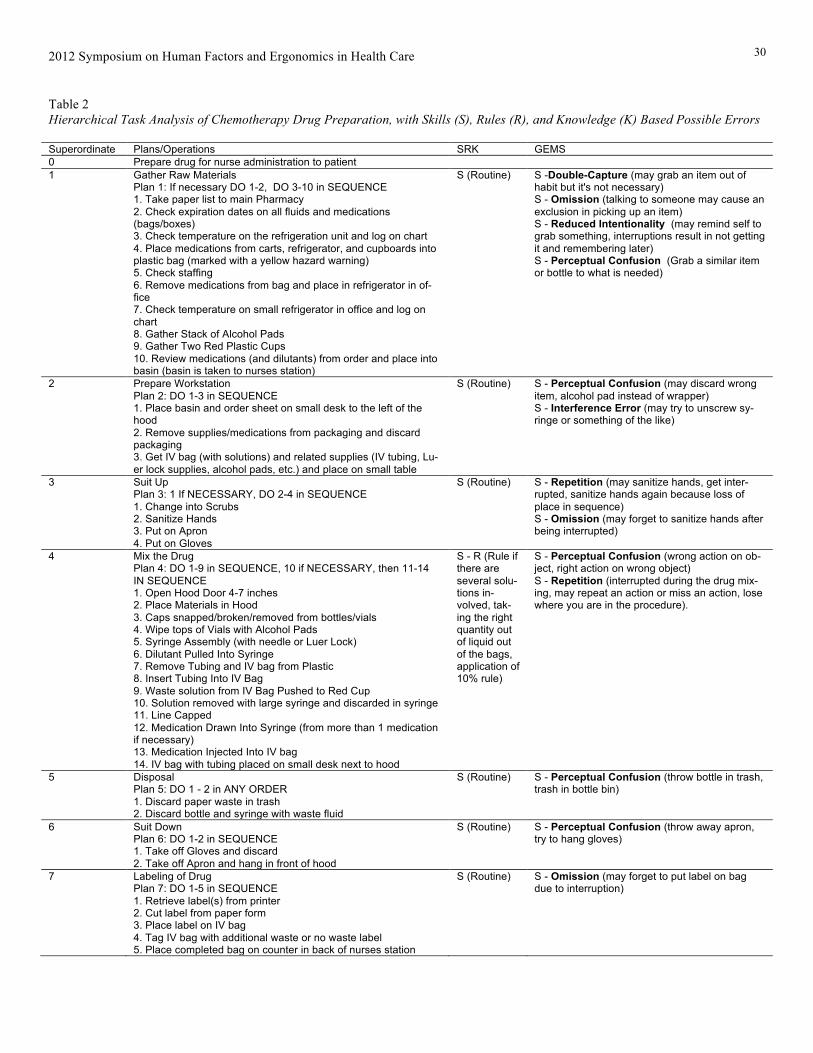
To develop the HTA's, system goals and sub-goals were identified. Tasks, consisting of operations to achieve a goal, were identified from the observation notes and interviews of the pharmacist and listed. When appropriate, sub-tasks, con-sisting of operations to achieve sub-goals, were listed. These tasks and sub-tasks were documented using a numerical hier-archy system (e.g. 1.0, 1.1, 1.11) and the order of operations was identified. An HTA plan was then identified and the order of operation was denoted using a hybrid form of Stanton's (2006) HTA notation. See Tables 1 and 2 for complete HTAs.
28

2012 Symposium on Human Factors and Ergonomics in Health Care
Table 1 Hierarchical Task Analysis of Chemotherapy Drug Order Processing, with Skills (S), Rules (R), and Knowledge (K) Based Possible Errors
Superordinate Plans/Operations SRK GEMS 0 PROCESS ORDER (received by fax or prior to scanning into system)
Plan 0: DO 1 OR 2, THEN 3, 4 IF NECESSARY, 5–6. 1. View physician order 2. Enter order data to PMM 3. If necessary, verify order with physician 4. File record on PMM Screen 5. Scan order into system 6. Send order to second pharmacist
S (Routine, may-be R if there is a discussion with physician over proper dose)
S – Double-Capture (if the order has an error, may continue to process order or send the order out of habit if inter-rupted). S – Omission (may forget to file the record due to interruption)
1 View physician order (on paper/fax) Plan 2: DO 1, THEN 2, IF 3 THEN 4-5 ELSE 4 1. Verify patient ID (2 identifiers) 2. Verify physician signature 3. Verify completeness and correctness of order 4. Verify order with physician 5. Check “Patients’ Own Medications” log book (for some type of pa-tients)
R (if the order is incomplete or ob-viously in error, possibly K; K if unreadable signa-tures, two patients have the same ID; examples of K: anticipation of er-ror correction, ad-justment for obese patient)
R – First Exception (if done by patient name only for verification, there could be two patients with the same last name). R – General Rules (in general, patients don't get their own medications, there-fore the drug is simply mixed and no checking is done) K - Overconfidence/Confirmation Bi-as (“If the physician is who I think it is, I'm sure the order is the way it's sup-posed to be, or conversely I'm sure the order is wrong”).
2 Enter order data to PMM Plan 3: DO 1, If NOT 1 THEN 2, THEN 3-5 IN SEQUENCE 1. If Patient is in the system, search for patient in system Master Pa-tient Index (MPI) 2. Ask the staff if they can register the patient 3. Enter FIN or MRN to look up patient 4. Compare and verify patient Info between PMM and RX VS 5. Verify prescribing doctor's math 6. Enter drug order in PMM 7. Check drug interaction alerts
S-R (Many forcing functions, the form only allows certain entries)
S - Double-capture (may start to check the math, may accidentally use an equation or frequency that he does most of the time) R - Reduced Intentionality (may search for the patient, not find the pa-tient, get interrupted and time passes, may forget to ask the staff to register patient).
3 Fill Out Medication Order Plan 4: DO 1-6 IN SEQUENCE, DO 7 IF NECESSARY, DO 8, DO 9 IF NECESSARY, DO 10, DO 11-13 IF NECESSARY, DO 14, DO 15 IF NECESSARY, DO 16-17 IN SEQUENCE, DO 18 IF NECESSARY, DO 19-20 IN SEQUENCE. 1. Fill out drug field 2. Fill out dose field 3. Fill out ordered as field 4. Fill out route field 5. Fill out frequency field 6. Fill out physician field 7. Fill out duration field 8. Fill out start Date field 9. Fill out stop Date field 10. Fill out stop Type field 11. Fill out order comments field 12. Fill out product notes field 13. Fill out dosage form 14. Fill out communication type field 15. Fill out order priority field 16. Fill out dispense category field 17. Fill out dispense from location field 18. Fill out initial dose field 19. Fill out billing formula field 20. Click OK button
S (Routine) S - Double-Capture (enter in a fre-quency or field that generally remains the same, but may be different in some instances) S - Omission (a field could easily be missed or skimmed over if interrupted)
4 File Record on PMM Screen Plan 4: DO 1 - 3 IN SEQUENCE 1. Click Print Button 2. Choose Printer 3. Hit OK
S (routine) S - Omission (forget to choose the cor-rect printer)
5 Scan order into system S (R if fax ma-chine or scanner is not operational)
S - Omission or Reduced Intentional-ity (may simply forget or a series of in-terruptions results in forgetting)
6 Put Order in Fax Machine/Scanner and fax to second pharmacist S (routine) S - Omission (could be interrupted, forget to press button).
29
2012 Symposium on Human Factors and Ergonomics in Health Care
Table 2 Hierarchical Task Analysis of Chemotherapy Drug Preparation, with Skills (S), Rules (R), and Knowledge (K) Based Possible Errors
Superordinate Plans/Operations SRK GEMS 0 Prepare drug for nurse administration to patient 1 Gather Raw Materials
Plan 1: If necessary DO 1-2, DO 3-10 in SEQUENCE 1. Take paper list to main Pharmacy 2. Check expiration dates on all fluids and medications (bags/boxes) 3. Check temperature on the refrigeration unit and log on chart 4. Place medications from carts, refrigerator, and cupboards into plastic bag (marked with a yellow hazard warning) 5. Check staffing 6. Remove medications from bag and place in refrigerator in of-fice 7. Check temperature on small refrigerator in office and log on chart 8. Gather Stack of Alcohol Pads 9. Gather Two Red Plastic Cups 10. Review medications (and dilutants) from order and place into basin (basin is taken to nurses station)
S (Routine) S -Double-Capture (may grab an item out of habit but it's not necessary) S - Omission (talking to someone may cause an exclusion in picking up an item) S - Reduced Intentionality (may remind self to grab something, interruptions result in not getting it and remembering later) S - Perceptual Confusion (Grab a similar item or bottle to what is needed)
2 Prepare Workstation Plan 2: DO 1-3 in SEQUENCE 1. Place basin and order sheet on small desk to the left of the hood 2. Remove supplies/medications from packaging and discard packaging 3. Get IV bag (with solutions) and related supplies (IV tubing, Lu-er lock supplies, alcohol pads, etc.) and place on small table
S (Routine) S - Perceptual Confusion (may discard wrong item, alcohol pad instead of wrapper) S - Interference Error (may try to unscrew sy-ringe or something of the like)
3 Suit Up Plan 3: 1 If NECESSARY, DO 2-4 in SEQUENCE 1. Change into Scrubs 2. Sanitize Hands 3. Put on Apron 4. Put on Gloves
S (Routine) S - Repetition (may sanitize hands, get inter-rupted, sanitize hands again because loss of place in sequence) S - Omission (may forget to sanitize hands after being interrupted)
4 Mix the Drug Plan 4: DO 1-9 in SEQUENCE, 10 if NECESSARY, then 11-14 IN SEQUENCE 1. Open Hood Door 4-7 inches 2. Place Materials in Hood 3. Caps snapped/broken/removed from bottles/vials 4. Wipe tops of Vials with Alcohol Pads 5. Syringe Assembly (with needle or Luer Lock) 6. Dilutant Pulled Into Syringe 7. Remove Tubing and IV bag from Plastic 8. Insert Tubing Into IV Bag 9. Waste solution from IV Bag Pushed to Red Cup 10. Solution removed with large syringe and discarded in syringe 11. Line Capped 12. Medication Drawn Into Syringe (from more than 1 medication if necessary) 13. Medication Injected Into IV bag 14. IV bag with tubing placed on small desk next to hood
S - R (Rule if there are several solu-tions in-volved, tak-ing the right quantity out of liquid out of the bags, application of 10% rule)
S - Perceptual Confusion (wrong action on ob-ject, right action on wrong object) S - Repetition (interrupted during the drug mix-ing, may repeat an action or miss an action, lose where you are in the procedure).
5 Disposal Plan 5: DO 1 - 2 in ANY ORDER 1. Discard paper waste in trash 2. Discard bottle and syringe with waste fluid
S (Routine) S - Perceptual Confusion (throw bottle in trash, trash in bottle bin)
6 Suit Down Plan 6: DO 1-2 in SEQUENCE 1. Take off Gloves and discard 2. Take off Apron and hang in front of hood
S (Routine) S - Perceptual Confusion (throw away apron, try to hang gloves)
7 Labeling of Drug Plan 7: DO 1-5 in SEQUENCE 1. Retrieve label(s) from printer 2. Cut label from paper form 3. Place label on IV bag 4. Tag IV bag with additional waste or no waste label 5. Place completed bag on counter in back of nurses station
S (Routine) S - Omission (may forget to put label on bag due to interruption)
30

2012 Symposium on Human Factors and Ergonomics in Health Care
GEMS Analysis
The generic error modeling system (GEMS; Reason, 1990) was used to illustrate basic error types within the pro-cessing of a medication order and the drug mixing process. GEMS was selected due to its advancements over Ras-mussen's (1983) skill-rule knowledge classification. Based on observations and the hierarchical task analysis, each plan and operation within the HTA was analyzed and determined to be at the skill, rule, or knowledge based level. Once the SRK framework was developed, GEMS analysis was conducted based on the performance level of each plan/operation and the potential failure modes the Pharmacist may fall into. Although not all possible error modes are represented in each plan/operation, our GEMS investigation contains what we be-lieve to be the most plausible or most common error modes based on the environment.
Our GEMS evaluation revealed that in most circumstanc-es, the physician was operating within the skill-based level, with few if any circumstances that would lead to operation at the knowledge-based level. In the task of processing drug or-ders skill-based double-capture slips, omissions, and reduced intentionality were predominant possible error modes. First exceptions and general rules were the two potential rule-based errors identified. Perhaps most important, however, is the sin-gle possible knowledge-based error of overconfidence/confir-mation bias. Although a second pharmacist will check the drug order (see Figure 1) the first pharmacist seldom waited for confirmation before proceeding with the drug preparation.
Computer System Usability Evaluation
We also performed usability analysis of the computer sys-
tem used to process drug orders. The system consists of two sid-by-side displays. When a new order comes in it is dis-played as a scanned facsimile of the physician’s hand-filled and signed order form on the right-hand screen On the left-hand screen is another database, where the pharmacist enters the order data by hand. The faxed order form could be anno-tated on the right display and was permanently archived in the system and thus retrievable at any time, with any comments. The faxed form also contained patient ID information, both a medical record number (MRN) and a financial number (FIN). The left system also had an automated “interaction interface” that flags potential interactions between the drugs the patient was receiving. Copying information from the right screen to the left by hand serves as a check for any errors in the physi-cian’s order by the pharmacist. On the other hand, the proce-dure also introduces a potential for copying errors.
The drug interaction notifications system is too sensitive resulting in frequent acknowledgment and entries into the in-teraction interface (it cannot be ignored). Automated drug in-teraction notification appears to be a necessary system, but it should allow the user to choose sensitivity for different kinds of drugs. The system had a history of other kind of “sensitivi-ty”, too, as clicks on wrong areas or with wrong mouse but-tons cause the system to crash.
The system automatically populates many of the fields when a patient is selected. Pharmacist only needs to check the
dose of the drug and other related drug information. However, the user must often check another document (chemo prep ref-erence or clinical pharmacology) to check the drug validity. The system should include the drug information as a link or a pop up window. There is also no indication whether other pharmacists are viewing or editing the order. If one pharmacist is viewing the order, and the other pharmacist is accessing to the same order, the system will kick the first pharmacist out because only one pharmacist can view one order at a time. Fi-nally, the system uses terminology that requires a high level of domain-specific expertise to understand. This may be a prob-lem with less experienced users.
Despite the aforementioned problems revealed by our analysis, the computer system did not contribute to error prob-abilities in our other analyses. Experience and familiarity with the shortcomings of the system appears to be the best safe-guard against errors. Prospective CREAM Analysis
The CPC ratings were used to describe the context in which work is carried out. The CPC ratings were and their ef-fects on reliability are depicted in Table 3. Table 3 CPC Ratings and Their Effects on Reliability CPC Rating Effect on Reliability
Adequacy of organization Efficient Not significant
Working conditions Incompatible Reduced
Adequacy of MMI/operational support
Tolerable Not significant
Availability of procedure/plans Acceptable Not significant
Number of simultaneous goals
Matching cur-rent capacity
Not significant
Available time Adequate Improved
Time of day Day-time Not significant
Adequacy of training /experience
Adequate (lim-ited)
Not significant
Crew collaboration quality Deficient Reduced
The so-called CPC Triplet from Table 1 is Improved = 1,
Not Significant = 6, Reduced = 2, which makes the operator control mode “tactical”. The CPCs predict that reliability will be reduced in the categories "working conditions" and "crew collaboration quality". The general cause of "working condi-tions" can lead to two general effects, (1) failures in temporary person-related functions and (2) failures in planning. The CPCs also predict that reliability will be improved in the cate-gory "available time".
Given the relationship between the CPCs and general cat-egories of causes, the improved performance prediction for person-related causes negates the reduced performance predic-tion for the same causes. The remaining general effect "plan-ning" is also a general effect for "communication". Therefore, failures in communication are the most likely failures to occur within the context provided by the CPCs.
31

2012 Symposium on Human Factors and Ergonomics in Health Care Table 4 Cognitive Demands Profile for sub-goal #4 in the HTA (Table 2), Prepare Drug for Administration Step Task Cog. Activity COCOM fn. All Potential CFF Credible Potential Error Modes Nominal CFP Range Weight Adj. CFP Range M CFP 4.0 Ensure
workspace ready
Evaluate Interpretation Planning
I1. Faulty diagnosis I2. Decision error I3. Delayed interpretation P1. Priority error P2. Inadequate plan
I1. (not credible) I2. Over/under-stocked resource I3. (not credible) P1. (not credible) P2. Over/under-stocked resource
0.09 - 0.6 0.001 - 0.1
0.001 - 0.01 0.001 - 0.1 0.001 - 0.1
4.5 4.5 4.5 2.5 2.5
0.405 - 2.7 0.0045 - 0.45
0.0045 - 0.045 0.0025 - 0.25 0.0025 - 0.25
1.55 0.23 0.02 0.13 0.13
4.1 Open Hood (4-7")
Execute Execution E1. Action of wrong type E2. Action at wrong time E3. Action on wrong object E4. Action out of sequence E5. Missed Action
E1. Hood opened too far (>8") E2. (not credible) E3. (not credible) E4. (not credible) E5. (not credible)
0.001 - 0.009 0.001 - 0.009
0.00005 - 0.005 0.001 - 0.009
0.025 - 0.04
7.5 7.5 7.5 7.5 7.5
0.0075 - 0.0675 0.0075 - 0.0675
0.000375 - 0.0375 0.0075 - 0.0675
0.1875 - 0.30
0.04 0.04 0.02 0.04 0.24
4.2 Listen (for buzzer)
Observe Observation O1. Wrong object observation O2. Wrong identification O3. Missed observation
01. (not credible) 02. (not credible) 03. Hood opened too far (>8")
0.0003 - 0.003 0.02 - 0.017 0.02 - 0.017
4.5 4.5 4.5
0.0135 - 0.0135 0.09 - 0.0765 0.09 - 0.0765
0.01 0.08 0.08
4.3 Select ma-terials
Execute Execution E1. Action of wrong type E2. Action at wrong time E3. Action on wrong object E4. Action out of sequence E5. Missed Action
E1. (not credible) E2. Over/under-stocked resource E3. Over/under-stocked resource E4. Over/under-stocked resource E5. Over/under-stocked resource
0.001 - 0.009 0.001 - 0.009
0.00005 - 0.005 0.001 - 0.009
0.025 - 0.04
7.5 7.5 7.5 7.5 7.5
0.0075 - 0.0675 0.0075 - 0.0675
0.000375 - 0.0375 0.0075 - 0.0675
0.1875 - 0.30
0.04 0.04 0.02 0.04 0.24
4.4 Place mate-rials (in hood)
Coordinate Planning Execution
P1. Priority error P2. Inadequate plan E1. Action of wrong type E2. Action at wrong time E3. Action on wrong object E4. Action out of sequence E5. Missed Action
P1. (not credible) P2. Material not available E1. (not credible) E2. (not credible) E3. Wrong material in hood E4. Wrong material in hood E5. Material not available
0.001 - 0.1 0.001 - 0.1
0.001 - 0.009 0.001 - 0.009
0.00005 - 0.005 0.001 - 0.009
0.025 - 0.04
2.5 2.5 7.5 7.5 7.5 7.5 7.5
0.0025 - 0.25 0.0025 - 0.25
0.0075 - 0.0675 0.0075 - 0.0675
0.000375 - 0.0375 0.0075 - 0.0675
0.1875 - 0.30
0.13 0.13 0.04 0.04 0.04 0.04 0.04
4.5 Examine caps (bot-tles/vials)
Evaluation Interpretation Planning
I1. Faulty diagnosis I2. Decision error I3. Delayed interpretation P1. Priority error P2. Inadequate plan
I1. Spill (contamination) I2. (not credible) I3. (not credible) I4. (not credible) I5. (not credible)
0.09 - 0.6 0.001 - 0.1
0.001 - 0.01 0.001 - 0.1 0.001 - 0.1
4.5 4.5 4.5 2.5 2.5
0.405 - 2.7 0.0045 - 0.45
0.0045 - 0.045 0.0025 - 0.25 0.0025 - 0.25
1.55 0.23 0.02 0.13 0.13
4.5 Remove caps (bot-tles/vials)
Execute Execution E1. Action of wrong type E2. Action at wrong time E3. Action on wrong object E4. Action out of sequence E5. Missed Action
E1. (not credible) E2. (not credible) E3. (not credible) E4. (not credible) E5. Needle-stick/damaged needle
0.001 - 0.009 0.001 - 0.009
0.00005 - 0.005 0.001 - 0.009
0.025 - 0.04
7.5 7.5 7.5 7.5 7.5
0.0075 - 0.0675 0.0075 - 0.0675
0.000375 - 0.0375 0.0075 - 0.0675
0.1875 - 0.30
0.04 0.04 0.02 0.04 0.24
4.6 Wipe vial (alcohol)
Execute Execution E1. Action of wrong type E2. Action at wrong time E3. Action on wrong object E4. Action out of sequence E5. Missed Action
E1. (not credible) E2. (not credible) E3. (not credible) E4. (not credible) E5. Vial not sterilized
0.001 - 0.009 0.001 - 0.009
0.00005 - 0.005 0.001 - 0.009
0.025 - 0.04
7.5 7.5 7.5 7.5 7.5
0.0075 - 0.0675 0.0075 - 0.0675
0.000375 - 0.0375 0.0075 - 0.0675
0.1875 - 0.30
0.04 0.04 0.02 0.04 0.24
4.7 Examine syringe (needle vs. Luer)
Evaluate Interpretation Planning
I1. Faulty diagnosis I2. Decision error I3. Delayed interpretation P1. Priority error P2. Inadequate plan
I1. (not credible) I2. (not credible) I3. (not credible) P1. (not credible) P2. (not credible)
0.09 - 0.6 0.001 - 0.1
0.001 - 0.01 0.001 - 0.1 0.001 - 0.1
4.5 4.5 4.5 2.5 2.5
0.405 - 2.7 0.0045 - 0.45
0.0045 - 0.045 0.0025 - 0.25 0.0025 - 0.25
1.55 0.23 0.02 0.13 0.13
4.8 Assemble syringe
Execute Execution E1. Action of wrong type E2. Action at wrong time E3. Action on wrong object E4. Action out of sequence E5. Missed Action
E1. (not credible) E2. (not credible) E3. (not credible) E4. (not credible) E5. Syringe not available
0.001 - 0.009 0.001 - 0.009
0.00005 - 0.005 0.001 - 0.009
0.025 - 0.04
7.5 7.5 7.5 7.5 7.5
0.0075 - 0.0675 0.0075 - 0.0675
0.000375 - 0.0375 0.0075 - 0.0675
0.1875 - 0.30
0.04 0.04 0.02 0.04 0.24
32

2012 Symposium on Human Factors and Ergonomics in Health Care Table 4 (continued) Step Task Cog. Activity COCOM fn. All Potential CFF Credible Potential Error Modes Nominal CFP Range Weight Adj. CFP Range M CFP 4.9 Assemble IV
(compo-nents)
Execute Execution E1. Action of wrong type E2. Action at wrong time E3. Action on wrong object E4. Action out of sequence E5. Missed Action
E1. (not credible) E2. (not credible) E3. (not credible) E4. (not credible) E5. IV not complete/available
0.001 - 0.009 0.001 - 0.009
0.00005 - 0.005 0.001 - 0.009
0.025 - 0.04
7.5 7.5 7.5 7.5 7.5
0.0075 - 0.0675 0.0075 - 0.0675
0.000375 - 0.0375 0.0075 - 0.0675
0.1875 - 0.30
0.04 0.04 0.02 0.04 0.24
5.10 Determine volume (of solution)
Evaluate Interpretation Planning
I1. Faulty diagnosis I2. Decision error I3. Delayed interpretation P1. Priority error P2. Inadequate plan
I1. Incorrect volume I2. (not credible) I3. (not credible) P1. (not credible) P2. (not credible)
0.09 - 0.6 0.001 - 0.1
0.001 - 0.01 0.001 - 0.1 0.001 - 0.1
4.5 4.5 4.5 2.5 2.5
0.405 - 2.7 0.0045 - 0.45
0.0045 - 0.045 0.0025 - 0.25 0.0025 - 0.25
1.55 0.23 0.02 0.13 0.13
5.11 Waste solu-tion (from IV bag into waste cup)
Monitor Observation Interpretation
O1. Wrong object observation O2. Wrong identification O3. Missed observation I1. Faulty diagnosis I2. Decision error I3. Delayed interpretation
O1. Wrong bag selected O2. Incorrect volume wasted O3. Incorrect volume wasted I1. (not credible) I2. (not credible) I3. (not credible)
0.0003 - 0.003 0.02 - 0.017 0.02 - 0.017
0.09 - 0.6 0.001 - 0.1
0.001 - 0.01
4.5 4.5 4.5 4.5 4.5 4.5
0.0135 - 0.0135 0.09 - 0.0765 0.09 - 0.0765
0.405 - 2.7 0.0045 - 0.45
0.0045 - 0.045
0.01 0.08 0.08 1.55 0.23 0.02
5.12 Cap line Execute Execution E1. Action of wrong type E2. Action at wrong time E3. Action on wrong object E4. Action out of sequence E5. Missed Action
E1. (not credible) E2. (not credible) E3. (not credible) E4. (not credible) E5. Spill (contamination)
0.001 - 0.009 0.001 - 0.009
0.00005 - 0.005 0.001 - 0.009
0.025 - 0.04
7.5 7.5 7.5 7.5 7.5
0.0075 - 0.0675 0.0075 - 0.0675
0.000375 - 0.0375 0.0075 - 0.0675
0.1875 - 0.30
0.04 0.04 0.02 0.04 0.24
5.13 Select medi-cation (vial)
Execute Execution E1. Action of wrong type E2. Action at wrong time E3. Action on wrong object E4. Action out of sequence E5. Missed Action
E1. (not credible) E2. (not credible) E3. Wrong medication E4. (not credible) E5. No medication
0.001 - 0.009 0.001 - 0.009
0.00005 - 0.005 0.001 - 0.009
0.025 - 0.04
7.5 7.5 7.5 7.5 7.5
0.0075 - 0.0675 0.0075 - 0.0675
0.000375 - 0.0375 0.0075 - 0.0675
0.1875 - 0.30
0.04 0.04 0.02 0.04 0.24
5.14 Draw medi-cation (into syringe)
Monitor Observation Interpretation
O1. Wrong object observation O2. Wrong identification O3. Missed observation I1. Faulty diagnosis I2. Decision error I3. Delayed interpretation
01. (not credible) 02. Incorrect amount withdrawn 03. (not credible) I1. (not credible) I2. Incorrect amount withdrawn I3. (not credible)
0.0003 - 0.003 0.02 - 0.017 0.02 - 0.017
0.09 - 0.6 0.001 - 0.1
0.001 - 0.01
4.5 4.5 4.5 4.5 4.5 4.5
0.0135 - 0.0135 0.09 - 0.0765 0.09 - 0.0765
0.405 - 2.7 0.0045 - 0.45
0.0045 - 0.045
0.01 0.08 0.08 1.55 0.23 0.02
5.15 Check medi-cation (in sy-ringe)
Verify Observation O1. Wrong object observation O2. Wrong identification O3. Missed observation
01. (not credible) 02. Amount checked incorrect 03. Amount not checked
0.0003 - 0.003 0.02 - 0.017 0.02 - 0.017
4.5 4.5 4.5
0.0135 - 0.0135 0.09 - 0.0765 0.09 - 0.0765
0.01 0.08 0.08
5.16 Inject medi-cation (IV bag)
Execute Execution E1. Action of wrong type E2. Action at wrong time E3. Action on wrong object E4. Action out of sequence E5. Missed Action
E1. (not credible) E2. (not credible) E3. Medication in wrong bag E4. (not credible) E5. No medication injected
0.001 - 0.009 0.001 - 0.009
0.00005 - 0.005 0.001 - 0.009
0.025 - 0.04
7.5 7.5 7.5 7.5 7.5
0.0075 - 0.0675 0.0075 - 0.0675
0.000375 - 0.0375 0.0075 - 0.0675
0.1875 - 0.30
0.04 0.04 0.02 0.04 0.24
5.17 Label bag Record Interpretation Execution
I1. Faulty diagnosis I2. Decision error I3. Delayed interpretation E1. Action of wrong type E2. Action at wrong time E3. Action on wrong object E4. Action out of sequence E5. Missed Action
I1. (not credible) I2. Bag labeled incorrectly I3. Bag not labeled E1. (not credible) E2. (not credible) E3. Bag labeled incorrectly E4. (not credible) E5. Bag not labeled
0.09 - 0.6 0.001 - 0.1
0.001 - 0.01 0.001 - 0.009 0.001 - 0.009
0.00005 - 0.005 0.001 - 0.009
0.025 - 0.04
4.5 4.5 4.5 7.5 7.5 7.5 7.5 7.5
0.405 - 2.7 0.0045 - 0.45
0.0045 - 0.045 0.0075 - 0.0675 0.0075 - 0.0675
0.000375 - 0.0375 0.0075 - 0.0675
0.1875 - 0.30
1.55 0.23 0.02 0.04 0.04 0.02 0.04 0.24
33

2012 Symposium on Human Factors and Ergonomics in Health Care
The general cause of "communication" (which most closely represents "crew collaboration quality") can lead to several general effects: (1) failures in execution, (2) failures in observation, (3) failures in temporary person-related functions, (4) failures in planning, and (5) failures in working conditions. These effects are selected for further analysis that will exam-ine links between cause and effect which are possible (given the CPCs).
The control mode in which the operator (pharmacist) works is best characterized as tactical control. Operator per-formance reliability in tactical control is primarily rule-based according to a predefined plan. Hollnagel (2008) proposed that there is a relationship between operating in a tactical control mode and increased (high) performance reliability.
Table 4 depicts the Cognitive Demands Profile for sub-goal 4 in the HTA (Table 2), prepare drug for administration. Two categories of potential cognitive failures were predomi-nant in this process, (1) potential for action on the wrong ob-ject and (2) potential for missed action. Although not as fre-quent, the potential cognitive failure for faulty diagnosis has the highest Cognitive Failure Probability score.
DISCUSSION
The operations at the hospital oncology department phar-macy we were privileged to observe, familiarize ourselves with, and analyze were indeed impressive in their reliability. There were also several redundancies built in the procedures and systems that would help in detecting errors before they re-sult in harm to the hospital personnel and/or patients. Alt-hough we did not discover any particular threats to the relia-bility of operations, we nevertheless make several recommen-dations to reduce the potential of errors even further.
(1) Technological solutions such as Computerized Pro-vider Order Entry (CPOE) and barcode scanning should be implemented to minimize potential for errors in processing the physicians’ drug orders.
(2) All supplies should be labeled at all times. Presently some of the equipment used in preparation of drugs may be unlabeled.
(3) Explicit (documented) confirmations should always be obtained from the order verification by the second pharmacist or the second nurse.
(4) The medication preparation workspace should be relo-cated to where access is restricted to only the operator while medications are being prepared. The pharmacist did not com-plain about the present, somewhat crowded location of the “hood” and welcomed the company of the nurses at their sta-tions.
(5) A sturdy workspace with non-slip surface should be provided as a holding area before materials are placed in the safety cabinet. Presently, materials are places on a narrow, rolling table next to a high traffic area
(6) All personnel should periodically review the OSHA guidelines (especially those relating to safe work practices) for controlling exposure to hazardous drugs.
In general, the oncology department is very small and the operations there mostly routine. The nurses know all the pa-tients, who do not typically get exotic treatments, as well as the physicians. Anything extra-ordinary (e.g., errors) are there-fore likely to stand out and be noticed before any harm is done. A small staff that has worked together for a long time also facilitates effective communications.
REFERENCES
Hollnagel, E. (1998). Cognitive Reliability and Error Analysis
Method: CREAM. New York: Elsevier Science. Institute for Safe Medicine Practices (2009). Failed check sys-
tem for chemotherapy leads to pharmacist's no contest plea for involuntary manslaughter. ISMP Safety Alert Newsletter (http://www.ismp.org/Newsletters/acutecare/ articles/20090423.asp).
Kloth, D. D. (2009). Guide to the prevention of chemotherapy medication errors. Clinical Oncology News, 1, 1-7.
National Institute for Occupational Health and Safety (2004). Preventing occupational exposure to antineoplastic and other hazardous drugs in health care settings. NIOSH Publication No. 2004-165:). Retrieved February 4, 2011 from http://www.cdc.gov/niosh/docs/2004-165/2004-165d.html
Novak, J. D. & Cañas, A. J. (2008). The theory underlying concept maps and how to construct them. IHMC Cmap-Tools Technical Report 2006-01 Rev. 01-2008. Florida Institute for Human and Machine Cognition.
Occupational Safety and Health Administration (2010a). Safe-ty and health topics: Hazardous drugs. Retrieved on Jan-uary 6, 2011 from http://www.osha.gov/SLTC/ hazard-ousdrugs/index.html
Occupational Satefy and Health Administration (2010b). OSHA Technical Manual. Retrieved on February 4, 2011 from http://www.osha.gov/dts/osta/otm/otm_vi/ otm_vi_2 .html.
Rasmussen, J. (1983). Skills, rules, and knowledge; signals, signs, and symbols, and other distinctions in human per-formance models. IEEE Transactions on Systems, Man, and Cybernetics SMC-13(3), 257-266.
Reason, J. (1990). Human error. New York, NY: Cambridge University Press.
Serwy, R. D. & Rantanen, E. M. (2007). Evaluation of a soft-ware implementation of the Cognitive Reliability and Er-ror Analysis Method (CREAM). Proceedings of the 51st Annual Meeting of the Human Factors and Ergonomics Society (pp. 1249–1253). Santa Monica, CA: HFES.
Stanton, N. A. (2006). Hierarchical task analysis: Develop-ments, applications and extensions. Applied Ergonomics, 37(1), 55–79.
34