analysis of heart rate dynamics by methods …jultika.oulu.fi/files/isbn9514250133.pdf · oulun...
TRANSCRIPT

OULU 1998
D470.book Page 1 Friday, August 7, 1998 3:01 PM
ANALYSIS OF HEART RATE DYNAMICS BY METHODS DERIVED FROM NONLINEAR MATHEMATICSClinical applicability and prognostic significance
TIMOMÄKIKALLIO
Department of Internal Medicine,University of Oulu
Merikoski Rehabilitation and ResearchCenter, Oulu

ANALYSIS OF HEART RATE DYNAMICS BY METHODS DERIVED FROM NONLINEAR MATHEMATICS Clinical applicability and prognostic significance
TIMO MÄKIKALLIO
D470.book Page 2 Friday, August 7, 1998 3:01 PM
Academic Dissertation to be presented with the assent of The Faculty of Medicine, University of Oulu, for public discussion in Auditorium 10 of the University hospital of Oulu, on May 15th, 1998, at 12 noon.
OULUN YLIOP ISTO, OULU 1998

Copyright © 1998Oulu University Library, 1998
OULU UOULU 1
ALSO A
ManuscrAccepte
CommuDocentDocent
ISBN 95
ISBN 95ISSN 03
ipt received 27 April 1998d 4 May 1998
nicated by Juha Mustonen Markku Mäkijärvi
VAILABLE IN PRINTED FORMAT
1-42-5013-3
NIVERSITY LIBRARY998
1-42-4960-755-3221 (URL: http://herkules.oulu.fi/issn03553221/)

able toh washods
on ofithoutwaveThencedom
ter
newflectsbsencehicht the
rtery0.01,Thenary
ctiontermcularermhancted).
insightormalk of
D470.book Page 4 Friday, August 7, 1998 3:01 PM
ABSTRACT
The traditional methods of analysing heart rate variability based on means and variance are undetect subtle but potentially important changes in interbeat heart rate behaviour. This researcdesigned to evaluate the clinical applicability and prognostic significance of new dynamical metof analysing heart rate behaviour derived from nonlinear mathematics.
The study covered four different patient populations, their controls and one general populatielderly people. The first patient group consisted of 38 patients with coronary artery disease wprevious myocardial infarction, the second of 40 coronary artery disease patients with a prior Q-myocardial infarction, and the third of 45 patients with a history of ventricular tachyarrhythmia.fourth group comprised 10 patients with a previous myocardial infarction who had experieventricular fibrillation during electrocardiographic recordings. The fifth group comprised a randsample of 347 community-living elderly people invited for a follow-up of 10 years afelectrocardiographic recordings.
Heart rate variability was analysed by traditional time and frequency domain methods. Thedynamical measures derived from nonlinear dynamics were: 1) approximate entropy, which rethe complexity of the data, 2) detrended fluctuation analysis, which describes the presence or aof fractal correlation properties of time series data, and 3) power-law relationship analysis, wdemonstrates the distribution of spectral characteristics of RR intervals, but does not reflecmagnitude of spectral power in different spectral bands.
Approximate entropy was higher in postinfarction patients (1.170.22), but lower in coronary adisease patients without myocardial infarction (0.930.17) than in healthy controls (1.03014, p<p<0.05 respectively). It did not differ between patients with and without ventricular arrhythmia.short term fractal-like scaling exponent of the detrended fluctuation analysis was higher in coroartery disease patients without myocardial infarction (1.340.15, p<0.001), but not in postinfarpatients without arrhythmia (1.060.13) compared with healthy controls (1.090.13). The shortexponent was markedly reduced in patients with life-threatening arrhythmia (0.850.25 ventritachycardia patients, 0.680.18 ventricular fibrillation patients, p<0.001 for both). The long tpower-law slope of the power-law scaling analysis was lower in the ventricular fibrillation group tin postinfarction controls without arrhythmia risk (-1.630.24 vs. -1.330.23, p<0.01) and predimortality in a general elderly population with an adjusted relative risk of 1.74 (95% CI 1.42-2.13
The present observations demonstrate that dynamic analysis of heart rate behaviour gives newinto analysis of heart rate dynamics in various cardiovascular disorders. The breakdown of the nfractal-like organising principle of heart rate variability is associated with an increased rismortality and vulnerability to life-threatening arrhythmias. .
Keywords:dynamic analysis, non-linear methods, heart rate variability.

D470.book Page 5 Friday, August 7, 1998 3:01 PM
Prediction is difficult, especially of the future
NEILS BOHR

6
ityskiand
thus
rage-
as aude
forieve
this
hisarchc-
ne
ScPhD.im.e is
olar
or
ero
renut
eppoable
D470.book Page 6 Friday, August 7, 1998 3:01 PM
Acknowledgements
This work was carried out at the Department of Internal Medicine, Oulu UniversCentral Hospital, during 1994–1998. Part of the work was carried out at the MerikoRehabilitation and Research Center, Oulu. I would like to share the enthusiasmwarmly thank all the people who have influenced my work, one way or another, andcontributed to this thesis:
– Professor Antero Kesäniemi, Head of the Department, for his support and encoument.
– Associate Professor Heikki Huikuri — it has been a great privilege to have himteacher and apart from scientific instruction, I am deeply grateful to him for his attittowards life in general.
– Doctor Matti Anttonen, Head of Merikoski Rehabilitation and Research Center,financial support and encouragement. Without a bit of madness, you will not achanything.
– MSc Mikko Tulppo, is most gratefully acknowledged, for all the shared phases ofwork that we have waded through together.
– Docent Juhani Airaksinen for his unselfish support, Doctor Juhani Koistinen forunforgettable history lessons, and the investigators of our heart dynamics resegroup, Doctor Antti Ylitalo, Doctor Juha Perkiömäki, Doctor Sirkku Pikkujämsä, Dotor Jari Tapanainen, Doctor Aino-Maija Poutiainen, for their advice and support.
– The expertise of our research staff, Markku Linnaluoto MSc, Pirkko Huikuri RN, AnLehtinen RN and Päivi Karjalainen RN is most sincerely acknowledged.
– The expertise of my co-authors, PhD Tapio Seppänen, Doctor Matti Niemelä, MIsmo Räihä, PhD Pauli Puukka, Professor Leif Sourander, Doctor Tiina Ristimäe,Chung-Kang Peng and Professor Ary Goldberger, is most sincerely acknowledged
– Timo Karppinen, is most warmly thanked. I am honoured to have a co-worker like hHe has 2 silver metals from orienteering world championships in his pocket, and hstill hunting for the gold.
– The expertise of PhD Seppo Nissilä and the technical and financial support of PElectro Oy.
– Mr. Malcolm Hicks, who revised the language of most of the original papers.– My dear parents Heikki and Raija Mäkikallio and my wife’s father Oiva Pyhäjärvi f
love and support that never failed.– My sister Kaarin Mäkikallio and her family for support and care and my brother E
Mäkikallio for love and help with understanding signal behaviour.– My wife Anne for her patience and loving support during this process and my child
Iida and Heikki, without whom this work would only have taken half of the time, bmight have left me with less joy in life.
– Finnish Foundation for Cardiovascular Research, Finnish Medical Foundation, SSäynäjäkangas Research Foundation and Aarne Koskelo Foundation for valufinancial support.
Oulu, February 1998 Timo Mäkikallio

al
D470.book Page 7 Friday, August 7, 1998 3:01 PM
Abbrevations
α1 short term fractal-like correlations of RR interval dataα2 long term fractal-like correlations of RR interval dataβ slope of the power-law relationship of RR interval dataCAD coronary artery diseaseECG electrocardiographyEF ejection fractionHF high frequencyHR heart rateLF low frequencyMI yocardial infarctionNSVT nonsustained ventricular tachycardiaNYHA New York Heart AssociationSD standard deviationSD1 standard deviation of instantaneous beat-to-beat variabilitySD2 standard deviation of continuous long term RR interv
variabilitySDANN standard deviation of RR intervals of measured segmentSDNN standard deviation of RR intervals of 24-hour recordingVF ventricular fibrillationVLF very low frequencyVPB ventricular premature beatVT ventricular tachycardiaULF ultra low frequency

8
D470.book Page 8 Friday, August 7, 1998 3:01 PM

ing
teres.
stion.
errdia
K,ular
B:rly.
D470.book Page 9 Friday, August 7, 1998 3:01 PM
List of original communications
This thesis is based on the following five publications, which are cited in the text usthe Roman numerals I-V.
I Mäkikallio TH, Ristimäe T, Airaksinen KEJ, Peng CK, Golgberger AL, Huikuri H V: Heart radynamics in patients with stable angina pectoris and utility of fractal and complexity measuAm J Cardiol 1998;81:27-31
II Mäkikallio TH, Seppänen T, Niemelä M, Airaksinen KEJ, Tulppo M, Huikuri HV: Abnormalitiein beat to beat complexity of heart rate dynamics in patients with a previous myocardial infarcJ Am Coll Cardiol 1996;28:1005-11
III Mäkikallio TH, Seppänen T, Airaksinen KEJ, Koistinen JM, Tulppo MP, Peng CK, GoldbergAL, Huikuri HV: Dynamic analysis of heart rate may predict subsequent ventricular tachycaafter myocardial infarction. Am J Cardiol 1997;80:779-783
IV Mäkikallio TH, Koistinen J, Jordaens L, Tulppo MP, Wood N, Golosarsky B, Peng CGoldberger AL, Huikuri HV: Heart Rate dynamics before the spontaneous onset of ventricfibrillation. Submitted to J Am Coll Cardiol 1998
V Huikuri HV, Mäkikallio TH, Airaksinen KEJ, Seppänen T, Puukka P, Räihä IJ, Sourander LPower-law relationship of heart rate variability as a predictor of mortality in the eldeCirculation 1998, in press

10
D470.book Page 10 Friday, August 7, 1998 3:01 PM
sm togingnceed inn thend notionhownmiction
cularthe
, the
ause
r ofal andeouse ofse tohods
sPincus
thodsional
D470.book Page 11 Friday, August 7, 1998 3:01 PM
1. Introduction
The cardiovascular concept of homeostasis refers to the tendency of the organimaintain a relatively regular heart rate and blood pressure in the face of chanenvironmental conditions. No physiological variable, however, will give a time sequethat is absolutely stationary or periodic. Spontaneous fluctuations can be observcardiovascular functions, such as heart rate and blood pressure, even wheenvironmental parameters are maintained at as constant a level as possible aperturbing influences can be identified. Since the possible significance of this fluctuawas realised, heart rate variability has been widely studied. Several studies have sthat decreased fluctuation of RR intervals implicates an increased risk for arrhythevents and an increased mortality rate in patients with a previous myocardial infarc(Kleiger et al. 1987, Farrellet al. 1991, Biggeret al. 1992).
Since the observation that heart rate fluctuation is related to various cardiovasdisorders, the analysis of heart rate variability has become a widely used tool inassessment of the regulation of heart rate behaviour (Akselrodet al. 1981, Paganiet al.1986, Huikuriet al. 1995). Because cardiovascular function is not a stationary systemtraditional indexes of heart rate variability (Kleigeret al. 1992, Öriet al. 1992) may lackthe ability to detect subtle but important changes in heart rate behaviour. Becnonlinear mechanisms are also involved in the genesis of heart ratedynamics (Goldberger& West 1987, Babyloyantz & Destexhe 1988), analysis of the dynamic behavioucardiac signals has opened up a new approach towards the assessment of normpathological cardiovascular behaviour. It has been hypothesised that spontanfluctuation in the dynamics of cardiovascular function may protect the system in casacute perturbations, and that abnormalities in dynamic behaviour may predispoabrupt changes in cardiovascular function (Goldberger 1996). A number of new methave been recently developed to quantify complex heart rate dynamics (Penget al. 1995,Pincuset al. 1992, Yamamotoet al. 1991). They may reveal abnormalities in time-seriedata that are not apparent when conventional statistics are used (Goldberger 1996,et al. 1994, Iyengaret al. 1996, Fleisheret al. 1993).
This study was designed to test the hypothesis that some dynamical analysis mecan reveal subtle abnormalities in heart rate behaviour and complement the traditmethods of analysing heart rate variability in various pathological conditions.

12
D470.book Page 12 Friday, August 7, 1998 3:01 PM

m oneility tooralaveofither
-to-, thehisdere
littlen
acity.ing
nts ofcent
catesith aal.ided
thenewaviour
D470.book Page 13 Friday, August 7, 1998 3:01 PM
2. Review of the literature
2.1. History of heart rate variability
Various cardiovascular variables, such as heart rate and blood pressure, fluctuate frobeat to another. Stephen Hales (Hales 1733) reported beat-to-beat heart rate variabbe synchronous with respiration (respiratory sinus arrhythmia). Although the tempfluctuations in cardiovascular signals were noted in ancient times, physicians hoverlooked for a long time the possible significance of beat-to-beat fluctuationcardiovascular signals. This variability has generally been treated as noise to be eignored or averaged out. The field in which the potential clinical significance of beatbeat variability in cardiovascular signals was first recognised was obstetrics. In 1965importance of sinus arrhythmia was described in relation to fetal monitoring. Tvariability correlated with fetal viability; diminution of beat-to-beat variability indicatefetal compromise (Hon & Lee 1965). Initially, heart rate variability measurements wbased on simple measurements of RR intervals in studies on diabetics (Murrayet al.1975).
Subtle beat-to-beat fluctuations in cardiovascular signals have received onlyat ten t io n un t i l re cen t ly, m os t pr ob ab ly du e t o a lac k of h igh r eso l u t ioelectrocardiographic recordings and digital computers with adequate calculation capSince the introduction of such computers, computation of heart rate variability usvarious algorithms to assess the frequency and amplitude of the oscillatory componeheart rate behaviour has been possible (Kay & Marple 1981, Akselrod et al. 1981). Restudies have shown that decreased fluctuation of RR intervals is not noise, but implian increased risk for arrhythmic events and an increased mortality rate in patients wprevious myocardial infarction (Kleiger et al. 1987, Farrell et al. 1991, Bigger et1992). Time and frequency domain measures of heart rate variability have provprognostic information and also made it possible to perform noninvasive studies onsignificance of changes in the regulation of heart rate behaviour. Most recently,methods based on nonlinear dynamics have also been introduced for heart rate behanalysis.
14
ouslatoryheartes incause
eartThendatedet al.tion
yanogh-ex ofcyt al.olinelow
ationost
ges ofelllysisraterialeralgestedt thems oflteringeart
omate
d byboutell asc andtatic
D470.book Page 14 Friday, August 7, 1998 3:01 PM
2.2. Physiological background of heart rate variability
Beat-to-beat fluctuation in heart rate partly reflects the interplay between variperturbations of cardiovascular function and the response of the cardiovascular regusystems to these perturbations and also initially raised behaviour. The changes inrate behaviour may be either exogenous or endogenous. Continuous changsympathetic and parasympathetic neural impulses exhibits changes in heart rate andoscillation around the mean heart rate.
A relatively well known event that causes oscillations in heart rate is respiration. Hrate fluctuation is related to respiration due to the inspiratory inhibition of vagal tone.inspiratory inhibition is evoked primarily by central impulses from the medullary acardiovascular center (Davidson et al. 1976). This parasympathetically medifluctuation can be abolished by atropine or vagotomy (Akselrod et al. 1985, McCabe1985, Raczkowska et al. 1983, Pomeranz et al. 1985). RR interval fluctuation in relato respiration is used as a noninvasive index of vagal nerve excitation in humans (Het al. 1991, Eckberg 1983, Kollai & Mizsei 1990). However, respiration related hifrequency heart rate fluctuation has been shown to be a somewhat imperfect indvagal activity (Kollai & Mizsei 1990). There are situations in which high frequenchanges of RR intervals may not reflect changes in vagal modulation at all (Brown e1993), but can be explained by the kinetics of sino-atrial node responses to acetylch(Saul et al. 1991). This respiration caused fluctuation occurs at both high andfrequencies (Koh et al. 1994).
Sympathetic excitations have been suggested to correspond to RR interval fluctuat around 0.1 Hz frequency (Malliani et al. 1991, Pagani et al. 1997). However, mevidence does not support the notion that low frequency spectral power detect chansympathetic nerve activity (Koh et al. 1994, Hopf et al. 1995, Saul et al. 1990, Kingwet al. 1994). The phenomenon of sympatho-vagal balance in heart rate variability anacan also be questioned (Eckberg 1997). One fluctuation loop affecting heartvariability is the vasomotor part of the baroreflex loop, which is responsible for artepressure oscillations (Madwed et al. 1989), causing low frequency fluctuation. Sevother factors, such as peripheral vascular resistance and thermoregulation, are sugto cause very low frequency oscillation (Rosenbaum & Race 1968, Kitney 1975), burelevance of these suggestions can be questioned. In addition, rapid control systepressoreceptors and chemoreceptors maintain the cardiovascular homeostasis by athe heart rate through small frequent adjustments (Ravenswaaij-Arts et al. 1993). Hrate fluctuation is also a result of various factors, which are often difficult to discern frtotal behaviour, which combine different wave forms. Thus, by studying heart rvariability, we have an opportunity to study the cardiac dynamic behaviour influencea variety of endogenous and exogenous factors. It is possible to obtain information athe nature of the perturbations to which the cardiovascular system is exposed as wthe regulatory responses to these perturbations. Since the process is dynaminonlinear, the usefulness of studying the behaviour of fluctuations rather than saverages is acknowledged.

15
rt rateents
vide992,
ed ontimeth ofiseram
ings.term
areof avalthearength.
RRby
owntionhisnottmeer 50ande RRliers,s have
D470.book Page 15 Friday, August 7, 1998 3:01 PM
2.3. Conventional methods of assessing heart rate variability
2.3.1. General
The changes in the sinus rate over time have been termed heart rate variability. Heavariability analysis has become an important tool in cardiology, because its measuremare noninvasive and easy to perform, have relatively good reproducibility and proprognostic information on patients with heart disease (Kleiger et al. 1992, Öri et al. 1Huikuri et al. 1995, David et al. 1994, Baselli et al. 1987, Ewing et al. 1984b).
2.3.2. Time domain analysis of heart rate variability
Conventionally, heart rate fluctuation has been assessed by calculating indices basstatistical operations on RR intervals (means and variance). The most widely useddomain index is the average heart rate. It is easy to calculate over a suitable lengtime. The calculations of other different time domain indices naturally require prectiming of R waves. Time domain analysis can be performed on short electrocardiogsegments (lasting from 0.5 to 5 minutes) or on 24-hour electrocardiographic recordBeat-to-beat or short term variability represents fast changes in heart rate. Long-variability indices mainly reflect slower fluctuation of RR intervals. These indicescalculated from the RR intervals occurring in a chosen time window. An exampleshort term variability index is the standard deviation of beat-to-beat RR interdifferences within the time window. The standard deviation of all the RR intervals ordifference between maximum and minimum RR interval length, within the windowexamples of long term indices. The value of the estimate depends on the record leTherefore, the measures should be compared within segments of similar length.
The most commonly used index is the standard deviation of all normal-to-normalintervals (SDNN) over a 24 h period. This recording length is commonly usedcardiologists to calculate heart rate variability. This index is probably also the best knheart rate variability index. Kleiger et al. (1987) estimated RR interval standard deviaover a 24 h period as a predictor of mortality in postmyocardial infarction patients. Testimate reflects primarily the very low frequency fluctuation in heart rate behaviour,the heart rate fluctuations in segments with a duration of< 1 minute, because these fasfluctuations of RR intervals “drown” under the slower waves. Other example of tidomain variables are NN50, which is a measure of the instantaneous difference ovms between two consecutive normal-to-normal RR intervals (Ewing et al. 1984),RMSSD, which is the square root of the mean squared differences of successivintervals. All the time domain measure indices could be affected by artefacts and outand these measures therefore require data from which artefacts and ectopic beatbeen carefully eliminated.

16
achesular
t andof thencyionas ahisbut
e the89)
whichn be6).RR
sifiedta bythe
verald from
bilityavebilityn ofentbilityitudeed oned toilarandrentlyds,used
been
D470.book Page 16 Friday, August 7, 1998 3:01 PM
2.3.2.1. Geometrical methods of heart rate variability analysis
Geometrical methods present RR intervals in geometric patterns and various approhave been used to derive measures of heart rate variability from them. The triangindex is a measure where the length of RR intervals serves as the x-axis of the plothe number of each RR interval length serves as the y-axis. The length of the basetriangle is used and approximated by the main peak of the RR interval frequedistribution diagram. Triangular interpolation approximates the RR interval distributby a linear function and the baseline width of this approximation triangle is usedmeasure of the heart rate variability index (Malik et al 1989, Farrell et al. 1991). Ttriangular index had a high correlation with the standard deviation of all RR intervals,it is highly insensitive to artefacts and ectopic beats, because they are left outsidtriangle. This reduces the need for preprocessing of the recorded data (Malik et al. 19
The Poincaré plot as another geometrical measure, is a diagram (scattergram) ineach RR interval is plotted as a function of the previous RR interval. Poincaré plots cainterpreted visually and also quantitatively (Huikuri et al. 1996, Tulppo et al. 199Instantaneous beat-to-beat variability of data and continuous long-term variability ofintervals can be calculated. In addition to the present quantitation, which can be clasas geometrical, the Poincaré plot also gives a useful visual scheme of the RR darepresenting qualitatively with graphic means the kind of RR variations included inrecording. The shape of the plot can be used to classify the signal into one of seclasses (Woo et al. 1994, Schechtman et al. 1993), and the irregular shapes quanfiePoincaré plots may then be classified as nonlinear.
2.3.3. Frequency domain measures of heart rate variability
Since the introduction of spectral analysis as a method for studying heart rate varia(Akselrod et al. 1981, Bloomfield 1976), an increasing number of investigators hutilized this method. The main advantage of spectral analysis of signals is the possito study their frequency-specific oscillations. Spectral analysis involves decompositiothe series of sequential RR intervals into a sum of sinusoidal functions of differamplitudes and frequencies. The result can be displayed with the magnitude of variaas a function of frequency (power spectrum). The power spectrum reflects the amplof the heart rate fluctuations present at different oscillation frequencies. Methods basFast Fourier transformation and autoregressive analysis are most commonly ustransform signals into the frequency domain. Practically speaking, both yield simresults. Investigators usually divide the power spectrum into different spectral bandscalculate the powers in these bands. The boundaries of these bands are defined diffeby different authors. The spectrum is usually divided into three or four different bandepending on the major frequency bands. The boundaries of the most commonlyfrequency bands are as follows: ultra low frequency< 0.0033 Hz, very low frequencyfrom 0.0033− 0.04 Hz, low frequency from 0.04− 0.15 Hz and high frequency from 0.15to 0.4 Hz. The boundaries that should be used in physiological studies have

17
ty ofd on a
ndergerearttimed by
ics ofsonheory
f theo thewasumedThis
ame
a tinyined
trongd toat a
d inwith
ernz
D470.book Page 17 Friday, August 7, 1998 3:01 PM
recommended by European Society of Cardiology and the North American SociePacing and Electrophysiology (Task Force, 1996). These recommendations are basesuggested, but only partly proved, physiological background of heart rate variability.
2.4. Dynamical analysis methods of heart rate behaviour
There is increasing evidence to suggest that the heart is not a periodic oscillator unormal physiologic conditions (Babyloyantz & Destexhe 1988, Kaplan & Goldber1987, Goldberger & West 1987), and the commonly employed moment statistics of hrate variability may not be able to detect subtle, but important changes in heart rateseries. Therefore several new analysis method of heart rate behaviour, motivatenonlinear dynamics and chaos theory, have been developed to quantify the dynamheart rate fluctuations (Goldberger & West 1987, Pincus 1991, Yamamoto & Hugh1991). The development of these new methods has been based on the Chaos T(Crutchfield et al. 1987).
2.4.1. History of chaotic and nonlinear dynamics
At the beginning of the 17th century, Johannes Kepler tried to prove the harmony ostructure of the solar system. The success of Newton’s principles of mechanics led tultimate predominance of determinism. The past and future of the material worldparticularised. Everything seemed to be perfectly predictable and causal. It was assthat a small inaccuracy in the baseline data leads to only a small error in prediction.is true of linear systems, where effect is proportional to cause.
After the development of the rules of statistical thermodynamics, however, it becclear that there was a limit to the mechanics of nature. Henry Poincare (1854−1912)showed that there are stable and unstable types of orbits and that sometimes evendisturbance in the system can bring about a change in the nature of the orbit. He exampredictability and noticed that systems are deterministic on the one hand, but the sprinciple of causality is violated on the other. He noticed that similar causes do not leasimilar effects. He concluded that there is no formula that relates the state of a systemgiven time to the state at some future time. Edward Lorenz was interestecomputerized weather forecasting and recognised that starting the computer programslightly different initial conditions eventually resulted in totally different weathconditions. This was clear evidence of a failure of the principle of causality (Lore1963).
18
thever
ss ornon-ism to
andand
ausee. Ifredictnd
uallyows:re nositiveitialr ises notis
987,
bola-iss can
iety of
tion.initeThesethere
D470.book Page 18 Friday, August 7, 1998 3:01 PM
2.4.1.1. Chaos
Chaos, in the technical sense, is used to denote a type of time evolution in whichdifference between two states that are initially closely similar grows exponentially otime. All systems have been shown to be linear, close to any static equilibrium, unleuntil there is a continuous injection of energy to excite the system enough to makelinearity appreciable and chaos possible. Chaos also requires a dissipative mechanprevent the system from blowing apart (Crutchfield et al. 1987, Gleick 1987).
Chaos is more easily understood through a comparison with randomnessperiodicity. Random behaviour never repeats itself and is inherently unpredictabledisorganised. Unlike random behaviour, periodic behaviour is highly predictable, becit always repeats itself over some finite time interval. A sine wave is a typical examplwe know the amplitude, frequency and phase of a sine wave at any instant, we can pthe wave perfectly at any other point in time. Chaos is distinct from periodicity arandomness, but has characteristics of both. It looks disorganised, but is actorganised. The most important criteria for chaotic behaviour are summarised as foll1. Chaos is deterministic and aperiodic and it never repeats itself exactly. There aidentifiable cycles that recur at regular intervals. 2. Most chaotic systems have sendependence on the initial conditions. In other words, very small differences in the inconditions will later result in large differences in behaviour. 3. Chaotic behaviouconstrained. Although a system appears random, the behaviour is bounded, and dowander off to infinity. 4. Chaotic behaviour has a definite form. The behaviourconstrained, and there is a particular pattern to the behaviour (Crutchfield et al. 1Gleick 1987, Ruelle 1979, Grassberger & Procaccia 1984, Procaccia 1988).
2.4.1.2. Nonlinearity and its relation to chaos
Nonlinear equations are of two types, monotonic and folded (i.e. exponential or paralike). This ambiguity gives rise to chaos under suitable conditions. Nonlinearitynecessary and fundamental to chaos and can also endow stability. Nonlinear systemseek out and maintain essentially the same optimum state in response to a wide varexternal conditions (Procaccia 1988, Jensen 1987, Devaney 1987).
2.4.1.3. Strange attractors
A simple attractor in which the orbit is a closed loop corresponds to sustained oscillaThis attractor is not chaotic. A chaotic attractor is a continuous curve confined to a fregion of phase space, which never crosses itself , and yet never closes on itself.attractors are called “strange attractors”. Chaotic behaviour is also constrained, andis a particular pattern to it (Freeman 1988, Mandelbrot 1982) .

19
ftenre onord
lingof
jectsy themeth 1oticelike”nals.
plem”.ired
lbrot
ty orplex1991,cedwith
er etgingopy
s theseriesof alld fored by
D470.book Page 19 Friday, August 7, 1998 3:01 PM
2.4.1.4. Fractal form
A Fractal system is a specific form of chaos. The geometry of chaotic attractors osuggests the existence of fractals. A fractal is a system which has the same structumany measurement scales. Mathematician Benoit Mandelbrot introduced the w“fractal” to refer to one of the fundamental properties of a specific structure: self-scasimilarity over a wide range of scales. This self-similarity occurs over an infinite rangescales in pure mathematical fractal structures and over a limited range in natural obor systems. The normal heart rate time series is fractal-like and seems to displafractal property of self-similarity over different time scales without a characteristic tiscale. The power spectra of heart rate time series have been shown to concur wi/fbehaviour, which is essential for fractal-like behaviour and also characteristic of chabehaviour. Normal heart rate time series have been shown to demonstrate a “strangattractor, which is characteristic of chaotic as opposed to random or periodic sigBased on this Ary Goldberger has concluded that “the most compelling clinical examof cardiac chaos is paradoxically found in the dynamics of the normal sinus rhythThese chaotic, fractal and nonlinear qualities of heartbeat behaviour have inspinvestigators to develop new analysing methods of heart rate behaviour (Mande1982, Goldberger 1996, Goldberger & West 1987, Yamamoto et al. 1995).
2.4.2. Approximate entropy analysis
Approximate entropy is a measure and parameter that quantifies the regularipredictability of time series data. It has been developed for time series to classify comsystems that include both deterministic chaotic and stochastic processes. (PincusPincus & Goldberger 1994, Pincus & Huang 1992, Pincus & Viscarello 1992). Reducomplexity of heart rate dynamics has been found in sick neonates and in patientspostoperative complications after cardiac surgery ( Pincus & Viscarello 1992, Fleishal. 1993). The obvious advantage of this method is its capability to discern chancomplexity from a relatively small amount of data. This makes the approximate entrmeasure applicable to a variety of contexts. This measure cannot certify chaos.
2.4.3. Detrended fluctuation analysis
The detrended fluctuation analysis technique is a measurement which quantifiepresence or absence of fractal correlation properties and has been validated for timedata (Peng et al. 1995). It was developed to characterise fluctuations on scaleslengths. The self-similarity occurring over an large range of time scales can be definea selected time scale with this method. The details of this method have been describPeng et al. (1995). Normal healthy subject have shown scaling exponent values (α) near

20
beenet al.
omitude
rvalis
tctlygestsls ofess et
ed ason ofnsrs”
o beight
s that
d asre ofhe
r theent isnentaos,). The
D470.book Page 20 Friday, August 7, 1998 3:01 PM
1, indicating fractal-like heart rate behaviour, and altered fractal-like behaviour hasreported in patients with cardiovascular diseases and with advancing age (Peng1995, Ho et al. 1997, Hausdorff et al. 1995, Iyengar et al. 1996).
2.4.4. Power-law relationship analysis of heart rate dynamics
The power-law relationship of RR interval variability is a spectral measure different frthe traditional measures of heart rate variability, because it does not reflect the magnof heart rate variability, but the distribution of the spectral characteristics of RR inteoscillations. In this method, the power-law relationship of RR interval variabilitycalculated from the frequency range of 10-4 to 10-2 Hz, characterising mainly slow hearrate fluctuations. The physiological background of the spectral distribution is not exaknown, but the observation of a significantly steeper slope in denervated hearts sugthat it is influenced by the autonomic input to the heart (Bigger et al. 1996). The detaithis method have been described previously (Saul et al. 1987, Bigger et al. 1996, Pral. 1995).
2.4.5. Two dimensional vector analysis
As described above, the Poincaré plot is a diagram in which each RR interval is plotta function of the previous one. The Poincaré plot gives a useful visual representatithe RR data by illustrating qualitatively with graphic means the kind of RR variatioincluded in the recording. The shape of the plot can be used to identify “attracto(Tulppo et al. 1996). In chaotic behaviour a particular pattern of behaviour needs tfound. The nonlinear relationship and structure in the plots indicate that the process mbe chaotic rather than random. It does not prove the existence of chaos, but indicatechaotic behaviour is likely.
2.4.6. Other nonlinear analysis methods
The Lyapunov numerical method (Wolf et al. 1985, Eckmann & Ruelle 1985) is usean adjunct to graphic analysis. The Lyapunov exponent is a quantitative measuseparation the trajectories that diverge widely from their initial close positions. Tmagnitude of this exponent is related to how chaotic the system is. The largeexponent, the more chaotic the system. For periodic signals, the Lyapunov exponzero. A random signal will also have an exponent of zero. A positive Lyapunov expoindicates sensitive dependence on the initial conditions and is diagnostic of chalthough these exponents are not easily measured (Grassberger & Procaccia 1984
21
rger the
ture5).the
er &88).
to beon.sionccia
isr &Thisistic
ut thetimeo thehods
lysis,
r ofre on&
ergerto bering. Themonoftenme
based
omeoweroticever,lethe
not behodsis ofour is
D470.book Page 21 Friday, August 7, 1998 3:01 PM
major limitation in their calculation is that the currently available algorithms require laamounts of data and long computing times. Also, the system must remain stable overecording time, but biologic systems seldom remain stable.
By evaluating the Haussdorff correlation dimension D, evidence of the chaotic naof cardiac activity can be obtained (Bergé et al. 1984, Eckmann & Ruelle 198Haussdorff dimension D is a measure of the complexity of the system. The lowervalue of D, the more coherent the dynamics. D= 1 presents periodic oscillations. If D hasnon-integer values greater than two, it defines a chaotic behaviour (GrassbergProcaccia 1983, Bergé et al. 1984, Eckmann & Ruelle 1985, Mayer-Kress et al 19Although D is a convenient measure, because it does not require the systemstationary, it unfortunately always involves a potentially large error of estimatiTherefore, instead of using D, it is more convenient to evaluate the correlation dimenD2 from a time series with the help of the existing algorithms (Grassberger & Proca1983 and b, Eckmann & Ruelle 1985).
Another important quantity of the characterisation of deterministic chaotic activityKolmogorov entropy K, which may be estimated by a procedure (GrassbergeProcaccia 1983b, Eckmann & Ruelle 1985) close to the one used for dimension D.quantity measures how chaotic an experimental signal is. In the case of determinchaos, K is positive and measures the average rate at which the information abostate of the system is lost over time. In other words, K is inversely proportional to theinterval over which the state of the system can be predicted. Moreover, K is related tsum of the positive Lyapunov exponents (Eckmann & Ruelle 1985). The above metcan be evaluated quantitatively and are diagnostic of chaos, whereas spectral anatime autocorrelation function and Poincaré plot construction are qualitative methods.
The fractal dimension can be employed as an estimate of the minimal numbedegrees of freedom that a process obeys. A fractal has the same overall structumultiple scales. A fractal dimension can be quantified in a meaningful way ( LipsitzGoldberger 1992, Eckmann & Ruelle 1985, Grassberger & Procaccia 1984, Grassb& Procaccia 1983b, Mandelbrot 1982, Goldberger 1996). To do this, the object hasobserved under many different magnifications; by varying magnification and measuthe amount of space the object occupies, its fractal dimension can be determinedalgorithms used for the analysis of unknown signals are still evolving. The most comalgorithm is that developed by Grassberger and Procaccia (1983b). Chaotic systemsexhibit low dimension, but periodic and random signals can also exhibit the samagnitude of dimension. For this reason, a diagnosis of chaos should not be made,exclusively on a fractal dimension.
Spectral analysis alone cannot distinguish a chaotic process either, but sinvestigators have suggested that a particular spectral pattern (one in which the pdensity is inversely related to frequency) is highly suggestive of a nonlinear or chaprocess (Goldberger & West 1987, Goldberger 1996, Goldberger et al. 1987). Howthe diagnostic value of this 1/f pattern has also been questioned (Pool 1989). Wrinkfluctuations occur in the human heart rate dynamics, which have many ofcharacteristics of nonlinear dynamics and deterministic chaos. These features candetected by traditional measures of heart rate variability, suggesting that metmotivated by nonlinear dynamics may have important clinical applications to analysheart rate behaviour. Whether the various nonlinear methods detect chaotic behavi
22
ownical
hasonarylated
ity iny. Aaryced.with
ciallynary8) ored int rate
islting inmic
a islusionhichen et
tientsiesdialn actionrateof a
er et
D470.book Page 22 Friday, August 7, 1998 3:01 PM
an important academic issue, but from the practical point of view, it is important to knwhether they are applicable for clinical purposes. The prognostic accuracy and cliapplicability of these measures are not well known.
2.5. Heart rate variability in pathological conditions
2.5.1. Heart rate variability in uncomplicated coronary artery disease
Heart rate variability is reduced in patients with stable coronary artery disease, andbeen suggested to be reduced even before the development of symptomatic corartery disease. Eckberg et al. (1971) reported that reduced baroreflex sensitivity is reto coronary artery disease. Airaksinen et al. (1987) observed reduced vagal activpatients with coronary artery disease manifested as lower heart rate variabilitdisturbed circadian rhythm of heart rate variability was found in patients with coronartery disease by Huikuri et al. (1994), but 24-hour heart rate variability was not reduThere is also evidence to suggest that the reduction of heart rate variability correlatesthe angiographic severity of coronary artery disease (Hyano et al. 1990), and espehigh frequency fluctuation seemed to be reduced in relation to the severity of coroartery disease, although no association of this kind was not found by Rich et al. (198Airaksinen et al. (1987). Although heart rate variability has been shown to be decreaspatients with coronary artery disease, the exact mechanisms of reduced hearvariability are not known. The effect of the severity of coronary artery diseasecontroversial. Ischaemia has been suggested to destroy the cardiac receptors resualtered autonomic regulation (Minisi & Thames 1989), but ageing also affects autonoactivity (Airaksinen et al. 1987). The contribution of transient myocardial ischaemiunresolved, but recent clinical data have demonstrated that short term coronary occduring coronary angioplasty causes divergent changes in heart rate variability, wcould not be predicted on the basis of the location of the coronary stenoses (Airaksinal. 1991).
2.5.2. Heart rate variability after acute myocardial infarction
In 1965, Schneider & Costiloe proposed that heart rate fluctuation is decreased in pawith an acute myocardial infarction. In the late 1980’s a few landmarking studconfirmed the strong and independent predictive value for mortality following myocarinfarction (Kleiger et al. 1987, Malik et al. 1989). Later, several reports have showdecrease in the spectral measures of heart rate variability after a myocardial infar(Pipilis et al. 1991, Bigger et al. 1991, Valkama et al. 1994). The reduction in heartvariability after a myocardial infarction seems to be a transient feature. Evidencerecovery of heart rate variability after myocardial infarction has been observed (Bigg

23
n inerse
o bedialstudyeartute
with
icantbleslitytheter aentoweryr ofheartby
y andality
eathior1).rdian inility,
icleft
ionst rate
ialwerias.deathrateion
D470.book Page 23 Friday, August 7, 1998 3:01 PM
al. 1991, Flapan et al. 1993), but heart rate variability remains still on a lower level thahealthy controls (Bigger et al. 1991) after an infarction, and this may be related to advprognosis.
2.5.3. Prognostic significance of heart rate variability
Reduced short term (30 consecutive RR intervals) heart rate variability was found tassociated with a higher in-hospital mortality rate in patients with acute myocarinfarction (Wolf et al. 1978). Heart rate variabil ity from 24-hour continuouelectrocardiographic recordings was computed in a large multicenter postinfarction s(Kleiger et al. 1987), and the population was followed up for a mean of 31 months. Hrate variability was found to be an indicator of long term prognosis after an acmyocardial infarction. The relative risk of death was 5.3 times higher in the patientspoor heart rate variability (SDNN< 50 ms) than in the patients with good (SDNN> 50ms) 24-hour heart rate variability. Decreased heart rate variability remained a signifprognostic indicator after adjustment for clinical, demographic and other Holter variaand left ventricular ejection fraction. The association between postinfarction mortaand low heart rate variability was confirmed by Bigger et al. (1992). They studiedfrequency domain measures of heart rate variability in 715 patients two weeks afmyocardial infarction. The population was followed up for four years. After adjustmfor the known risk markers, slow fluctuation spectral bands (ultra low and very lfrequencies) of heart rate variability remained a significant predictor of mortality. Vlow frequency power was the only variable that was a more powerful predictoarrhythmic death than cardiac or all-cause mortality. The association between lowrate variability and mortality after acute myocardial infarction was also confirmedVaishnav et al. (1994). Rich et al. (1988) showed that decreased heart rate variabilitlow left ventricular ejection fraction were the best and independent predictors of mortalso in patients with angina pectoris but without recent myocardial infarction.
Impaired heart rate variability was proposed to be a better predictor of cardiac dand arrhythmic events than left ventricular ejection fraction in patients with prmyocardial infarction (Farrell et al. 1991) and confirmed by Odemuyiwa et al. (199Cripps et al. (1991) found that the relative risk of sudden death or ventricular tachycawas seven times greater in postinfarction patients with low heart rate variability thathose with high heart rate variability. Pedretti et al. (1993) found that heart rate variabin addition to various other risk indicators, was significantly related to late arrhythmevents. Heart rate variability was found to provide more prognostic information thanventricular ejection fraction or the occurrence of ventricular premature depolarizatand to predict independently arrhythmic events. Huikuri et al. (1992) compared hearvariability in 22 survivors of cardiac arrest not associated with acute myocardinfarction and 22 clinically matched controls. The survivors of cardiac arrest had loheart rate variability than the controls without a history of life-threatening arrhythmHeart rate variability has been observed to be an independent predictor of sudden(Odemuyiwa et al. 1994). Hartikainen et al. (1996) showed decreased heartvariability to be related to both arrhythmic and nonarrhythmic death in postinfarct

24
rt ratet thate.g.rate
ular
andal.et al.
ce ofddenrji etousst is
t thee etvalt wastheandt al.
ciatedus
udebeenet al.
s (y iswith
t al.
hisbeen
1984,
D470.book Page 24 Friday, August 7, 1998 3:01 PM
patients. Both case-control and epidemiological studies have suggested that low heavariability increases the risk of arrhythmic events and death. The recent data suggesimpaired heart rate variability increases the risk of non-fatal cardiac events,myocardial infarction and unstable angina pectoris, suggesting that low heartvariability analysed with conventional methods is strongly related to cardiovascevents and not specifically to arrhythmic events (Tsuji et al. 1996).
2.5.4. Other risk markers of arrhythmic death
Poor left ventricular function is an important determinant of both cardiac deatharrhythmic mortality after myocardial infarction (Ruberman et al. 1977, Moss et1982). Residual ischemia may also associate with sudden cardiac death (Savage1987, Pepine et al. 1991).
In postinfarction patients, frequent premature depolarizations and the occurrennonsustained ventricular tachycardia have been shown to be risk markers of sucardiac death or arrhythmic events (Moss et al. 1979, Follansbee et al. 1980, Mukhaal. 1984, Holmes et al. 1985). However, the predictive accuracy of spontaneventricular arrhythmias (excluding sustained ventricular tachycardia) for cardiac arrelow (Bigger et al. 1984, Hartikainen et al. 1996).
Prolongation of the QT interval in postinfarction patients has been shown to predicrisk for ventricular tachyarrhythmias and sudden death (Schwartz & Wolf 1978, Ahnval. 1980). QT dispersion is defined as the variability of the length of the QT interbetween the leads of a conventional 12-lead surface electrocardiogram, and iintroduced by Campbell et al. (1985). Broad QT dispersion reflects differences inlocal myocardial repolarization/recovery times (Day et al. 1990, Zabel et al. 1995)hence an electrophysiologic environment (substrate) that favours reentry (Mitchell e1986, Perkiömäki et al. 1995). Increased QT dispersion has been shown to be assowith vulnerability to life-threatening ventricular arrhythmias in patients with a previomyocardial infarction (Perkiömäki et al. 1995 and 1997).
Signal-averaged ECG is a method of determining high-frequency low-amplitpotentials at the end of the QRS complex (Simson 1981). These late potentials haveobserved to predict sudden death and arrhythmic events (Kuchar et al. 1987, Farrell1991).
Baroreflex sensitivity reflects the vagal activity exerted by baroreceptor reflexeSmyth et al. 1969). In postinfarction patients, depressed baroreflex sensitivitassociated with ventricular arrhythmias and sudden death and does not correlateejection fraction, but is inversely related to age ( La Rovere et al. 1988, Farrell e1992).
The variation of every other T wave amplitude is defined as T wave alternans. Talternans can be measured with digital signal processing techniques, and hassuggested to be associated with the genesis of ventricular arrhythmias (Adam et al.Rosenbaum et al. 1994).

25
ow-e ettricalet al.nts,iable
olo etthewithors.th leftata,d toäki
ed inn et
lure
sicald wither &
988).1994,ectralinishs oneforeso, ith the
D470.book Page 25 Friday, August 7, 1998 3:01 PM
Using electrophysiologic indicators, postinfarction patients can be stratified into land high-risk groups in terms of the future risk for life-threatening arrhythmias (Bourkal. 1991). Sustained monomorphic ventricular tachycardia during programmed elecstimulation is suggested to be the only arrhythmia of prognostic relevance (Bourke1991, Zoni-Berisso et al. 1996). In a selected population of postinfarction patieinducible sustained monomorphic ventricular tachycardia was the most important varrelated to late arrhythmic events (Zoni-Berisso et al. 1996).
2.5.5. Heart rate variability in other disease states
Heart rate variability has been found to be decreased in congestive heart failure (Casal. 1989, Kienzle et al. 1992). Brouwer et al. (1996) observed, however, thatconventional measures of heart rate variability were not related to survival in patientsheart failure, but abnormal Poincaré plots were independent mortality predictDecreased heart rate variability has also been observed in hypertensive patients wiventricular hypertrophy (Petretta et al. 1995, Chakko et al. 1993). More recent dhowever, suggest that decreased heart rate variability is not specifically relateventricular hypertrophy, but rather to hypertension itself (Huikuri et al. 1996, Perkiömet al. 1996, Ylitalo et al. 1997). Heart rate variability has also been shown to be reducdiabetic neuropathy (Smith 1982) and in several neurological conditions (Lowensohal. 1977, Kuroiwa et al. 1983, Korpelainen et al. 1996) as well as in chronic renal fai(Cloarec-Blanchard et al. 1992).
2.5.6. Influence of physical training and drugs on heart rate variability
The relation between physical fitness and heart rate variability is controversial. Phyfitness and regular endurance training have been suggested to be associateincreased heart rate variability (Seals & Chase 1989, De Meersman 1993, BoutchStein 1995), but some studies have failed to show any association (Reiling & Seals 1Beta-blockers have been suggested to enhance heart rate variability ( Niemelä et al.Rich et al. 1991). Scopolamine has been found to increase the high-frequency spcomponent (Vybiral et al. 1990). Flecainide and propafenone have appeared to dimheart rate variability (Zuanetti et al. 1991). Generally, studies on the effects of drugheart rate variability have shown that heart rate is often not normalised, and it is therdifficult to conclude whether changes take place only due to an altered heart rate. Alis not known whether possible changes in heart rate variability have connections witobserved prognostic influences of these drugs.

26
D470.book Page 26 Friday, August 7, 1998 3:01 PM

f newour.
artery
ction
ctionon
rilla-en-
lity in
D470.book Page 27 Friday, August 7, 1998 3:01 PM
3. Purpose of the present study
1. The main purpose of the present research was to assess the clinical applicability odynamical analysis methods derived from nonlinear dynamics of heart rate behavi
2. The specific aims of the individual substudies were:
a) to compare dynamical measures of heart rate behaviour between coronarydisease patients without a previous myocardial infarction and healthy controls.
b) to compare dynamical measures of heart rate behaviour between postinfarpatients and healthy controls.
c) to compare dynamical measures of heart rate behaviour between postinfarpatients with vulnerability to ventricular tachyarrhythmia and postinfarctipatients without propensity to ventricular tachyacardia
d) to compare dynamical measures of heart rate behaviour before ventricular fibtion in postinfarction patients and postinfarction control patients without propsity to ventricular arrhythmias.
e) to evaluate dynamical measures of heart rate behaviour as predictors of mortaa general elderly population.

28
D470.book Page 28 Friday, August 7, 1998 3:01 PM

erals (I-
andhicmentthebeen
in aical
tiontrialge
tivetricularciblen at2 toere
rdialithhesers.tion.ed as
eousutgical
D470.book Page 29 Friday, August 7, 1998 3:01 PM
4. Populations
The study covered four different patient populations, their controls and a genpopulation of elderly people. The demographic characteristics of the study populationIV) are shown in Table 1.
The first group consisted of 38 consecutive patients with stable angina pectoriswithout previous myocardial infarction who had been referred for an angiograpexamination because of a history of chest pain and evidence of ischemic ST-segdepression during an exercise test (I). Medication had been withdrawn beforeexamination. Age and sex matched healthy subjects served as controls. They hadselected from the general population of Oulu from among individuals participatinglarger trial. They had undergone a complete physical examination and their medhistory revealed no cardiovascular disease or medication.
The second group comprised 40 consecutive patients with a prior Q-wave infarcreferred for angiography on account of angina pectoris (II). Patients with diabetes or afibrillation were excluded. Medication had been withdrawn before the examination. Aand sex matched healthy subjects served as controls.
The third group, the ventricular tachyarrhythmia group, consisted of 45 consecupatients who had had a documented cardiac arrest or spontaneous sustained ventachycardia and in whom sustained monomorphic ventricular tachycardia was induby programmed electrical stimulation. Antiarrhythmic treatment had been withdrawleast 4 half-lives before the electrophysiological testing. The studies were performed10 days after the occurrence of ventricular tachycardia. Two different control groups wused. The postinfarction controls consisted of 45 patients with a prior Q-wave myocainfarction but without any history of ventricular tachycardia events. Patients winducible nonsustained or sustained ventricular tachycardia were excluded. All of tcontrol patients also showed arrhythmia-free survival during a follow-up of two yeaThe groups were matched with respect to age, sex and left ventricular ejection fracForty-five age-matched healthy subjects without evidence of heart disease servnormal controls (III).
The fourth group consisted of 10 postinfarction patients, all of whom had spontanonset of ventricular fibrillation during 24-h electrocardiographic recordings withosignificant preceding ST segment changes and who also underwent electrophysiolo

30
tionctednt oftion
ion
d anlar
ivingnceans ofand aion,lassesere
wasthe
rds,use
due
D470.book Page 30 Friday, August 7, 1998 3:01 PM
and angiographic examinations (IV). The control group consisted of postinfarcpatients without any history of ventricular arrhythmia events. The controls were selefrom among 83 consecutive postinfarction patients referred for angiography on accouangina pectoris or for prognostic reasons, on whom programmed electrical stimulawas performed. The ventricular fibrillation patients were matched with postinfarctcontrols with respect to age, sex, left ventricular ejection fraction,β-blocking and diureticmedication and functional class. Two postinfarction control subjects, who had haarrhythmia-free follow-up period of two years, were matched to each ventricufibrillation patient.
Table 1. Characteristics of patient populations
The fifth population consisted of a random sample of 480 persons aged 65 or older lin the community (V). They were obtained from the register of the Social InsuraInstitution covering the population of the city of Turku. No exclusion criteria other thliving in an institution were used. Ambulatory 24-hour electrocardiographic recordingthese subjects were analysed. A clinical history was obtained by personal interview,comprehensive clinical evaluation was carried out, including a physical examinatstandard ECG, chest x-ray, blood pressure and biochemical analyses. Functional cand levels of disability due to any cause were classified. Major diagnoses westablished on the basis of the history and clinical evaluation. The populationfollowed up for ten years. Ten-year mortality and causes of death were recorded frommortality statistics. The mode of death was defined after a review of the hospital recoautopsy findings and death certificates. The end-points of the follow-up were all-camortality, cardiac mortality, cerebrovascular mortality, cancer mortality, and mortalityto various other causes.
healthy subjects(n = 45,
I,II,III,IV)
uncomplicatedCAD
(n = 38, I)
post-MI groupwithout arrhytmia
(n= 45, II,III)
post-MI groupwith VT
(n = 45, III)
VF group(n = 10, V)
Age 59± 9 55± 9 60± 6 62±14 67± 4
Men/women 39/6 39/6 39/6 39/6 7/3
NYHA I-II 23 17 19 −
NYHA III-IV 15 28 26 10
LV ejectionfraction (%)
71± 7 45± 8 44± 11 38± 8
Number of major coronaryarteries narrowed > 50% indiameter
1 17 6 9 −
2 & 12 17 2
3 15 27 19 8
Abbreviations: the values are mean± standard deviation; NYHA = New York Heart Association; LV = leftventricular; CAD = coronary artery disease; MI = myocardial infarction; VT = ventricular tachycardia; VF
= ventricular fibrillation.

hrdandtionmia
eriesnablem
f RRms thewastudynds:
anents
D470.book Page 31 Friday, August 7, 1998 3:01 PM
5. Methods
5.1. Electrocardiographic recordings
All the subjects in all studies (I,II,III,IV,V) were monitored for 24 hours (if possible) witan ambulatory electrocardiographic recorder. The Del Mar Avionics (I-IV) and OxfoMedilog, Oxford (V) recording systems were used. The data were sampled digitallytransferred to a microcomputer for the analysis of heart rate variability. For the detecand quantification of arrhythmias, a 2-channel oscilloscopic display and an arrhythanalyser were used.
5.2. Analysis of heart rate behaviour
After transfer of the electrocardiographic data to a microcomputer, the RR interval swere edited manually and premature beats and noise were deleted (I-V). Questioportions were printed out on a 2-channel electrocardiogram at a paper speed of 25 m/secto confirm the sinus origin of the RR interval data. Only segments with> 80% pure sinusbeats were included.
An autoregressive model was used to estimate the power spectrum densities ointerval variability (Burg 1975, Kay & Marple 1981) in which the computer prograautomatically calculates autoregressive coefficients (I-IV). The size of 20 was used amodel order in the analysis of the RR interval data. The Fourier transform methodused to estimate the power spectrum densities of heart rate variability in one subs(V). The power spectra were quantified by measuring the area in four frequency ba< 0.0033 Hz (ultra low frequency) 0.0033− 0.04 Hz (very low frequency), 0.04− 0.15 Hz( low frequency) and 0.15− 0.40 Hz (high frequency). The standard deviation and melength of the RR intervals both in the whole measured epoch and in shorter segmwere used as time domain measures (I-V).
32
m istact
ionstive
n thervalstailse
reasrisedf theh the. Theplotaxis-term
rs
ta. Itries.istichmicnextity)duceateenThe
o usedtoo
nglye at
D470.book Page 32 Friday, August 7, 1998 3:01 PM
5.2.1. Poincaré plot analysis
The Poincaré plot is a diagram (scattergram) in which each RR interval of a tachograplotted as a function of the previous RR interval. The Poincaré plot gives a visual conto the RR data by representing qualitatively with graphic means the kind of RR variatincluded in the recording. The plots were also analysed quantitatively. This quantitamethod of analysis is based on the notion of different temporal effects of changes ivagal and sympathetic modulation of the heart rate on the subsequent RR intewithout a requirement for a stationary quality of the data. Computerised analysis enfitting an ellipse to the plot, with its center coinciding with the center point of thmarkings. The line defined as axis 2 shows the slope of the longitudinal axis, wheaxis 1 defines the transverse slope, which is perpendicular to axis 2. In the computeanalysis, the Poincaré plot is first turned 45° clockwise, and the standard deviation oplot data is then computed around the horizontal axis (axis 2), which passes througdata center (SD1). SD1 shows the instantaneous beat-to-beat variability of the datastandard deviation of continuous long-term R-R intervals is quantified by turning the45° counterclockwise (SD2) and by computing the data points around the horizontal(axis 1), which passes through the center of the data. SD2 shows the continuous longRR interval variability. In addition, the SD1/SD2 ratio was computed. The parametequantified on the plot are shown in Figure 1.
5.2.2. Approximate entropy analysis
Approximate entropy analysis was used to measure the complexity of time series daquantifies the regularity or predictability of data and has been developed for time seThis method can be used to classify complex systems that include both determinchaotic and stochastic processes. Approximate entropy measures the logaritlikelihood that runs of patterns that are close to each other will remain close in theincremental comparisons. A greater likelihood of remaining close (high regularproduces smaller approximate entropy values, and conversely, random data prohigher values. Two input variables, m and r, must be fixed to compute approximentropy, and m= 2 and r= 20% of the standard deviation of the data sets have berecommended for time series, based on previous findings of good statistical validity.details of this method have been described by Pincus (1991). These values were alsin the present study. Different r values were first tested, however. With high r valuesmuch detailed system information was lost, which made the time series misleadiregular. Too low r values, on the contrary, did not keep the effect of signal noisminimum, and therefore the recommended input variables were used.

33
alingis ofrtiesean-
rvationeart
n anr isore
ncyhert. Ahe
odelutlierviousy) in
f thispe oferyes of, but
D470.book Page 33 Friday, August 7, 1998 3:01 PM
5.2.3. Detrended fluctuation analysis
The detrended fluctuation analysis technique was used to quantify the fractal-like scproperties of RR interval data. This method is a modified root-mean-square analysrandom walk, which quantifies the presence or absence of fractal correlation propeand has been validated for time series (Peng et al. 1995). In this method, the root-msquare fluctuation of integrated and detrended time series is measured at each obsewindow and plotted against the size of the observation window on a log-log scale. Hrate correlations were defined particularly for short-term (< 11 beats,α), but also forlong-term correlations of RR interval data. In this method, a fractal-like signal (1/f signalspectrum) results in an exponent value 1 (α = 1.0). White Gaussian noise (totally randomsignal) results in a value 0.5 (α = 0.5), and a Brownian noise signal (1/f2 signal spectrum)with a spectrum of rapidly decreasing power in the higher frequencies results iexponent value 1.5.α = 0.5 corresponds to a time series where interbeat behaviourandom.α = 0 − 0.5 correspond to time series where large and small values are mlikely to alternate, whereas atα values of 0.5− 1.0 a long interbeat interval is more likelyto be followed by a long interval and vice versa.
5.2.4. Power-law relationship analysis
The power-law relationship of RR interval variability was calculated from the frequerange of 10-4 to 10-2 Hz. The point power spectrum was logarithmically smoothed in tfrequency domain and the power integrated into bins spaced 0.0167 log (Hz) aparobust line- fitting algorithm of log (power) on log (frequency) was then applied to tpower spectrum between 10-4 to 10-2 Hz and the slope of this line was calculated (β). Therobust algorithm minimises the absolute deviations of data points from a linear minstead of the squared fitting error, thus reducing the adverse effect of occasional opoints in the spectrum. This specific frequency band is chosen on the basis of preobservations regarding the linear relationship between log (power) and log (frequencthis frequency band in human heart rate time series data. Only recordings with> 12 hoursof analysed data were used for the power-law relationship analysis. The details omethod have been described previously (Saul et al. 1987, Bigger et al. 1996). The slothis power-law relationship of heart rate variability computed over the ultra low and vlow frequency oscillations is a spectral measure different from the traditional measurheart rate variability, because it does not reflect the magnitude of heart rate variabilitythe distribution of spectral characteristics of RR interval oscillations.

34
erete
fpochgingRR
ereand
d thets ofthencyasewasoiseeartTheThe. The
0 ms
allluesn
ithoise
ialse in
erreasereal
opy
wile annt. In
D470.book Page 34 Friday, August 7, 1998 3:01 PM
5.3. Signal behaviour tests
A series of simulations with artificially generated data and real RR signals wperformed to test the behaviour of dynamical measures (I,III,IV). 1) Artificial whiGaussian noise, noise with a spectrum compatible with the inverse power law (1/f noise)and noise with a spectrum compatible with the 1/f2 noise were generated, and values odynamical variables were calculated for these, using different input variables and esizes. The artificial signals described above were also randomly shuffled by interchanthe sample positions pairwise 500 times. Similar shuffling was performed on realinterval data. 2) In addition, artificial signals with different spectral characteristics wgenerated in order to simulate real RR signals. The relative powers of the very lowhigh frequency spectral bands were varied systematically to see how this affectedynamical variables. Also, the power ratio of very low and high frequency componena real RR signal was varied by digital filtering techniques. 3) Artificial noise widifferent power spectral properties was added to real RR data. The amount of frequpowers and the width of the frequency bands were varied. 4) Finally, two types of bnoise were added to a real RR signal in different signal to noise ratios. The first typeadditive white Gaussian noise and the second additive quantization type of ngenerated by recording constant RR intervals with an electronic device (LionhMultiparameter Stimulator) via the usual Holter measurement procedure.quantization effect occurs due to the limited sampling accuracy of RR intervals.standard deviation of additive white Gaussian noise and quantization noise was 5 msstandard deviation of the real RR signal was increased from 40 ms to 80 ms in 1steps. Thus, a signal-noise ratio of 8 to 16 was tested in the experiments.
Artificial white Gaussian noise with a spectrum of the same power content atfrequencies (flat spectrum) resulted in short-term fractallike scaling exponent vabetween 0.5 and 0.55 (expected valueα1 = 0.5) , approximate entropy values betwee1.94 and 2.02 and a power-law slope value (β) 0, as expected. Digitally filtered noise witha spectrum compatible with the 1/f power law resulted in slightly higher (0− 3%) short-term fractal values than expected (expected valueα1 = 1.0) and a power-law slope value(β) −1.0, as expected. The Brownian noise signal with a 1/f2 signal spectrum resulted in ashort term exponent value 1.5 and a power-law slope value (β) −2.0, as expected. Aftershuffling the filtered artificial signals and real RR interval data, the values obtained wthe different measures were similar to those obtained with artificial white Gaussian n(I,II,III,IV).
In experiments with different relative very low and high frequency powers of artificsignals, a decrease in very low frequency power invariably caused an increaapproximate entropy. A slight artificial addition of the band width high frequency powin real RR data resulted in increased approximate entropy. The larger the power incwas, the larger the increase in entropy value. Addition of white Gaussian noise to aRR signal in different signal to noise ratios had a minor effect on approximate entr(V).
Artificial modification of real RR interval data showed that an increase of lofrequency power resulted in a subtle increase of the short term exponent value, whincrease of the high frequency component resulted in a decrease of this expone

35
theort-
veralbeatsbeatsd byed byues
ods
sedthetableeats
valueso thed didreas
edandnd
ri etLeftiquehod.oses
D470.book Page 35 Friday, August 7, 1998 3:01 PM
addition, an artificial addition of the band width of the high frequency power towardsdirection of the very-high frequency band resulted in a significant reduction of the shterm scaling exponent.
5.4. Effects of editing
To test how data editing affects the values of dynamical measures, the data of sesubjects were edited using different methods. The effect of the number of excludedon dynamic analysis was studied by increasing progressively the number of editedfrom the same data set. The effects of different editing methods were studiecomparing the results obtained when edited beats were alternatively deleted, replacthe value of neighbouring RR interval or replaced by inserting new RR interval valinterpolated from previous and subsequent beats.
The heart rate behaviour values did not differ between the different editing methwhen< 5% of the beats were randomly edited. When 5− 30% of the beats were randomlyedited in 5% of the intervals, the short term scaling exponent value decreaprogressively when the edited beat was replaced by the interval length ofneighbouring beats or when the interpolating method was used, but remained s(< 5% error) when the editing was carried out by deleting the beats. When ectopic bwere retained in the data sets, the short term scaling exponent and power-law slopewere lower, whereas approximate entropy resulted in higher values compared tvalues recorded after removal of the ectopic beats. The selection of the editing methonot affect the long range slope values of power-law relationship analysis, wheapproximate entropy was sensitive to editing method, as expected.
5.5. Electrophysiologic and angiographic examinations
Electrophysiologic testing included incremental ventricular pacing and programmventricular stimulation using up to 3 extrastimuli and 2 basic drive cycle lengths (600400 ms) from the right ventricular apex and outflow tract. The stimulation protocol athe definition of induced arrhythmias have been described in detail previously (Huikual. 1993). Left heart catheterisation was performed by the Judkins technique.ventricular cineangiograms were recorded in the 45 degree right anterior oblprojection, and ejection fraction was calculated by a biplane area-length metCoronary angiograms were recorded in multiple projections, and coronary artery stenwith > 50% luminar narrowing were considered significant.

36
ode,dard
ptom-A
Jode
andhigh-ured994,
icheartU-ed toby
ncesalysetiplewhenity,ntile
easurethe
D470.book Page 36 Friday, August 7, 1998 3:01 PM
5.6. Echocardiographic measurements
A Hewlett-Packard 77020A ultrasound colour Doppler system was used for the M-mtwo-dimensional and Doppler echocardiographic recordings, observing stantechniques and a method described previously (Airaksinen et al. 1989).
5.7. Exercise electrocardiographic measurements
The healthy subjects and the patients with stable angina pectoris performed a symlimited maximal exercise test on an electrically braked bicycle ergometer (I,II,III,IV).horizontal or downsloping ST depression of> 0.1mV occurring 0.08 seconds after thepoint was considered to be of ischemic origin. The criterion for an ischemic episduring the 24-hour ambulatory recording was a≥ 1 mm horizontal or downsloping STsegment depression lasting for≥ 1 min.
5.8. Other analysis
A clinical history and evaluation, a physical examination, chest x-ray, blood pressurebiochemical analyses were obtained by standard methods. Serum total cholesterol,density and low-density lipoprotein cholesterol, triglyceride and glucose were measfrom overnight fasting samples by the methods described earlier (Räihä et al. 11997).
5.9. Statistics
The results are mostly given as means± standard deviation. In the light of Kolmogorov-Smirnov tests (Z-value> 1.0), in addition to the absolute values, a logarithmtransformation to the natural base was performed on all the spectral components ofrate variability (I,V). Student’s t-test for normally distributed variables, Mann-Whitneytest for other continuous values and chi-square test for categorical variables were usanalyse the differences between the groups (I-V). Analysis of variance followedBonferroni’s post hoc multiple range tests was also used to compare the differebetween the groups (III). The paired t-test for dependent variables was used to andifferences one hour before a specific event and in the 24-hour average (IV). Mulregression analysis was used to determine the best independent variabledifferentiating between the patient groups (I-IV). When analysing the sensitivspecificity and predictive accuracy of the different measures, the 90% or 95% perceof the values obtained for healthy subjects was used as the normal range for each m(I,III). Spearman’s and Pearson’s correlation coefficients were used to estimate

37
tthe
rsiontheCoxtheriates.lityrentespare
D470.book Page 37 Friday, August 7, 1998 3:01 PM
correlations between the measured variables. A p-value< 0.05 was considered significan(I,II,III,IV,V). Cox proportional hazards regression analyses were used to assessassociation between different risk predictors and mortality, using SPSS Windows ve6.1 (V). To find the best cut-off points for various measures of heart rate variability,dichotomisation cut-off points that maximised the hazards ratio obtained from theregression model were sought, with all-cause mortality as the end point. Allproportional hazards regression analyses were stratified using sex and age as covaIn addition, all the variables that had a univariate association with all-cause mortawere included in the model, in order to estimate the independent power of the diffevariables in predicting the mortality. Kaplan-Meier estimates of the distribution of timfrom baseline to death were computed, and log-rank analysis was performed to comthe survival curves between the groups (V).

38
D470.book Page 38 Friday, August 7, 1998 3:01 PM

iationte
oth
ithaling
ted, with
r inowerten
then intal-ents4-hour
D470.book Page 39 Friday, August 7, 1998 3:01 PM
6. Results
6.1. Comparison of measures of heart rate behaviour between patientswith stable angina pectoris and healthy controls
Patients with stable uncomplicated coronary artery disease had lower standard devof all RR intervals (p< 0.01 ) and high-frequency spectral component of heart ravariability (p < 0.05) than healthy controls. The mean heart rate was similar in bgroups. Coronary artery disease patients also had lower approximate entropy (p< 0.05)than healthy controls. The short term fractal scaling exponent (α) was significantly higherin patients with coronary artery disease than in healthy controls (1.34± 0.15 vs.1.11± 0.12, p< 0.001, Table 2 and Figure 1). When the groups were matched wrespect to the ratio of low-to-high frequency spectral components, the short term scexponent value continued to be higher in coronary artery disease patients (p< 0.001), butapproximate entropy did not differ. The short-term fractal scaling exponent differentiacoronary artery disease patients from healthy subjects better than any other variablea sensitivity of 78% and a specificity of 87% (I).
6.2. Comparison of measures of heart rate behaviour betweenpostinfarction patients and healthy controls
The standard deviation of RR intervals and the very low (p< 0.01) and low frequency(p < 0.001) components in the spectral analysis of heart rate variability were lowepostinfarction patients than in healthy subjects. The high frequency band was also lin the patient group (p< 0.05). However, discrete high frequency peaks were less ofobserved in postinfarction patients. The mean heart rates did not differ betweengroups. Approximate entropy was significantly higher in postinfarction patients thahealthy subjects (p< 0.001, Table 2 and Figure 1), whereas neither the short term fraclike scaling exponent nor the power-law slope differed between postinfarction patiand healthy controls. When analysed from successive segments of 4000 beats, the 2

40
thydin
nts
tolar. Thenot
tral
spo-24e ofn;
r
D470.book Page 40 Friday, August 7, 1998 3:01 PM
variability in approximate entropy was lower in postinfarction patients than in healsubjects (0.27± 0.09 vs. 0.32± 0.07, p< 0.05). When the study groups were matchewith respect to total RR interval variance (standard deviation of RR intervalspostinfarction patients 76± 15 msec and 76± 24 msec in healthy subjects, n= 30 forboth), the approximate entropy value was still higher in postinfarction patie(1.24± 0.21) than healthy subjects (1.05± 0.10, p< 0.001, II).
Table 2. RR interval measurements
6.3. Comparison of measures of heart rate behaviour betweenpostinfarction patients with and without vulnerability to ventricular
tachyarrhythmia and healthy controls
There were no differences between the patients with and without vulnerabilityventricular tachycardia in the clinical characteristics, the frequency of ventricupremature depolarizations or the occurrence of nonsustained ventricular tachycardiamean standard deviation of all RR intervals was lower than in healthy controls, but diddiffer between the groups with and without arrhythmia risk. Low frequency spec
healthy subjects(n = 45,
I,II,III,IV)
uncomplicatedCAD
(n = 38, I)
post-MI groupwithout arrhyth-
mia(n = 45, II,III)
post-MI group withVT
(n = 45, III)
VF group(n = 10, IV)
Mean RR inter-val (ms)
888± 117 858± 119 944± 146* 953± 168* 879± 187
SDNN (ms) 150± 40 131± 39** 106 ± 30*** 90 ± 35*** 77 ± 47***
SDANN (ms) 90± 27 77± 23** 75 ± 26** 63 ± 26** 73 ± 34**
HF power (ln) 5.4± 0.9 4.9± 1.0* 5.2± 0.9 5.2± 1.3 6.2± 1.5*
LF power (ln) 6.3± 0.9 6.2± 0.8 5.9± 1.0 5.3± 1.2** 6.0 ± 1.5
α 1.09± 0.13 1.34± 0.15*** 1.06 ± 0.13 0.85± 0.25*** 0.68 ± 0.18***
β −1.27± 0.18 −1.30± 0.14 −1.33± 0.23 −1.37± 0.26 −1.63± 0.24**
SD1 21± 7 17± 9* 20 ± 10 23± 17 52± 41*
SD2 125± 38 111± 40* 104± 36* 85 ± 35*** 86 ± 48**
SD1/SD2 0.18± 0.04 0.16± 0.04 0.21± 0.06 0.30± 0.18* 0.59± 0.25**
ApEn 1.03± 0.14 0.93± 0.17* 1.17± 0.22** 1.20± 0.28** 1.01± 0.34
Abbreviations: the values are mean± standard deviation,α = short-term scaling exponent;β = power-law slopebetween 0.000− 0.01 Hz; SD1= instantaneous heart rate variability from Poincaré plots; SD2 = continuou
heart rate variability from Poincaré plots; ApEn = approximate entropy; HF = high frequency spectral comnent; LF = low frequency spectral component; SDNN = standard deviation of all RR intervals during the
hour recording; SDANN = standard deviation of RR intervals of 4000 beats segments; Mean RR = averaglengths of RR intervals; ln = logarithm to the natural base of the absolute value; MI = myocardial infarctio
VT = ventricular tachycardia; VF = ventricular fibrillation CAD = coronary artery disease. * = p< 0.05, ** =p < 0.01, *** = p < 0.001, significance levels for differences between healthy subjects and cardiovascula
patient groups.
41
ionapep inthe
up
orandRR
hether of
e ofer inhe
rvalsdiffererythetral
encyure
ated
carè
d inularular
r-lawain
orheet of
D470.book Page 41 Friday, August 7, 1998 3:01 PM
power was significantly lower in the ventricular tachycardia group than in postinfarctpatients (p< 0.01), but high frequency spectral power did not differ. However, the shof the high frequency spectral band was different in the ventricular tachycardia grousuch a way that the high frequency band was flatter with more power distributed invery-high frequency area (Figure 1). The short term scaling exponent (α) wassignificantly smaller in the arrhythmia group than in the postinfarction control gro(p < 0.001) or in healthy controls (p< 0.001). Approximate entropy was significantlylower in healthy subjects than in postinfarction patients (p< 0.001), but did not differbetween the groups with and without vulnerability to ventricular tachyarrhythmia. Nwas the power-law regression slope able to differentiate between patients withwithout a risk of tachycardia. The standard deviation of long-term (SD2) continuousinterval variabil ity was smaller in the ventricular arrhythmia group than in tpostinfarction control group (p< 0.05). Stepwise multiple regression analysis showedshort-term scaling exponent to be the most powerful independent predictovulnerability to ventricular tachycardia (III).
6.4. RR interval dynamics before spontaneous onset of ventricularfibrillation
The frequency of ventricular premature depolarizations and the occurrencnonsustained ventricular tachycardia on the Holter recordings were significantly highventricular fibrillation patients compared to arrhythmia-free postinfarction controls. Tconventional measures of heart rate variability, i.e. the standard deviation of RR intein each segment and the standard deviation of the entire measured epoch, did notbetween the ventricular fibrillation group and the postinfarction control group. The vlow and low frequency spectral components did not differ significantly betweenventricular fibrillation and control subject groups, but the high frequency speccomponent was higher in ventricular fibrillation patients (p< 0.05). The power of the highfrequency spectral component was distributed widely in the high and very high frequareas in the ventricular fibrillation patients without any discrete respiration peak (Fig1). Of the dynamic measures of RR interval behaviour, the short term fractal-relscaling exponentα and the power-law regression slopeβ showed smaller values in theventricular fibrillation group than in the postinfarction control group (p< 0.001, p< 0.01respectively). The instantaneous beat-to-beat RR interval variability SD1 from Poinplots and the SD1/SD2 ratio were higher in the ventricular fibrillation cases (p< 0.05,p < 0.01, respectively). Approximate entropy did not differ from the values observehealthy controls. In stepwise multiple regression analysis, including the ventricpremature depolarization frequency, the occurrence of nonsustained ventrictachycardia, two-dimensional vector analysis, detrended fluctuation analysis, powebehaviour analysis of low frequencies and conventional time and frequency dommeasures of heart rate variability,α proved to be the strongest independent predictdifferentiating ventricular fibrillation patients from postinfarction controls. None of tvariables changed significantly during the last hour before the spontaneous ons
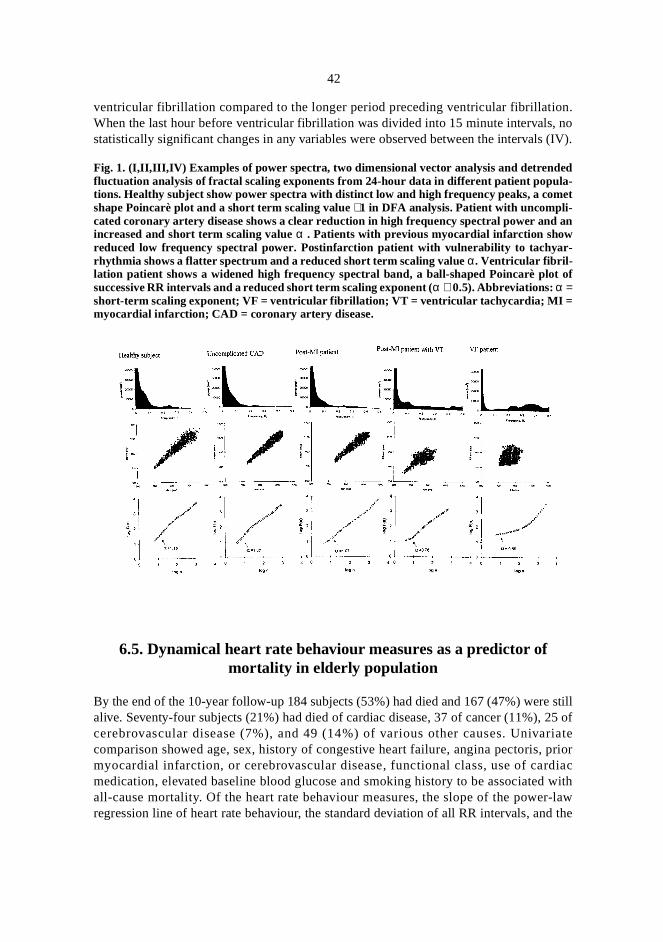
42
n.no(IV).
still25 ofriatepriordiacwith
r-lawd the
D470.book Page 42 Friday, August 7, 1998 3:01 PM
ventricular fibrillation compared to the longer period preceding ventricular fibrillatioWhen the last hour before ventricular fibrillation was divided into 15 minute intervals,statistically significant changes in any variables were observed between the intervals
Fig. 1. (I,II,III,IV) Examples of power spectra, two dimensional vector analysis and detrendedfluctuation analysis of fractal scaling exponents from 24-hour data in different patient popula-tions. Healthy subject show power spectra with distinct low and high frequency peaks, a cometshape Poincarè plot and a short term scaling value∼1 in DFA analysis. Patient with uncompli-cated coronary artery disease shows a clear reduction in high frequency spectral power and anincreased and short term scaling valueα . Patients with previous myocardial infarction showreduced low frequency spectral power. Postinfarction patient with vulnerability to tachyar-rhythmia shows a flatter spectrum and a reduced short term scaling valueα. Ventricular fibril-lation patient shows a widened high frequency spectral band, a ball-shaped Poincarè plot ofsuccessive RR intervals and a reduced short term scaling exponent (α ∼ 0.5). Abbreviations:α =short-term scaling exponent; VF = ventricular fibrillation; VT = ventricular tachycardia; MI =myocardial infarction; CAD = coronary artery disease.
6.5. Dynamical heart rate behaviour measures as a predictor ofmortality in elderly population
By the end of the 10-year follow-up 184 subjects (53%) had died and 167 (47%) werealive. Seventy-four subjects (21%) had died of cardiac disease, 37 of cancer (11%),cerebrovascular disease (7%), and 49 (14%) of various other causes. Univacomparison showed age, sex, history of congestive heart failure, angina pectoris,myocardial infarction, or cerebrovascular disease, functional class, use of carmedication, elevated baseline blood glucose and smoking history to be associatedall-cause mortality. Of the heart rate behaviour measures, the slope of the poweregression line of heart rate behaviour, the standard deviation of all RR intervals, an

43
ariated. Ae andwithds.ris,vated
-agef the
tal
samece ofrslope
r of
t rateculard to aivity
on
ls;res-n-sig-
D470.book Page 43 Friday, August 7, 1998 3:01 PM
very low frequency and low frequency spectral components appeared to have a univassociation with all-cause mortality. Short-term fractal-like measure was not analysestepwise proportional hazards method showed both the slope of the regression linthe standard deviation of all RR intervals to possess independent predictive powerrespect to all-cause mortality (p< 0.001 for both), whereas the very low frequency anlow frequency spectral components did not enter the model as independent predictor
In multivariate analysis, a history of previous myocardial infarction, angina pectocongestive heart failure and cerebrovascular disease, smoking, functional class, eleblood glucose, standard deviation of all RR intervals< 120 msec and a slope of powerlaw regression< −1.50 were associated with all-cause mortality after adjustment forand sex. When all the risk variables were included in the analysis, a steep slope opower-law regression line (adjusted relative risk 1.74, p< 0.001) and a history ofcongestive heart failure (adjusted relative risk 1.70, p< 0.001, Table 3) were the onlyindependent predictors of all-cause mortality. After the 10-year follow up in the tostudy population, only 19 of the 94 subjects (20%) with a power-law slope< −1.50 werealive, whereas 141 of the 211 subjects (67%) with a power-law slope≥ −1.50 were stillalive (Figure 2). After adjusting for age and sex, cardiac death was predicted by thevariables as all-cause mortality, except for smoking history, and also by the presen≥ 10 ventricular premature beats/hour on the 24-hour ECG recording. After adjusting foall the risk variables, cardiac death was independently associated only with a steepof the regression line of heart rate variability (adjusted relative risk> 2, p< 0.001) and ahistory of congestive heart failure (adjusted relative risk 1.56, p< 0.05). The slope of theregression line of heart rate variabili ty was also an independent predictocerebrovascular death (age and sex adjusted relative risk, 1.85, p= 0.008), which was alsopredicted by a history of cerebrovascular disease. The slope of long-term hearvariability had the best accuracy in predicting all-cause, cardiac and cerebrovasdeath. The presence of frequent ventricular premature beats was specifically relaterisk cardiac of cardiac death, but had a low sensitivity (30%) compared to the sensitof the slope of heart rate variability (60%, V).
Table 3. Significant Predictors of All-Cause Mortality in Proportional Hazards Regressianalysis
Age and sex adjustedassociation with mortality
Association with mortalityadjusted for all variables
Relative risk: 95% CI p-value†Relative
risk:95% CI p-value†
Clinical andlaboratory variables
prior AMI 1.39 (1.12–1.74) 0.003 0.82 (0.58–1.14) NS
angina pectoris 1.40 (1.1–1.67) 0.003 1.23 (0.90–1.66) NS
CHF 1.65 (1.3–2.01) < 0.001 1.70 (1.28–2.26) < 0.001
Abbreviations: AMI = acute myocardial infarction; CHF = congestive heart failure; CI = confidence intervaECG = electrocardiography; SDNN = standard deviation of all N-N intervals; slope of HRV = power-law regsion of heart rate variability. †p-values determined in multivariate Cox regression analysis. NS denotes no
nificant

44
ls;res-n-sig-
D470.book Page 44 Friday, August 7, 1998 3:01 PM
Fig. 2. (V) Examples of power law regression slopes computed over frequencies between 10-2
and 10-4 for a 70-year-old man who was alive 10 years after the 24-hour electrocardiographicrecordings (left), and a 68-year-old man who had died of myocardial infarction 22 months afterthe 24-hour electrocardiographic recording (right). ULF = ultra low frequency power, VLF =very low frequency power, and slope = slope of the regression line computed from the log(pow-er) - log(frequency) plot.
smoking 1.42 (1.01–1.60) 0.04 1.25 (0.92–1.92) NS
functional class 3–4 1.83 (1.46–2.29) < 0.0001 1.24 (0.91–1.68) NS
cardiac medication 1.69 (1.33–2.14) < 0.0001 1.32 (0.96–1.82) NS
CVD 1.33 (1.05–1.69) 0.02 1.40 (0.98–1.98) NS
glucose > 6.0 mmol/l 1.27 (1.06–1.52) 0.009 1.10 (0.85–1.42) NS
Ambulatory ECG data
SDNN < 120 ms 1.29 (1.09–1.53) 0.003 1.16 (0.95–1.77) NS
slope of HRV <−1.5 1.77 (1.48–2.11) < 0.001 1.74 (1.42–2.13) < 0.001
Age and sex adjustedassociation with mortality
Association with mortalityadjusted for all variables
Relative risk: 95% CI p-value†Relative
risk:95% CI p-value†
Abbreviations: AMI = acute myocardial infarction; CHF = congestive heart failure; CI = confidence intervaECG = electrocardiography; SDNN = standard deviation of all N-N intervals; slope of HRV = power-law regsion of heart rate variability. †p-values determined in multivariate Cox regression analysis. NS denotes no
nificant
45
ntly
and
rt rateralereakther
heart
ularte
k
D470.book Page 45 Friday, August 7, 1998 3:01 PM
6.6. Correlations between dynamical and conventional measures ofheart rate behaviour
All the time and spectral measures of heart rate variability correlated highly significawith each other (0.3< r < 0.7 for all, n= 536), with the exception of the ratio of low-to-high frequency components, which correlated only weakly with the other timefrequency domain measures (−0.2 < r < 0.2 for all). The short-term fractal-like scalingexponent and approximate entropy were not related to any single measure of heavariability, but correlated significantly with the ratio of low-to-high frequency spectcomponents (r= 0.74, r= −0.49, respectively, p < 0.001 for both) and with each oth(r = −0.53, p< 0.001). The slope of the power-law regression line showed only a wcorrelation with the time or spectral measures of heart rate variability and with the odynamic parameters (−0.3 < r < 0.3 for all).
6.7. Correlations between dynamical measures of heart rate behaviourand clinical variables
No significant association was observed between the short-term scaling exponent ofrate behaviour and the following clinical variables: age (r= −0.2, ns, I-V), sex,angiographic severity of coronary artery disease, functional class or left ventricejection fraction (r= 0.1, ns) (II). The slope of the power law regression line of heart ravariability showed weak correlations with age (r= −0.16, p< 0.01) and blood glucoseconcentration (−0.14, p< 0.05) and no significant correlations with the other risvariables (V).

46
D470.book Page 46 Friday, August 7, 1998 3:01 PM

fromtaryvioury theratend tol-likethe
ingownan
dardno etrateand
easertery. losshort-cting
toris.iouscture,96,ctal
D470.book Page 47 Friday, August 7, 1998 3:01 PM
7. Discussion
The main new finding of this research was that dynamic analysis methods derivednonlinear dynamics of heart rate behaviour provide substantial complemeninformation of abnormal heart rate dynamics. Dynamical analysis of heart rate beharevealed abnormal patterns of RR interval dynamics which cannot be detected bcommonly employed moment statistics of heart rate variability. Fractal-like heartbehaviour was observed in normal healthy hearts. This organising principle was foube altered in various patient populations. The consequences of a breakdown of fractaorganisation were shown among ventricular tachyarrhythmia patients, in whombreakdown of the fractal-like behaviour of RR intervals predicted life-threatenventricular arrhythmia, and also among elderly people, of whom these with a breakdof the fractal-like behaviour of RR intervals had a significantly higher mortality rate ththose with normal fractal-like heart rate behaviour.
7.1. Heart rate dynamics in patients with stable angina pectoris
The patients with stable uncomplicated coronary artery disease had a lower standeviation of all RR intervals, as expected and already shown by other studies (Hyaal. 1990, Airaksinen et al. 1987). The high-frequency spectral component of heartvariability was also lower in them than in healthy controls. Reduced instantaneouslong term heart rate variability in Poincaré plots was observed in coronary artery dispatients, but their ratio remained unchanged. The patients with stable coronary adisease also showed altered correlation properties in their RR interval dynamics, i.eof normal fractal characteristics, and enhanced regularity in heart rate tracings. The sterm fractal scaling exponent was more sensitive than the other measures in deteabnormalities in heart rate behaviour in this group of patients with stable angina pecInformation about the fractal organisation of heartbeat behaviour provided by prevstudies has shown that healthy heartbeat dynamics have a fractal-like temporal struwith self-similar fluctuations over a wide range of time scales (Goldberger 19Hausdorff et al. 1995, Goldberger 1990). This study implicated that this normal fra

48
aryics officantlow(lesslingncy
beatratiowas
micthat
heartphicardialrtiesrgan
anectralich isrior
e orrctionedrvalteryicalthatarts
ines iny low
omwasow
D470.book Page 48 Friday, August 7, 1998 3:01 PM
property of RR interval dynamics is altered in patients with uncomplicated coronartery disease. This finding is partly related to changes in the spectral characteristheart rate behaviour. In patients with uncomplicated coronary artery disease, a signireduction in the high frequency spectral band indicates a dominant role of thefrequency band. The loss of high frequency fluctuations corresponds to more regularcomplex) short term signal behaviour associated with a higher short-term scaexponent and a lower approximate entropy value. The ratio of the low-to-high frequecomponents did correlate with the short-term fractal scaling exponent of heartbehaviour in this study. However, when the groups were matched with respect to theof low-to-high frequency spectral components, the short term scaling exponent valuestill significantly higher in patients than in the healthy subjects, confirming that dynaanalysis of heartbeat behaviour gives complementary and independent informationcannot be obtained by traditional spectral analysis techniques (I). The changes inrate behaviour variables in this study were not related to the clinical or angiograseverity of coronary artery disease, and none of the patients had evidence of myocischemia during the recordings, suggesting that the loss of fractal correlation propeand the reduction in heartbeat complexity are not simply a consequence of end-odamage caused by ischemic heart disease.
7.2. Heart rate dynamics in patients with prior myocardial infarction
Patients with previous myocardial infarction showed lower heart rate variability thhealthy controls as analysed with time and frequency domain measures. Of the spmeasures, the low frequency spectral component was most markedly reduced, whconcurrent with the finding of a reduced low frequency component in patients with a pmyocardial infarction by Bigger et al. (1995). Neither a short term fractal-like measura power-law slope was able to detect changes in the heart rate behaviour of postinfapatients, but continuous long term variabil ity in Poincaré plots differentiatpostinfarction patients from healthy controls. Despite the reduced overall RR intevariability, the approximate entropy of RR interval dynamics increased in coronary ardisease patients with a prior myocardial infarction. This was the most efficient dynammeasure for differentiating postinfarction patients from healthy subjects, implicatingthe intrinsic randomness or unpredictability of RR interval dynamics increases in hedamaged by myocardial infarction.
The explanation for why the measure of approximate entropy is higherpostinfarction patients than in healthy subjects can be partly derived from changspectral measures.The reduction in the dominant power spectrum band, i.e verfrequency or low frequency band, in postinfarction patients results in more randbehaviour of RR interval data, resulting in higher approximate entropy. This conceptconfirmed by experiments with artificial signals, where decreased very low or lfrequency power caused invariably higher approximate entropy values.

49
rvalsiatenlyriskeia.
todia.o beia,
ctralshort
artlyshorthererval
y toiour
endst also
enteartt ofto
d anidelyt RR
valjectsed an ofvedet of
lure
D470.book Page 49 Friday, August 7, 1998 3:01 PM
7.3. Heart rate dynamics in patients with vulnerability to ventriculartachyarrhythmia
Of the conventional heart rate variability measures, the standard deviation of RR intewas lower in postinfarction patients than in healthy subjects, but it did not differentbetween patients with and without vulnerability to ventricular tachycardia. The otraditional variable able to differentiate between patients with and without arrhythmiawas the low frequency spectral component (p< 0.01). Of the dynamical measures thpower-law slope did not identify the patients with vulnerability to ventricular arrhythmApproximate entropy was higher in postinfarction patients, but was not abledifferentiate between patients with and without vulnerability to ventricular tachycarThe short term fractal correlation properties of RR interval dynamics appeared taltered, specifically in postinfarction patients with vulnerability to ventricular tachycardimplicating more uncorrelated short term heart rate behaviour. Conventional spemeasures were not able to differentiate between these patients equally well as theterm fractal scaling exponent.
The analysis of short term scaling subtends fluctuations mainly in the high and pin the low frequency part of the signal spectrum. An exponent value 0.5 means thatterm fluctuation is completely random. Values under 0.5 correspond to time series wlong and short RR intervals are more likely to alternate (Peng et al. 1995). RR intebehaviour of this type was only observed in subjects (6 patients) with vulnerabilitventricular tachycardia. A previous study has shown alternating heart rate behavbefore ventricular tachycardia onset (Huikuri et al. 1996), and the present study extthese observations by offering a method to detect not only alternating behaviour, buthe large aperiodic abrupt temporal changes in RR intervals.
7.4. Heart rate dynamics before spontaneous onset of ventricularfibrillation
The standard deviation of RR intervals failed to predict ventricular fibrillation. Consistwith our data, Vybiral et al. (1993) have also shown that conventional analysis of hrate variability fails to predict imminent changes in the RR intervals before the onseventricular fibrillation. Altered beat-to-beat RR interval dynamics were observedprecede the onset of ventricular fibrillation, however. Spectral analysis showeincrease in the high frequency component, but this spectral area was flat and wdistributed. Detrended fluctuation analysis showed that the altered beat-to-beainterval variability resulted from an almost random-like form of short-term RR interbehaviour rather than the fractal-like correlation properties observed in healthy subpreviously (Iyengar et al. 1996). This was visualised in Poincarè plots, which showball-like or complex structure of the plots with an increase in the standard deviatioinstantaneous RR interval variability (Figure 1). Skinner et al. (1994) also obserchanges in the correlation dimension of RR intervals several hours before the onsventricular fibrillation. The present findings agree with the recent findings on heart fai

50
et al.eredawts,n thethes ofeent al.
orets.
erol,the
g theal.
rmjectsalrvival,lawriskher
atediabilityient992,t ratet thatflects
D470.book Page 50 Friday, August 7, 1998 3:01 PM
patients in whom a reduced short term scaling exponent was related to mortality (Ho1997). In addition, the long range correlation properties of RR intervals were also altbefore the onset of ventricular fibrillation. The computed slope of the power-lrelationship of heart rate variability was more negative in ventricular fibrillation patiendespite the absence of differences in low frequency spectral components betweegroups. The slope of the power-law relationship of heart rate variability did not reflectmagnitude of heart rate variability, but rather the distribution of spectral characteristicRR interval oscillations. The steep slope of the power-law relationship has also bshown to be associated with increased mortality in postinfarction patients (Bigger e1996).
7.5. Dynamical measures of heart rate behaviour as a predictor ofmortality in elderly people
Heart rate behaviour analysed by new dynamical methods turned out to be a mpowerful predictor of mortality than the conventional risk markers in elderly subjecConcurrent with the previous findings, the common risk factors, such as cholesthypertension and smoking, were not powerful predictors of death, confirming thatprognostic markers applicable to younger subjects do not perform equally well amonelderly (Anderson et al. 1987, Harris et al. 1988, Mattila et al. 1988, Krumholz et1994).
A previous study of a Framingham cohort showed that the traditional short-temeasures of heart rate variability are able to predict all-cause mortality in elderly sub(Tsuji et al. 1994). In our elderly population with a longer follow-up, the traditionspectral and non-spectral measures did not emerge as independent predictors of subecause they were related to clinical risk variables. The slope of the power-relationship of heart rate behaviour did not bear any significant relation to the othermarkers, and it remained a powerful predictor of survival after adjustment for all otvariables.
The slope of the power-law behaviour of heart rate dynamics was specifically relto vascular causes of death, i.e. cardiac and cerebrovascular deaths. Heart rate varhas been previously shown to predict all-cause and cardiac mortality in patpopulations with documented heart disease (Kleiger et al. 1987, Bigger et al. 1Bigger et al. 1996), but there has been no information on the prognostic role of hearvariability as a predictor of cerebrovascular death. The present findings suggesaltered long-term heart rate behaviour is not only related to cardiac death, but also rean increased risk for any acute vascular events leading to death.

51
ilityer et
thectal-
RRaringoiseletelyl
pidly
o
s,ich
fmayates
ilityctal-s off
theems
this
ctlys of
t ben is
als inrine
D470.book Page 51 Friday, August 7, 1998 3:01 PM
7.6. Mathematical interpretation of dynamical analysis of RR intervals
The mathematical background of the new dynamical measures of RR interval variabused in this study have been described in detail previously by Peng et al. 1995, Biggal. 1996 and Pincus & Goldberger 1994. Briefly, approximate entropy reflectcomplexity of time series data, the power-law regression slope demonstrate the fralike correlation properties of RR interval data over 10-4 to 10-2 Hz, and the short termfractal-like scaling exponent indicate the correlation properties of the shorter terminterval fluctuation. The fluctuations of a time series can also be assessed by comptheir behaviour to various types of artificially generated signals. White Gaussian nrepresents time series where no correlations are found, but the data are comprandom. The power-law slope (β) of a signal of this kind is 0, the short term fractascaling exponent (α) is 0.5 and approximate entropy is∼ 2. Brown noise (1/f2 noise), anintegration of white noise, is characterised by the frequency spectrum of a curve radecaying (power inversely proportional to frequency squared) withβ = −2 andα = 1.5.The frequency curve for a 1/f signal is smooth with fluctuations inversely proportional tfrequency and withβ = −1 andα = 1.0. Approximate entropy values are higher for a 1/fsignal than a 1/f2 signal. The 1/f signal is used as an example of a fractal-like proceswhich is characterised by scale-invariant self-similar long-range correlations, whgenerate irregular and complex fluctuations on multiple time scales.
It has been suggested that the 1/f signal properties might be an organising principle ophysiological structure or function. Changes an organisation pattern of this kindresult in a less adaptable system favouring vulnerability to various pathological st(Goldberger 1996). It was shown here that a breakdown of 1/f signal properties, both inshort term and in long range RR interval behaviour, occurs in subjects with vulnerabto life-threatening arrhythmias, suggesting a causal relationship between altered fralike signal behaviour and the onset of life-threatening arrhythmia. Since the deviationthe short-term slopes from the 1/f curve did not occur immediately before the onset oventricular fibrillation, altered RR interval dynamics may not be a direct trigger ofonset of ventricular fibrillation, but may rather reflect changes in other regulatory systpreconditioning the heart to a life-threatening event. The importance of 1/f signalbehaviour was also seen among elderly people, in whom the breakdown oforganisation pattern was a powerful predictor of cardiovascular death.
7.7. Possible pathophysiological mechanisms of abnormal short andlong term heart rate dynamics
The physiological background of altered short term fractal-like behaviour is not exaknown, but one potential explanation for the altered short-term correlation propertieheart rate dynamics in patients with vulnerability to life-threatening arrhythmia mighaltered sympathovagal interaction (Levy 1971). The concept of sympathoexcitatiosupported by observations of more complex Poincaré plots of successive RR intervheart failure patients (Brouwer et al. 1996, Woo et al. 1994) with high norepineph

52
noust al.t the
y to
lson the-beat
entthat
d to
-laws inheartan initselft rateowably
lteredrise
t withtory
rious994,ationof antial
mayh as
tions,n the
mia
D470.book Page 52 Friday, August 7, 1998 3:01 PM
levels (Woo et al. 1994). Similar changes have also been observed upon intraveinfusion of physiological doses of norepinephrine in young healthy adults (Tulppo e1998). Random, uncorrelated beat-to-beat RR interval behaviour may also reserepolarization dynamics of the myocardium and thereby increase vulnerabilitventricular arrhythmogenesis.
The physiologic relevance of high approximate entropy of RR interval data is aopen to speculation. It is possible that a higher sympathetic tone may also explaireduction in the very low frequency spectral component and the change in beat-tocomplexity and, consequently, the increase in approximate entropy.
The moderate correlation of the value of low-to-high frequency spectral componrates with both fractal correlation properties and approximate entropy suggestsdynamic fractal behaviour and the complexity of RR interval dynamics are relateneuroautonomic interactions.
The physiological background of altered long term heart rate behaviour (powerslope) is not known, but the observation of significantly steeper power-law slopedenervated hearts suggests that it is partly influenced by the autonomic input to the(Bigger et al. 1996).The slope has been found to be steeper in elderly subjects thyounger healthy subjects (Bigger et al. 1996, Saul et al. 1987), showing that ageingresults in progressive changes in the long-term spectral characteristics of hearvariability. No changes in ultra low frequency power, but a linear decline in very lfrequency power have been observed upon ageing (Bigger et al. 1995), which probalso explains the steeper slope of the power-law regression line in the elderly. The aautonomic modulation of long-term heart rate behaviour with advancing age may afrom age-related changes in various organs and body systems, which may interaceach other and thereby impair the function of the cardiovascular autonomic regulasystems.
Abnormalities in the autonomic modulation of heart rate have been observed in vacardiovascular and cerebrovascular disorders (Huikuri 1995, Barron et al. 1Korpelainen et al. 1996), and it is possible that altered cardiovascular neural regulexpressed by a steep slope of long-term heart rate dynamics may be a signunderlying subclinical vascular disease predisposing to mortality. Another potenexplanation for the prognostic role of altered long term heart rate behaviour is that itreflect an impairment in the adaptive systems during acute perturbations, sucmyocardial or cerebral ischemic events. This is supported by experimental observawhich have shown that cardiovascular autonomic regulation plays an important role ioccurrence of life-threatening arrhythmias during acute cardiac or cerebral ische(Schwartz et al. 1992, Hachinski et al. 1992).
fromhichlity.withiousdif-
iseddif-
hiss the
teryted
icularRRple,ntly
D470.book Page 53 Friday, August 7, 1998 3:01 PM
8. Conclusions
1. This research showed that a dynamical analysis of heart rate behaviour derivednonlinear mathematics can reveal abnormal patterns of RR interval dynamics wcannot be detected by commonly employed moment statistics of heart rate variabi
2. Approximate entropy showed heart rate tracings to be more predictable in patientsuncomplicated coronary artery disease, but more complex in patients with prevmyocardial infarction as compared to healthy controls. This method was not able toferentiate patients with and without ventricular tachyarrhytmias.
3. A short term fractal-like scaling exponent of RR intervals showed more organbehaviour in patients with uncomplicated coronary artery disease. It was not able toferentiate patients with previous myocardial infarction from healthy controls. Tmeasure was markedly reduced in patients with life-threatening arrhythmia and wabest variable to differentiate patients with and without ventricular arrhythmia.
4. Long term power-law slope was normal in patients with uncomplicated coronary ardisease, but significantly steeper before ventricular fibrillation, and it also predicmortality in a general elderly population.
5. The consequences of a breakdown of fractal-like organisation were seen in ventrtachyarrhythmia patients, in whom the breakdown of the fractal-like behaviour ofintervals predicted life-threatening ventricular arrhythmia, and also in elderly peoamong whom those with altered fractal-like behaviour of RR intervals had significahigher mortality rates than those with normal fractal-like heart rate behaviour.

54
D470.book Page 54 Friday, August 7, 1998 3:01 PM

ave
rdial
gal
,
)
trumntrol.
amic
m
03-
ction.
rtcular
ontion,
very
ncytion
D470.book Page 55 Friday, August 7, 1998 3:01 PM
References
Adam DR, Smith JM, Akselrod S, Nyberg S, Powell AO, Cohen RJ. (1984) Fluctuation in T-wmorphology and susceptibility to ventricular fibrillation. J Electrocardiol 17:209-218.
Ahnve S, Helmers C, Lundman T, Rehnqvist N, Sjögren A. (1980) QTc interval in acute myocainfarction: first-year prognostic implications. Clin Cardiol 3:303-308.
Airaksinen KEJ, Ikäheimo MJ, Linnaluoto MK, Niemelä M, Takkunen JT. (1987) Impaired vaheart rate control in coronary artery disease. Br Heart J 58: 592-597.
Airaksinen KEJ, Koistinen MJ, Ikäheimo MJ, Huikuri HV, Korhonen U, Pirttiaho H, Linnaluoto MKTakkunen JT. (1989) Augmentation of atrial contribution to left ventricular filling in IDDMsubjects as assessed by Doppler echocardiography. Diabetes Care 12: 159-161.
Airaksinen KEJ, Niemelä MJ, Ikäheimo MI, Huikuri HV, Linnaluoto MK, Takkunen JT. (1991Effect of coronary arterial occlusion on vagal control of heart rate. Int J Cardiol 30: 269-274
Akselrod S, Gordon D, Ubel FA, Shannon DC, Barger MA, Cohen RJ. (1981) Power specanalysis of heart rate fluctuation: a quantitative probe of beat-to-beat cardiovascular coScience 213: 220-222.
Akselrod S, Gordon D, Madwed JB, Snidman NC, Shannon DC, Cohen RJ. (1985) Hemodynregulation: Investigation by spectral analysis. Am J Physiol 249: H867-H875.
Anderson KM, Castelli WP, Levy D. (1987) Cholesterol and mortality: 30 years of follow-up frothe Framingham study. JAMA 257: 2176-2182.
Babyloyantz A, Destexhe A. (1988) Is the normal heart a periodic oscillator? Biol Cybern 58: 2211.
Barron SA, Rogovski Z, Hemli J. (1994) Autonomic consequences of cerebral hemisphere infarStroke 25: 113-116.
Baselli G, Cerutti S, Civardi S, Lombardi F, Malliani A, Merri M, Pagani M, Rizzo G. (1987) Hearate variability signal processing: A quantitative approach as an aid to diagnosis in cardiovaspathologies. Int J Bio-Med Comput 20:51-70.
Bergé P, Pomeau Y, Vidal C. (1984) Order within chaos. New York: John Wiley & Sons.Bigger JT Jr., Fleiss JL, Kleiger RE, Miller JP, Rolnitzky LM (1984) The Multicenter Postinfarcti
Research Group. The relationship among ventricular arrhythmias, left ventricular dysfuncand mortality in the 2 years after myocardial infarction. Circulation 69: 250-258.
Bigger JT Jr., Fleiss JL, Rolnitzky LM, Steinman RC, Schneider WJ. (1991) Time course of recoof heart period variability after myocardial infarction. J Am Coll Cardiol 18: 1643-1649.
Bigger JT Jr., Fleiss JL, Steinman RC, Rolnitzky LM, Kleiger RE, Rottman JN (1992) Frequedomain measures of heart period variability and mortality after myocardial infarction. Circula85: 164-171.
56
ilityse or
lawcute
dalls in
eart
ineof
ocol
se in
rateoll
RR
pbellEur
bility
3)left
is ofS14-
ility9.
n-althy
andhysiol
in
l in
siol
D470.book Page 56 Friday, August 7, 1998 3:01 PM
Bigger JT Jr, Fleiss JL, Steinman RC, Rolnitzky LM, Schneider WJ, Stein PK. (1995) RR variabin healthy, middle-aged persons compared with patients with chronic coronary heart disearecent acute myocardial infarction. Circulation 91: 1936-1943.
Bigger JT Jr., Steinman RC, Rolnitzky LM, Fleiss JL, Albrecht P, Cohen RJ (1996) Powerbehavior of RR-interval variability in healthy middle-aged persons, patients with recent amyocardial infarction, and patients with heart transplants. Circulation 93: 2142-2151.
Bloomfield P. Fourier analysis of time series: an introduction. In: Bradley AB, Hunter JS, KenDG, Watson SG (eds.). (1976) Fourier analysis of time series: an introduction, Wiley SerieProbability and Mathematical Statistics, John Wiley, New York, pp 1-258.
Bonaduce D, Murciano F, Petretta M et al. (1994) Effects of converting enzyme inhibitors on hperiod variability in patients with acute myocardial infarction. Circulation 90: 108-113.
Bourke JP, Richards DAP, Ross DL, Wallace EM, McGuire MA, Uther JB. (1991) Routprogrammed electrical stimulation in survivors of acute myocardial infarction for predictionspontaneous ventricular tachyarrhythmias during follow-up: results, optimal stimulation protand cost-effective screening. J Am Coll Cardiol 18: 780-788.
Boutcher SH, Stein P (1995) Association between heart rate variability and training responsedentary middle aged men. Eur J Appl Phys & Occup Phys 70: 75-80.
Brouwer J, van Veldhuisen DJ, Man in ´t Veld AJ, et al. (1996) Prognostic value of heartvariability during long-term follow-up in patients with mild to moderate heart failure. J Am CCardiol 28: 1183-1189.
Brown TE, Beightol LA, Koh J, Eckberg DL. (1993) Important influence of respiration on humaninterval power spectra is largely ignored. J Appl Physiol. 75: 2310-2317.
Burg JP. Maximum entropy spectral analysis. Dissertation, Stanford University, May 1975, CamRWF, Gardiner P, Amos PA, Chadwick D, Jordan RS. (1985) Measurement of QT interval.Heart J 6(suppl D): 81-85
Casolo G, Balli E, Taddei T, Amuhasi J, Gori C. (1989) Decreased spontaneous heart rate variaon congestive heart failure Am J Cardiol 64: 1162-1167.
Chakko S, Multingtapang RF, Huikuri HV, Kessler KM, Materson BJ, Myerburg RJ: (199Alterations in heart rate variability and its circadian rhythm in hypertensive patients withventricular hypertrophy free of coronary artery disease. Am Heart J 126:1364-1372
Cloarec-Blanchard, L Girard A, Houhou S, Grunveld JP, Elghozi JL. (1992) Spectral analysshort-term blood pressure and heart rate variability in uremic patients. Kidney Int (suppl 37):S18.
Cripps TR, Malik M, Farrell TG, Camm AJ. (1991) Prognostic value of reduced heart rate variabafter myocardial infarction: clinical evaluation of a new analysis method. Br Heart J 65:14-1
Crutchfield JP, Farmer JD, Packard NH, Shaw RS. (1987) Chaos. Sci Am 255: 38-49.David LD, Billon N, Costagliola D, Jaillon P, Funck-Brentano C. (1994) Reproducibility of no
invasive measurement and of short-term variability of blood pressure and heart rate in hevolunteers. Br J Clin Pharmac 38: 109-115.
Davidson NS, Goldner S, McCloskey DI. (1976) Respiratory modulation of baroreceptorchemoreceptor reflexes affecting heart rate and cardiac vagal efferent nerve activity. J P259: 523-530.
Day CP, McComb CM, Campbell RWF. (1990) QT dispersion: an indication of arrhythmia riskpatients with long QT intervals. Br Heart J 63: 342-344.
De Meersman RE. (1993) Heart rate variability and aerobic fitness. Am Heart J 125: 726-731.Devaney RL. (1987) Chaotic bursts in nonlinear dynamical systems. Science 235: 342-344.Eckberg DL, Drabinsky M, Braunwald E. (1971) Defective cardiac parasympathetic contro
patients with heart disease. N Engl J Med 283: 877-883.Eckberg DL. (1983) Human sinus arrhythmia as an index of vagal cardiac outflow. J Appl Phy
54: 961-966.

57
cs 57:
RJ, Ed.
hetic
iskility,
Coll
tic7.
action.
ate of
ia inMed
ctories
ew
s in3-987.diac
ty at
9: 189-
gnal.
uating
diac
y &
for
enrate
ular
lk?49-
D470.book Page 57 Friday, August 7, 1998 3:01 PM
Eckberg DL. (1997) Sympathovagal balance; a critical appraisal. Circulation 96: 3224-3232.Eckmann JP, Ruelle D. (1985) Ergodic theory of chaos and strange attractors. Rew Mod Physi
617-656.Ewing DJ. (1984) Cardiac autonomic neuropathy, in diabetes and heart disease. p.122 Jarrett
NY, ElsevierEwing DJ, Neilson JMM, Travis P. (1984b) New method for assessing cardiac parasympat
activity using 24 hour electrocardiograms. Br Heart J 52: 396-402.Farrell TG, Bashir Y, Cripps T, Malik M, Poloniecki J, Bennett ED, Ward DE, Camm AJ: (1991) R
stratification for arrhythmic events in postinfarction patients based on heart rate variabambulatory electrocardiographic variables and the signal-averaged electrocardiogram. J AmCardiol 18: 687-697.
Farrell TG, Odemuyiwa O, Bashir Y, Cripps TR, Malik M, Ward DE, Camm AJ. (1992) Prognosvalue of baroreflex sensitivity testing after acute myocardial infarction. Br Heart J 67: 129-13
Flapan AD, Wright RA, Nolan J, Neilson JMM, Ewing DJ. (1993) Differing patterns of cardiparasympathetic activity and their evolution in selected patients with a first myocardial infarcJ Am Coll Cardiol 21: 926-931.
Fleisher LA, Pincus SM, Rosenbaum SH. (1993) Approximate entropy of heart rate as a correlpostoperative ventricular dysfunction. Anesthesiology 78: 683-692.
Follansbee WP, Michelson EL, Morganroth J. (1980) Nonsustained ventricular tachycardambulatory patients: characteristics and association with sudden cardiac death. Ann Intern92: 741-747.
Freeman WJ. (1988) Strange attractors that govern mammalian brain dynamics shown by trajeof electroencephalographic (EEG) potential. Transactions Circuits and Systems 35: 781.
Gleick J. Chaos: (1987) making of a new science. New York: Viking.Goldberger AL, West BJ. (1987) Applications of nonlinear dynamics to clinical cardiology. Ann N
York Acad Sci 504: 155-212.Goldberger AL, Rigney DR, Mietus J, Antman EM, Greenwald S. (1987) Nonlinear dynamic
sudden cardiac death syndrome: heart rate oscillations and bifurcations. Experientia 44: 98Goldberger AL. (1990) Nonlinear dynamics, fractals and chaos: applications to car
electrophysiology. Ann Biomed Eng 18: 195-198.Goldberger AL. (1996) Non-linear dynamics for clinicians: chaos theory, fractals, and complexi
the bedside. Lancet 347: 1312-1314.Grassberger P, Procaccia I. (1983) Measuring the strangeness of strange attractors. Physica D
208.Grassberger P, Procaccia I. (1983b) Estimation of the Kolmogorov entropy from a chaotic si
Phys Rew A 28: 2591-2593.Grassberger P, Procaccia I. (1984) Dimensions and entropies of strange attractors from a fluct
dynamics approach. Physica D 13: 34-54.Hachinski VC, Wilson JX, Smith KE, Cechetto DF. (1992) Effect of age on autonomic and car
responses in a rat stroke model. Arch Neurol 49: 690-696.Hales S. Haemastaticks In: Hales, S. (ed.), Statistical Essays, vol II, Innings, 1733; Manb
Woodward, LondonHarris T, Cook EF, Kannel WB, Goldman L. (1988) Proportional hazard analysis of risk factors
coronary heart disease in individuals aged 65 or older. J Am Geriatr Soc 36: 1023-1028.Hartikainen JE, Malik M, Staunton A, Poloniecki J, Camm AJ. (1996) Distinction betwe
arrhythmic and nonarrhythmic death after acute myocardial infarction based on heartvariability, signal-averaged electrocardiogram, ventricular arrhythmias and left ventricejection fraction. J Am Coll Cardiol 28: 296-304.
Hausdorff JM, Peng CK, Ladin Z, Wei JY, Goldberger AL. (1995) Is walking a random waEvidence for long-range correlations in the stride interval of human gait. J Appl Physiol 78: 3

58
a K.se. Its
e Y,rmal
ngnear
ted55:
eath,
rate09-
J.70:
RJ.d and220-
iantients.
RJ.f life-
tion
,73-
the
4.1419.l,
heart
ateuring
ntrol
87)
D470.book Page 58 Friday, August 7, 1998 3:01 PM
358.Hayano J, Sakakibara Y, Yamada A, Ohte N, Fujinami T, Yokoyama K, Watanabe Y, Takat
(1990) Decreased magnitude of heart rate spectral components in coronary artery disearelation to angiographic severity. Circulation 81: 1217-1224.
Hayano J, Sakakibara Y, Yamada A, Yamada M, Mukai S, Fujinami T, Yokoyama K, WatanabTakata K. (1991) Accuracy of assessment of cardiac vagal tone by heart rate variability in nosubjects. Am J Cardiol 67: 199-204.
Ho KKL, Moody GB, Peng CK, Mietus JE, Larson MG, Levy D, Goldberger AL. (1997) Predictisurvival in heart failure cases and controls using fully automated methods for deriving nonliand conventional indices of heart rate dynamics. Circulation 96: 842-848.
Holmes J, Kubo SH, Cody RJ, Kligfield P. (1985) Arrhythmias in ischemic and nonischemic dilacardiomyopathy: prediction of mortality by ambulatory electrocardiography. Am J Cardiol146-151.
Hon EH & Lee ST. (1965) Electronic evaluation of the fetal heart rate patterns preceding fetal dfurther observations. Am J Obstet Gynecol 87: 814-826.
Hopf HB, Skyschally A, Heusch G, Peters J. (1995) Low-frequency spectral power of heartvariability is not a specific marker of cardiac sympathetic modulation. Anesthesiology 82: 6619.
Huikuri HV, Linnaluoto MK, Seppänen T, Airaksinen KEJ, Kessler KM, Takkunen JT, Myerburg R(1992) Circadian rhythm of heart rate variability in survivors of cardiac arrest. Am J Cardiol610-615.
Huikuri HV, Valkama JO, Airaksinen KEJ, Seppänen T, Kessler KM, Takkunen JT, Myerburg(1993) Freguency domain measures of heart rate variability before onset of nonsustainesustained ventricular tachycardia in patients with coronary artery disease. Circulation 87: 11228.
Huikuri HV, Niemelä MJ, Ojala S, Rantala A, Ikäheimo MJ, Airaksinen KEJ. (1994) Circadrhythms of frequency domain measures of heart rate variability in healthy subjects and pawith coronary artery disease. Effects of arousal and upright posture. Circulation 90: 121-126
Huikuri HV. (1995) Heart rate variability in coronary artery disease. J Int Med 237: 349-357.Huikuri HV, Seppänen T, Koistinen MJ, Airaksinen KEJ, Ikäheimo MJ, Castellanos A, Myerburg
(1996) Abnormalities in beat-to-beat dynamics of heart rate before the spontaneous onset othreatening ventricular tachyarrhythmias in patients with prior myocardial infarction. Circula93: 1836-1844.
Huikuri HV, Ylitalo A, Pikkujämsä SM, Ikäheimo MJ, Airaksinen KEJ, Rantala AO, Lilja MKesaniemi YA. (1996) Heart rate variability in systemic hypertension. Am J Cardiol 77: 101077.
Iyengar N, Peng CK, Morin R, Goldberger AL, Lipsitz LA. (1996) Age-related alterations infractal scaling of cardiac interbeat interval dynamics. Am J Physiol 271: R1078-R1084.
Jensen RV. (1987) Classical chaos. Am Sci 75: 168-81.Kaplan DT, Goldberger AL. (1991) Chaos in cardiology. J Cardiovasc Electrophysiol 2: 342-35Kay SM, Marple SL Jr. (1981) Spectrum analysis - a modern perspective. Proc IEEE 69: 1380-Kienzle MG, Ferguson DW, Birkett CL, Myers GA, Berg WJ, Mariano DJ. (1992) Clinica
hemodynamic and sympathetic neural correlates of heart rate variability in congestivefailure. Am J Cardiol 69: 761-767.
Kingwell BA, Thompson JM, Kaye DM,Mcpherson GA, Jennings GL, Esler MD. (1994) Heart rspectral analysis, cardiac norepinephrine spillover, and muscle sympathetic nerve activity dhuman sympathetic nervous activation and failure. Circulation 90: 234-240.
Kitney RI. (1975) An analysis of the nonlinear behaviour of the human thermal vasomotor cosystem. J Theor Biol 52: 231-248.
Kleiger RE, Miller JP, Bigger JT, Moss AJ, the Multicenter Post-infarction Research Group. (19

59
rdial
rate
gal
iac
s063.R,eart
fterlide
in-467.
ical. A
ation
.als
et 1:
sure
ter4.d in
the
nal
ptortivity.
ary
dian. J
death
D470.book Page 59 Friday, August 7, 1998 3:01 PM
Decreased heart rate variability and its association with increased mortality after myocainfarction. Am J Cardiol 59: 256-262.
Kleiger RE, Stein PK, Bosner MS, Rottman JN. (1992) Time domain measurement of heartvariability. Cardiol Clin 10: 487-498.
Koh J, Brown TE, Beightol LA, Ha CY, Eckberg DL. (1994) Human autonomic rhythms: vacardiac mechanisms in tetraplegic subjects. J Physiol (Lond) 474: 483-495.
Kollai M, Mizsei G. (1990) Respiratory sinus arrhythmia is a limited measure of cardparasympathetic control in man. J Physiol (Lond) 424: 329-342.
Korpelainen JT, Sotaniemi KA, Huikuri HV, Myllylä VV. (1996) Abnormal heart rate variability aa manifestation of autonomic dysfunction in hemispheric brain infarction. Stroke 27: 1059-1
Krumholz HM, Seeman TE, Merrill SS, deLeon MCF, Vaccarino V, Silverman DI, TsukaharaOstfeld AM, Berkman LF. (1994) Lack of association between cholesterol and coronary hdisease mortality in persons over than 70 years. JAMA 272: 1335-1340.
Kuchar DL, Thorburn CW, Sammel NL. (1987) Prediction of serious arrhythmic events amyocardial infarction: signal-averaged electrocardiogram, Holter monitoring and radionucventriculography. J Am Coll Cardiol 9: 531-538.
Kuroiwa Y, Shimada Y, Toyokura Y. (1983) Postural hypotension and low RR interval variabilityparkinsonism, spino-cerebellar degeneration, and Shy-Drager syndrome. Neurology 33: 463
La Rovere MT, Specchia G, Mortara A, Schwartz PJ. (1988) Baroreflex sensitivity, clincorrelates, and cardiovascular mortality among patients with a first myocardial infarctionprospective study. Circulation 78: 816-824.
Lecocq B, Lecocq V, Jaillon P. (1989) Physiologic relation between cardiac cycle and QT durin healthy volunteers. Am J Cardiol 63: 481-486.
Levy MN. (1971) Sympathetic-parasympathetic interactions in the heart. Circ Res 29: 437-445Lipsitz LA, Goldberger AL. (1992) Loss of “complexity” and aging. Potential applications of fract
and chaos theory to senescence. JAMA 267: 1806-1809.Lorenz EN. (1963) Deterministic nonperiodic flow. J Atmospheric Sci 20: 130-141.Lowensohn RI, Weiss M, Hon EH. (1977) Heart rate variability in brain-damaged adults. Lanc
626-628.Madwed JB, Aibrecht P, Mark RG, Cohen RJ. (1989) Low-frequency oscillation in arterial pres
on heart rate: a simple computer model. Am J Physiol 256: H1573-H1579.Malik M, Farrell T, Cripps TR, Camm AJ. (1989) Heart rate variability in relation to prognosis af
myocardial infarction: selection of optimal processing techniques. Eur Heart J 10: 1060-107Malliani A, Pagani M, Lombardi F, Cerutti S. (1991) Cardiovascular neural regulation explore
the frequency domain. Circulation 84: 482-492.Mandelbrot BB. (1982) The fractal geometry of nature. San Francisco: Freeman.Mattila K, Haavisto M, Rajala S, Heikinheimo R. (1988) Blood pressure and five year survival in
very old. Br Med J 296: 887-889.Mayer-Kress G, Yates FE, Benton L, Keidel M, Tirsch W, Pöppl SJ, Geist K. (1988) Dimensio
analysis of nonlinear oscillations in brain, heart, and muscle. Math Biosci 90: 155-182.McCabe PM, Yongue BG, Ackles PK, Porges SW. (1985) Respiratory modulation of barorece
and chemoreceptor reflexes affecting heart rate and cardiac vagal efferent nerve acPsychophysiology 22: 195-203.
Minisi AJ, Thames MD. (1989) Effect of chronic myocardial infarction on vagal cardiopulmonbaroreflex. Circ Res 65: 396-405.
Mitchell L, Wyse D, Duff H. (1986) Programmed electrical stimulation for ventricular tachycarinduction in humans. The role of ventricular functional refractoriness in tachycardia inductioAm Coll Cardiol 8: 567-575.
Moss AJ, DeCamilla J, Chilton J, Davis HT. (1982) The chronology and suddenness of cardiacafter myocardial infarction. Ann N Y Acad Sci 382: 465-473.

60
n to
JE,tudylow-
in
in
theall-
Am J
mrate
G,ssures 59:
ipuscle
afterand
and
atory
tsial
6)and
artar30:
S,ients
d Sci
ons.
rate
D470.book Page 60 Friday, August 7, 1998 3:01 PM
Moss AJ, Davis HT, DeCamilla J, Bayer LW. (1979) Ventricular ectopic beats and their relatiosudden and nonsudden death after myocardial infarction. Circulation 60: 998-1003.
Mukharji J, Rude RE, Poole WK, Gustafson N, Thomas LJ Jr., Strauss HW, Jaffe AS, MullerRoberts R, Raabe DS Jr., Croft CH, Passamani E, Braunwald E, Willerson JT, the MILIS SGroup. (1984) Risk factors for sudden death after acute myocardial infarction: two-year folup. Am J Cardiol 54: 31-36.
Murray A, Ewing DJ, Campbell IW, Neilson JMM, Clarke BF. (1975) RR interval variationsyoung male diabetics. Br Heart J 37: 882-885.
Niemelä MJ, Airaksinen KEJ, Huikuri HV. (1994) Effect of beta-blockade on heart rate variabilitypatients with coronary artery disease. J Am Coll Cardiol 23: 1370-1377.
Odemuyiwa O, Malik M, Farrell T, Bashir Y, Poloniecki J, Camm AJ. (1991) Comparison ofpredictive characteristics of heart rate variability index and left ventricular ejection fraction forcause mortality, arrhythmic events and sudden death after acute myocardial infarction.Cardiol 68: 434-439.
Odemuyiwa O, Poloniecki J, Malik M, Farrell T, Xia R, Staunton A, Kulakowski P, Ward D, CamJ. (1994) Temporal influences on the prediction of postinfarction mortality by heartvariability: a comparison with the left ventricular ejection fraction. Br Heart J 71: 521-527.
Pagani M, Lombardi F, Guzzetti S, Rimoldi O, Furlan R, Pizzinelli P, Sandrome G, MalfattoDell’orto S, Piccaluga E, et al. (1986) Power spectral analysis in heart rate and arterial prevariabilities as a marker of sympatho-vagal interaction in man and conscious dog. Circ Re178-193.
Pagani M, Montano N, Porta A, Malliani A, Abboud FM, Birkett C, Somers VK. (1997) Relationshbetween spectral components of cardiovascular variabilities and direct measures of msympathetic nerve activity in humans. Circulation 95: 1441-1448.
Pedretti R, Etro MD, Laporta A, Braga SS, Caru B. (1993) Prediction of late arrhythmic eventsacute myocardial infarction from combined use of noninvasive prognostic variablesinducibility of sustained monomorphic ventricular tachycardia. Am J Cardiol 71: 1131-1141.
Peng CK, Havlin S, Stanley HE, Goldberger AL. (1995) Quantification of scaling exponentscrossover phenomena in nonstationary heartbeat time series. Chaos 5: 82-87.
Pepine CJ, Morganroth J, McDonald JT, Gottlieb SO. (1991) Sudden death during ambulelectrocardiographic monitoring. Am J Cardiol 68: 785.
Perkiömäki JS, Koistinen MJ, Yli-Mäyry S, Huikuri HV. (1995) Dispersion of QT interval in patienwith and without susceptibility to ventricular tachyarrhythmias after previous myocardinfarction. J Am Coll Cardiol 26: 174-179.
Perkiömäki JS, Ikäheimo MJ, Pikkujämsä SM, Ranta A, Lilja M, Kesäniemi YA, Huikuri HV. (199Dispersion of QT interval and autonomic modulation of heart rate in hypertensive men withwithout left ventricular hypertrophy. Hypertension 28: 16-21.
Perkiömäki JS, Huikuri HV, Koistinen MJ, Mäkikallio T, Castellanos A, Myerburg RJ. (1997) Herate variability and dispersion of QT interval in patients with vulnerability to ventricultachycardia and ventricular fibrillation after previous myocardial infarction. J Am Coll Cardiol1331-1338.
Petretta M, Marciano F, Bianchi V, Migaux ML, Valva G, De Luca N, Salemme L, BerardinoBonaduce D. (1995) Power spectral analysis of heart period variability in hypertensive patwith left ventricular hypertrophy. Am J Hypertens 8: 1206-1213.
Pincus SM. (1991) Approximate entropy as a measure of system complexity. Proc Natl AcaUSA 88: 2297-2301.
Pincus SM, Huang WM. (1992) Approximate entropy: statistical properties and applicatiCommun Stat Theory Meth 21: 3061-3077.
Pincus SM, Viscarello RR. (1992) Approximate entropy: a regularity statistic for fetal heartanalysis. Obst Gynecol 79: 249-255.
61
tify?
ial9.,heart
ion;
haos.
agal
art
eart
eartary
nd
rnans
els. Am
eats
ical
nuous
osing
ility:EE
nerve
sis of245.is ofuring
leep-
with
eath:
D470.book Page 61 Friday, August 7, 1998 3:01 PM
Pincus SM, Goldberger AL. (1994) Physiologic time-series analysis: what does regularity quanAm J Physiol 226: H1643-H1656.
Pipilis A, Flather M, Ormerod O, Sleight P. (1991) Heart rate variability in acute myocardinfarction and its association with infarct site and clinical course. Am J Cardiol 67: 1137-113
Pomeranz B, Macaulay RJB, Caudill MA, Kutz I, Adam D, Gordon D, Kilborn KM, Barger ACShannon DC, Cohen RJ, Benson H. (1985) Assessment of autonomic function in humans byrate spectral analysis. Am J Physiol 248: H151-H153.
Pool R. (1989) Is it healthy to be chaotic? Science 243: 604-607.Press WH, Teuklosky SA, Vetterling WT, Flannery BP. (1995) Numerical recipies in C, 2nd edit
Cambridge University Press.Procaccia I. (1988) Universal properties of dynamically complex systems: the organization of c
Nature 333: 618-623.Raczkowska M, Eckberg DL, Ebert TJ. (1983) Muscarinic cholinergic receptors modulate v
cardiac responses in man. J Auton Nerv Syst 7: 271-278.Ravenswaaij-Arts CMA, Kollee LAA, Hopman JCW, Stoelinga GBA, van Geijn HP. (1993) He
rate variability. Ann of Internal Med 118: 436-447.Reiling MJ, Seals DR. (1988) Respiratory sinus arrhythmia and carotid baroreflex control of h
rate in endurance athletes and untrained controls. Clin Physiol 8: 511-519.Rich MW, Saini JS, Keiger RE, Carney RM, teVelde A, Freedland KE. (1988) Correlation of h
rate variability with clinical and angiographic variables and late mortality after coronangiography. Am J Cardiol 62: 714-717.
Rich MW, Saini JS, Kleiger RE, Fleiss JL, Steinman RC, Rolnitzky LM. (1991) Effect of atenol adiltiazem on heart period variability in normal persons. J Am Coll Cardiol 68: 155-160.
Rosenbaum DS, Jackson LE, Smith JM, Garan H, Ruskin JN, Cohen RJ. (1994) Electrical alteand vulnerability to ventricular arrhythmias. N Eng J Med 330: 235-241.
Rosenbaum M, Race D. (1968) Frequency-response characteristics of vascular resistance vessJ Physiol 215: 1397-1402.
Ruberman W, Weinblatt E, Goldberg JD, Frank CW, Shapiro S. (1977) Ventricular premature band mortality after myocardial infarction. N Engl J Med 297: 750-757.
Ruelle D. (1979) Sensitive dependence on initial conditions and turbulent behavior of dynamsystems. Ann NY Acad Sci 316: 408-416.
Räihä IJ, Piha SJ, Seppänen A, Puukka P, Sourander LB. (1994) Predictive value of contiambulatory electrocardiographic monitoring in elderly people. Br Med J 309: 1263-1267.
Räihä I, Luutonen S, Piha J, Seppänen A, Toikka T, Sourander L. (1995) Prevalence, predispfactors, and prognostic importance of postural hypotension. Arch Intern Med 155: 930-935.
Saul JP, Albrecht P, Berger RD, Cohen RJ. (1987) Analysis of long-term heart rate variabmethods, 1/f scaling and implications. In: Computers in Cardiology. Silver Spring. Md: IEComputer Society Press; 419-422.
Saul JP, Rea RF, Eckberg DL, Berger RD, Cohen RJ. (1990) Heart rate and muscle sympatheticvariability during reflex changes of autonomic activity. Am J Physiol 258: H713-H721.
Saul JP, Berger RD, Albrecht P, Stein SP, Chen MH, Cohen RJ. (1991) Transfer function analythe circulation: unique insights into cardiovascular regulation. Am J Physiol 261: H1231-H1
Savage HR, Kissane JQ, Becher EL, Maddocks WQ, Murtaugh JT, Dizadji H. (1987) Analysambulatory electrocardiograms in 14 patients who experienced sudden cardiac death dmonitoring. Clin Cardiol 10: 621.
Schechtman VL, Harper RK, Harper RM. (1993) Development of heart rate dynamics during swaking states in normal infants. Pediatr Res 34: 618-623.
Schwartz PJ, Wolf S. (1978) QT interval prolongation as predictor of sudden death in patientsmyocardial infarction. Circulation 57: 1114-1122.
Schwartz PJ, La Rovere MT, Vanoli E. (1992) Autonomic nervous system and sudden cardiac d

62
ion.
eflex
ular
eat
ue of
p in
andical
earttion
t ofation
eat
te
tionAm
ofses of
cts608.ratt
phic
e
on:
nd565-
heart
ctal830-
ri69-
D470.book Page 62 Friday, August 7, 1998 3:01 PM
experimental basis and clinical observations for post-myocardial infarction risk stratificatCirculation 85 (suppl I), 77-91.
Seals DR, Chase PB (1989) Influence of physical training on heart rate variability and barorcirculatory control. J Appl Physiol 66: 1886-1895.
Simson MB. (1981) Use of signals in the terminal QRS complex to identify patients with ventrictachycardia after myocardial infarction. Circulation 64: 235-242.
Skinner JE, Pratt CM, Vybiral T. (1993) A reduction in the correlation dimension of heartbintervals precedes imminent ventricular arrhythmias. Am Heart J 125: 731-743.
Smith SA. (1982) Reduced sinus arrhythmia in diabetic autonomic neuropathy: diagnostic valan age-related normal range. Br Med J 285: 1599-1601.
Smyth HS, Sleight P, Pickering GW. (1969) Reflex regulation of arterial pressure during sleeman: A quantitative method assessing baroreflex sensitivity. Circ Res 24: 109-121.
Task Force of the European Society of Cardiology and the North American Society of PacingElectrophysiology. (1996) Heart rate variability: standards of measurement, physiologinterpretation, and clinical use. Circulation 93: 1043-1065.
Tsuji H, Venditti FJ, Manders ES, Evans JC, Larson MG, Feldman CL, Levy D. (1994) Reduced hrate variability and mortality risk in an elderly cohort: The Framingham Heart Study. Circula90: 873-877.
Tsuji H, Larson MG, Venditti FJ, Manders ES, Evans JC, Feldman CL, Levy D. (1996) Impacreduced heart rate variability on risk for cardiac events. The Framingham Heart Study. Circul94: 2850-2855.
Tulppo MP, Mäkikallio TH, Takala TES, Seppänen T, Huikuri HV. (1996) Quantitative beat-to-banalysis of heart rate dynamics during exercise. Am J Physiol 271: H244-H252.
Tulppo MP, Mäkikallio TH, Airaksinen KEJ, Huikuri HV. (1998) Nonlinear dynamics of heart raduring accentuated sympatho-vagal interaction. Am J Physiol, in press.
Vaishnav S, Stevenson R, Marchant B, Lagi K, Ranjadayalan K, Timmis AD. (1994) Relabetween heart rate variability early after acute myocardial infarction and long-term mortality.J Cardiol 73: 653-657.
Valkama JO, Huikuri HV, Airaksinen KEJ, Linnaluoto MK, Takkunen JT. (1994) Determinantsfrequency domain measures of heart rate variability in the acute and convalescent phamyocardial infarction. Cardiovasc Res 28: 1273-1276.
Vybiral T, Bryg RJ, Maddens ME, Bhasin SS, Cronin S, Boden WE, Lehmann MH. (1990) Effeof transdermal scopolamine on heart rate variability in normal subjects. Am J Cardiol 65: 604-
Vybiral T, Glaeser DH, Goldberger AL, Rigney DR, Hess KR, Mietus J, Skinner JE, Francis M, PCM. (1993) Conventional heart rate variability analysis of ambulatory electrocardiograrecordings fails to predict imminent ventricular fibrillation. J Am Coll Cardiol 22: 557-565.
Wolf A, Swift JB, Swinney HL, Vastano JA. (1985) Determining Lyapunov exponents from timseries. Physica D 16: 285-317.
Wolf MM, Varigos GA, Hunt D, Sloman JG. (1978) Sinus arrhythmia in acute myocardial infarctitwo-year follow-up. Med J Aust 2: 52-53.
Woo MA, Stevenson WG, Moser DK, Middlekauff HR. (1994) Complex heart rate variability aserum norepinephrine levels in patients with advanced heart failure. J Am Coll Cardiol 23:569.
Yamamoto Y, Hughson RL. (1991) Coarse-graining spectral analysis: new method for studyingrate variability. J Appl Physiol 71(3): 1143-1150.
Yamamoto Y, Nakamura Y, Sato H, Yamamoto M, Kato K, Hughson RL. (1995) On the franature of heart rate variability in humans: effects of vagal blockade. Am J Physiol 269: RR837.
Ylitalo A, Airaksinen J, Tahvanainen KUO, Kuusela TA, Ikäheimo MJ, Rantala A, Lilja M, HuikuHV. (1997) Baroreflex sensitivity in drug-treated systemic hypertension. Am J Cardiol 80: 13

63
ular
laracute
ionof
ain
D470.book Page 63 Friday, August 7, 1998 3:01 PM
1372.Zabel M, Portnoy S, Franz MR. (1995) Electrocardiographic indexes of dispersion of ventric
repolarization: an isolated heart validation study. J Am Coll Cardiol 25: 746-752.Zoni-Berisso M, Molini D, Mela GS, Vecchio C. (1996) Value of programmed ventricu
stimulation in predicting sudden death and sustained ventricular tachycardia in survivors ofmyocardial infarction. Am J Cardiol 77: 673-680.
Zuanetti G, Latini R, Neilson JMM, Schwartz PJ, Ewing DJ, the Antiarrhythmic Drug EvaluatGroup (ADEG). (1991) Heart rate variability in patients with ventricular arrhythmias: effectantiarrhythmic drugs. J Am Coll Cardiol 17: 604-612.
Öri Z, Monir G, Weiss J, Sayhouni X, Singer DH. (1992) Heart rate variability, frequency domanalysis. Cardiology Clinics 10: 3: 499-537.