analysis of health budget and financing for nmch … · analysis of health budget and financing for...
TRANSCRIPT
November 2011
0
Analysis of Health Budget and Financing for MNCH in Tanzania
Final Report
November 2011
Prepared by
MNCH Financing in Tanzania
October 2011
1
1
LIST OF ACRONYMS/ ABBREVIATIONS
CARMMA Campaign for Accelerated Reduction of Maternal Mortality
CCHP Comprehensive Council Health Plan
CCPH Comprehensive Council Health Plan
DHS Demographic and Health Survey
DMO District Medical Officer
GDP Gross Domestic Product
HSSP Health Sector Strategic Plan
IMS Information Management System
MDGS Millennium Development Goals
MKUKUTA Mkakati wa Kukuza Uchumi na Kupunguza Umasikini Tanzania
MMAM Mpango wa Maendeleo wa Afya ya Msingi
MNCH Maternal, Newborn and Child Health
MoHSW Ministry of Health and Social Welfare
MTEF Medium Term Expenditure Framework
NSGRP National Strategy for Growth and Reduction of Poverty
OPD Outpatients Department
PER Public Expenditure Review
PHSDP Primary Health Services Development Programme
PMNCH Partnership for Maternal, Newborn and Child Health
PMORALG Prime Ministers Office Regional Administration and Local Government
RCH Reproductive and Child Health
SCiT Save the Children in Tanzania
TPMNCH Tanzania Partnership for Maternal, Newborn and Child Health
MNCH Financing in Tanzania
October 2011
2
2
CONTENTS
1. Introduction ...................................................................................................................................................... 0
1.1 Background .............................................................................................................................................. 0
1.2 Objectives of the Study ....................................................................................................................... 2
1.3 Approach and Methodology ............................................................................................................... 2
2. National Health Policy, Targets and Strategies on MNCH ............................................................... 6
2.1 Objectives of the National Health Policy on MNCH ................................................................... 6
2.2 National Targets and Strategies on MNCH .................................................................................. 6
2.3 Emerging Issues on National Policies and Plans on MNCH .................................................. 11
3. Trends of Health-care Financing Indicators in Tanzania ........................................................... 14
3.1 Macro Economic Performance and Budgetary Allocations to the Health Sector.......... 14
3.2 Trends in actual expenditure on the Health Sector ................................................................ 18
3.3 Sources of Financing for the Health Sector ............................................................................... 20
3.4 Health Sector Budgetary Allocations Relative to other Sectors ......................................... 23
4. Trends of the MNCH Sub-sector Financing and Emerging Issues ......................................... 25
4.1 MNCH Spending at the National Level ......................................................................................... 25
4.2 Off-budget Donor Financing of MNCH ......................................................................................... 29
4.3 Spending at the LGAs Level ............................................................................................................ 30
2009/10 .................................................................................................................................................................... 32
6. Summary of Entry Points and Recommendations for Advocacy for Increased Public
Expenditure on MNCH ......................................................................................................................................... 34
Some Key Documents Consulted .................................................................................................................... 39
Annex I: Off-budget allocations to MNCH (Donor funded) Millions of TZS ..................................... 40
Annex II: Off-budget allocations to MNCH (Donor funded) by source (Millions of TZS) ........... 40
Annex III: LIST OF PEOPLE CONTACTED AND THEIR ADDRESS ...................................................... 41
MNCH Financing in Tanzania
October 2011
3
3
LIST OF TABLES
Table 1: Basic Macroeconomic Indicators ................................................................................................... 15
Table 2: Selected Health Budget Indicators .............................................................................................. 17
Table 3: Health Expenditure Per Capita (PPP International $) Selected Countries .................... 17
Table 4: Selected Health Expenditure Indicators ..................................................................................... 19
Table 5: Sources of Funds for the Health Sector (Million TZS) ........................................................... 21
Table 6: Source of Funds for the Public Health Sector (%) ................................................................ 21
Table 7: Government Expenditure on Major Sectors .............................................................................. 24
Table 8: Percentage Composition ................................................................................................................... 24
Table 9: Actual Expenditure on Maternal New Born (MN) and Child Health (CH) (Millions of
TZS) ........................................................................................................................................................................... 27
Table 10: Relative Shares of the Sub Sector MNCH in the Actual Public Expenditure ............... 27
Table 11: Comparing the Share of MNCH with other sub Sectors in 2009/10.............................. 29
Table 12: Budgetary and Off-budget Financing of MNCH in Tanzania ............................................. 30
Table 13: Relatives Shares of the Spending Units at the LGAs Level (Cost Centres) ................ 32
Table 14: Details of Expenditure by Relative Shares at the LGAs Level ........................................ 33
LIST OF FIGURES
Figure 1: Trends in the Growth of GDP, Fiscal Performance and Allocation to the Health
Sector ........................................................................................................................................................................ 16
Figure 2: Comparing Growth and Allocations to the Health Sector ................................................... 19
Figure 3: Growth Rates of Expenditure on Mother and Child Health ................................................ 28
Figure 4: Actual Versus Planned Expenditure 2007/08.......................................................................... 31
Figure 5: Actual Versus Planned Expenditure 2008/09.......................................................................... 31
Figure 6: Actual Versus Planned Expenditure 2009/10.......................................................................... 31
Figure 7: Trends in MNC Death Rates in Tanzania ................................................................................ 35
November 2011
0
1. Introduction
This report is set to analyze financial resource allocation from the public sector and
Development Partners for addressing maternal, newborns and child health in Tanzania.
It includes a critical review of the progress made with regard to mother and child health
indicators in Tanzania towards the attainment of the Millennium Development Goals
(MDGs) and the Campaign for Accelerated Reduction of Maternal Mortality (CARMMA)
targets for Africa.
Separately from the introduction, the report has six sections: A review of the country’s
plans and strategies for attaining MDGs 4&5; Comparing budgetary allocations to the
health sector and actual expenditures; Comparing budgetary allocations to MNCH
relative to other selected subsectors; Allocation of off budget donor funds to MNCH;
Analysis of expenditures on MNCH in relation to the strategic national plans and
priorities in the health sector; and Emerging issues and recommendations toward the
attainment of the MDGs 4&5.
1.1 Background
The targets set by the World Leaders in 2000 for Millennium Development Goals
indicate that MDG4 aims to reduce the death rate for children aged under five by two-
thirds between 1990 and 2015. MDG5 states an ambition to cut deaths among pregnant
women and new mothers by three-quarters during the same timescale. The Lancet
(Countdown Report 2010) updates on previous estimates of progress on these Goals
predict that no country in sub-Saharan Africa will meet the goals to dramatically reduce
deaths by 2015 (UNICEF, 2011). Researchers say just nine of 137 developing countries
will achieve their ambitious targets to improve the health of women and children,
although progress is speeding up in most countries.
The Global Strategy was launched at the time of the UN Leaders’ Summit for the
Millennium Development Goals (MDGs) in 2010, with some US $ 40 billion pledged
towards women’s and children’s health and the achievement of MDGs 4 & 5 – to reduce
child mortality and improve maternal health. A very recent report by the Partnership for
Maternal, Newborn and Child Health (WHO: Global Strategy for Women and Children’s
Health) says that some of the world's poorest countries have pledged £7bn of their own
resources to try to reduce the death rates towards accomplishing the MDGs 4&5 by
2015. For example, Bangladesh has committed to train 3,000 midwives by 2015, while
Congo has promised to provide free obstetric care, including Caesarean sections.
MNCH Financing in Tanzania
October 2011
1
1
Notwithstanding the efforts, the financing gap to achieve the health-related Millennium
Development Goals remains huge in developing countries. Clearly, more resources for
the health sector, and in particular for the MNHC subsector, are needed from the
respective governments, their citizens and the donor institutions. The WHO Report
(2010) recommends a minimum per capita health spending of $60 by 2015.
However, increasing resource allocation to the health sector is necessary, but alone is
not sufficiently capable of attaining the objectives of the health sector; we need to
address accountability, effectiveness, efficiency and equity in health expenditures. And
in addition, for meeting MGD 4 and 5 in particular, there have to be in place effective
national strategies for tackling maternal and child mortality.
Save the Children in Tanzania (SCiT) is working closely with the Ministry of Health and
Social Welfare (MoHSW) to reduce the morbidity and mortality rate of mothers,
newborns, and children under five. The latest Demographic and Health Survey Report
(DHS 2009/10) for Tanzania shows that substantial progress has been made between
2006 and 2010 under-five mortality rate dropped from 112 to 81 (i.e. by 28% percent).
Infant mortality rate decreased from 88 to 51 deaths per 1,000 births (42%) between
2006 and 2010. And maternal mortality has also decreased, but it is still high at 454
deaths /100,000 live births. The observed decrease of about forty percent in mortality
rates for infants and 28% for under-fives for a period of five years is obviously an
outstanding achievement; it is close to the desired MDG target of a decrease of 66% in
the mortality rates by the year 2015
The results of the 2010 Demographic and Health Survey Report for Tanzania point to
high possibility of attaining the MDG 4 provided that the efforts will be sustained,
including allocation of more resources and efficient use of the same in the subsector of
MNCH.
However, the attainment of MDG 5 remains rather a challenge. With a marginal
decrease of about 14% in a period of ten years; it is clearly plausible that unless the
current efforts are scaled up, and both supply and demand side barriers addressed,
Tanzania will not be able to meet the MDG 5 even by fifty percent. Thus, there is an
argent need to scale up the current effort in the form of increased financial resources,
and more efficient, equitable and effective use of resources, to accelerate progress
towards meeting MDGs 4 and 5.
Thus, the need for scaled up efforts towards the attainment of the MDG 4&5 is clear.
The entry point is to review the national strategic plans and targets with regard to the
MNCH in terms of their comprehensiveness, effectiveness and equity. Thereafter,
analysis of financial resources going to the MNCH subsector in relation to the plans and
targets will provide insights towards improving the performance of the subsector.
Against this backdrop, this report has been prepared to set a basis for a dialogue on
scaling up flow of resources and effectiveness in the MNCH subsector to achieve MGDs
4&5 in Tanzania.
MNCH Financing in Tanzania
October 2011
2
2
1.2 Objectives of the Study
The study on MNCH financing in Tanzania set out with the following specific objectives.
i. Review the comprehensiveness and effectiveness of the current national
plans/strategies in addressing MNCH.
ii. Track budgetary allocation to health (2005-2010) as well as expenditure data for
health to reveal the discrepancy between allocations and expenditures.
iii. Estimate allocation of MoHSW health budget to MNCH (disaggregated) for 2005-
2010, relative to other sub-sectors e.g. HIV/AIDS and malaria. Estimate
allocation of off-budget donor funds to MNCH (disaggregated) for 2005-2010;
relative to other sub-sectors; including a comparison across regions and between
MN and CH.
iv. Analyze the consistency of MoHSW MNCH allocations and actual spending with
the key strategic national plans and priorities.
v. Provide recommendations on MNCH financing in Tanzania towards the
attainment of the MDGs 4 and 5.
1.3 Approach and Methodology
The analysis of financial resources for the MNCH seeks to establish trends in budgetary
allocations and actual expenditure for the sub sector. This is done with a view to
identify gaps in MNCH financing between the national plans and targets on MNCH and
trends of financial resources allocated for the same. In particular, the Road Map for
Accelerated Reduction of Maternal and Child Deaths indicates the planned targets,
interventions and financial resources needed to achieve MDG 4&5 in Tanzania.
Review of Documents
Preparation of this report involved review of the National Strategy for Growth and
Reduction of Poverty (NSGRP), key MoHSW documents on MNCH plans and budget, and
the annual reports on Council Comprehensive Health Plans (CCHP) which are submitted
to the MoHSW every year. Specifically, the review sought to outline the national
strategies and interventions on MNCH to determine their focus, comprehensiveness and
consistency, and implication on resource availability and set priorities where data are
available.
MNCH Financing in Tanzania
October 2011
3
3
The CCPH have information on itemized councils’ budgets and expenditure on maternal
and child health though they are available for only the latest two – three years. We
accessed these documents from the MoHSW and extracted information on planned and
actual expenditure for 110 councils (out of 132) with easily traceable and detailed
consistent financial data on quality maternal health care and Quality Child Health Care.
We then computed percentage budget share of each item of expenditure and compare
it with its respective actual expenditure for each given financial year. This is done to
work out deviations and priorities between budgets and actual expenditure on MNCH.
In-depth Interviews
In addition to the discussions with the MoHSW, Prime Minister’s Office-Regional
Administration and Local Government, and the Ministry of Finance and Economic
Affairs, field visits were carried out in two selected councils for further in-depth
interviews on MNCH financing. This was intended for assessing the way the Health Plans
are prepared and executed at the council level to determine reliability of the annual
expenditure reports submitted to the MoHSW. Selection of the two councils reflected a
mix of three variants: rural versus urban, maternal versus infant mortality rates, and
lowest versus highest rate in mortality. Accordingly, Shinyanga District Council (highest
rate in infant mortality rate) and Morogoro Municipal Council (lowest maternal mortality
rate) were selected for in-depth interviews. Needless is to say that the selection of the
two councils did not need to take on board representation of all the 132 councils in
Tanzania because there is not any quantitative analysis in this report that is based on
the two councils alone. The visits were rather intended to assess how budgets are made
and executed at the council level including itemization of budget and actual
expenditure. It was realized that all councils use the same format of reporting on
budget and expenditure with regard to MNCH.
Sources of Financial Data
Budget and expenditure data for MNCH were compiled from MoHSW documents
including the annual public expenditure review reports (PER) for 2007/08-2010/2011,
local authorities, Development Partners’ institutions, Ministry of Finance and Economic
affairs, and the Prime Minister’s Office Local Governments and Regional Administration.
Right away from the onset of our analysis we distinguish between two levels of
spending: Central (MoHSW) and local (council) level; and two categories of expenditure: Maternal and Newborns (MN) and Child Health (CH). We will first explain the two levels of expenditure.
The Ministry responsible for health (MoHSW) prepares and presents its budget
estimates and expenditure separately from local authorities (about 132 of them). The
ministry’s expenditure estimates show itemized budget by the spending departments
and units including details by activities. Included in the estimates is budget for Maternal
and Newborns which falls under the reproductive health and child health unit. This is
MNCH Financing in Tanzania
October 2011
4
4
direct expenditure by the MoHSW on MN. It clearly excludes expenditure on purely on
family planning and earmarks expenditure on MN for the last three years. There are
several Development Partners who make spending on MN through the ministry. This is
particularly the case for earmarked (medical) supplies for MN which are paid or directly
supplied by Development Partners – an example here is WHO support for MN in
Tanzania.
The second level of expenditure is councils’ expenditure on health. Local Authorities
(LGAs) prepare their budget estimates and present them under the ministry responsible
for Regional Administration and Local Authorities under the Prime Minister’s Office
(PMO-RALG). Included in their estimates is itemized expenditure on MN which includes
financial data on maternal health care i.e. capital expenditure, training, Immunization
and Vitamin "A" Supplements, Surveillance and Monitoring, Procurement of Medical
Equipments/Drugs (Medical Supplies), Administration, Outreach/Mobile Clinic, Antenatal
and Postnatal Care, PMTCT Activities, and other activities. Also, included in the council
budget and expenditure are details on child health itemized as follows: Development
activities, Training of Health Workers, Immunization and Vitamin "A" Supplement,
Monitoring and Surveillance, Procurement of Medical Equipments/ Drugs,
Administration, Outreach and Mobile Clinic, Community Mobilization, Antenatal and post
natal Care, PMTCT Activities, and Other Activities. Every financial year, councils prepare
and submit expenditure reports on CCHP to the MoHSW. The reports shows approved
budget versus actual expenditure every item of MN and child expenditure and by the
respective spending unit at the council level. That is to say, the main source for
expenditure on MNCH at both the central and local level is the MoHSW.
Thus, our approach to the compilation of budget and expenditure data on MN involved a
visit to the Directorate of Policy and Planning at the MoHSW to hold discussions and get
access to the budget and expenditure data on MNCH. Additionally, a few gaps in the
data were filled in by contacting the office of the Commissioner for budget at the
Ministry of Finance and Economic affairs. This required a special permission which was
sought and obtained at each respective ministry. Thanks to the Director of Policy
Planning- MoHSW.
Now we explain the two categories of spending on MNCH in Tanzania as indicated
earlier. Expenditure on MNCH falls into two major categories: Specifically earmarked
budget and expenditure on maternal and newborns health (MN), and expenditure on
curative services in the general departments for which under-fives are part of
beneficiaries (CH). The analysis of MNCH budget and expenditure carried out in this
report observed the two categories and made estimations for CH separately from MN.
As explained earlier, financial data on MN were obtainable from the MoHSW and the
Ministry of Finance, but not so directly for CH. In fact data on MN expenditure at council
level were compiled by going through each hard copy of annual report submitted to the
MoHSW for councils for the last three years available reports. We accessed these
MNCH Financing in Tanzania
October 2011
5
5
documents from the MoHSW and extracted information on planned and actual
expenditure for 110 councils for which reports were consistently available (out of 132
councils). Thus, the proportion of the total number of councils covered is 83% which is
sufficiently large to include all the basic variations.
What did we do to get expenditure on CH? The system of keeping and generating
information (IMS) at the MoHSW shows data on patients attending public facilities by
age and type of disease/medical problem attended. Expenditure at any health facility
includes wages and salaries, implying that though we have data on expenditure for
some diseases, they do not include costs on the medical personnel and other centrally
incurred costs. Therefore, in order to work out the proportion of the total expenditure
going to under-five in the general health services departments, we first computed the
average proportion of under-five (who seek medical services in public health facilities)
from the total number of patients in the outpatients department (OPD) in public health
facilities in Tanzania. This information on attendance in OPD by age and medical
problem attended is compiled and published by the MoHSW. We then multiplied it by
the total budget going to the general health services departments - to get the spending
on under-fives.
From the compiled data on ODP attendance, we found that on average, 44% of ODP
patients in public health facilities in Tanzania are under-fives. We then worked with an
assumption that proportionally public health facilities spend 44% of their funds (net of
those going to maternal and newborns) on under-fives. And further to that, we assume
that about 44% (average) of the central spending on the Health Sector (MoHSW) also
goes to under-fives. It is thus conclusive to estimate that 44% of the public expenditure
in the Health Sector (excluding expenditure on MN) is for under-fives. This is an
estimate rather than actual expenditure because the health system has many
overlapping services including those which are purely administrative and centrally
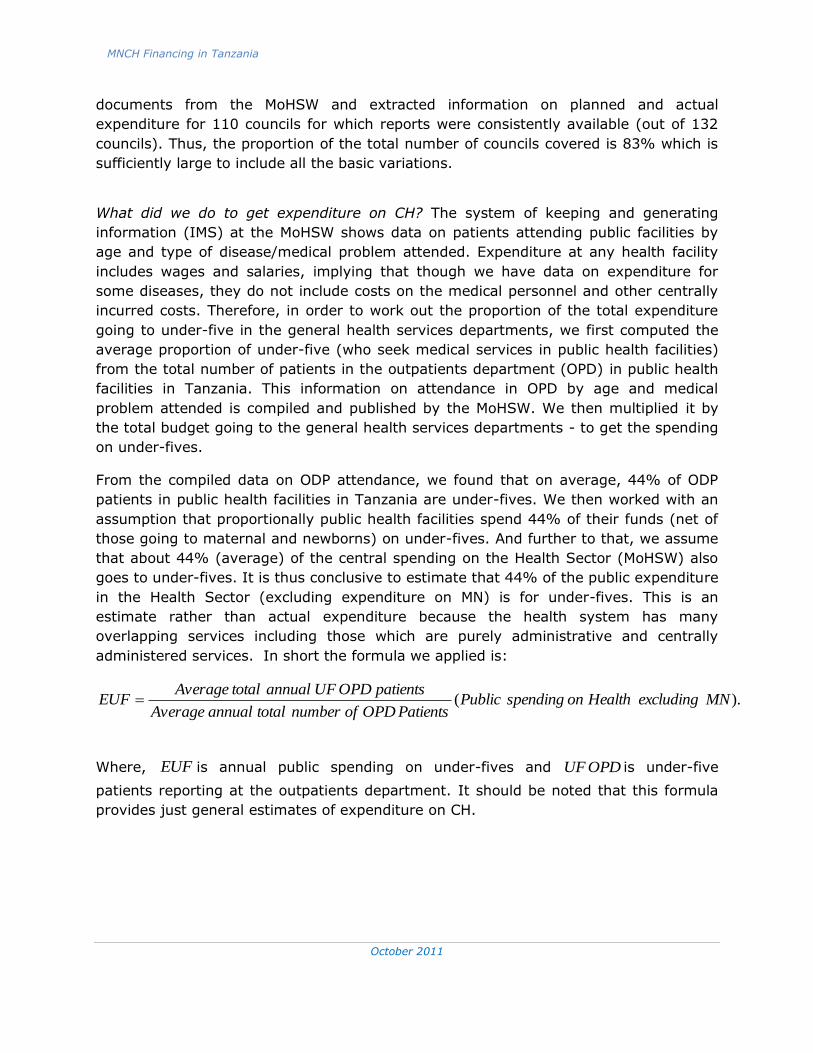
administered services. In short the formula we applied is:
).( MNexcludingHealthonspendingPublicPatientsOPDofnumbertotalannualAverage
patientsOPDUFannualtotalAverageEUF
Where, EUF is annual public spending on under-fives and OPDUF is under-five
patients reporting at the outpatients department. It should be noted that this formula
provides just general estimates of expenditure on CH.
MNCH Financing in Tanzania
October 2011
6
6
2. National Health Policy, Targets and Strategies on MNCH
2.1 Objectives of the National Health Policy on MNCH
The vision of the Government of Tanzania is to have a healthy society, with improved
social well being that will contribute effectively to personal and national development.
The mission is to provide basic health services in accordance to geographical conditions,
which are of acceptable standards, affordable and sustainable.
The National Health Policy states that maternal and child mortality will be reduced in
line with the MDGs 4&5. To this effect, the Government has formulated and adopted
several strategy documents for implementing the National Health Policy.
2.2 National Targets and Strategies on MNCH
Tanzania is one of the 137 developing countries determined to achieve MDGs 4&5.
Since the inception of the MDGs by the World Leaders in the year 2000, the country has
prepared several policy and strategy documents in which targets and specific
interventions for MNCH are set. These include revision of the 1990 Health Policy,
preparation and adoption of the national strategy for poverty reduction (PRSP 2001 –
2005), and consecutively prepared and adopted two more comprehensive National
Strategies for Growth and Reduction of Poverty (NSGRP I&II). The latter two strategies
have broadly focused on three clusters namely growth and reduction of poverty, quality
of life and social well being, and good governance and accountability. The NSGRP is a
five year strategy that indicates the milestones to be achieved and the strategies
thereof for the components of each cluster. The health sector under which MNCH is a
sub sector falls under cluster two of the NSGRP II.
MNCH Financing in Tanzania
October 2011
7
7
By 2007, it was realized that the pace of the achievement of the targets of the NSGRP
1 on the sub sector MNCH was not in line with the strategy timeframe and the timeline
for the realization of the MDGs 4&5. The critical challenges comprised two categories
according to the Road Map for Accelerated Reduction of Maternal and Child Deaths
(2007) for Tanzania:
I. Health system factors: Inadequate implementation of pro-poor policies, weak
health infrastructure, limited access to quality health services, inadequate of
human resource, shortage of skilled health providers, weak referral systems, low
utilization of modern family planning services, lack of equipment and supplies,
weak health management at all levels and inadequate coordination between
public and private facilities.
II. Non health system factors: Inadequate community involvement and participation
in planning, implementation, monitoring and evaluation of health services, some
social cultural beliefs and practices, gender inequality, weak educational sector
and poor health seeking behaviour.
In response, the MoHSW prepared the National Road Map Strategic Plan to
Accelerate Reduction of Maternal, Newborn and Child Deaths in Tanzania,
covering the period 2008 – 2015. The purpose of the road map is twofold: To put in
place ‘one integrated maternal, newborn and child health strategic plan’ to ensure to
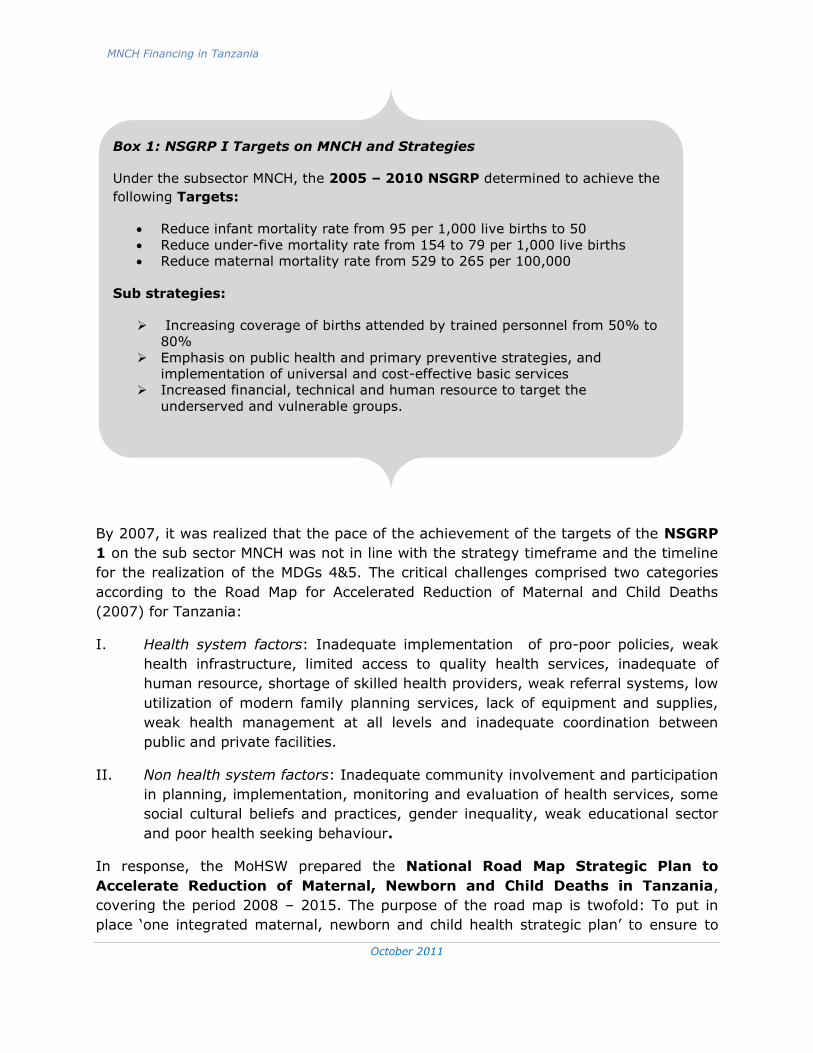
Box 1: NSGRP I Targets on MNCH and Strategies
Under the subsector MNCH, the 2005 – 2010 NSGRP determined to achieve the
following Targets:
Reduce infant mortality rate from 95 per 1,000 live births to 50
Reduce under-five mortality rate from 154 to 79 per 1,000 live births
Reduce maternal mortality rate from 529 to 265 per 100,000
Sub strategies:
Increasing coverage of births attended by trained personnel from 50% to
80%
Emphasis on public health and primary preventive strategies, and
implementation of universal and cost-effective basic services
Increased financial, technical and human resource to target the
underserved and vulnerable groups.
MNCH Financing in Tanzania
October 2011
8
8
improved coordination of interventions and delivery of services for the MNCH subsector;
and second is guide implementation across operational levels of the health system so
that policy drawn at national level will be carried out at the district and community
levels. The Road Map operationalized the tenets of the New Delhi Declaration 2005 of
developing one national MNCH plan for accelerating the reduction of maternal, newborn
and child deaths, in order to improve coordination, align resources and standardize
monitoring and evaluation. This was also in line with the voice from the Tanzania
Partnership for Maternal, Newborn and Child Health (TPMNCH) launched in 2007.
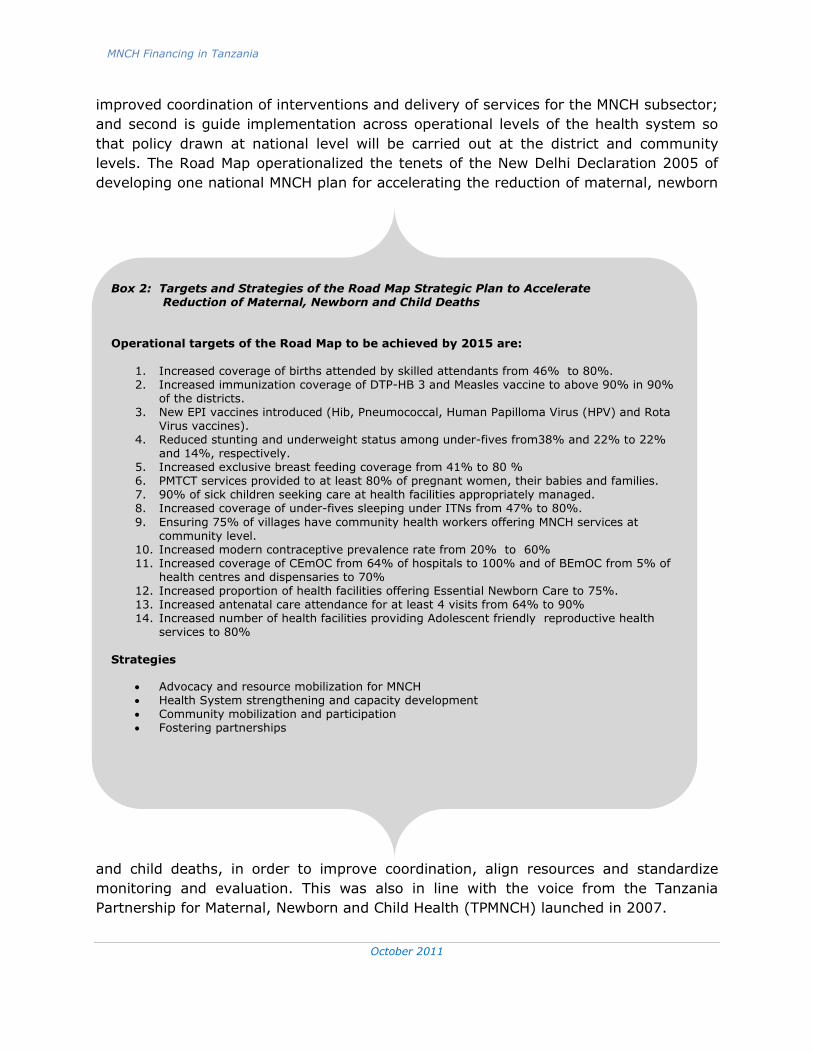
Box 2: Targets and Strategies of the Road Map Strategic Plan to Accelerate Reduction of Maternal, Newborn and Child Deaths
Operational targets of the Road Map to be achieved by 2015 are:
1. Increased coverage of births attended by skilled attendants from 46% to 80%. 2. Increased immunization coverage of DTP-HB 3 and Measles vaccine to above 90% in 90%
of the districts. 3. New EPI vaccines introduced (Hib, Pneumococcal, Human Papilloma Virus (HPV) and Rota
Virus vaccines). 4. Reduced stunting and underweight status among under-fives from38% and 22% to 22%
and 14%, respectively. 5. Increased exclusive breast feeding coverage from 41% to 80 % 6. PMTCT services provided to at least 80% of pregnant women, their babies and families. 7. 90% of sick children seeking care at health facilities appropriately managed. 8. Increased coverage of under-fives sleeping under ITNs from 47% to 80%.
9. Ensuring 75% of villages have community health workers offering MNCH services at community level.
10. Increased modern contraceptive prevalence rate from 20% to 60% 11. Increased coverage of CEmOC from 64% of hospitals to 100% and of BEmOC from 5% of
health centres and dispensaries to 70% 12. Increased proportion of health facilities offering Essential Newborn Care to 75%. 13. Increased antenatal care attendance for at least 4 visits from 64% to 90% 14. Increased number of health facilities providing Adolescent friendly reproductive health
services to 80%
Strategies
Advocacy and resource mobilization for MNCH Health System strengthening and capacity development Community mobilization and participation Fostering partnerships
MNCH Financing in Tanzania
October 2011
9
9
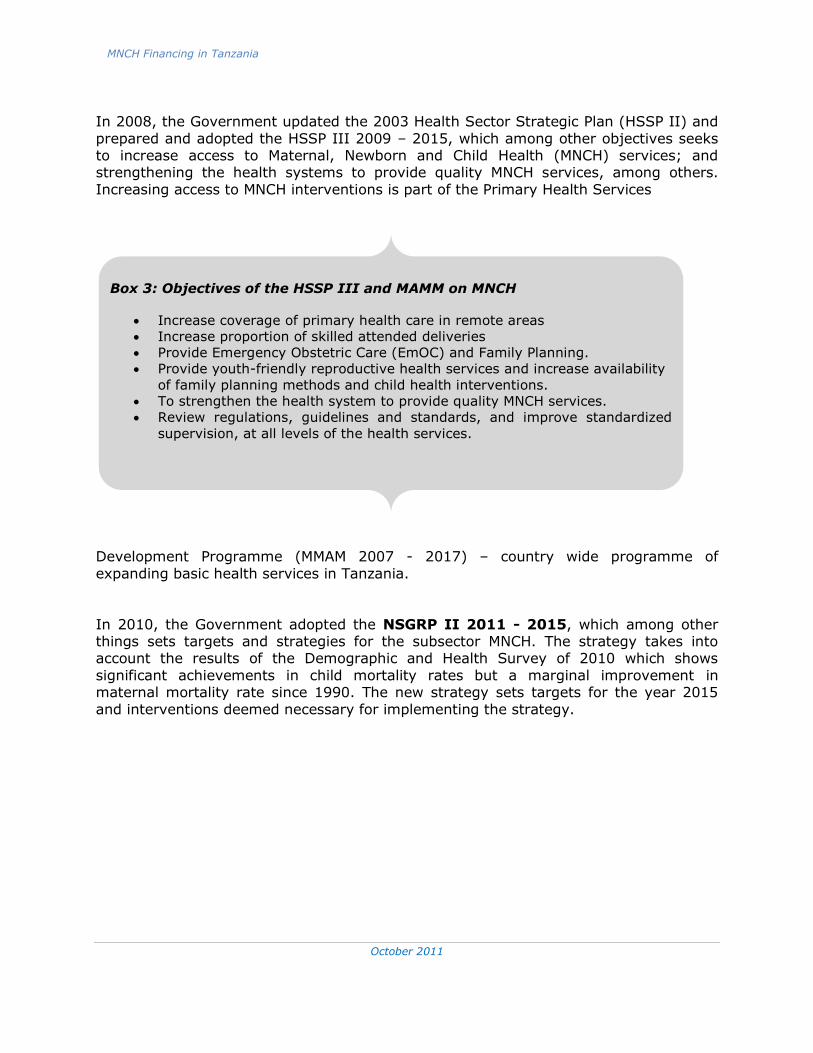
In 2008, the Government updated the 2003 Health Sector Strategic Plan (HSSP II) and
prepared and adopted the HSSP III 2009 – 2015, which among other objectives seeks to increase access to Maternal, Newborn and Child Health (MNCH) services; and strengthening the health systems to provide quality MNCH services, among others.
Increasing access to MNCH interventions is part of the Primary Health Services
Development Programme (MMAM 2007 - 2017) – country wide programme of
expanding basic health services in Tanzania.
In 2010, the Government adopted the NSGRP II 2011 - 2015, which among other things sets targets and strategies for the subsector MNCH. The strategy takes into account the results of the Demographic and Health Survey of 2010 which shows
significant achievements in child mortality rates but a marginal improvement in maternal mortality rate since 1990. The new strategy sets targets for the year 2015
and interventions deemed necessary for implementing the strategy.
Box 3: Objectives of the HSSP III and MAMM on MNCH
Increase coverage of primary health care in remote areas
Increase proportion of skilled attended deliveries
Provide Emergency Obstetric Care (EmOC) and Family Planning.
Provide youth-friendly reproductive health services and increase availability
of family planning methods and child health interventions.
To strengthen the health system to provide quality MNCH services.
Review regulations, guidelines and standards, and improve standardized
supervision, at all levels of the health services.
MNCH Financing in Tanzania
October 2011
10
10
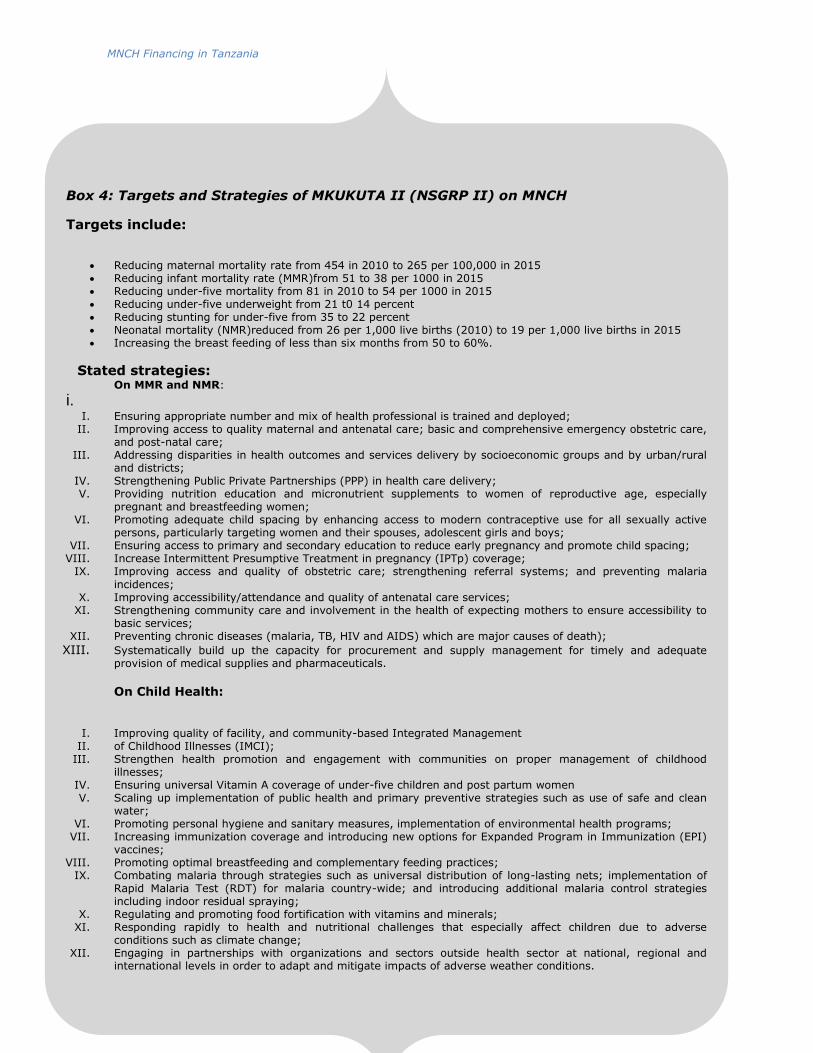
Box 4: Targets and Strategies of MKUKUTA II (NSGRP II) on MNCH
Targets include:
Reducing maternal mortality rate from 454 in 2010 to 265 per 100,000 in 2015 Reducing infant mortality rate (MMR)from 51 to 38 per 1000 in 2015 Reducing under-five mortality from 81 in 2010 to 54 per 1000 in 2015 Reducing under-five underweight from 21 t0 14 percent Reducing stunting for under-five from 35 to 22 percent Neonatal mortality (NMR)reduced from 26 per 1,000 live births (2010) to 19 per 1,000 live births in 2015 Increasing the breast feeding of less than six months from 50 to 60%.
Stated strategies: On MMR and NMR:
i. I. Ensuring appropriate number and mix of health professional is trained and deployed;
II. Improving access to quality maternal and antenatal care; basic and comprehensive emergency obstetric care, and post-natal care;
III. Addressing disparities in health outcomes and services delivery by socioeconomic groups and by urban/rural and districts;
IV. Strengthening Public Private Partnerships (PPP) in health care delivery; V. Providing nutrition education and micronutrient supplements to women of reproductive age, especially
pregnant and breastfeeding women; VI. Promoting adequate child spacing by enhancing access to modern contraceptive use for all sexually active
persons, particularly targeting women and their spouses, adolescent girls and boys; VII. Ensuring access to primary and secondary education to reduce early pregnancy and promote child spacing;
VIII. Increase Intermittent Presumptive Treatment in pregnancy (IPTp) coverage; IX. Improving access and quality of obstetric care; strengthening referral systems; and preventing malaria
incidences; X. Improving accessibility/attendance and quality of antenatal care services;
XI. Strengthening community care and involvement in the health of expecting mothers to ensure accessibility to basic services;
XII. Preventing chronic diseases (malaria, TB, HIV and AIDS) which are major causes of death);
XIII. Systematically build up the capacity for procurement and supply management for timely and adequate provision of medical supplies and pharmaceuticals.
On Child Health:
I. Improving quality of facility, and community-based Integrated Management II. of Childhood Illnesses (IMCI);
III. Strengthen health promotion and engagement with communities on proper management of childhood illnesses;
IV. Ensuring universal Vitamin A coverage of under-five children and post partum women V. Scaling up implementation of public health and primary preventive strategies such as use of safe and clean
water; VI. Promoting personal hygiene and sanitary measures, implementation of environmental health programs;
VII. Increasing immunization coverage and introducing new options for Expanded Program in Immunization (EPI) vaccines;
VIII. Promoting optimal breastfeeding and complementary feeding practices; IX. Combating malaria through strategies such as universal distribution of long-lasting nets; implementation of
Rapid Malaria Test (RDT) for malaria country-wide; and introducing additional malaria control strategies including indoor residual spraying;
X. Regulating and promoting food fortification with vitamins and minerals; XI. Responding rapidly to health and nutritional challenges that especially affect children due to adverse
conditions such as climate change; XII. Engaging in partnerships with organizations and sectors outside health sector at national, regional and
international levels in order to adapt and mitigate impacts of adverse weather conditions.
MNCH Financing in Tanzania
October 2011
11
11
2.3 Emerging Issues on National Policies and Plans on MNCH
We have multiple strategy documents for the MNCH sub sector which complicate
prioritization in financing
The National Health Policy stipulates that the general policy objective of the MNCH is to
achieve MDGs 4&5. Towards its implementation, the government has prepared and
adopted four major strategy documents under which sub strategies and targets for
improving MNCH are identified as indicated earlier in Boxes 1 – 4. MMAM begun in
2007; the Road Map begun in 2008, the HSSP begun in 2009; and NSGRP II begun in
2011; all are under implementation until 2015 or 2017. Each of these requires a
financing strategy though of course they lead into a common end. For example, the
Road Map for Accelerated Reduction in Maternal and Child Mortality Rates alone
requires total additional funding of about US$674,030,000 for about seven years
according to the financial cost estimates of the Road Map. This amounts to about TZS
144.44 billion increase per year net of inflation; or about 25% increase in the health
sector budget for 2008/09 alone. This is separate from the costing of MMAM, NSGRP,
etc. The issue is how to come up with a unified costed strategy for MNCH so that there
is prioritization and effective budgeting and monitoring of expenditure for MNCH. This
would also serve as a basis for an effective monitoring and evaluation of interventions
in the sub sector MNCH. As it is now, there are several strategy documents to deal
with, making it difficult to make evaluation and prioritize expenditure for improved
outcomes.
Despite the Multiple Strategy Documents for the MNCH Sub-sector, Attainment of MDG
5 Remains a Challenge
Although the government and development partners have continued to commit
resources for MNCH, there is not yet matching results with regard to the reduction of
maternal mortality rate. The constraining factors have been identified by the Road Map
document as enlisted earlier in this document. The major issue however is whether
there can be an effective monitoring mechanism over time to determine impact of
financial resources allocated for the subsector.
Sequencing Interventions is Necessary for Setting Priorities in Health Expenditure
MKUKUTA II shows a 65% shortage of human resource in the health sector in Tanzania.
In view of addressing the gap, there are two overlapping planned interventions across
the four strategy documents: Increasing coverage of birth attended by skilled health
personnel (from around 40’s to 80%), and improvement in the provision of primary
health services. These are by large the underlying factors for deaths during pregnancy,
and early childhood in Tanzania. However, we need to identify sequential interventions
for addressing MNCH. For example, how do we increase the number of births attended
by skilled health personnel and distribution of services without addressing availability
MNCH Financing in Tanzania
October 2011
12
12
cum access to health facilities? Couldn’t we introduce mobile services in the short run to
save lives? Also, as indicated in the strategy documents, the observed disparities in the
distribution of the available health personnel works in favour of urban and non remote
rural areas leaving remote areas underserved and thus vulnerable to premature deaths.
Couldn’t introduction of conditional incentive package redress the imbalance – at least
in the immediate future? This could be combined with other initiatives eg increased
intake and production of midwives and nurses, and possibly also mid-level obstetric
workers.
The NSGRP II and other national strategies on MNCH could distinguish between
immediate, short and long term interventions so that expenditure can be prioritized at
every point of time. This would also make monitoring and evaluation relatively easier.
In fact, unlike the other strategy documents, the Road Map for Accelerated Reduction in
Maternal and Child Deaths is very detailed on the timing, involvement and costing.
Align Preparation of Strategies and Interventions for MNCH with Resource Capacities
Preparation of the national targets and strategies on improving MNCH seems to identify
and enlist a set of interventions for addressing the sub sector without effective
reference to resource capacities; and thus makes their achievement far from reality.
For example, the NSGRP I envisaged to increase coverage of births attended by trained
personnel from 50% to 80% by 2010; which, among other factors, was expected to
reduce maternal mortality rate to 265 per 100000. But five years down the road,
NSGPR II indicated a 65% shortage of human resource, and maternal mortality rate is
still high at 454. Thus, the intended impact was not realized despite the efforts made in
the sub sector.
Therefore, the plans should be more realistic and cost-based interventions within the
resources and time limits. The Medium Term Expenditure Framework (MTEF) has been
a useful tool in planning and forecasting and sequencing expenditure in the public
sector; but not so useful in addressing resource constraints and financing of the NSGRP
in the long term. Thus, forecasting resource inflow in the public sector for the planning
horizon is essentially needed in order to align targets, planned interventions and
strategic financing. This would allow an effective distinction between constraints
emanating from lack of financial resources from the pure issues of effectiveness and
efficiency in the implementation of interventions. Though the forecasting is done every
year, it has not been effectively been able to predict resource inflow in the long term
because of dependency to external financing.
Fragmented Approach at National Level versus a Consolidated Strategy at Council Level
It is observed that at the national level there are four operational strategy documents
with regard to the improvement of MNCH: NSGRP II, HSSP, MMAM and the Road Map
for Reduced Mortality Rates for maternal cases, newborns and children. These are
translated into one document at council level: Comprehensive Council Health Plan
MNCH Financing in Tanzania
October 2011
13
13
(CCHP), which is the guiding document for implementation at that level. Much as this
makes implementation easier to councils, monitoring and evaluation of each national
strategy and of each sub strategy, and therein attribution, becomes complex and
difficult; and so with decision on financing by components of the MNCH by the
respective strategies. Councils which constitute the implementing authorities at the
grassroots level find it difficult to distinguish spending and outcomes by the different
sub strategies on MNCH; rather they just work with one consolidated strategy
document - CCHP which combines all the national level strategies/interventions into one
single operational document. Councils receive earmarked funds from the central
government to implement their CCHP. It becomes difficult to monitor, evaluate and
draw lessons and experiences for each of the strategies prepared and adopted at the
national level. Thus, MNCH strategy documents that are prepared after the adoption of
a main national strategy, say NSGRP II, should be clearly linked to the latter including
alignment in financing and monitoring by components. These will make resource
allocation more focused and reach where they are needed most.
The NSGPR II Lacks Emphasis on Community Roles on MNCH
Needless is to emphasize the role of people and their communities in health
interventions particularly on MNCH. However, this is not well articulated in the NSGPR
II and thus may be overlooked in resource allocation. For example, community health
committees have played an outstanding role in the outcomes of health interventions
and programmes in Zanzibar; the use of peer educators at the community level is
definitely instrumental in achieving the objectives of health interventions (Rahaleo
Community Health Initiative, Aga Khan Foundation, 2011).
The Community Health Fund (CHF) is still infant in Tanzania as it contributes less than
1% of the total health sector financing. At the community level there is not earmarked
funds for the subsector MNCH; rather, the funds are mainly used for development
projects at the community level.
Need to Strengthen Monitoring and Evaluation for MNCH Interventions
The national strategy documents on MNCH indicate desired outcome indicators and
targets but lacks details on performance indicators for annual monitoring and
evaluation. The Road Map document, for accelerated reduction of maternal and child
deaths, is a more comprehensive document relative to the rest. It indicates components
to be financed every year and the total amount required for each particular year so that
it is easier to monitor levels of financing. The need to make one consolidated document
that will guide formulation of annual budgets and actual expenditures is important.
MNCH Financing in Tanzania
October 2011
14
14
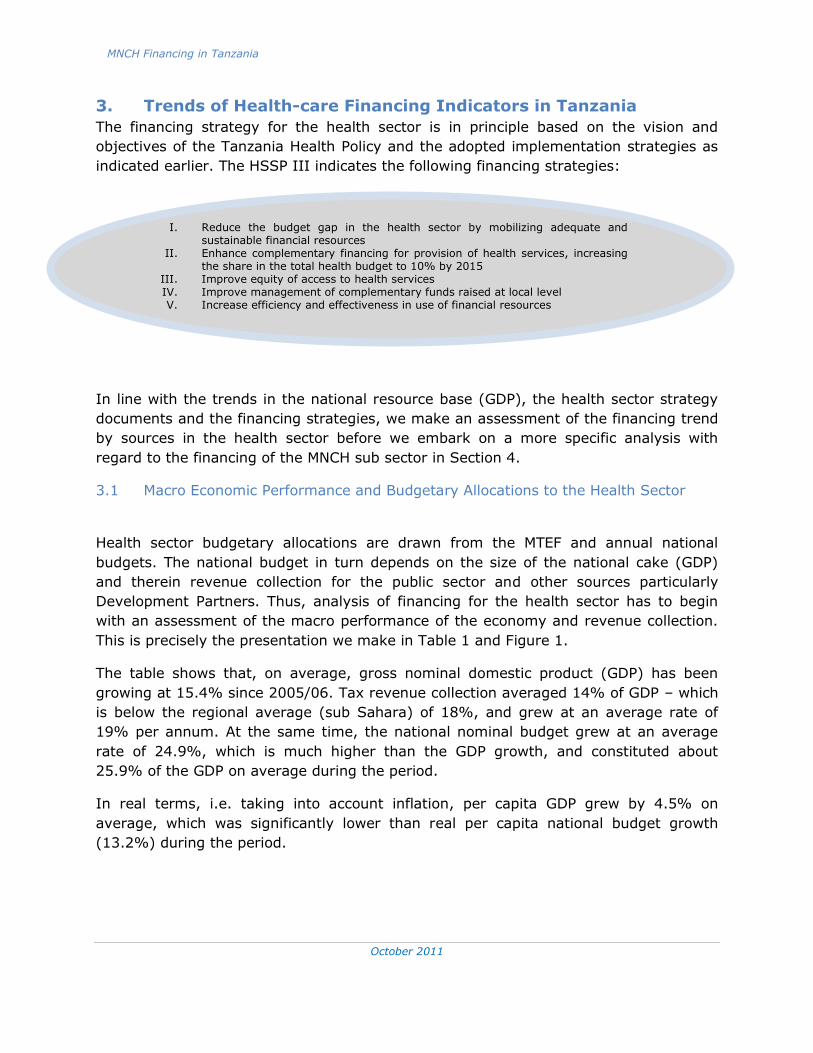
I. Reduce the budget gap in the health sector by mobilizing adequate and sustainable financial resources
II. Enhance complementary financing for provision of health services, increasing the share in the total health budget to 10% by 2015
III. Improve equity of access to health services IV. Improve management of complementary funds raised at local level V. Increase efficiency and effectiveness in use of financial resources
3. Trends of Health-care Financing Indicators in Tanzania
The financing strategy for the health sector is in principle based on the vision and
objectives of the Tanzania Health Policy and the adopted implementation strategies as
indicated earlier. The HSSP III indicates the following financing strategies:
In line with the trends in the national resource base (GDP), the health sector strategy
documents and the financing strategies, we make an assessment of the financing trend
by sources in the health sector before we embark on a more specific analysis with
regard to the financing of the MNCH sub sector in Section 4.
3.1 Macro Economic Performance and Budgetary Allocations to the Health Sector
Health sector budgetary allocations are drawn from the MTEF and annual national
budgets. The national budget in turn depends on the size of the national cake (GDP)
and therein revenue collection for the public sector and other sources particularly
Development Partners. Thus, analysis of financing for the health sector has to begin
with an assessment of the macro performance of the economy and revenue collection.
This is precisely the presentation we make in Table 1 and Figure 1.
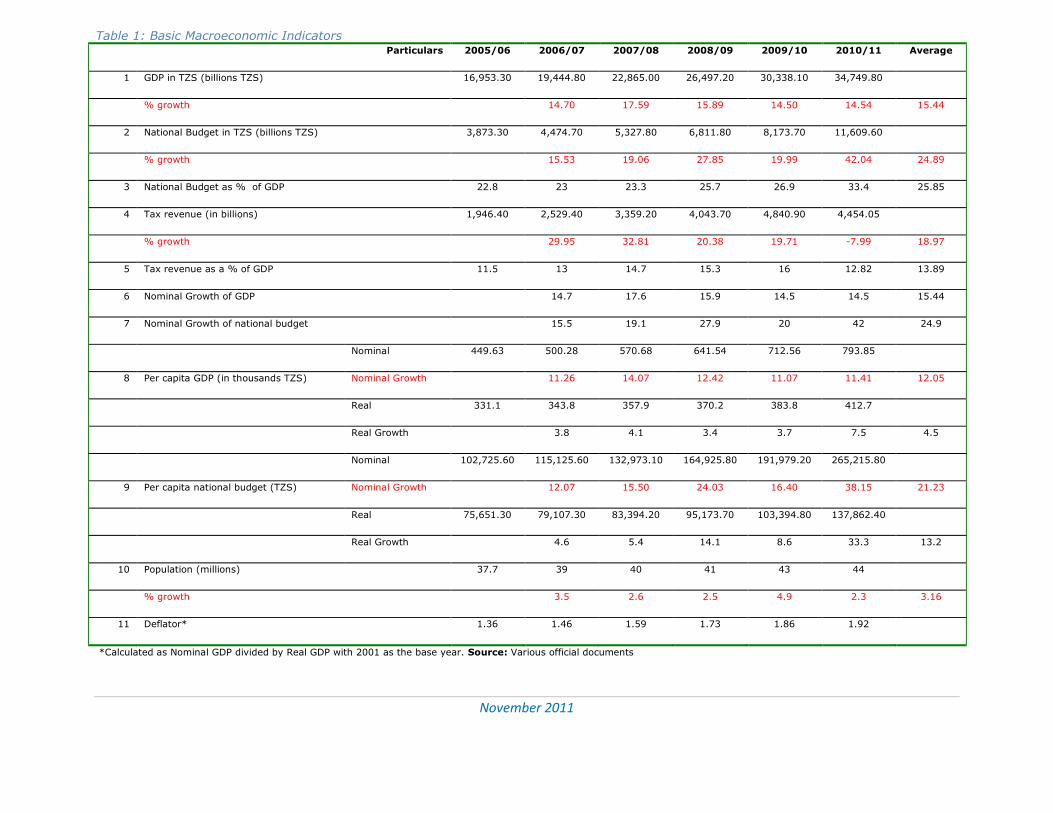
The table shows that, on average, gross nominal domestic product (GDP) has been
growing at 15.4% since 2005/06. Tax revenue collection averaged 14% of GDP – which
is below the regional average (sub Sahara) of 18%, and grew at an average rate of
19% per annum. At the same time, the national nominal budget grew at an average
rate of 24.9%, which is much higher than the GDP growth, and constituted about
25.9% of the GDP on average during the period.
In real terms, i.e. taking into account inflation, per capita GDP grew by 4.5% on
average, which was significantly lower than real per capita national budget growth
(13.2%) during the period.
November 2011
15
Table 1: Basic Macroeconomic Indicators Particulars 2005/06 2006/07 2007/08 2008/09 2009/10 2010/11 Average
1 GDP in TZS (billions TZS) 16,953.30 19,444.80 22,865.00 26,497.20 30,338.10 34,749.80
% growth 14.70 17.59 15.89 14.50 14.54 15.44
2 National Budget in TZS (billions TZS) 3,873.30 4,474.70 5,327.80 6,811.80 8,173.70 11,609.60
% growth 15.53 19.06 27.85 19.99 42.04 24.89
3 National Budget as % of GDP 22.8 23 23.3 25.7 26.9 33.4 25.85
4 Tax revenue (in billions) 1,946.40 2,529.40 3,359.20 4,043.70 4,840.90 4,454.05
% growth 29.95 32.81 20.38 19.71 -7.99 18.97
5 Tax revenue as a % of GDP 11.5 13 14.7 15.3 16 12.82 13.89
6 Nominal Growth of GDP 14.7 17.6 15.9 14.5 14.5 15.44
7 Nominal Growth of national budget 15.5 19.1 27.9 20 42 24.9
Nominal 449.63 500.28 570.68 641.54 712.56 793.85
8 Per capita GDP (in thousands TZS) Nominal Growth 11.26 14.07 12.42 11.07 11.41 12.05
Real 331.1 343.8 357.9 370.2 383.8 412.7
Real Growth 3.8 4.1 3.4 3.7 7.5 4.5
Nominal 102,725.60 115,125.60 132,973.10 164,925.80 191,979.20 265,215.80
9 Per capita national budget (TZS) Nominal Growth 12.07 15.50 24.03 16.40 38.15 21.23
Real 75,651.30 79,107.30 83,394.20 95,173.70 103,394.80 137,862.40
Real Growth 4.6 5.4 14.1 8.6 33.3 13.2
10 Population (millions) 37.7 39 40 41 43 44
% growth 3.5 2.6 2.5 4.9 2.3 3.16
11 Deflator* 1.36 1.46 1.59 1.73 1.86 1.92
*Calculated as Nominal GDP divided by Real GDP with 2001 as the base year. Source: Various official documents
November 2011
16
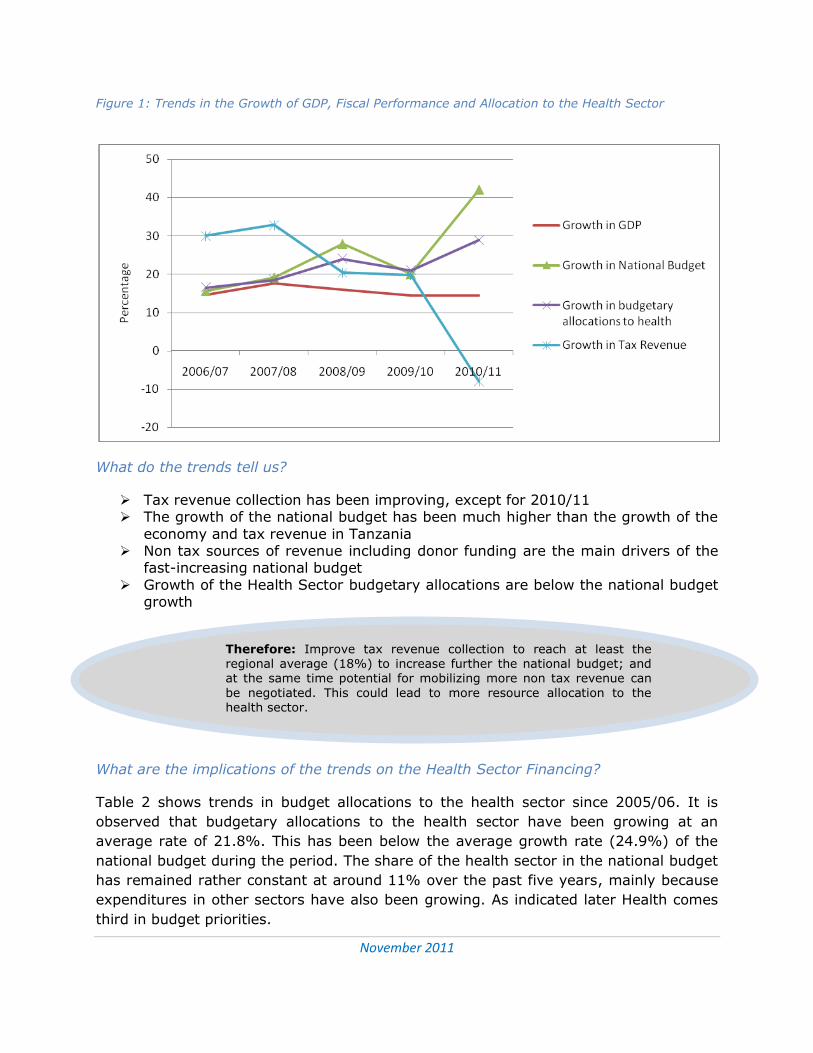
Therefore: Improve tax revenue collection to reach at least the regional average (18%) to increase further the national budget; and at the same time potential for mobilizing more non tax revenue can
be negotiated. This could lead to more resource allocation to the health sector.
Figure 1: Trends in the Growth of GDP, Fiscal Performance and Allocation to the Health Sector
What do the trends tell us?
Tax revenue collection has been improving, except for 2010/11 The growth of the national budget has been much higher than the growth of the
economy and tax revenue in Tanzania Non tax sources of revenue including donor funding are the main drivers of the
fast-increasing national budget
Growth of the Health Sector budgetary allocations are below the national budget growth
What are the implications of the trends on the Health Sector Financing?
Table 2 shows trends in budget allocations to the health sector since 2005/06. It is
observed that budgetary allocations to the health sector have been growing at an
average rate of 21.8%. This has been below the average growth rate (24.9%) of the
national budget during the period. The share of the health sector in the national budget
has remained rather constant at around 11% over the past five years, mainly because
expenditures in other sectors have also been growing. As indicated later Health comes
third in budget priorities.
November 2011
17
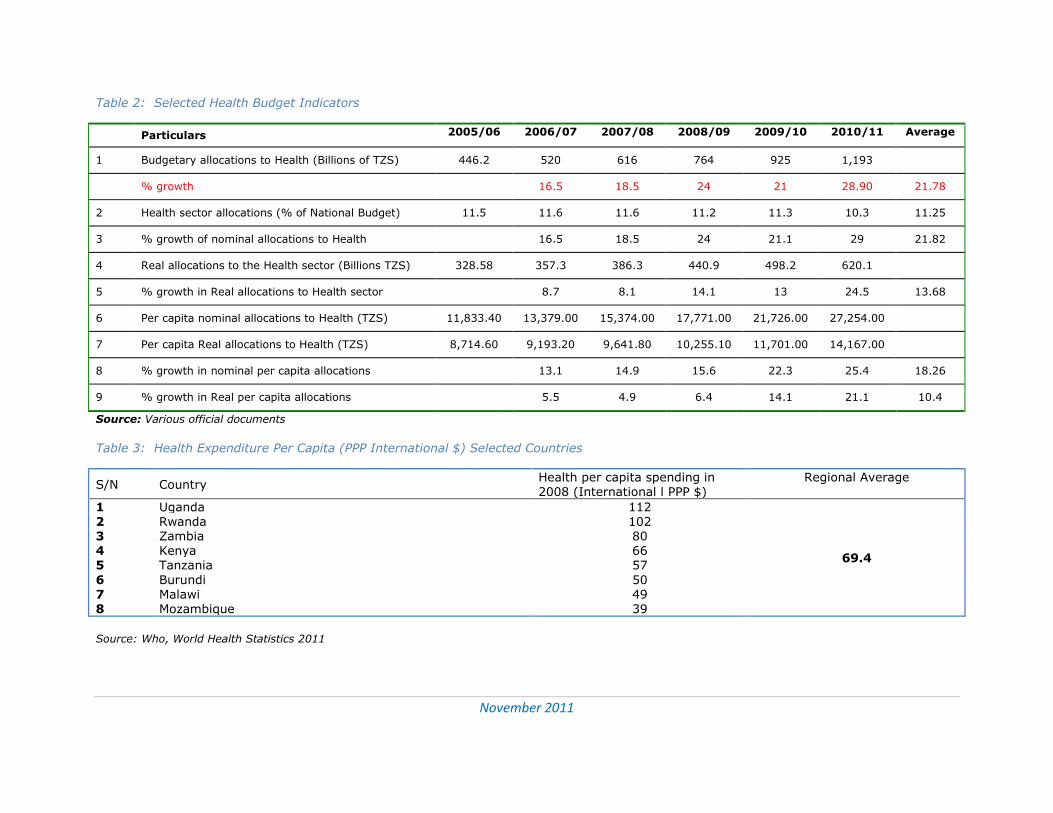
Table 2: Selected Health Budget Indicators
Particulars 2005/06 2006/07 2007/08 2008/09 2009/10 2010/11 Average
1 Budgetary allocations to Health (Billions of TZS) 446.2 520 616 764 925 1,193
% growth 16.5 18.5 24 21 28.90 21.78
2 Health sector allocations (% of National Budget) 11.5 11.6 11.6 11.2 11.3 10.3 11.25
3 % growth of nominal allocations to Health 16.5 18.5 24 21.1 29 21.82
4 Real allocations to the Health sector (Billions TZS) 328.58 357.3 386.3 440.9 498.2 620.1
5 % growth in Real allocations to Health sector 8.7 8.1 14.1 13 24.5 13.68
6 Per capita nominal allocations to Health (TZS) 11,833.40 13,379.00 15,374.00 17,771.00 21,726.00 27,254.00
7 Per capita Real allocations to Health (TZS) 8,714.60 9,193.20 9,641.80 10,255.10 11,701.00 14,167.00
8 % growth in nominal per capita allocations 13.1 14.9 15.6 22.3 25.4 18.26
9 % growth in Real per capita allocations 5.5 4.9 6.4 14.1 21.1 10.4
Source: Various official documents
Table 3: Health Expenditure Per Capita (PPP International $) Selected Countries
S/N Country Health per capita spending in 2008 (International l PPP $)
Regional Average
1 Uganda 112
69.4
2 Rwanda 102 3 Zambia 80 4 Kenya 66 5 Tanzania 57
6 Burundi 50 7 Malawi 49 8 Mozambique 39
Source: Who, World Health Statistics 2011
November 2011
18
Growth in the national spending has not been in favour of the Health Sector Budgetary Allocations to the Health Sector have generally been below the
Abuja declaration by 4% Therefore:
Increasing budgetary allocation to the Health Sector to reach the target of 15% set by the Abuja Declaration would be adequate for full implementation of the Road Map for Accelerate Mother and Child Mortality Rates in Tanzania.
Urge local and external resources to increase expenditure on health to match at least the neighbouring countries (by International dollar spending)
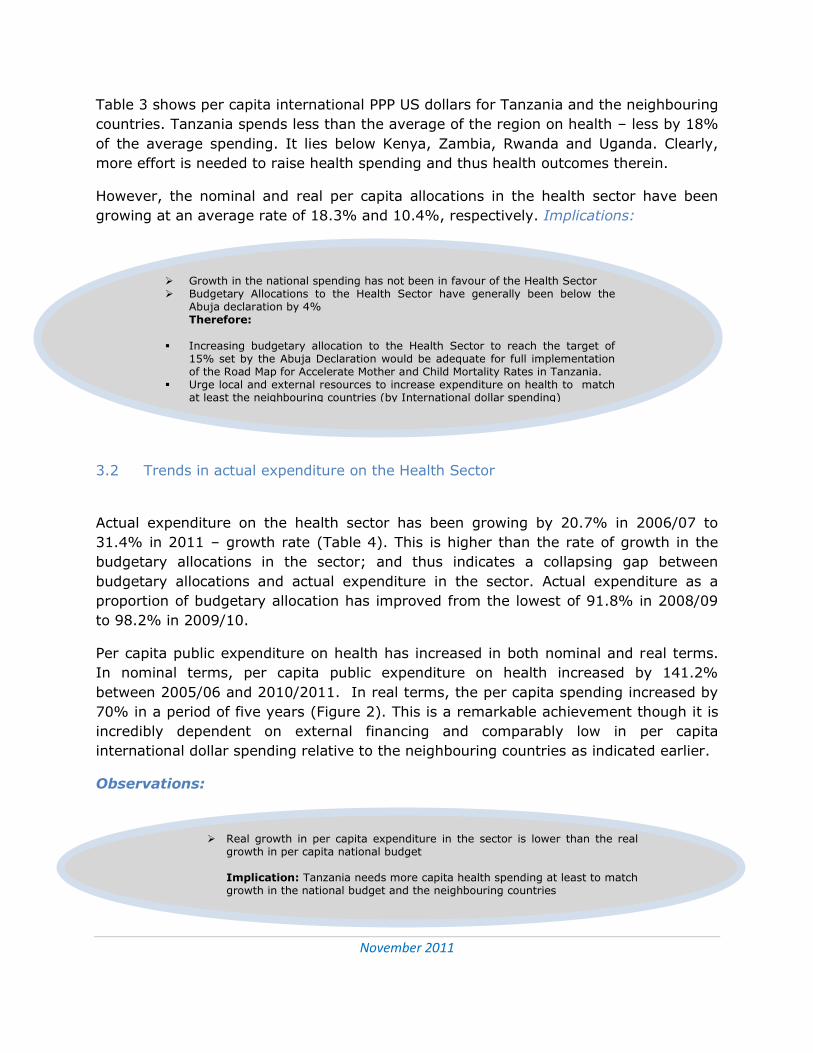
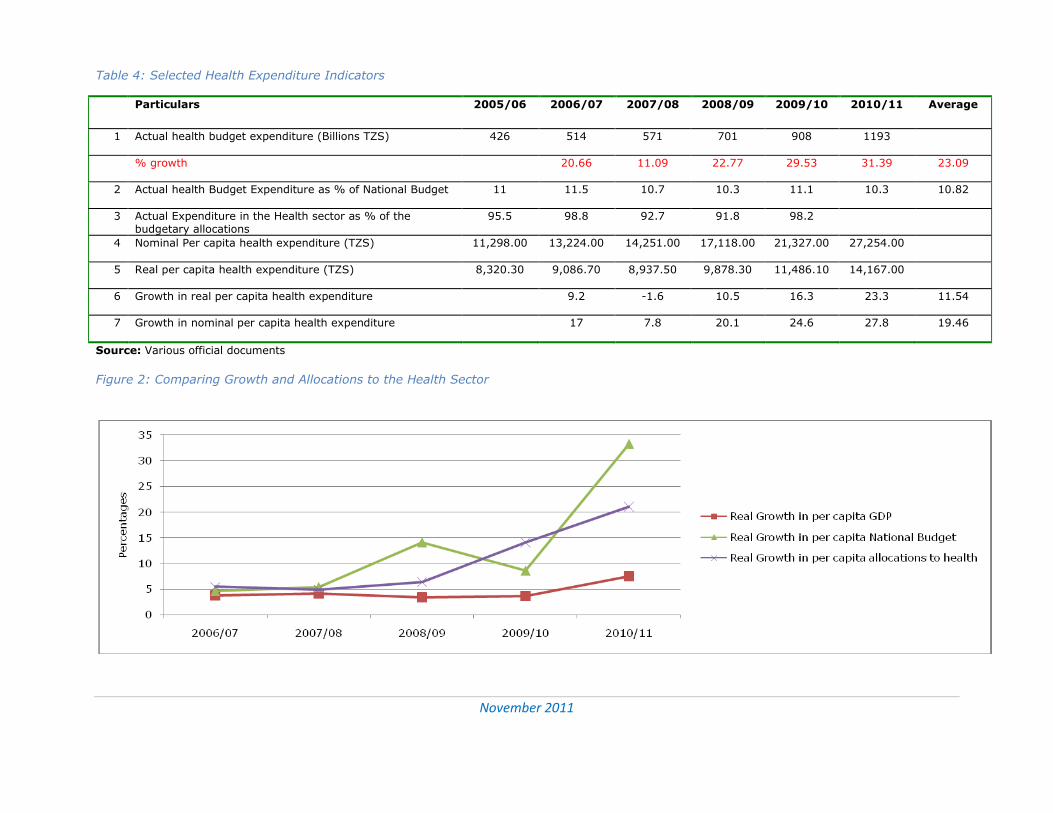
Real growth in per capita expenditure in the sector is lower than the real growth in per capita national budget Implication: Tanzania needs more capita health spending at least to match growth in the national budget and the neighbouring countries
Table 3 shows per capita international PPP US dollars for Tanzania and the neighbouring
countries. Tanzania spends less than the average of the region on health – less by 18%
of the average spending. It lies below Kenya, Zambia, Rwanda and Uganda. Clearly,
more effort is needed to raise health spending and thus health outcomes therein.
However, the nominal and real per capita allocations in the health sector have been
growing at an average rate of 18.3% and 10.4%, respectively. Implications:
3.2 Trends in actual expenditure on the Health Sector
Actual expenditure on the health sector has been growing by 20.7% in 2006/07 to
31.4% in 2011 – growth rate (Table 4). This is higher than the rate of growth in the
budgetary allocations in the sector; and thus indicates a collapsing gap between
budgetary allocations and actual expenditure in the sector. Actual expenditure as a
proportion of budgetary allocation has improved from the lowest of 91.8% in 2008/09
to 98.2% in 2009/10.
Per capita public expenditure on health has increased in both nominal and real terms.
In nominal terms, per capita public expenditure on health increased by 141.2%
between 2005/06 and 2010/2011. In real terms, the per capita spending increased by
70% in a period of five years (Figure 2). This is a remarkable achievement though it is
incredibly dependent on external financing and comparably low in per capita
international dollar spending relative to the neighbouring countries as indicated earlier.
Observations:
November 2011
19
Table 4: Selected Health Expenditure Indicators
Particulars 2005/06 2006/07 2007/08 2008/09 2009/10 2010/11 Average
1 Actual health budget expenditure (Billions TZS) 426 514 571 701 908 1193
% growth 20.66 11.09 22.77 29.53 31.39 23.09
2 Actual health Budget Expenditure as % of National Budget 11 11.5 10.7 10.3 11.1 10.3 10.82
3 Actual Expenditure in the Health sector as % of the budgetary allocations
95.5 98.8 92.7 91.8 98.2
4 Nominal Per capita health expenditure (TZS) 11,298.00 13,224.00 14,251.00 17,118.00 21,327.00 27,254.00
5 Real per capita health expenditure (TZS) 8,320.30 9,086.70 8,937.50 9,878.30 11,486.10 14,167.00
6 Growth in real per capita health expenditure 9.2 -1.6 10.5 16.3 23.3 11.54
7 Growth in nominal per capita health expenditure 17 7.8 20.1 24.6 27.8 19.46
Source: Various official documents
Figure 2: Comparing Growth and Allocations to the Health Sector
November 2011
20
Actual flow of funds for the Health Sector has on average surpassed budgetary allocations
Both local and foreign sources of funds have been growing overtime, but the latter has grown faster than the former.
Actual funds from foreign sources have on average been less than the corresponding budget estimates
Off budget sources of funds have been marginally small Therefore:
Urge Development Partners to honour their budget Commitments to the Health Sector
Urge local sources to increase their expenditure on Health
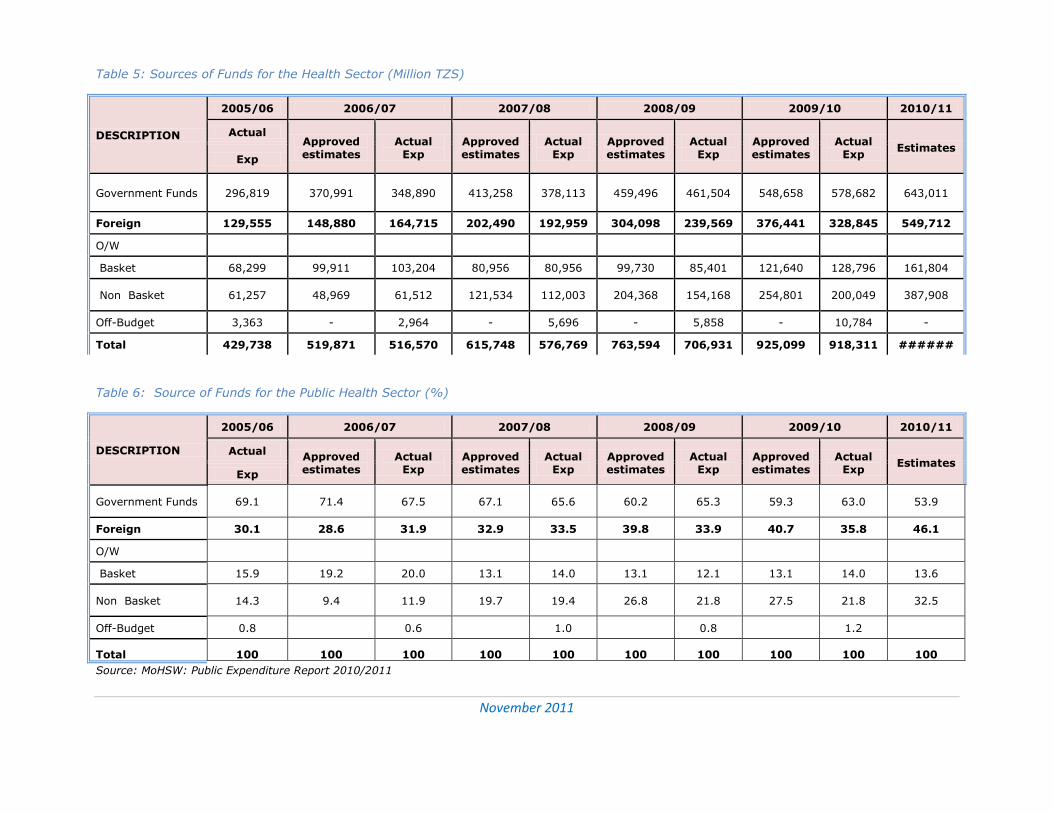
3.3 Sources of Financing for the Health Sector
The composition of the Health Sector financing by the various sources of funds is
analyzed in Tables 5&6. The results show that the main source of fund for the health
sector is the government who’s budgetary and actual expenditure shares have
averaged 62.38% and 66.1%, for the past five years, respectively. This reflects an
improved trend in the financing gap between budgetary allocations and actual release
of funds. In fact over the past two years expenditure on the health sector has
surpassed budgetary allocations for the same.
Foreign expenditure in terms of actual release of funds has averaged 33% of the total
expenditure of the sector since 2005/06. This is less than budgetary commitments for
the same which have averaged 37.62% (Table 6). Clearly, release of funds from foreign
sources has generally been less than budget commitments. For example, in 2009/2010,
the actual fund release was 87.4 of the budget, creating a financing gap of TZS 47.6
billion. The amount would have constituted 33% of the respective annual expenditure
required for the on-going implementation of the Road Map for Accelerated Reduction of
Maternal and Child deaths.
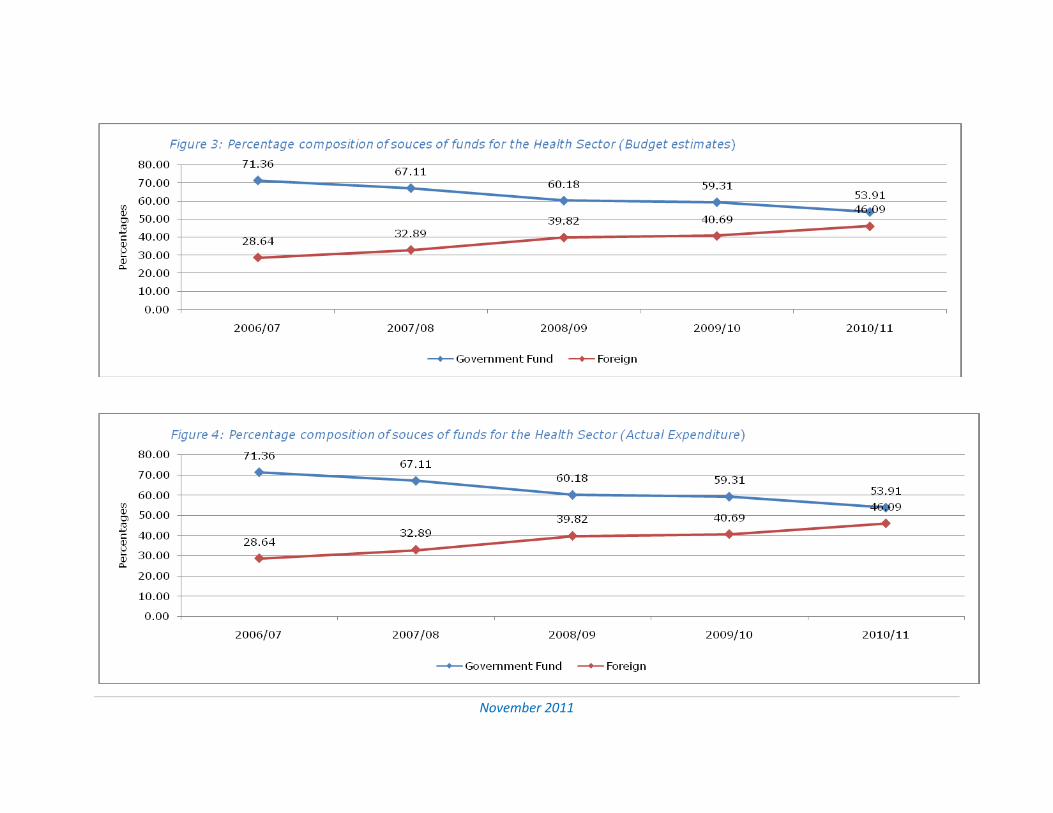
Further in Figures 3&4 we observe that the share of foreign sources of funds in the
budget estimates for the health sector has increased from 28.6% in 2006/07 to 46.1%
in 2010/2011. In terms of actual expenditure, the share increased from 30.1% in
2005/06 to 35.8% in 2009/2010.
Implications:
November 2011
21
Table 5: Sources of Funds for the Health Sector (Million TZS)
DESCRIPTION
2005/06 2006/07 2007/08 2008/09 2009/10 2010/11
Actual Approved estimates
Actual Exp
Approved estimates
Actual Exp
Approved estimates
Actual Exp
Approved estimates
Actual Exp
Estimates Exp
Government Funds 296,819 370,991 348,890 413,258 378,113 459,496 461,504 548,658 578,682 643,011
Foreign 129,555 148,880 164,715 202,490 192,959 304,098 239,569 376,441 328,845 549,712
O/W
Basket 68,299 99,911 103,204 80,956 80,956 99,730 85,401 121,640 128,796 161,804
Non Basket 61,257 48,969 61,512 121,534 112,003 204,368 154,168 254,801 200,049 387,908
Off-Budget 3,363 - 2,964 - 5,696 - 5,858 - 10,784 -
Total 429,738 519,871 516,570 615,748 576,769 763,594 706,931 925,099 918,311 ######
Table 6: Source of Funds for the Public Health Sector (%)
DESCRIPTION
2005/06 2006/07 2007/08 2008/09 2009/10 2010/11
Actual Approved estimates
Actual Exp
Approved estimates
Actual Exp
Approved estimates
Actual Exp
Approved estimates
Actual Exp
Estimates Exp
Government Funds 69.1 71.4 67.5 67.1 65.6 60.2 65.3 59.3 63.0 53.9
Foreign 30.1 28.6 31.9 32.9 33.5 39.8 33.9 40.7 35.8 46.1
O/W
Basket 15.9 19.2 20.0 13.1 14.0 13.1 12.1 13.1 14.0 13.6
Non Basket 14.3 9.4 11.9 19.7 19.4 26.8 21.8 27.5 21.8 32.5
Off-Budget 0.8 0.6 1.0 0.8 1.2
Total 100 100 100 100 100 100 100 100 100 100
Source: MoHSW: Public Expenditure Report 2010/2011
November 2011
22
November 2011
23
Health has never toped up as a priority in budgetary allocations for the last ten years
Health comes third in terms of priority sectors in budgetary
allocations after Education and Infrastructure
Implication: The Health Sector gets disproportionally less budgetary allocations compared to the budget growth capita health spending at least to match growth in the national budget and the neighbouring
countries
3.4 Health Sector Budgetary Allocations Relative to other Sectors
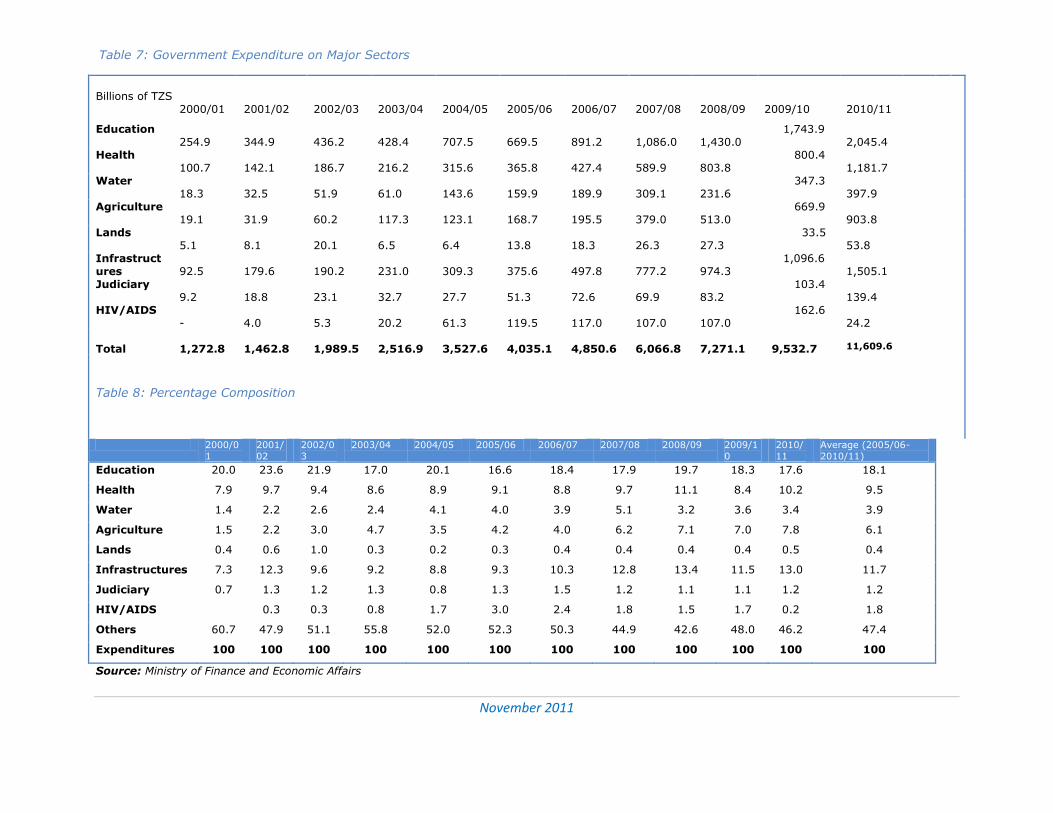
Table 7&8 is a summary of the government expenditure by the major sectors for the
last ten years. It is observed that health has never been at the top up as a priority in
budgetary allocations for the last ten years. Since 2005/06, the Health Sector has
ranked third in priority in the allocations. In general there have been three priority
sectors in the government budgetary allocations with the Health Sector taking the third
position with an average allocation of 9.5% of the total budget. Allocations to the
Education sector which has persistently ranked first have been 18.1% on average; and
the Infrastructure sector comes second with an average allocation of 11.7%.
Observations:
November 2011
24
Table 7: Government Expenditure on Major Sectors
Billions of TZS
2000/01 2001/02 2002/03 2003/04 2004/05 2005/06 2006/07 2007/08 2008/09 2009/10 2010/11
Education 254.9
344.9
436.2
428.4
707.5
669.5
891.2
1,086.0
1,430.0
1,743.9 2,045.4
Health 100.7
142.1
186.7
216.2
315.6
365.8
427.4
589.9
803.8
800.4 1,181.7
Water 18.3
32.5
51.9
61.0
143.6
159.9
189.9
309.1
231.6
347.3 397.9
Agriculture 19.1
31.9
60.2
117.3
123.1
168.7
195.5
379.0
513.0
669.9 903.8
Lands 5.1
8.1
20.1
6.5
6.4
13.8
18.3
26.3
27.3
33.5 53.8
Infrastructures
92.5
179.6
190.2
231.0
309.3
375.6
497.8
777.2
974.3
1,096.6 1,505.1
Judiciary 9.2
18.8
23.1
32.7
27.7
51.3
72.6
69.9
83.2
103.4 139.4
HIV/AIDS -
4.0
5.3
20.2
61.3
119.5
117.0
107.0
107.0
162.6 24.2
Total
1,272.8
1,462.8
1,989.5
2,516.9
3,527.6
4,035.1
4,850.6
6,066.8
7,271.1
9,532.7
11,609.6
Table 8: Percentage Composition
2000/0
1
2001/
02
2002/0
3
2003/04 2004/05 2005/06 2006/07 2007/08 2008/09 2009/1
0
2010/
11
Average (2005/06-
2010/11)
Education 20.0 23.6 21.9 17.0 20.1 16.6 18.4 17.9 19.7 18.3 17.6 18.1
Health 7.9 9.7 9.4 8.6 8.9 9.1 8.8 9.7 11.1 8.4 10.2 9.5
Water 1.4 2.2 2.6 2.4 4.1 4.0 3.9 5.1 3.2 3.6 3.4 3.9
Agriculture 1.5 2.2 3.0 4.7 3.5 4.2 4.0 6.2 7.1 7.0 7.8 6.1
Lands 0.4 0.6 1.0 0.3 0.2 0.3 0.4 0.4 0.4 0.4 0.5 0.4
Infrastructures 7.3 12.3 9.6 9.2 8.8 9.3 10.3 12.8 13.4 11.5 13.0 11.7
Judiciary 0.7 1.3 1.2 1.3 0.8 1.3 1.5 1.2 1.1 1.1 1.2 1.2
HIV/AIDS 0.3 0.3 0.8 1.7 3.0 2.4 1.8 1.5 1.7 0.2 1.8
Others 60.7 47.9 51.1 55.8 52.0 52.3 50.3 44.9 42.6 48.0 46.2 47.4
Expenditures 100 100 100 100 100 100 100 100 100 100 100 100
Source: Ministry of Finance and Economic Affairs
November 2011
25
4. Trends of the MNCH Sub-sector Financing and Emerging Issues
4.1 MNCH Spending at the National Level
The subsector MNCH has two major components; maternal and newborns – MN, and child health - CH. At the MoHSW, MN falls under the Department of Reproductive and Child Health (RCH), and CH falls under the general expenditure on health services other
than MN. Accordingly, the analysis in this report distinguishes between the two. Expenditures on MN were directly obtainable from the spending units which include the RCH Department at the MoHSW, District and Urban Councils, and Development
Partners. This information is categorically available from the spending units at the various sources. At the MoHSW, there is a distinction between expenditure on reproductive health and maternal and newborns. Immunization and PMTCT are
components of MN. But financial information on CH has been computed from the general data as we explain next.
The information management system (IMS) at the MoHSW shows data on patients attending public facilities by age and type of disease/medical problem diagnosed.
Expenditure at any health facility includes wages and salaries, implying that though we have data on expenditure for some interventions, they do not include costs on the medical personnel and other centrally incurred costs. Therefore, in order to work out
the proportion of the total expenditure going to under-five in the general health services departments, we first computed the average proportion of under-five (who seek medical services in public health facilities) from the total number of patients in the
outpatients department (OPD) in public health facilities in Tanzania. We then multiplied it by the total budget going to the general health services departments - to get the spending on under-fives. This is to say that about 44% of ODP patients in public health
facilities in Tanzania are under-fives; assuming that proportionally public health facilities spend 44% of their funds (net of those going to maternal and newborns) on under-fives. And further to that, we assume that about 44% (average) of the central
spending on the Health Sector (MoHSW) also goes to under-fives. It is thus conclusive to estimate that 44% of the public expenditure in the Health Sector (excluding expenditure on MN) is for under-fives. This is an estimate rather than actual
expenditure because the health system has many overlapping services including those which are purely administrative and centrally administered services.
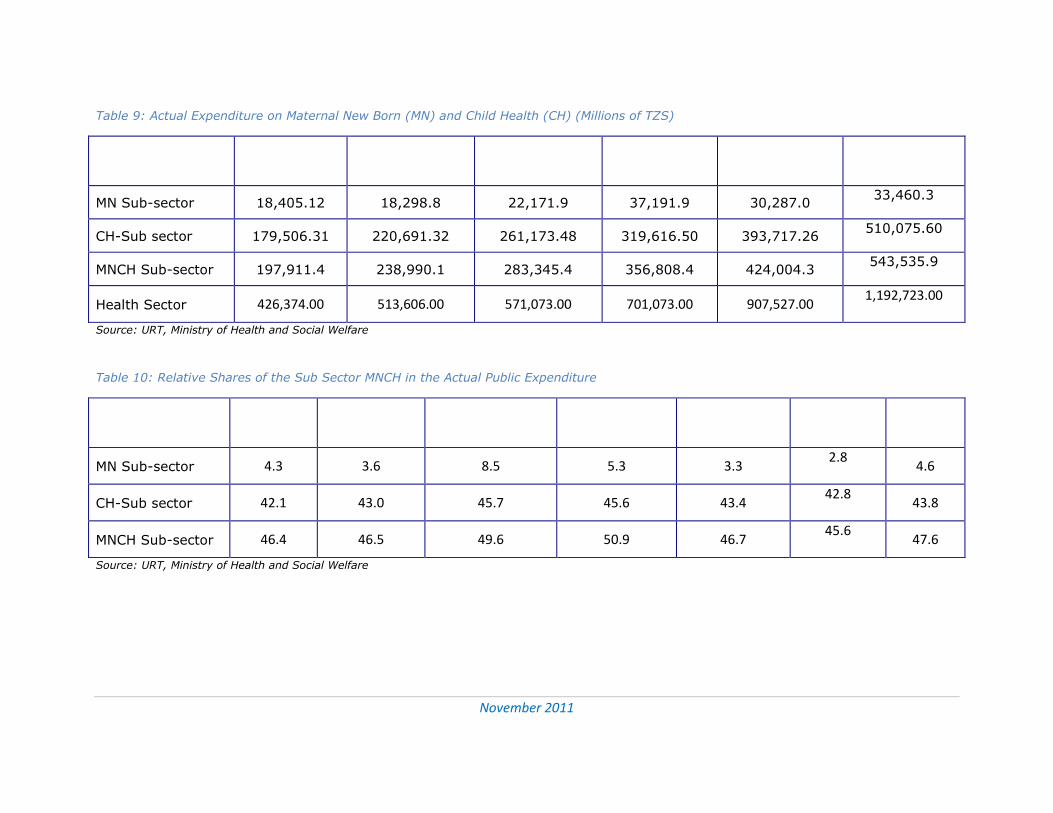
Table 9 shows expenditure on the sub sector MNCH and its major components – MN and CH for the period 2005/06 – 2010/2011. Further in Table 10, it is the proportionate shares of the MNCH and its components in the total Health Sector expenditure. On
average, the subsector MNCH received 47.6% of the total spending in the Health Sector. Expenditure on MN averaged 4.6% of the total spending in the health sector with the peak in 2007/08. The component CH received about 43.8% (estimates) of the
expenditure on the health sector during the period.
It is observed further from Table 10 and Figure 5 that the share of the MNCH in the Health Sector expenditure has marginally decreased from 46.4% in 2005/06 to 45.6 in
MNCH Financing in Tanzania
October 2011
26
26
2010/2011. More alarming is the declining share of the MN from 4.3% in 2005/06 to 2.8% in 2010/2011. The growth rate of MN has also decreased significantly (Figure 5).
This is particularly a concern because despite the fact that maternal mortality rate has remained persistently high in Tanzania; there are not clear deliberate efforts to increase the share of the MN in the health spending. However, the share of the CH in the total
spending on health has remained fairly constant during the period. It should be noted that basket funding and budget support approaches do not permit breakdown of spending on MNCH by the sources of the funds (Development Partners).
November 2011
27
Table 9: Actual Expenditure on Maternal New Born (MN) and Child Health (CH) (Millions of TZS)
Sector
2005/06
2006/2007
2007/2008
2008/09
2009/10
2010/2011
MN Sub-sector 18,405.12 18,298.8 22,171.9 37,191.9 30,287.0 33,460.3
CH-Sub sector 179,506.31 220,691.32 261,173.48 319,616.50 393,717.26 510,075.60
MNCH Sub-sector 197,911.4 238,990.1 283,345.4 356,808.4 424,004.3 543,535.9
Health Sector 426,374.00 513,606.00 571,073.00 701,073.00 907,527.00 1,192,723.00
Source: URT, Ministry of Health and Social Welfare
Table 10: Relative Shares of the Sub Sector MNCH in the Actual Public Expenditure
Sector
2005/06
2006/2007
2007/2008
2008/09
2009/10
2010/2011
Average
MN Sub-sector 4.3 3.6 8.5 5.3 3.3 2.8
4.6
CH-Sub sector 42.1 43.0 45.7 45.6 43.4 42.8
43.8
MNCH Sub-sector 46.4 46.5 49.6 50.9 46.7 45.6
47.6
Source: URT, Ministry of Health and Social Welfare
November 2011
28
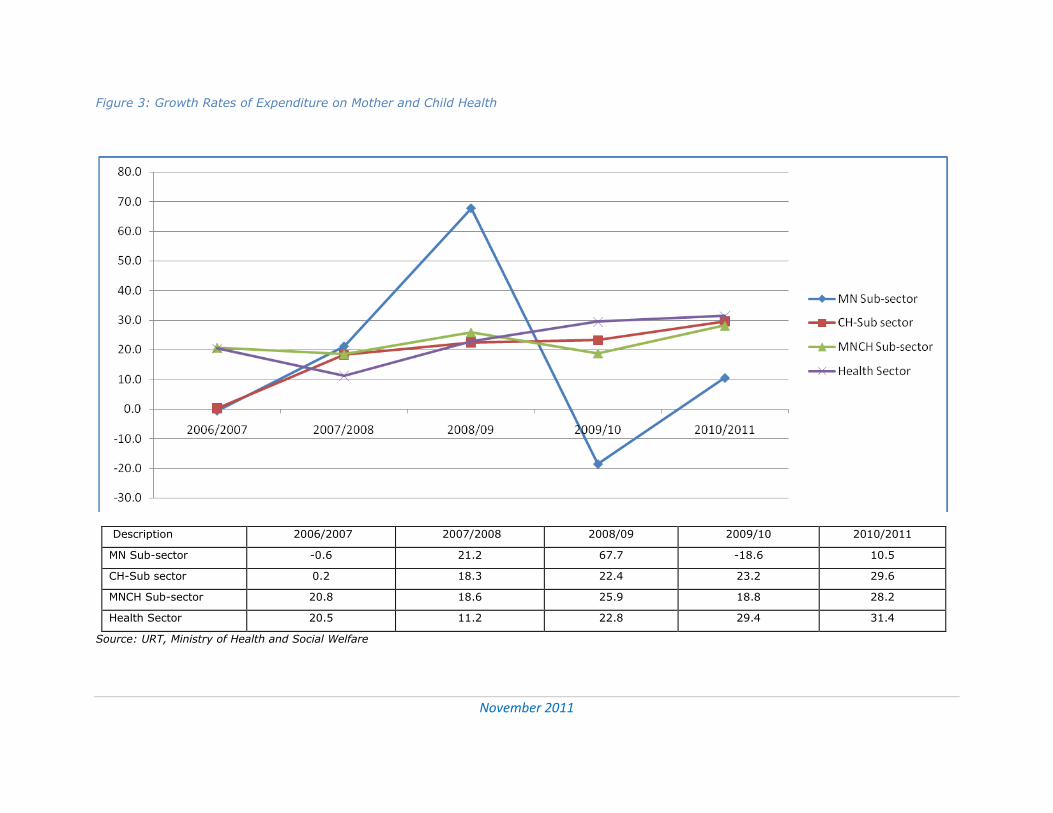
Figure 3: Growth Rates of Expenditure on Mother and Child Health
Description 2006/2007 2007/2008 2008/09 2009/10 2010/2011
MN Sub-sector -0.6 21.2 67.7 -18.6 10.5
CH-Sub sector 0.2 18.3 22.4 23.2 29.6
MNCH Sub-sector 20.8 18.6 25.9 18.8 28.2
Health Sector 20.5 11.2 22.8 29.4 31.4
Source: URT, Ministry of Health and Social Welfare
November 2011
29
The share of the MNCH in the total health expenditure is 47% on average The share of the CH has remained fairly constant over the last five years The MN share, however, is only 4.6% and declining MN share is also the smallest in the total funds used to finance
interventions in the HEALTH SECTOR IN 2009/2010.
Thus, MN has not received the due priority in the public health expenditures
Table 11 shows expenditure by the major interventions at the MoHSW in 2009/2010. The sub sector MNCH received the lion share of the spending in the Health Sector.
However, the share of the sub sector MN is relatively very small – about 3.3%. Table 11: Comparing the Share of MNCH with other sub Sectors in 2009/10
Key intervention areas Share (%)
Malaria 3.8
TB/Leprosy 3.8
HIV & AIDS 11.2
CH 42.9
MN 3.3
Others including administration 35.0
Total Health Budget (Actual) 100
Source: Public Expenditure Reports, MoHSW
Summary:
4.2 Off-budget Donor Financing of MNCH
Off-budget donor financing includes expenditure made on MNCH outside the national
budget framework. This information is which is not reflected in the national budget has
been very difficult to get from the sources. Based on the available information, the
analysis of off-budget donor financing of MNCH in Table 12 shows an increase from
0.2% of the total expenditure on MNCH in 2006/07 to 2.4% in 2010/11. Most of donor
financing of the sub sector is through basket funding, which is not earmarked for
specific expenditure.
MNCH Financing in Tanzania
October 2011
30
30
Table 12: Budgetary and Off-budget Financing of MNCH in Tanzania
Source of funds 2006/07 2007/08 2008/09 2009/10 2010/11
Budgetary source 99.8 99.9 98.2 96.1 97.6
Off budget 0.2 0.1 1.8 3.9 2.4
Total MNCH 100.0 100.0 100.0 100.0 100.0
Source: Public Expenditure Reports, MoHSW
4.3 Spending at the LGAs Level
Councils prepare one comprehensive document for planning and budget at that level.
The document is commonly known as Comprehensive Council Health Plan (CCPH). This is the document which shows actual expenditure by health interventions for the outgoing year and planned expenditure and activities for the coming year. We accessed
these documents from the MoHSW and extracted information on planned and actual expenditure for 110 councils (out of 132 in total).
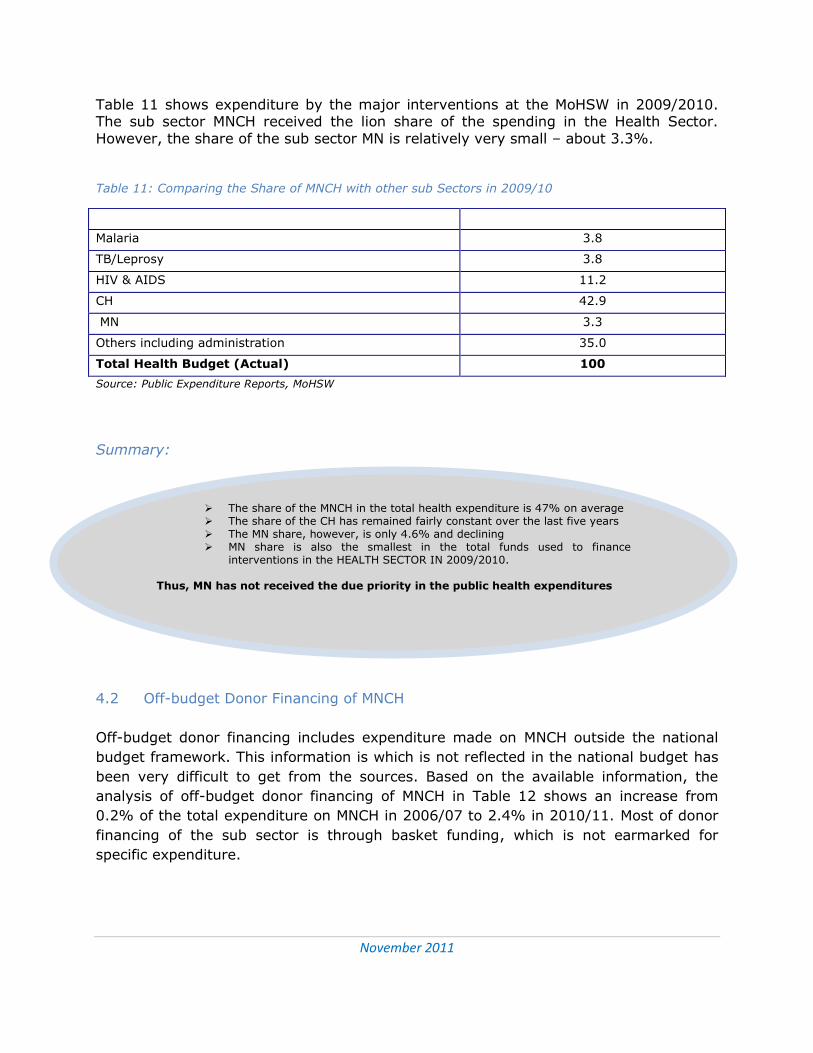
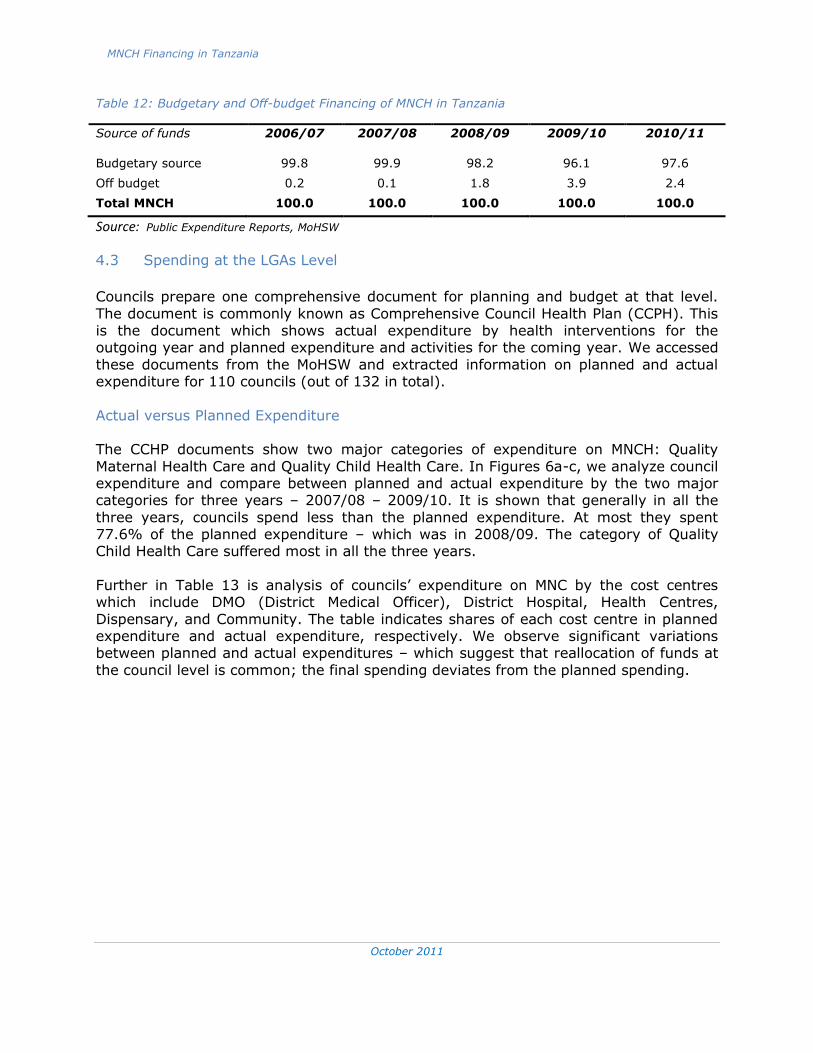
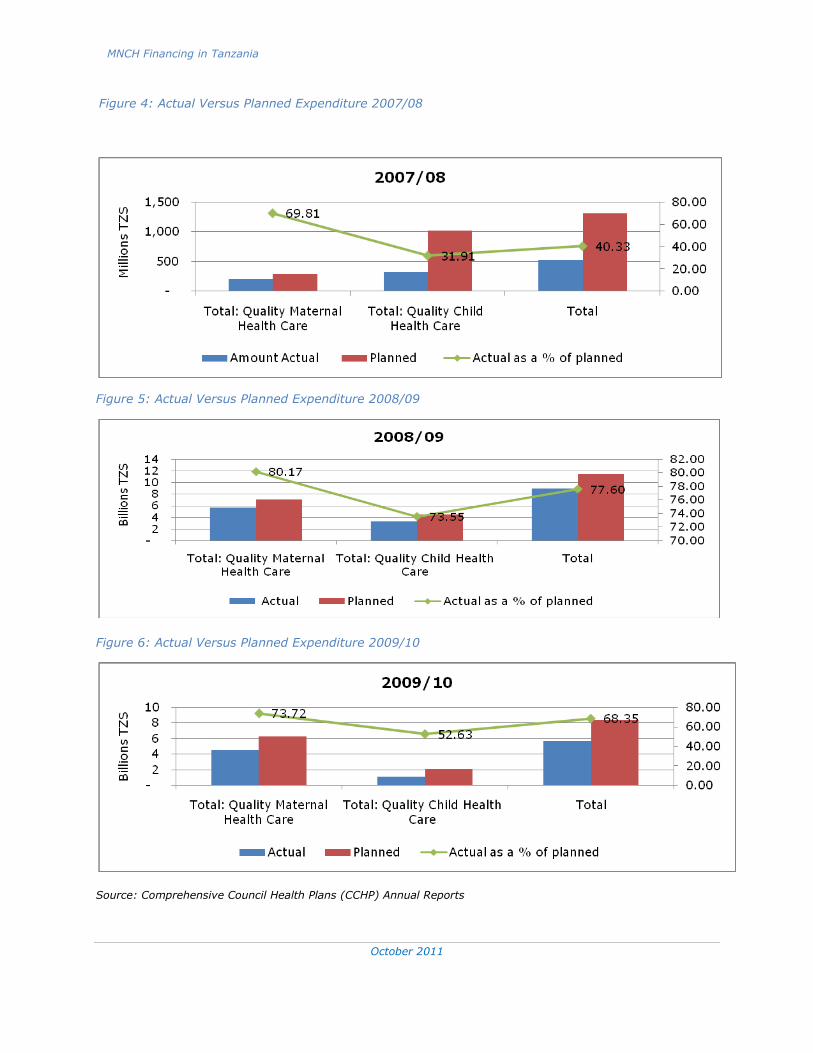
Actual versus Planned Expenditure The CCHP documents show two major categories of expenditure on MNCH: Quality
Maternal Health Care and Quality Child Health Care. In Figures 6a-c, we analyze council expenditure and compare between planned and actual expenditure by the two major categories for three years – 2007/08 – 2009/10. It is shown that generally in all the
three years, councils spend less than the planned expenditure. At most they spent 77.6% of the planned expenditure – which was in 2008/09. The category of Quality Child Health Care suffered most in all the three years.
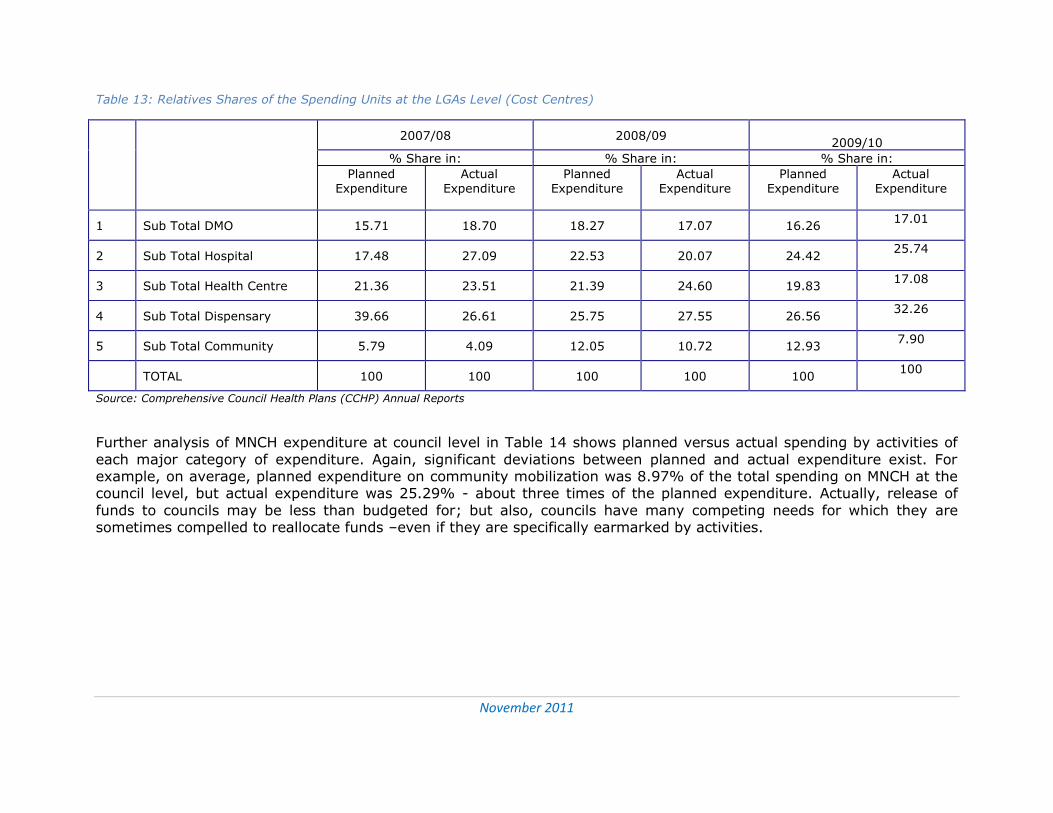
Further in Table 13 is analysis of councils’ expenditure on MNC by the cost centres which include DMO (District Medical Officer), District Hospital, Health Centres,
Dispensary, and Community. The table indicates shares of each cost centre in planned expenditure and actual expenditure, respectively. We observe significant variations between planned and actual expenditures – which suggest that reallocation of funds at
the council level is common; the final spending deviates from the planned spending.
MNCH Financing in Tanzania
October 2011
31
31
Figure 4: Actual Versus Planned Expenditure 2007/08
Figure 5: Actual Versus Planned Expenditure 2008/09
Figure 6: Actual Versus Planned Expenditure 2009/10
Source: Comprehensive Council Health Plans (CCHP) Annual Reports
November 2011
32
Table 13: Relatives Shares of the Spending Units at the LGAs Level (Cost Centres)
S/N Spending Units
2007/08 2008/09
2009/10
% Share in: % Share in: % Share in:
Planned Expenditure
Actual Expenditure
Planned Expenditure
Actual Expenditure
Planned Expenditure
Actual Expenditure
1 Sub Total DMO 15.71 18.70 18.27 17.07 16.26 17.01
2 Sub Total Hospital 17.48 27.09 22.53 20.07 24.42 25.74
3 Sub Total Health Centre 21.36 23.51 21.39 24.60 19.83 17.08
4 Sub Total Dispensary 39.66 26.61 25.75 27.55 26.56 32.26
5 Sub Total Community 5.79 4.09 12.05 10.72 12.93 7.90
TOTAL 100 100 100 100 100 100
Source: Comprehensive Council Health Plans (CCHP) Annual Reports
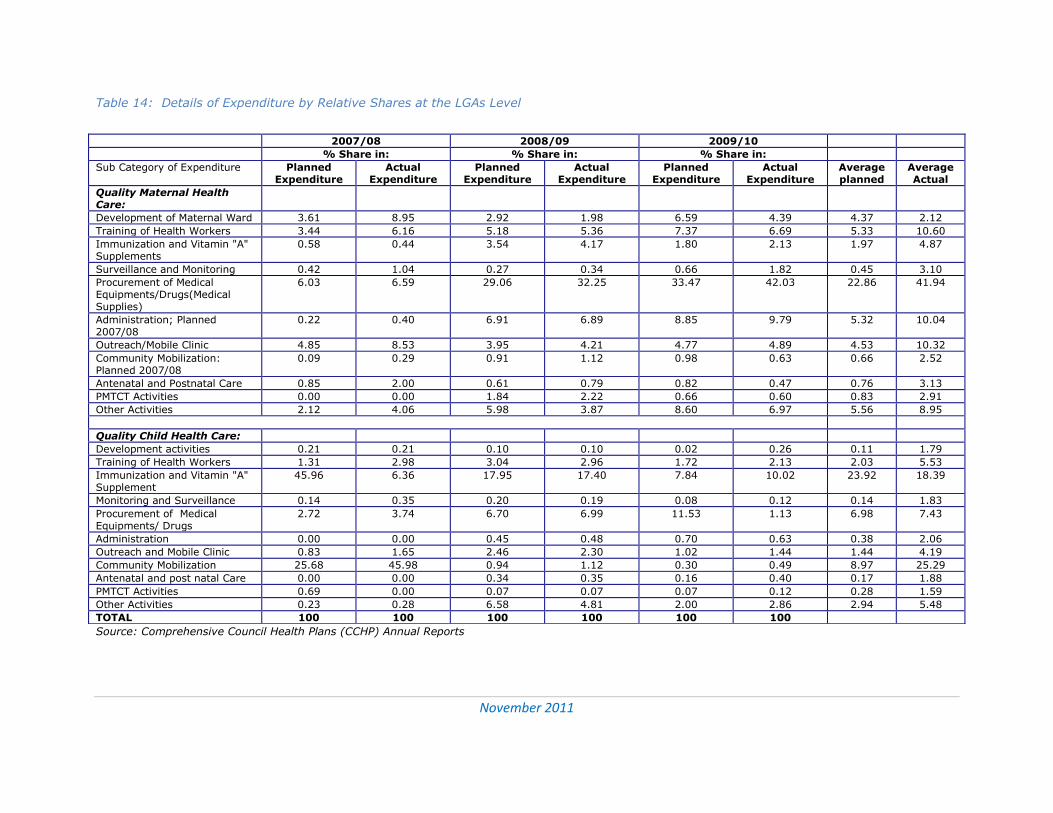
Further analysis of MNCH expenditure at council level in Table 14 shows planned versus actual spending by activities of
each major category of expenditure. Again, significant deviations between planned and actual expenditure exist. For example, on average, planned expenditure on community mobilization was 8.97% of the total spending on MNCH at the council level, but actual expenditure was 25.29% - about three times of the planned expenditure. Actually, release of
funds to councils may be less than budgeted for; but also, councils have many competing needs for which they are sometimes compelled to reallocate funds –even if they are specifically earmarked by activities.
November 2011
33
Table 14: Details of Expenditure by Relative Shares at the LGAs Level
Source: Comprehensive Council Health Plans (CCHP) Annual Reports
2007/08 2008/09 2009/10
% Share in: % Share in: % Share in:
Sub Category of Expenditure Planned Expenditure
Actual Expenditure
Planned Expenditure
Actual Expenditure
Planned Expenditure
Actual Expenditure
Average planned
Average Actual
Quality Maternal Health Care:
Development of Maternal Ward 3.61 8.95 2.92 1.98 6.59 4.39 4.37 2.12
Training of Health Workers 3.44 6.16 5.18 5.36 7.37 6.69 5.33 10.60
Immunization and Vitamin "A" Supplements
0.58 0.44 3.54 4.17 1.80 2.13 1.97 4.87
Surveillance and Monitoring 0.42 1.04 0.27 0.34 0.66 1.82 0.45 3.10
Procurement of Medical Equipments/Drugs(Medical Supplies)
6.03 6.59 29.06 32.25 33.47 42.03 22.86 41.94
Administration; Planned 2007/08
0.22 0.40 6.91 6.89 8.85 9.79 5.32 10.04
Outreach/Mobile Clinic 4.85 8.53 3.95 4.21 4.77 4.89 4.53 10.32
Community Mobilization: Planned 2007/08
0.09 0.29 0.91 1.12 0.98 0.63 0.66 2.52
Antenatal and Postnatal Care 0.85 2.00 0.61 0.79 0.82 0.47 0.76 3.13
PMTCT Activities 0.00 0.00 1.84 2.22 0.66 0.60 0.83 2.91
Other Activities 2.12 4.06 5.98 3.87 8.60 6.97 5.56 8.95
Quality Child Health Care:
Development activities 0.21 0.21 0.10 0.10 0.02 0.26 0.11 1.79
Training of Health Workers 1.31 2.98 3.04 2.96 1.72 2.13 2.03 5.53
Immunization and Vitamin "A" Supplement
45.96 6.36 17.95 17.40 7.84 10.02 23.92 18.39
Monitoring and Surveillance 0.14 0.35 0.20 0.19 0.08 0.12 0.14 1.83
Procurement of Medical Equipments/ Drugs
2.72 3.74 6.70 6.99 11.53 1.13 6.98 7.43
Administration 0.00 0.00 0.45 0.48 0.70 0.63 0.38 2.06
Outreach and Mobile Clinic 0.83 1.65 2.46 2.30 1.02 1.44 1.44 4.19
Community Mobilization 25.68 45.98 0.94 1.12 0.30 0.49 8.97 25.29
Antenatal and post natal Care 0.00 0.00 0.34 0.35 0.16 0.40 0.17 1.88
PMTCT Activities 0.69 0.00 0.07 0.07 0.07 0.12 0.28 1.59
Other Activities 0.23 0.28 6.58 4.81 2.00 2.86 2.94 5.48
TOTAL 100 100 100 100 100 100
November 2011
34
Actual expenditure deviates significantly from planned
expenditure across most of the activities under MNCH
subsector.
Implications:
There are reallocations that lead to reprioritization of activities
in the MNCH sub sector – potentially compromising the
objectives and targets set at national level
Thus, Improve management of the MNCH funds at the council
level including strict auditing and monitoring.
What do the trends in MNCH spending at the council level tell us?
6. Summary of Entry Points and Recommendations for Advocacy
for Increased Public Expenditure on MNCH
6.1 More effort is needed to achieve the MDG 4&5
The trends in Newborns and Child Health in Tanzania point to the possibility of attaining
the MDG 4, as indicated earlier, provided that the current efforts on MNCH are scaled up and sustained, including allocation of more resources and efficient use of the same in the sub sector of MNCH. However, the observed trend in Figure 8 predicts that
attainment of MDG 5 remains rather a challenge; it is clearly plausible that unless the current efforts are massively scaled up, Tanzania will not be able to meet the MDG 5 even by fifty percent.
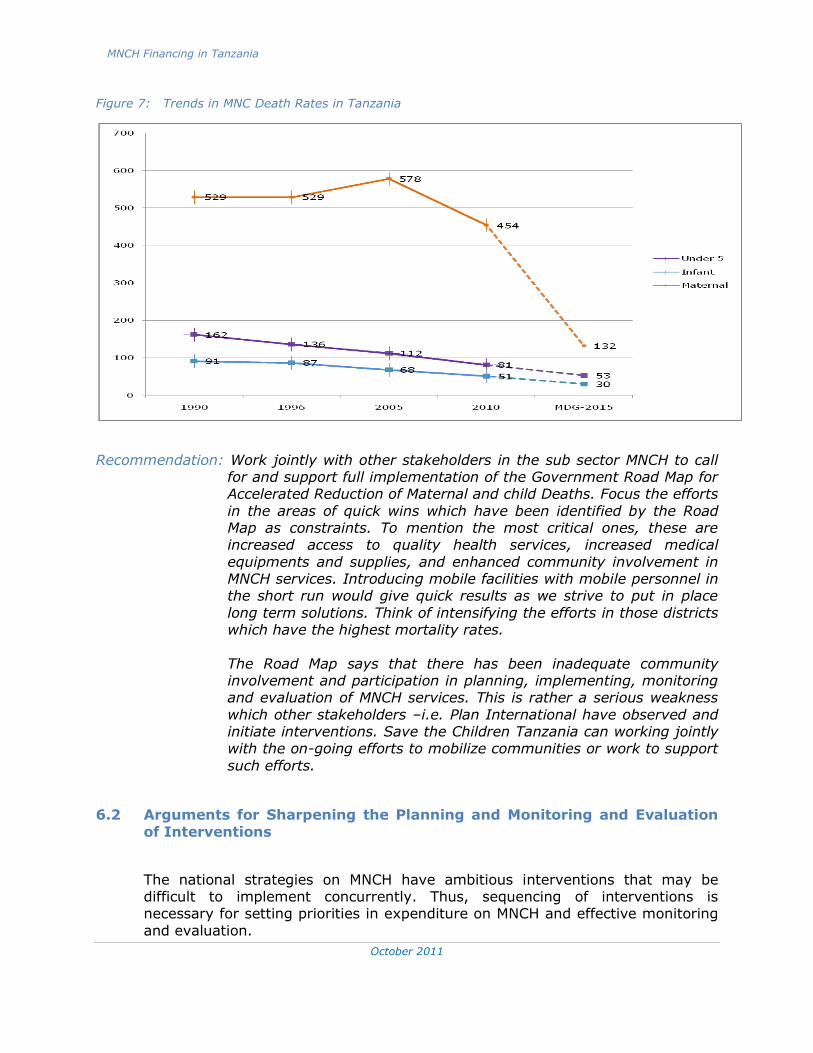
MNCH Financing in Tanzania
October 2011
35
35
Figure 7: Trends in MNC Death Rates in Tanzania
Recommendation: Work jointly with other stakeholders in the sub sector MNCH to call for and support full implementation of the Government Road Map for Accelerated Reduction of Maternal and child Deaths. Focus the efforts
in the areas of quick wins which have been identified by the Road Map as constraints. To mention the most critical ones, these are increased access to quality health services, increased medical
equipments and supplies, and enhanced community involvement in MNCH services. Introducing mobile facilities with mobile personnel in the short run would give quick results as we strive to put in place
long term solutions. Think of intensifying the efforts in those districts which have the highest mortality rates.
The Road Map says that there has been inadequate community involvement and participation in planning, implementing, monitoring and evaluation of MNCH services. This is rather a serious weakness
which other stakeholders –i.e. Plan International have observed and initiate interventions. Save the Children Tanzania can working jointly with the on-going efforts to mobilize communities or work to support
such efforts.
6.2 Arguments for Sharpening the Planning and Monitoring and Evaluation
of Interventions
The national strategies on MNCH have ambitious interventions that may be difficult to implement concurrently. Thus, sequencing of interventions is necessary for setting priorities in expenditure on MNCH and effective monitoring
and evaluation.
MNCH Financing in Tanzania
October 2011
36
36
Recommendation: Align the current strategies and interventions for MNCH with
resource capacities cum availability. We need to know how much
resources are there for MN in each budget circle and set what can
be achieved for those particular inputs by every district. Thus,
councils should indicate clear targets with clear indicators in their
CCPH both annually and in the medium term expenditure
framework. This should be followed with an effective monitoring
and evaluation system. In fact Save the Children can support
efforts at council level to put in place an effective monitoring and
evaluation at that level. This would then be linked up with a
capable and effective same system at the national level. Lack of
this will limit the achievements enlisted in the national strategies.
6.3 At the Macro Level
Improve tax revenue collection to reach at least the regional average (18%) to increase further the national budget; and at the same time potential for
mobilizing more non tax revenue can be negotiated. This could lead to more resource allocation to the health sector.
The Health Sector gets disproportionably less budgetary allocations compared to the national budget growth. Increase allocations to the health sector at least to
match growth in the national budget and per capita health spending in the neighbouring countries
Increasing budgetary allocation to the Health Sector to reach the target of 15% set by the Abuja Declaration would be adequate for full implementation of the
Road Map for Accelerate Mother and Child Mortality Rates in Tanzania (as indicated earlier in 3.1). This is urgent given that maternal mortality rate is high in Tanzania and unlikely to achieve the MDG target by 2015. It is further
observed that allocations in the subsector MNCH do not match the desired outcomes in the national plans.
Urge local and external resources to increase expenditure on health as a proportion of the total government budget to match at least the per capita international US dollar spending in the neighbouring countries; and further, we
should prioritize maternal and newborns in the spending.
Recommendation: Urge all stakeholders of the subsector MN to increase their spending
on the subsector to reach 15% of the national budget and at least
70 international dollar spending (as per WHO) – the average of the
region.
MNCH Financing in Tanzania
October 2011
37
37
6.4 At the Sectoral Level
Acknowledge the big effort exerted by Development Partners in the Health Sector and urge them further to honour their budget commitment to the sector
Urge local sources of finance, the public sector in particular, to increase their expenditure on MN, and seek to reduce dependency on external sources in the long term.
Recommendation: Urge stakeholders to honour their financial commitment in the health
sector and the sub sector MNCH. Encourage efforts to develop
sustainable health financing mechanisms at all levels.
6.5 At the MNCH Level
The share of the CH has remained fairly constant over the last five years The MN share, however, is only 4.6% and declining
MN share is also the smallest in the total funds used to finance interventions in the health sector in the year 2009/2010.
MN has not received the due priority in the public health expenditures
Recommendation: Strategize to ensure that the share of MNCH in the total budget
increases. This can be achieved by initiating jointly financed
interventions at national and community level. Civil society
organizations can be urges to play their role by lobbying for
increased public spending on the sub sector MNCH. In addition,
more off budget spending can be mobilized through joint
programmes or interventions.
6.6 At the Council Level
Actual expenditure deviates significantly from planned expenditure across most of the activities under MNCH sub sector
There are reallocations that lead to reprioritization of activities in the MNCH sub
sector – potentially compromising the objectives and targets set at national level Improve management of the MNCH funds at the council level including strict
auditing and monitoring.
Recommendation: Urge and support efforts to increase transparency and
accountability at the council level. The role of civil society
organizations should be activated. Also, urge the government
and other stakeholders to put an effective monitoring and
MNCH Financing in Tanzania
October 2011
38
38
evaluation for health expenditures and outcomes at the council
level and link it with the national level. The role of communities
should be clearly identified and publicized.
November 2011
39
Some Key Documents Consulted
MoHSW, Annual Health Statistical Abstract Tanzania Mainland, 2008
MoHSW, Health Sector Performance Profile Report, various years
MoHSW, Health Sector Strategic Plan III July 2009-June 2015
MoHSW, National Road Map Strategic Plan to Accelerate Reduction of Maternal Newborn
and Child Deaths in Tanzania 2008-2015
URT, Comprehensive Council Health Reports, various years
URT, Economic Survey, various years
URT, National Strategy for Growth and Reduction of Poverty I, 2005
URT, National Strategy for Growth and Reduction of Poverty II, July 2010
URT, Poverty and Human Development Report, 2009
URT, Tanzania Demographic and Health Survey (TDHS), 2010
Government Budget and Expenditure Votes Documents: Various
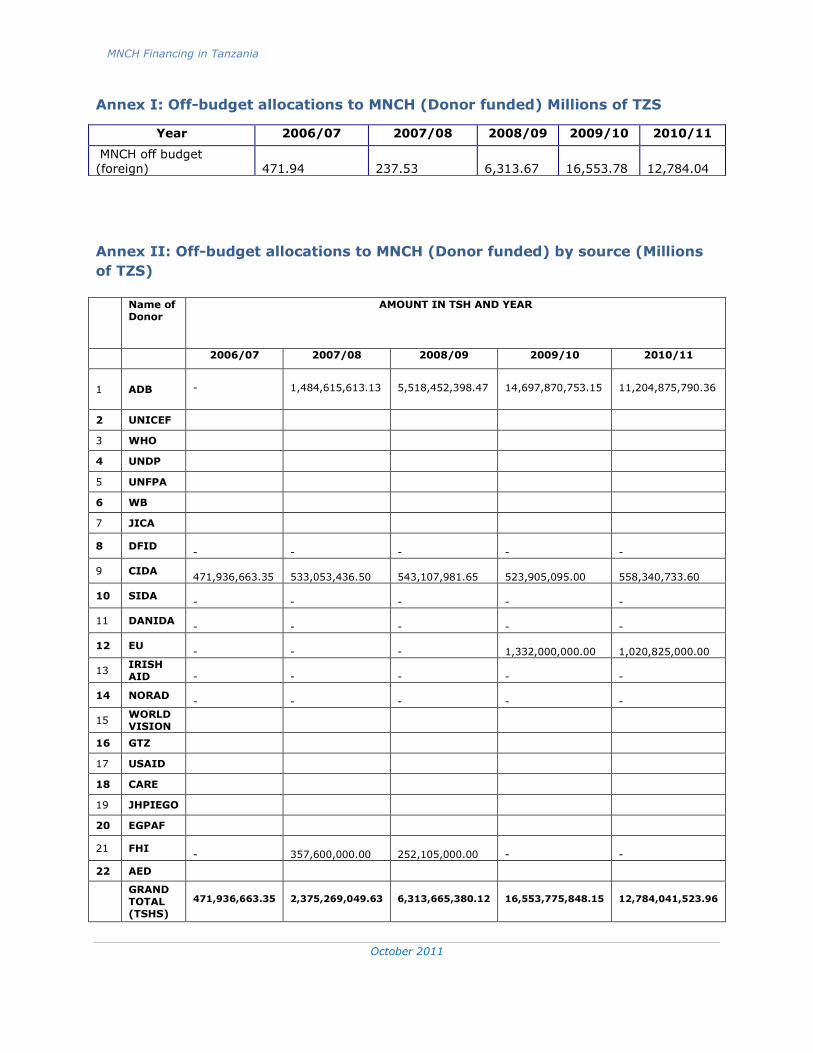
MNCH Financing in Tanzania
October 2011
40
40
Annex I: Off-budget allocations to MNCH (Donor funded) Millions of TZS
Annex II: Off-budget allocations to MNCH (Donor funded) by source (Millions
of TZS)
Name of Donor
AMOUNT IN TSH AND YEAR
2006/07 2007/08 2008/09 2009/10 2010/11
1 ADB
-
1,484,615,613.13
5,518,452,398.47
14,697,870,753.15
11,204,875,790.36
2 UNICEF
3 WHO
4 UNDP
5 UNFPA
6 WB
7 JICA
8 DFID -
-
-
-
-
9 CIDA 471,936,663.35
533,053,436.50
543,107,981.65
523,905,095.00
558,340,733.60
10 SIDA -
-
-
-
-
11 DANIDA -
-
-
-
-
12 EU -
-
-
1,332,000,000.00
1,020,825,000.00
13 IRISH AID
-
-
-
-
-
14 NORAD -
-
-
-
-
15 WORLD VISION
16 GTZ
17 USAID
18 CARE
19 JHPIEGO
20 EGPAF
21 FHI -
357,600,000.00
252,105,000.00
-
-
22 AED
GRAND TOTAL (TSHS)
471,936,663.35
2,375,269,049.63
6,313,665,380.12
16,553,775,848.15
12,784,041,523.96
Year 2006/07 2007/08 2008/09 2009/10 2010/11
MNCH off budget (foreign)
471.94
237.53
6,313.67
16,553.78
12,784.04

MNCH Financing in Tanzania
October 2011
41
41
Annex III: LIST OF PEOPLE CONTACTED AND THEIR ADDRESS
NAME OF THE
INSTITUTION CONTACT PERSON CONTACTS
1 Jhpiego Country Director
R. MLAY
2 World Vision
Programme
Development
Director
3 FHI African Chalamila 0784 430007/0655 430007
4 EGPAF 022 2601692/4
0782 780 217
5 GIZ Country Director [email protected]
6 Care International Country Director 022 2666775
7 USAID 022 2294490 Ext 0/2
Fax 022 2294421
8 UK DFID
Programme
Development Officer
Mr Khamis Babu
Umoja House Garden Avenue
022 2110141
0763 820050
9 DANIDA Ms Grady Minja
Ghana Avenue,
022 2165200
10 IRISH AID COLUMBA ODOWD
IRELAND EMBASSY, 353 TOURE
DRIVE MASAKI
022 2602355
11 EU Commission Riika Torpa Umoja House, Garden Avenue,

MNCH Financing in Tanzania
October 2011
42
42
Shaaban Robert street
0222117473/6
12 NORAD
Email add:
Phone No: 255 22 216 3100
13 SIDA
Embassy of Sweden
P.O.BOX 9274
DSM,
Mirambo street/ garden avenue
Phone no: 255 22 219 6500
255 22 219 6503
14 CIDA
Ms. Mary Mgaya
Dr. Joseph
Komwihangiro
38 Mirambo street/ Garden avenue
P.o.box 1022,
Phone no: 255 22 211 0969/73
Phone no: 0756 43 709
Email add: [email protected]
15 WHO Mr. Max Mapunda Phone No: 0754 228848/2119055
16 WB Dr. Malangalile Phone No: 0784 411155
17 ADB Director
18 MOHSW
Mr. Lusajo Ndangila
Ms. Levina
Marian Ali
0715304673/0754304673
19 MOF
Asst. Commisioner
for Budget
Mr. Meshack
Anyangisye
0713 403874
20 Mary Quorro District Executive
Director, Shinyanga DED office, Shinyanga
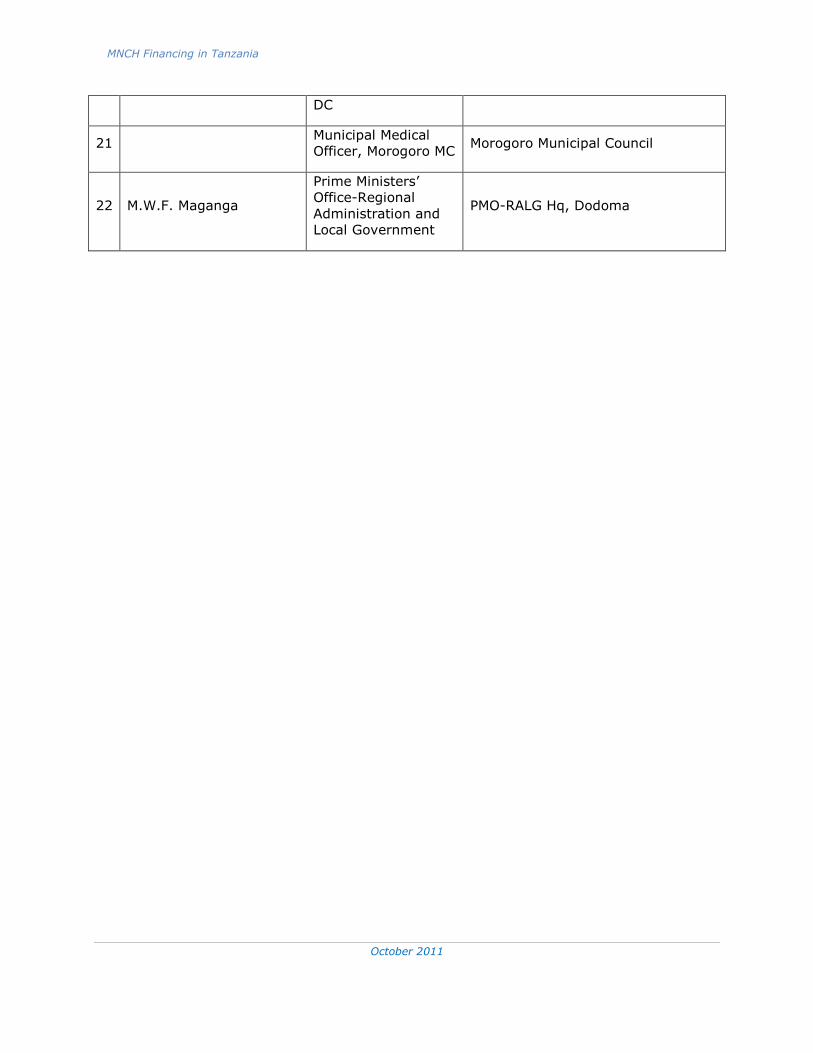
MNCH Financing in Tanzania
October 2011
43
43
DC
21 Municipal Medical
Officer, Morogoro MC Morogoro Municipal Council
22 M.W.F. Maganga
Prime Ministers’
Office-Regional
Administration and
Local Government
PMO-RALG Hq, Dodoma