analysis of fiber reinforced concrete beams under...
TRANSCRIPT

94 TRANSPORTATION RESEARCH RECORD 1226
Analysis of Fiber Reinforced Concrete Beams Under Combined Loadings
A. K. SHARMA
There is an iucrea ing interest in the use of teel fibers to improve th • properties of oncretc. The ldghcr tensile and po !·cracking ductility of fiber reinforced concrete members can favorably influence their tnrctural behavior under combined loadings. Bused on the observed skew bending mecbanism of' torsional failure equalion were deri.ved to analyze fiber reinforced concrete beams under axial compression, bending, and torsion. The theoretical model was compared with published test results and it gives a reasonable prediction of the ultimate torque. A design example is given to show the use of the proposed method.
The use of steel fibers to improve the properties of concrete has been a topic of many studies. Recent studies (1-3) indicate that the addition of steel fibers greatly increases the resistance of concrete to crack propagation. Fiber reinforced concrete can be regarded as an improved type of 1.:un1.:rete with higher tensile strength and post-cracking ductility. Both of these characteristics favorably influence the behavior of fiber concrete beams under combined loadings (4-7) . One such combination of loadings is axial compression, bending, and torsion. This type of loading can occur in compression members, such as columns of building frames, piers of curved and skew bridges, central columns of spiral staircases, columns supporting crane girders, and pylons of multistory car parks. These compression members may be subjected to significant torsion and hencling moment, particularly if wind and seismic forces are considered.
It has been reported (8,9) that steel fiber reinforced concrete beams, when subjected to torsion, collapsed after the formation of cracks that spiralled around the beam. The final collapse occurred in a skew plane, similar to one described by Hsu (JO). A method of analysis applicable to normal reinforced concrete members subjected to torsion and bending moment, with or without axial compression, was previously published (11). This method was an extension of the skew bending theory originally proposed by Hsu (10) . In this paper, the method is extended to analyze fiber reinforced concrete beams subjected to combined axial compression, bending, and torsion.
ANALYSIS
The two modes assumed for the initiation of failure (11) are represented in Figure l(b) and l(c). In mode 1, it is assumed that the skew bending takes place about a centroidal axis, parallel to the wider faces and inclined at angle <f> to the shorter
Department of Civil Engineering, University of the West Indies, Trinidad.
faces. The fibrous concrete would be at the point of failure, due to skewed bending, when the stress at the extreme surface on the tension side becomes equal to the modulus of rupture of the fiber concrete. Figure l(b) shows that the bending vector has no component along the bending axis, indicating that the bending moment does not influence failure in Mode 1. The component of twisting moment about the bending axis is M, cos <f>. The average intensity of compressive stress due to axial compression on the failure plane is P0 sin2<f> . Hence, equating the external moment about the bending axis to the internal resisting moment results in the following:
M, cos <f> = (1/6 b2h cosec <!>) (kfr1 + P0 sin2 <!>) (1)
where
M, torsional strength of fiber reinforced concrete under combined loading;
b,h shorter and longer overall dimensions of the beam, respective! y;
k = strength reduction factor, taken equal to 0.71 for fibrous concrete (9);
P0
= effective axial compressive stress , which equals P/bh;
P = axial force; and f,r = modulus of rupture of fibrous concrete.
Equation 1 can be rewritten in the form
M, = [~ b2h kf,1] [ (1 + ~1 sin2 <f>) cosec 2<f> J (2)
Equation 2 can be expressed as
(3)
where
(4)
and
R = (1 + r sin2 <!>) "' sin 2<f>
(5)
where
M,0
= torsional strength of the fiber reinforced concrete member under pure torsion,

Sharma
x
(a MEMBER UNDER AXIAL COMPRESSION BENDING AND TORSION
FIGURE 1 Skew bending theory.
r = P)kf,1, and R-t> = factor representing the effect of axial compression
in Mode 1.
In Mode 2 (Figure l(c)), the skew bending takes place about a centroidal axis, parallel to the shorter faces and inclined at angle <P to the wider faces. The figure shows that the component of torque and bending moment vectors along the axis of skew bending are Mz cos <P and Mx sin <J>, respectively. Hence, equating the external moment about the bending axis to the internal resisting moment gives
M, cos <I> + Mx sin <I>
= (1/6 bh2 cosec <!>) (kf,1 + P0 sin2 <!>) (6)
Equation 6 may be rewritten in the form
kf, [
1 + p 0
sin2 <!> ] (7)
where
'A= M)M,, and Mx = applied bending moment.
Equation 7 can be expressed as
(8)
where
1 M20 = 3 bh2 kf,1, and (9)
R-t> = (1 + r sin2 <!>)I [2 sin<!> (cos<!> + A sin<!>] (10)
In Mode 2, the R.i, factor takes into account the effect of axial compression as well as the bending moment applied on the section.
95
h
y
EUVATION ELEVATION
PLAN
(b) MODE 1
1~ x <I>
PLAN
(cl MODE 2
The inclination of the axis of skew bending ( <!>) must be such as to minimize the strength.
Equations 4 and 9 show that M'° is independent of<!>. Hence, <!>must correspond to the minimum value of R-t>. The minimum value of R-t> can be found by equating its derivative with respect to <!> to zero; thus, the minimum strength is given by the following equation:
r sin2 <!> - cos 2<!> - A sin 2<!> = 0 (11)
Solving Equation 11, the inclination of the failure plane is given by
sin 2<1> = (2'Ar + 2 ['A2r2 + (1 + r)E] 112/E, and
cos 2<!> = [2r2 + 4r - [(2r2 + 4r)2
- 4(r2 - 4"A2)£1112/2£
where
E = r2 + 4r + 4 + 4'A 2
(12)
(13)
The form of the corresponding equations for Mode 1 is identical to that of the equations for Mode 2, except that A should be zero since there is no interaction between the bending moment (MJ and the torsional moment (M,). The angle 2<!> lies between 0° and 90° if both sin 2<!> and cos 2<!> are positive and between 90° and 180° if sin 2<!> is positive and cos 2<!> is negative. Equations 12 and 13 give the value of<!>, which reduces the value of R-t> to a minimum. Equation 10 is represented graphically in Figure 2, in which R-t> is plotted against r for different values of A.
The addition of fiber in the concrete is reflected in the increased tensile strength of the fibrous concrete, which is expressed in the theory as equal to kf,1. Thus, the ultimate torque of fiber reinforced concrete for Modes 1 and 2 can be computed using Equations 3 and 8. The lesser of the two torques governs failure.

96
2.00
1.50
1.0
• : 0.5 0 >u
"" u..
2 3
TRANSPORTATION RESEARCH RECORD 1226
!. • 0
A = 0. 5
A = 1. 0
A •2 . 0
A = 10
4 5 EFFECT OF COMPRESSION, r
FIGURE 2 Plot of R<t> (minimum) versus A and r.
CORRELATION WITH TEST RESULTS
Table 1 provides a summary of comparisons between the calculated and experimental ultimate torques for various published tests. The test results of fiber reinforced concrete beams having different aspect ratios and subjected to different combinations of loadings are compared with the proposed theory. In the computation, a factor of 0.885 was allowed for square sections as suggested by Hsu (10). The average value of experimental torque/calculated torque for 85 beams was estimated to be 0.989 with a standard deviation of 16.7 percent.
CONCLUSIONS
• The addition of fibers into plain concrete beams increases the tensile strength and post-cracking ductility of concrete.
• A method of analysis based on the skew bending approach is presented for analyzing fiber reinforced concrete beams subjected to combined axial compression, bending moment, and torsion. The method is used for the correlation of the published test results of 85 beams. The proposed method gives a reasonable prediction of the ultimate torque.
DESIGN EXAMPLE
The following example is included to show the use of the proposed method.
A fiber reinforced concrete column of a car park has a cross section of 300 mm x 300 mm. The member is subjected to a combined loading: axial load P = 150 kN, bending moment Mx = 23 kNm, and torsional moment M, = 30 kNm. The column is reinforced with steel fibers so that the modulus of
Sharma 97
TABLE 1 SUMMARY OF COMPARISONS BETWEEN THE CALCULATED AND EXPERIMENTAL VALUES OF ULTIMATE TORQUE FOR FIBER REINFORCED CONCRETE BEAMS
Group Ratio of Ultimate Torques (Experimental/Calculated)
No. of Standard Test Reported by Tests Mean Deviation
Pure torsion Mansur and Paramasivam (8) 18 1.069 0.088
Craig et al (2) 8 1.017 0.157
Narayanan and Kareem-Palanjian (9) 26 0.812 0.74
Bending and torsion Mansur (4) 21 1.101 0.1036
Mansur and Paramasivam (6) 6 1.223 0.128
Compression Narayanan and Kareem-Palanjian (7) 6 0.918 0.079
Total
rupture of fibrous concrete is 6N/mm2 . The strength of the section is to be checked:
and
p
bh
r = po kf,r
Mode 1
150 x 103
(300)2
1.666 0.71 x 6
Using Equation 4
1.666
0.39 = 0.4
M,0 = ~ b2h kf,1
1 - x (300)3 x 0.71 x 6 3
= 51.12 kNm
Using Figure 2, with A = 0, r = 0.4 and Rq, Therefore, torsional strength (in Mode 1) is
M, = 51.12 x 1.23 = 62.9 kNm
Mode 2
Using Equation 9
Mzo = ~ bh2 kf,1
1 - x (300)3 x 0.71 x 6 3
and
51.12 kNm
Mx M,
23 30
0.77
1.23.
85 0.989 0.167
Using Figure 2, with A = 0.77, r = 0.4 and R4
Therefore, torsion strength (in Mode 2) is
M, = 0.65 x 51.12 = 33.2 kNm
0.65 .
Hence, Mode 2 governs failure. The torsional strength of the member is 33.2 kNm, against an applied torsional moment of 30 kNm. Therefore, the section provided is adequate.
REFERENCES
1. R. Narayanan and A. S. Kareem-Palanjian. Effect of Fiber Addition on Concrete Strength. Indian Concrete Journal, Vol. 58, No. 4, April 1984, pp. 100-103.
2. R. J. Craig, A . J. Parr, E. Germain, V. Mosquera, and S. Kamilares. Fiber Reinforced Beams in Torsion. ACJ Jorunal, Vol. 83, No. 6, Nov.-Dec., 1986, pp. 934-942.
3. V. Ramakrishnan , G. Oberling, and P. Tatnall. Flexural Fatigue Strength of Steel Fiber Reinforced Concrete. In Report SP-105: Fiber Reinforced Concrete-International Symposium, American Concrete Institute, Detroit, Mich., 1987, pp. 225-246.
4. M.A. Mansur. Bending-Torsion Interaction for Concrete Beams Reinforced with Steel Fibres. Magazine of Concrete Research, Vol. 34, No . 121, Dec. 1982, pp. 182-190.
5. R. Narayanan and Z. Toorani-Goloosalar. Fiber Reinforced Concrete in Pure Torsion and in Combined Bending and Torsion. Proc., Institute of Civil Engineers, London, Part 2, Vol. 67, 1979, pp. 987-1001.
6. M.A. Mansur and P. Paramasivam. Fiber Reinforced Concrete Beams in Torsion, Bending and Shear. ACJ Journal, Vol. 82, No. 1, Jan .-Feb. 1985, pp. 33-39.
7. R. Narayanan and A. S. Kareem-Palanjian. Torsion, Bending and Shear in Prestressed Concrete Beams Containing Steel Fibers. AC/ Journal, Vol. 83, No. 3, May-June 1986, pp. 423-431.
8. M.A. Mansur and R. Paramasivam. Steel Fibre Reinforced Concrete Beams in Pure Torsion. The International Journal of Cement Composites and Lightweight Concrete, Vol. 4, No. 1, Feb. 1982, pp. 39-45.
9. R. Narayanan and A. S. Kareem-Palanjian. Steel Fibre Concrete Beams in Torsion. The International Journal of Cement Composites and Lightweight Concrete, Vol. 5, No. 4, Nov. 1983, pp. 235-246.
10. T. T. C. Hsu . Torsion of Structural Concrete-Plain Concrete Rectangular Sections. In Report SP-18: Torsion of Structural Concrete , American Concrete Institute, Detroit , Mich., 1968, pp. 203-238 .
11. A. K. Sharma. Design of Reinforced Concrete Rectangular Members Under Axial Compression, Bending and Torsion. Proc., Institute of Civil Engineers, London, Part 2, Vol. 69, 1980, pp. 911-919.
98 TRANSPORTATION RESEARCH RECORD 1226
Study of the Mix Proportion of the No Slump Concrete Melt-Extracted Carbon Steel Fiber
CHENGMOU FAN AND LIYING ZHU
This paper introduces an investigation of the mix proportion of melt-extracted carbon steel fiber reinforced no slump concrete. The optimum sand ratio, water content, and cement content, which are relevant to the fiber volume, were determined by a series of tests. Based on this investigation, a formula was derived for calculating the consistency. This formula is useful for such applications as the pavement of roads.
During the past 10 years, steel fiber reinforced concrete (SFRC) has been studied and used in China in a variety of demonstration projects. However, it has not become widely used due to the high cost of drawn wire fiber and slitting sheet fiber.
In 1986, melt-extracted carbon steel fiber was manufactured in Qing An Steel and Iron Works of the Heilongjiang Province at a cost that was about two times cheaper than that of drawn wire and slitting sheet fiber in China. The chemical composition and tensile strength of the melt-extracted carbon steel fiber are listed in Table 1, and the specifications of the fiber are listed in Table 2.
To evaluate the reinforcing effect of melt-extracted carbon steel fiber, a series of experimental investigations was conducted. Results of the compressive strength test (Figure 1) and the shear strength test (Figure 2) show that the reinforcing effect of the melt-extracted carbon steel fiber and the slitting sheet steel fiber is almost the same. The flexural strength (Figure 3) and toughness of the melt-extracted SFRC (Figure 4) also increases significantly with the increment of the fiber volume fraction. Thus, it can be concluded that melt-extracted carbon steel fiber can be used for reinforcing concrete instead of the more expensive types of steel fiber (1-6).
Compared with other types of fiber that have an equivalent diameter, melt-extracted steel fiber with the crescent moon shaped cross section apparently increases the concrete's bond strength because of the fiber's rough surface and larger surface area. The effect on bond strength caused by the ratio of steel fiber surface area to volume is even more significant, and the increment of internal friction of the mix leads to a gradual decrease in flowability. Therefore, the mix proportion of melt· extracted steel fiber reinforced concrete is different from that of concrete reinforced by other types of steel fiber. This study emphasized the influence of fiber volume, sand ratio, water content, and cement content on the flowability of melt-extracted steel fiber reinforced concrete. Since extensive investigations
Harbin Architectural and Civil Engineering Institute, Harbin, the People's Republic of China.
have been conducted regarding the effect of aggregate size on the distribution of steel fiber and the flowability in other types of SFRC, the maximum aggregate size was limited to 20 mm in this study (7). This investigation was conducted using steel fiber reinforced no slump concrete.
MATERIALS
The steel fiber used in this study was of the 102-2 type, manufactured in Qing An Steel and Iron Works, with a crosssectional property of 0.2 mm x 2.0 mm, an equivalent diameter of 0. 7 mm, and a length of 35 mm. Two kinds of ordinary portland cement (with a 28-day compressive strength of 42.5 MPa and 52.5 MPa, respectively) were used. The coarse aggregates were continually graded crushed stones with a maximum size of 20 mm, a bulk volume density of 1430 kg/ m3, and an apparent gravity of 2. 76. The gradation curve is shown in Figure 5.
The fine aggregates were medium size sand with a fineness modulus of 2.63. Their bulk volume density, apparent gravity, and clay content were 1590 kg/m3 , 2.50, and 1.5 percent, respectively. The screen curve is shown in Figure 6.
FIBER VOLUME
The mix proportion of SFRC is different from that of plain concrete when adding a large amount of slender fibers. Therefore, the influence of fiber volume on the flowability of concrete needed to be determined before any work could be done. A total of four groups of specimens were made with a cement content of 350 kg/m3
, a water content of 180 kg/m3 ,
and a sand ratio of 45 percent. The fiber volumes were 0, 0.5, 1.0, and 1.5 percent, respectively. The test results were measured by a Vebe consistency meter and are listed in Table 3.
The relationship between fiber volume (V1) and consistency (VB) can be expressed by the following regression equation:
VB = eL96+vr (1)
It can be seen from the test data, and the curves shown in Figure 7, that the flow ability decreases exponentially as the fiber volume increases. When the fiber volume is 1.5 percent, the vebe time is as much as 32 sec, which deviates greatly from 10 sec (the time considered suitable for the flowability

! 30 u .....
TABLE 1 CHEMICAL COMPOSITIONS OF MELT-EXTRACTED CARBON STEEL FIBER
Tensile
Chemical Compositions Strength
(Mp a)
c I Si I Mn I s I P > 380
0.25-0.35 j 0.20 I o.9-1 . 1 I< o.o~.;; o.o ~
TABLE 2 SPECIFICATIONS OF MELT-EXTRACTED STEEL FIBER
Cross
Approximate
Type of
Steel
16Mn
Specificati o11 Sectior1 Equivalent Cross \
Sectio9Lengtt Configuratior: Standard
Area Diameter Size (mm) and Shape Type
(mm') (mm) (mm)
0.5x25 0 . 2 0. 5 0. 2x1 . O 25 FS 111
0.5x30 0 . 2 0.5 0. 2x1 . 0 30 FS
0.6x30 0.3 0.6 0. 2x1 . 5 35 FS 211
0.6x45 0.3 0.6 O. 2x1 . 5 45 FS
0.6x45T 0 . 3 0.6 0. 2x1. 5 45 EL
0.7x45 0 . 4 0.7 0.2x2.0 45 FS 311
0.7x45T 0.4 0.7 10. 2x2. 0 45 EL I 0.7x60 0 . 4 I 0.7 0.2x2.0 60 FS
Note: FS---Flat-straight shape.
EL---Ends-enlarged shape.
111---To be used for SF shotcrete.
211, 311---To be used for castable SF concrete.
! 8 . 0
25 _ ...... - - _ specimen ---- ----- _,,,,,. ------.... 7. 0
20
1 5
0.0
....._ 150x150x300mm - . -- specimen ----The M-E steel fiber -....._
----The deformed steel fiber
0.5 1 • 0 1. 5 2.0
V,(%)
FIGURE 1 Relationship between flber volume and the compressive strength of SFRC.
6.0
5.0
0
•The M-E steel fiber
OThe deformed steel fiber
0.5 1 • 0 1. 5 2. 0
V,(%)
FIGURE 2 Relationship between fiber volume and the shear strength of SFRC.

u.J
~ 60 ~ .J ::::>
~ u 80
~
0
9.0
j 6 u.J
8.0 0: :i .... ~ :i ~
I.I.. 7.0 0
"' :i .J ;J 6 . 0 § ~
/ - / ~
5.0
0
.,,,,,.--~"" .,,,,,.,,,,,
/•
I 0.5 1 • 0
./ //
I 1 • 5
V,(%)
/.r
FIGURE 3 Relationship between fiber volume and the modulus of rupture of SFRC .
...... 30
~ g 20
1 0
0 0.5 1. 0 1 • 5
DEFLECTION cS (mm)
FIGURE 4 Typical load-deformation curve from the flexural test.
0 ~ u:r :i Cl
20
~ 0: z 40 u.J u.J ~
~ u.J 60 ::> j:: <( .J :i ~ 80 ::::>
8 <
100
5 1 0 1 5
2.0
2. 0
AGGREGATE SIZES(MM)
FIGURE 5 Grading curve of stones.
0.16 0.315 0.65 1.25 2.5
SCREEN OPENING SIZES(MM)
FIGURE 6 Grading curve of 1# sand.
5

Fan and Zhu
TABLE 3 INFLUENCE OF FIBER VOLUME ON FLOWABILITY
Fiber Volume(%) 0
V-B Time(S) 10.0
A
B
0.5 1. 0 1. 5
11 . 4 16.6 32.0
A:The curve when sand ratio s.=0.45 remains constant;
B:The curve obtained from the optimum sand ratio;
C:The curve obtained from the : optimum sand ratio and
c the optimum water content;
0 0.5 1 . 0 1 . 5 2.0
FIBER VOLUME(%)
FIGURE 7 Relationship between fiber volume and consistency.
of no slump concrete). Thus, assuming the needed flexural strength, toughness, and cracking resistance are satisfied, it is critical to determine the optimum sand ratio and water content for a specific fiber volume so the flowability of SFRC will conform to that used in construction sites.
SAND RATIO
Two reasons support the data shown in Figure 8. (a) As the amount of added steel fiber increases, the cement mortar becomes insufficient to fill the space between steel fibers, and this leads to a decrease in flowability; and (b) The water content is less than the corresponding amount of steel fiber used; this problem will be discussed later.
Although steel fiber can be regarded as a type of aggregate, the sand ratio is still defined as a percentage of the amount of sand and stone. It was necessary to study whether or not an optimum sand ratio exists for SFRC with various fiber volume. Four groups of specimens were therefore prepared with different sand ratios to determine the flowability. In all SFRC specimens, the cement content remained 350 kg/m3,
40
30
20
10
0
0.2 0.3 0.4 0.5 0.6
SAND RATIO
FIGURE 8 Optimum sand ratios for various fiber volumes.
101

102
while the water content remained 180 kg/m3• The test values
of SFRC consistency of different mix proportions are listed in Table 4. Figure 8 illustrates the relationship between the sand ratio and the flowability for a given fiber volume. As shown in the figure, for every fiber volume where the optimum sand ratio exists, the sand ratio increases with the increment of fiber volume. This relationship can be expressed in the following optimum sand ratio formula:
(2)
where S~ refers to the sand ratio of plain concrete, which is 0.35.
The relationship between fiber volume and consistency at the optimum sand ratio is shown in the following regression equation:
(3)
Equations 1, 2, and 3 result in the following:
VB = e 1. 94 +0.s 4 v1 (4)
Substituting the fiber volume value with its corresponding optimum sand ratio in Equation 4 yields the calculated consistency, which is also listed in Table 4. The calculated values
TRANSPORTATION RESEARCH RECORD 1226
are similar to the test data, indicating that Equation 4 more accurately describes the relationship between fiber volume and consistency at tlie optimum sand ratio (see curve B in Figure 7.) By comparing curve A and curve B, it can be concluded that flowability increases when the sand ratio corresponds with the fiber volume. Flowability is not affected because water content is not relevant to fiber volume.
WATER CONTENT
To find the optimum water content corresponding to the fiber volume and sand ratio, four groups of specimens were prepared with different water content, which increased with the increment of fiber volume and sand ratio to determine the flowability. The cement content remained at 350 kg/m3
• The test results are listed in Table 5. The optimum water content, which is relevant to the consistency index VB = 10 sec, can be expressed by the following equation:
(5)
where W0
is the optimum water content of the plain concrete, which is 170 kg/m3
•
The relationship between the consistency, fiber volume,
TABLE 4 INFLUENCE OF SAND RATIO ON THE FLOWABILITY OF SFRC WITH DIFFERENT FIBER VOLUMES
Fiber Volume(%) 0 o.s 1. 0 1 . s
Sand Ratio(%) 30 I 3s I 40 I 4s 30 I 40 I 4s I 50 40 I 45 I 50 I 60 45 I so I 60
V-B Time(s) 1 1 • 11 7 . 11 6 . 411 0 . 0 a . 61 a. s111 . 4]11 . a 1 7 . 011 6 . 6j1 9 . * 3 . 0 3 2 . 012 s . 614 2 . 2
Optimum Sand 35 40 45 50
Ratio(%)
V-B Time (s)
Computed from 7. 0 1 0. 6 16.1 24.S
Equation (3)
TABLE 5 INFLUENCE OF WATER CONTENT ON FLOWABILITY
Fiber Volume(%) 0 0.5 1 . 0 1 . 5
Sand Ratio(%) 3S 40 4S 50
Water Content(kg/m') 1 60 1 6S 1 7S 1 6S 1 7 s 1 BS 1 6S 1 BS 1 9S 1 7S 1 BS 1 9 s
Water-Cement 46 47 so 47 so S3 47 53 56 so S3 56
Ratio(%)
V-B Time(S) 1 5. 4 9. 4 9. 2 21 . 0 1 2. 6 7. 4 30.4 13.6 8. 6 35.4 25.0 13.0
V-B Time(S)
Computed from 1 4. 9 11 . 6 7. 0 20.1 1 2. 2 7.4 3 4. E 12.8 7. 8 36.6 22.2 1 3. s
Equation (7)
The Optimum Water 170 1BO 190 200
Content(kg/m')
V-B Time(S)
Computed from 9.0 9. 5 10.0 1 0. s
Equation (B)

Fan and Zhu 103
~ >- 40 L-u z uJ t--'f)
ti) 30 z 8 uJ 20 ffi >
1 0
o.._~~---~~..._~~...._~~ ....... ~~ ........ ~~ ........ ~~~~ 150 1 60 1 70 1 80 190 200 210
WATER CONTENT(KG/M')
FIGURE 9 Relationship between water content and consistency.
TABLE 6 INFLUENCE OF CEMENT CONTENT ON FLOW ABILITY
Cement Content 31 7 345 380
(kg/m')
396
V-B Time(s) 10.4 8. 8 10.6 15.0
sand ratio, and water content is expressed by the following formula:
VB = e9.os+vr1.6sP-o.031rw-1 .3s(w-W')J ( 6)
where W' is the water content actually used. When the optimum water content is used, i.e., W' W,
Equation 6 becomes
(7)
Substituting Equations 2 and 5 into Equation 7 results in
VB = ez.2+0.1v1 (8)
Using Equation 6, the calculated values of the consistency were obtained and listed in Table 5. Four curves of the relationship between consistency and water content under different fiber volumes are illustrated in Figure 9. Obviously, Equation 6 accurately describes the relationship between consistency and water content.
The values of consistency corresponding to the optimum water content computed from Equation 8 are also listed in Table 5. Curve C in Figure 7 demonstrates this relationship. It can be concluded that, when both the sand ratio and water content correspond with the fiber volume used, the consistency of SFRC can be controlled at about 10 sec.
CEMENT CONTENT
In the previous discussion, the cement content was chosen. as a constant value for the analysis of the sand ratio and water
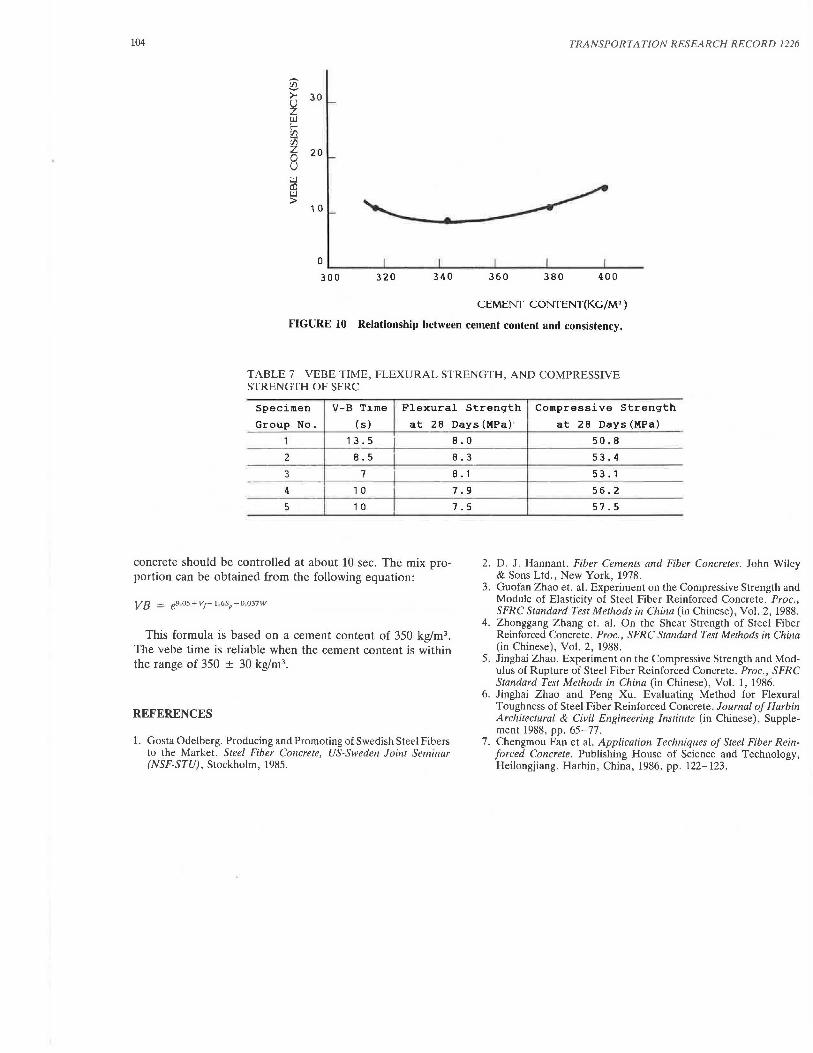
content. In this section, the influence of the cement content on the flowability of SFRC is explored. For the SFRC with a fiber volume of 1.0 percent, four quantities of cement were used on the basis of the optimum sand ratio and water content determined previously. The values of consistency are listed in Table 6, and Figure 10 illustrates the relationship between cement content and consistency. The figure shows that flowability is affected less when the cement content is within the range of 350 ± 30 kg/m3 ; however, flow ability decreases slightly when the cement content approaches 400 kg/m3
•
The test results show that the consistency remains constant if the cement content changes within a specific range and the water content is fixed. This special feature will be beneficial to the adjustment of cement content while satisfying the flowability requirement to meet the strength demands for SFRC.
TEST FOR INSPECTION
This paper has proposed some parameters concerning the needed flowability of SFRC used in pavement construction. To check these parameters, five groups of specimens were prepared.
Ordinary cement (with a 28-day compressive strength of 52.5 MPa) was used with a content of 350 kg/m3 and a fiber volume of 1 percent. The optimum sand ratio and water content were 0.45 and 190 kg/m3
, respectively. In each group, there were three 100 mm x 100 mm x 400 mm flexural specimens and three standard compressive specimens. A flexural test was conducted with the loading on the central point of the specimen, and the results are listed in Table 7. This indicates that the vebe time of the specimen is about 10 ± 3 sec-3 sec away from the design requirement with which the engineering practical serviceability can be satisfied. The mean value of flexural strength is 8 MPa.
CONCLUSIONS
To meet the requirements of pavement and other engineering construction, the consistency of steel fiber reinforced no slump
104 TRANSPORTATION RESEARCH RECORD 1226
~
'./l )::' 30
~ u.J l-'./l ii) z 20
8 u.J cO u.J >
1 0
0 --~~~-'-~~~--"~~~~.._~~~.._~~~ ........ ~~~
300 320 340 360 380 400
CEMENT CONTENT(KG/M')
FIGURE 10 Relationship between cement content and consistency.
TABLE 7 VEBE TIME, FLEXURAL STRENGTH, AND COMPRESSIVE STRENGTH OF SFRC
Specimen V-B Time Flexural Strength Compressive Strength
Group No. (s) at 28
1 13.5 I 2 8. 5
3 7
4 1 0
5 1 0
concrete should be controlled at about 10 sec. The mix pro· portion can be obtained from the following equation:
VB = e9 os+ v1-1.6sp-o.031w
This formula is based on a cement content of 350 kg/m3 •
The vebe time is reliable when the cement content is within the range of 350 ± 30 kg/m3
•
REFERENCES
1. Gosta Odelberg. Producing and Promoting of Swedish Steel Fibers to the Market. Steel Fiber Concrete, US-Sweden Joint Seminar (NSF-STU), Stockholm, 1985.
Days (MPa)· at 28 Days (MPa)
8.0
8.3
B. 1
7.9
7. 5
50.8
53.4
53 .1
56.2
57.5
2. D. 1. Hannan!. Fiber Cements and Fiber Concretes. John Wiley & Sons Ltd., New York, 1978.
3. Guofan Zhao et. al. Experiment on the Compressive Strength and Module of Elasticity of Steel Fiber Reinforced Concrete. Proc., SFRC Standard Test Methods in China (in Chinese), Vol. 2, 1988.
4. Zhonggang Zhang et. al. On the Shear Strength of Steel Fiber Reinforced Concrete. Proc., SFRC Standard Test Methods in China (in Chinese), Vol. 2, 1988.
5. Jinghai Zhao. Experiment on the Compressive Strength and Mod· ulus of Rupture of Steel Fiber Reinforced Concrete. Proc., SFRC Standard Test Methods in China (in Chinese), Vol. 1, 1986.
6. Jinghai Zhao and Peng Xu. Evaluating Method for Flexural Toughness of Steel Fiber Reinforced Concrete. Journal of Harbin Architectural & Civil Engineering Institute (in Chinese), Supple· ment 1988, pp. 65-77.
7. Chengmou Fan et al. Application Techniques of Steel Fiber Rein· forced Concrete. Publishing House of Science and Technology, Heilongjiang, Harbin, China, 1986, pp. 122-123.