analysis of enzymes involved in starch phosphate metabolism
TRANSCRIPT

Analysis of enzymes involved in Starch
Phosphate Metabolism
by
Mugammad Ebrahim Samodien
Thesis submitted in partial fulfilment of the academic requirements for the degree
Master of Science
at the Institute for Plant Biotechnology, Stellenbosch University
Supervisor: Dr. J.R. Lloyd
Co-supervisor: Prof. J.M. Kossmann
December 2009

ii
Declaration
The experimental work in this thesis was supervised by Dr. J.R. Lloyd and was conducted
in the Institute for Plant Biotechnology, at Stellenbosch University, South Africa. The
results presented are original, and have not been submitted in any form to another
university.
I, the undersigned, hereby declare that the work contained in this thesis is my own
original work and has not previously in its entirety or in parts been submitted at any other
university for a degree
Signed: ………………. Date: ……………….

iii
Abstract
This project examined the role of proteins in starch phosphate metabolism. The first part
was aimed at the functional characterization of the SEX4, LSF1 and LSF2 genes in both
plants and bacteria. Constructs were produced to allow for expression of the three
proteins in E. coli with the SEX4 and LSF2 proteins being successfully purified and used
to produce antibodies. Immunoblot analysis indicated that the antibodies recognised the
repective proteins in extracts, but it was not clear if they actually recognised the proteins
or the GST tags they were fused to.
Virus induced gene silencing constructs were also produced to allow repression of
these three genes in Nicotiana benthamiana. This resulted in a starch excess phenotype
being observed in the leaves of silenced plants which is consistent with the known or
presumed roles for the genes. The antibodies produced were not specific enough to
confirm that the respective protein were actually repressed, but it is likely that this was
the case as plants infiltrated at the same time with a VIGS vector designed to repress
phytoene desaturase exhibited a chlorophyll bleaching phenotype. These data confirm
that SEX4 and LSF1 probable play the same role in N. benthamiana as in Arabidopsis,
and provide evidence that LSF2 is also necessary for starch degradation.
It was also attempted to characterise these proteins with respect to their substrate
utilization by setting up a glyco-array experiment. Various potato starches from
genetically modified plants were subjected to hydrolytic attack by starch degrading
enzymes and fractionated by anion exchange chromatography to produce a multitude of
glucans. These will be spotted onto glass filters and probed with the purified proteins to
see if they bind to specific starch breakdown products preferentially.

iv
The project also involved investigating the effect the SEX4 protein has on E. coli
glycogen contents. SEX4 was expressed in wild type and glgX mutant E. coli strains as it
has been shown that this stops glycogen accumulation in the wild type, but not the glgX
mutant. The cells were grown in liquid culture and glycogen contents measured. In liquid
cultures SEX4 had no effect on glycogen contents in the wild type, possible because of
problems with plasmid stability in the strain used.
This final part of the project investigated the effect that a gwd mutation has on
carbohydrate metabolism in leaves and fruits of the Micro-tom tomato cultivar. Starch
and soluble sugar contents were measured in leaves and ripening fruits. A starch excess
phenotype was found in the leaves, but no change in starch contents was determined in
either the placenta or pericarp of the fruit. Soluble sugar contents were reduced in the
fruit tissues, although the reason for this in unclear.

v
Opsomming
Hierdie projek het die rol van proteine in stysel-fosfaat metabolisme ondersoek. Die
eerste deel handel oor die funksionele karaktiseering van die SEX4, LSF1 en LSF2 gene
in beide plante en bakteriee. Vektore is gekonstrueer om die uitdrukking van die drie
proteine in E.coli toe te laat terwyl die SEX4 en LSF2 proteine suksesvol gesuiwer is vir
die gebruik vir teenliggaam produksie. Immunoklad analises het getoon dat die
teenligame die spesifieke proteine in die ekstrak herken het, maar dit was nie duidelik of
dit die onderskeie proteine was of die GST-verklikker waaraan die onderskeie proteine
verbind was nie.
Virus geindiseerde geen onderdrukking konstrukte is ook geproduseer om toe te
laat vir die onderdrukking van hierdie drie gene in Nicotiana benthamiana. Dit het ‘n
stysel oorskot fenotipe tot gevolg gehad in die blare van onderdrukte plante wat konstant
is met die bekende of voorgestelde rolle van die gene. Die teenliggame wat geproduseer
is was nie spesifiek genoeg om te bewys dat die onderskeie proteine wel onderdrukis nie.
Dit kon wel die geval gewees het want plante geinfiltreer op dieselfde tyd met ‘n VIGS
vektor wat ontwerp is om phytoene desaturase te onderdruk het ‘n chlorofil bleikings
fenotipe getoon. Hierdie data bevestig dus dat SEX4 en LSF1 moontlik dieselfde rol
speel in N. benthamiana as in Arabidopsis, en toon bewyse dat LSF2 ook nodig is vir
stysel afbreek.
Karakterisasie van die onderskeie proteine met respek tot hul substraat gebruik is
ondersoek deur ‘n gliko-array eksperiment. Verskillende aartappel stysels van genetiese
gemodifiseerde plante was geonderwerp aan hydrolitiese afbreek deur stysel afbrekende
ensieme en geskei deur anioon uitruilings chromotografie om veelvuldige glukans te

vi
vervaardig. Dit is geplaas op glas filters en is ondersoek saam met die gesuiwerde
proteine om te sien of dit mag bind aan spesifieke stysel afbreek produkte.
‘n Verdere ondersoek is onderneem na die effek van die SEX4 protein op E. coli
glikogeen inhoud. SEX4 was uitgedruk in die E .coli wildetipe en glgX mutant omdat
dit reeds bewys is dat SEX4 glikogeen ophoping veroorsaak in die wildetipe maar nie in
die glgX mutant. Die selle is opgegroei in vloeibare media en glikogeen inhoud is gemeet.
In vloeibare media het SEX4 geen effek op die wildetipe se glikogeen inhoud nie wat
moontlik kan wees as gevolg van plasmied stabiliteit in die E. coli ras wat gebruik is.
Die finale deel van die projek was om die effek van ‘n gwd mutasie op koolhidraat
metabolisme in blare en vrugte van die Micro-tom tamatie kultivar te ondersoek. Stysel
en oplosbare suikers is gemeet in blare en rypwordende vrugte. ‘n Oortollige stysel
fenotipe is in die blare gevind maar geen verandering in stysel inhoud is waargeneem in
die plasenta of perikarp van die vrug nie. Oplosbare suiker inhoud het afgeneem in die
vrugweefsel dog is die rede hiervoor nie te verstane.

vii
Acknowledgments I would like to thank Prof Jens Kossmann and Dr James Lloyd for providing me with the
opportunity to conduct this research under their supervision at the Institute for Plant
Biotechnology.
Thanks go to the students and staff of the IPB for their friendship, continued support and
encouragement. Special thanks go to Gavin George and Dr Jan Bekker.
The Financial Support from the National Research Foundation (NRF) as well as the
Institute for Plant Biotechnology made this research possible.
To my family and friends, especially Farida Allie, whose love and support has seen me
through some trying times, Thank you!
I would also like to say a special thanks to my parents Ridwan and Shereen Samodien.
Thanks for all the continued support and conditional love over the years. I love you both
very much and this thesis is dedicated to you.
viii
List of Contents
Abstract iii
Opsomming
Acknowledgements
v
vii
List of Contents viii
List of Tables and Figures xiii
List of Abbreviations xv
Chapter 1: Literature Overview
1.1 The importance of starch 2
1.2 Starch structure 2
1.3 Starch metabolism 5
1.3.1 Starch degradation 6
1.3.2 The incorporation of starch phosphate and its importance in influencing starch
degradation
8
1.3.3 Removal of starch phosphate 10
1.4 Glyco-Array Technology 12
1.5 Virus Induced Gene Silencing 13
1.6 Fruit metabolism 16
1.7 Aim of the project 18

ix
CHAPTER 2: Protein Expression and Purification
2.1 Introduction 20
2.2 Materials and Methods 20
2.2.1 Primers
2.2.2. Protein Expression 24
2.3 Protein Purification
2.4 Immunoblot Analysis 25
2.5 Results and Discussion 26
2.5.1 Construct Production 26
2.5.2 Protein Expression 27
2.5.3 Protein Purification 29
2.5.4 Immunoblot Analysis 31
CHAPTER 3: Production of starch breakdown products for use in glyco-
arrays
33
3.1 Introduction 34
3.2 Materials and Methods 35
3.2.1 Analysis of Starches used in the Study 35
3.2.2 Determination of the glucose 6-phosphate content of the starches 35
3.2.3 Isolation of amylopectin using thymol 35
3.2.4 Anion Exchange Chromatography 36

x
3.3 Results and Discussion 37
3.3.1 Glucose-6-Phosphate Determination 38
3.3.2 Qualitative Glucan Concentration Determination 39
CHAPTER 4: Examination of the roles of the SEX4 and LSF proteins in
Nicotiana benthamiana leaf starch degradation using virus induced gene
silencing
41
4.1 Introduction 42
4.2 Materials and Methods 43
4.2.1 Construct Production 43
4.2.2 Plant Preparation 44
4.2.3 Agrobacterium transformation 45
4.2.4 Vacuum Infiltration 45
4.2.5 Determination of leaf starch content 46
4.2.6 Extraction of soluble protein from plant leaf material 46
4.2.7 Immunoblots 47
4.3. Results and Discussion: 47
4.3.1 Construct production 47
4.3.2 Virus Induced Gene Silencing 48
4.3.3 Analysis of SEX4, LSF1 and LSF2 protein levels using immunoblots 49
4.3.4 Starch contents of Nicotiana benthamiana leaves
52

xi
Chapter 5: The effect of expression of AtSEX4 on glycogen contents in E.coli 54
5.1 Introduction 55
5.2 Materials and Methods 57
5.2.1 strains 57
5.2.2 Growth of 57
5.3 Results and Discussion 59
5.3.1 E. coli Growth and Glycogen Determination
59
CHAPTER 6: Analysis of carbohydrate metabolism in fruit of a gwd tomato
mutant
62
6.1 Introduction 63
6.2 Material and Methods 64
6.2.1 Plant Growth 64
6.2.2 Chlorophyll fluorescence 64
6.2.3 Soluble sugar and starch measurements 65
6.3 Results and Discussion 66
6.3.1 Chlorophyll Fluorescence 67
6.3.2 Starch analysis in leaves 68
6.3.3 Starch and Soluble sugar analysis in developing fruits 69
6.3.4 Starch content in tomato fruit 70
6.3.5 Soluble sugar content in tomato fruit
71

xii
Chapter 7: Conclusion 75
Reference List 76

xiii
List of Figures and Tables
Figures
1.1. Overview of Starch granule at different organisational levels. 4
1.2. Branched nature of the starch molecule. 5
1.3. The proposed starch degradation pathway (Smith et al, 2005) 8
1.4. An overview of the silencing pathway and the various phases and enzymes
involved
16
2.2. Protein expression constructs a) SEX4, b) LSF1 and c) LSF2 in pGEX4T-1 23
2.3. 0.8% (w/v) agarose gel showing inserts present within the pGEX-4T-1 protein
expression vector.
26
2.4. 10% (w/v) SDS-PAGE 27
2.5. 10% (w/v) SDS-PAGE gel with purified fractions of a) SEX4 and b) LSF2
protein
29
2.6a-c. Immunoblot analysis of E. coli extracts tested against the a) SEX4, b) LSF1
and c) LSF2 antibody
31
3.2. Elution pattern of glucans from DEAE sepharose column. 39
4.1: 0.8% (w/v) agarose gel showing plasmid DNA of the VIGS constructs
following restriction
47
4.2. Photo bleaching of a tobacco plant that through silencing of the PDS gene. 48
4.3a- c. Immunoblot analysis of the a) Sex4 b) LSF2 and c) LSF1 silenced plants. 50
4.4. Starch contents in leaves of N. benthamiana plants infiltrated with A.
tumefaciens containing VIGS vectors.
52

xiv
5.2. Growth rate and glycogen contents of WT E .coli containing either the empty
pBluescriptSK+ plasmid or one allowing expression of the Arabidopsis SEX4
protein.
59
5.3. Growth rate and glycogen contents of glgx E. coli containing either the empty
pBluescriptSK+ plasmid or one allowing expression of the Arabidopsis SEX4
60
Tables
2.1. Primers designed for isolation of the respective genes. 22
3.1. Genetically modified potato lines from which the different starches were
derived.
37
5.1: Glycogen accumulation in WT and glgX mutant E. coli strains expressing
SEX4 compared to the empty vector control.
57

xv
List of Abbreviations
ATP Adenosine 5-tri-phosphate
BAM1-4 β-amylase 1-4
BCIP/NBT 5-Bromo-4-Chloro-3’- Indolyl Phosphate
p-Toluidine/ Nitro-Blue Tetrazolium Chloride
Bp Base pairs
CaCl Calcium chloride
cDNA Complementary deoxyribonucleic acid
CM Conditional mutant
CTAB Cetyltrimethylammonium bromide
CV Column volume
dsRNAs Double stranded Ribonucleic acids
DTT Dithiotreitol
E. coli Escherichia coli
EDTA Ethylenediaminetetraacetic acid
EST Expressed sequence tag
ETOH Ethanol
FMS2 Fluorescence monitoring system
FPLC Fast protein liquid chromatography
FW Fresh weight
g Gram
gDNA Genomic DNA

xvi
GWD Glucan, water dikinase
GST Glutathione S Transferase
Hrs Hours
IPTG Isopropyl ß-D-thiogalactopyranoside
ISA1-3 Isoamylase 1-3
KCl Potassium chloride
kDa Kilodalton
KOH Potassium hydroxide
kPa Kilopascal
L Litre
LDA Limit dextrinase
LiCl Lithium chloride
LSF1 Like sex four 1
LSF2 Like sex four 2
PCR Polymerase chain reaction
PWD Phosphoglucan, water dikinase
M Molar
MgCl2 Magnesium chloride
mg Milligram
Min Minutes
Ml Millilitre
mM millimolar

xvii
MOPS-KOH 3-(N-morpholino)propanesulfonic acid- potassium
hydroxide
MS Mass spectroscopy
NaCl Sodium chloride
NAD+ Nicotinamide adenine dinucleotide
Nm Wavelength
OD Optical density
PDS Phytoene desaturase
pH Acidity/alkalinity
PSII Photo-system II
SDS Sodium dodecyl sulfate
SEX4 Starch excess four
siRNA Small interfering ribonucleic acids
SSIII Starch synthase III
SuSy Sucrose synthase
RNAi Ribonucleic acid interference
Tris-HCl Tris(Hydroxymethyl)-aminomethane
TRV1-2 Tobacco rattle virus 1-2
U Units
(v/v) (Volume/volume)
VIGS Virus-Induced Gene Silencing
(w/v) (Weight/volume)
WT Wild type

1
Chapter 1
Literature Overview

2
1. Literature Overview
1.1 The importance of starch
Starch is the main storage carbohydrate of most plants. In leaves it is a product of
photosynthesis in chloroplasts, accumulating during the day and being degraded at night
to form sucrose. This is exported to storage organs, such as tubers and seeds, where it is
re-synthesized to starch which accumulates as a long-term carbon store. This conversion
of starch to sucrose in leaves is regarded as one of the largest carbon fluxes, which occurs
daily on the planet (Niittyla et al, 2006). Starch is also a renewable resource that is being
used in many industrial applications (Kossmann and Lloyd, 2000) and because of its role
both in industry and as a plant storage product it is arguably one of the most important
carbohydrates in plants (Zeeman et al, 2007).
1.2 Starch structure
Much work has been done over the past decades to examine the structure of starch
granules. Starch consists of two glucose polymers amylose and amylopectin, where
amylose is an essentially unbranched α1,4-polyglucan while amylopectin contains both
α1,4 bonds and α1,6 branch points. The chains within amylopectin are arranged in an
ordered manner probably according to the ‘cluster’ model (Hizukuri, 1970) where short
chains cluster together in ordered arrays of densely packed double helices and the clusters
are linked by longer chains. This structured formation of chains within the amylopectin
molecule means that it is semi-crystalline and, as amylopectin makes up 70-90% of
starch, it means that the starch is also semi-crystalline. Small angle X-ray scattering has

3
demonstrated that there is a 9nm repeat structure in all tested starches, composed of
crystalline and amorphous layers (Waigh et al, 1998). This is thought to contain one layer
of double helical clusters forming the crystalline layer interspersed with amorphous
amylose. Different starch granules also show different types of crystallinity based on
different arrangements of the double helices. Cereal seed starches for example contain
what is known as the A type allomorph, while potato tuber starch contains the B type
(Gallant et al, 1997; Gerard et al, 2001). The difference between the two is that the A
type is more compact, than the B type (Hejazi et al, 2008).
Starch granules also often contain ‘growth rings’ which were once considered to
be produced during the day night cycle, however most recent evidence indicates that this
is not the case (Pilling and Smith, 2003). A circadian rhythm could bring about growth
ring formation through periodic changes in the activities of isoforms of starch synthases.
However the study of Pilling et al (2003) concluded that circadian rhythms, physical
mechanisms, and perhaps diurnal rhythms could all be contributing factors which control
growth ring formation in starch granules of potato tubers, and the data produced during
that study suggest that a complex interplay exists between several of these factors.

4
Figure 1.1: Overview of Starch granule at different organisational levels. It shows how the various
compartments are arranged in a very structured manner which makes up the starch granule (Gallant et, al
1997).

5
Figure 1.2: Branched nature of the starch molecule. Reproduced from
http://www.jic.ac.uk/STAFF/cliff-hedley/Starch.html
1.3 Starch metabolism
In recent years great insight has been gained into the pathways of starch synthesis
(Kossmann & Lloyd, 2000; Smith et al, 2003; Ball and Morell, 2003) as well as its
degradation (Zeeman et al, 2006, 2007, Lloyd et al., 2004) through the analysis of
transgenic plants and Arabidopsis mutants. In terms of synthesis a number of starch
synthase, starch branching and debranching enzyme isoforms have been studied and their
contributions to the synthesis of the starch molecule revealed. Many of the enzymes
involved in the degradation of starch have now also been examined with their functions
being elucidated. This project involves the examination of enzymes involved in adding
and removing phosphate groups from glucose residues within the amylopectin molecule,
especially in regard to their role in starch degradation. As such the roles of enzymes

6
involved in forming the starch molecule will not be further considered. The rest of this
section will be taken up considering the evidence for the roles of various enzymes
involved in degrading starch as well as in its phosphorylation.
1.3.1 Starch degradation
Many enzymes are known to be able to degrade starch in vitro, and recently it has
become clear which ones are responsible in vivo. Most recent work has examined leaf
starch degradation, and revealed some differences between this process in chloroplasts
and in storage organs. For example α-amylases, which cleave α-1,4 bonds within the
polyglucan, play an important role in the degradation of cereal endosperm starch (Smith
et al., 2005), however, this enzyme has been shown not to be essential for normal starch
breakdown in Arabidopsis leaves (Yu et al., 2005). In leaves it appears that β-amylase is
the main enzyme that degrades the linear chains within the starch molecule. β-amylases
are characterized as exoamylases which release maltose from non-reducing ends of
glucans or dextrins through hydrolysis of α-1,4 linkages. α-1,6 linkages are hydrolyzed
through the action of the debranching enzymes. The Arabidopsis genome contains nine
genes that code for putative β-amylase isoforms of which four (BAM1, -2, -3, and -4) are
chloroplastic (Fulton et al 2008). Several of these isoforms have been demonstrated to be
involved in starch degradation. In both potato and Arabidopsis plants in which the
plastidial β-AMYLASE3 (PCTBMY1; BAM3; BMY8) is repressed through transgenic
techniques, a starch excess phenotype in their leaves is observed (Scheidig et al., 2002;
Kaplan and Guy, 2005). In addition in Arabidopsis when the BAM1 isoform is mutated
no effect can be seen on starch degradation; however a bam1/bam3 double mutant

7
demonstrates a greater effect on starch degradation than the bam3 mutant exhibits on its
own, indicating some redundancy between these two isoforms (Fulton et al. 2008).
Finally a mutation in the BAM4 gene also leads to repression of starch degradation, even
though no catalytic activity from this isoform has been measured (Fulton et al., 2008).
The final group of enzymes involved in cleaving bonds between the glucan
monomers of the starch polymer are debranching enzymes which cleave the α-1,6
branchpoints. Higher plants contain four different debranching enzymes: three isoforms
of isoamylase (ISA1-3) and one limit dextrinase (LDA) (Lloyd et al., 2005; Burton et al,
2002; Bustos et al, 2004). It has been shown that the debranching enzyme ISA3 is
required for normal rates of starch breakdown in leaves from Arabidopsis (Wattebled et
al., 2005; Delatte et al., 2006) and potato (Hussain, 2002). ISA3 from either potato
(Hussain et al., 2003) or Arabidopsis (Delatte et al., 2006) displays high activity with β-
limit dextrins (glucans that are produced as a result of β-amylase activity during starch
breakdown) consistent with the proposed important role of β-amylase in leaf starch
degradation. Limit dextrinases are said to play a role in the degradation of starch in cereal
endosperm. Mutant lda plants have normal starch metabolism and the loss of LDA in the
isa3 background enhances the severity of the starch-excess phenotype, showing that LDA
contributes to starch degradation when ISA3 is missing (Delatte et al., 2006). Maize lda
mutants (zpu1) display slightly elevated starch levels in leaves and a reduced rate of
endosperm starch mobilization during seedling establishment (Dinges et al., 2003). These
results suggest that ISA3 and LDA function primarily in starch breakdown.
The ISA1 and ISA2 isoforms, however, appear to be involved in the synthesis
(Zeeman et al 1998; Bustos et al, 2003; Delatte et al 2005; Wattebled et al, 2008) rather

8
than the degradion of starch. Mutation in these genes not only causes the loss of
detectable isoamylase activity, but also leads to disruption of the normal starch structure
(Bustos et al, 2003; Delatte et al 2005; Wattebled et al, 2008)
Figure 1.3: The proposed starch degradation pathway (Smith et al, 2005)
1.3.2 The incorporation of phosphate into starch and its importance in influencing
starch degradation
It has become clear over the past decade that one important process in starch
degradation involves the incorporation and removal of phosphate that is covalently linked
to the glucose monomers within amylopectin. Phosphate is present on both the C6 and C3
positions of a small proportion the glucose monomers in starch depending on botanical

9
source (Hizukuri et al., 1970; Tabata et al, 1975; Baldwin et al, 1997; Jane et al, 1999;
Blennow et al 2000, 2002). Generally starches from tubers contain relatively high levels
of phosphate, while those isolated from leaves less so. Those from cereal seeds contain
almost no covalently bound phosphate. For many years the biochemical mechanism for
incorporation of starch phosphate was unknown, however it was recently demonstrated
that the reaction is catalyzed by the enzyme glucan water dikinase (GWD) (Ritte et al.,
2002, Mikkelsen et al, 2004). This enzyme takes ATP as the phosphate donor and
transfers the β-phosphate to amylopectin, releasing the γ-phosphate into solution. It was
originally thought that the GWD incorporated phosphate at both the C6 and C3 positions
(Ritte et al., 2002), however it was later demonstrated that it only incorporates phosphate
at the C6 position (Ritte et al. 2006) and that a second enzyme, the phosphoglucan water
dikinase (PWD) (Kötting et al 2005, Baunsgaard et al 2005, Ritte et al, 2006, Hejazi et al,
2009) catalyzes the incorporation of the C3 phosphate in an identical reaction. The PWD,
however, can only utilise glucan chains previously phosphorylated by the GWD as a
substrate (Kotting et al 2005, Hejazi et al, 2008, 2009).
Interestingly both the GWD and PWD are necessary for normal leaf starch
degradation in Arabidopsis (Lu et al, 2005; Kötting et al, 2005; Baunsgaard et al 2005),
and the GWD has also been demonstrated to be essential for starch degradation in leaves,
tubers and pollen from other species (Lorberth et al. 1998; Nashilevits et al, 2008). The
GWD phosphorylates starch both during times of net synthesis, and also during periods
of starch breakdown (Ritte et al, 2004; Nielsen et al, 1994). In chloroplasts, however, the
rate of glucan phosphorylation is considerably higher when granules are being actively
catabolised implying that phosphorylation at this time point might be important for
10
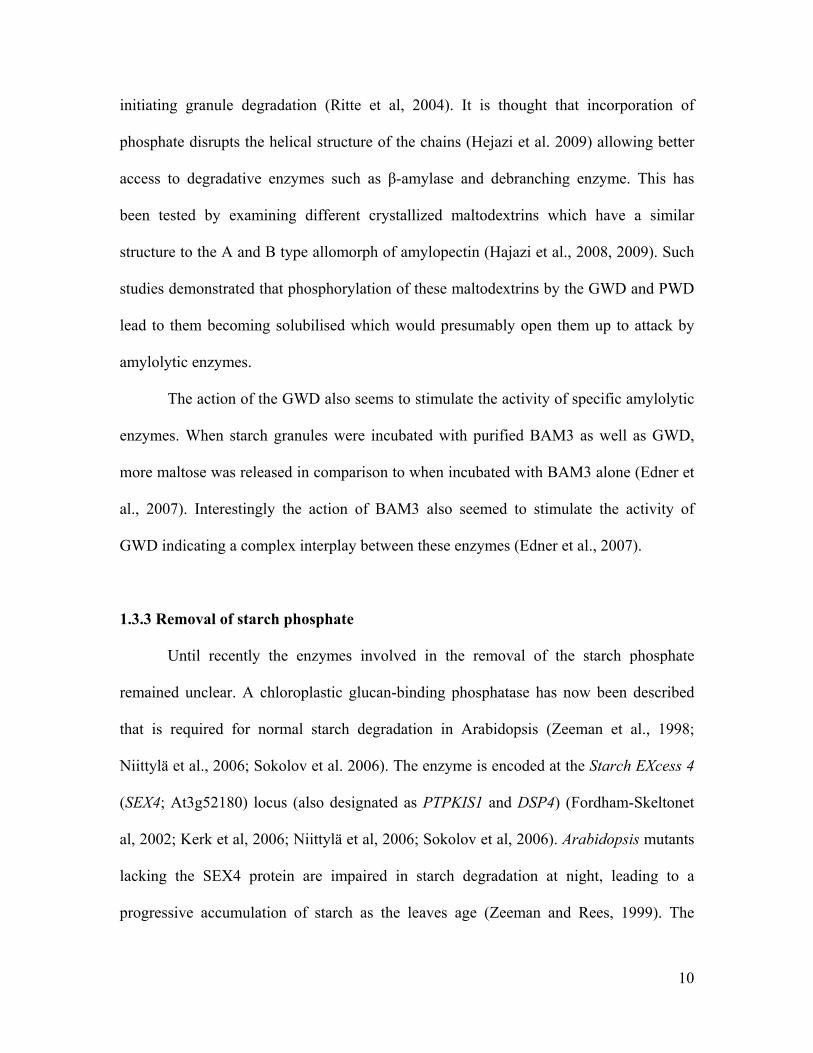
initiating granule degradation (Ritte et al, 2004). It is thought that incorporation of
phosphate disrupts the helical structure of the chains (Hejazi et al. 2009) allowing better
access to degradative enzymes such as β-amylase and debranching enzyme. This has
been tested by examining different crystallized maltodextrins which have a similar
structure to the A and B type allomorph of amylopectin (Hajazi et al., 2008, 2009). Such
studies demonstrated that phosphorylation of these maltodextrins by the GWD and PWD
lead to them becoming solubilised which would presumably open them up to attack by
amylolytic enzymes.
The action of the GWD also seems to stimulate the activity of specific amylolytic
enzymes. When starch granules were incubated with purified BAM3 as well as GWD,
more maltose was released in comparison to when incubated with BAM3 alone (Edner et
al., 2007). Interestingly the action of BAM3 also seemed to stimulate the activity of
GWD indicating a complex interplay between these enzymes (Edner et al., 2007).
1.3.3 Removal of starch phosphate
Until recently the enzymes involved in the removal of the starch phosphate
remained unclear. A chloroplastic glucan-binding phosphatase has now been described
that is required for normal starch degradation in Arabidopsis (Zeeman et al., 1998;
Niittylä et al., 2006; Sokolov et al. 2006). The enzyme is encoded at the Starch EXcess 4
(SEX4; At3g52180) locus (also designated as PTPKIS1 and DSP4) (Fordham-Skeltonet
al, 2002; Kerk et al, 2006; Niittylä et al, 2006; Sokolov et al, 2006). Arabidopsis mutants
lacking the SEX4 protein are impaired in starch degradation at night, leading to a
progressive accumulation of starch as the leaves age (Zeeman and Rees, 1999). The

11
SEX4 protein contains a dual-specificity phosphatase domain as well as a carbohydrate-
binding module. Since dual specificity phosphatases are generally believed to act on
phosphorylated protein kinases (Luan, 2003), it was suggested that SEX4 might
dephosphorylate such a kinase, which would in turn mediate the activity of starch
degrading enzymes (Niittylä et al., 2006; Kerk et al., 2006). Recent evidence
demonstrates however that the SEX4 protein is responsible for removing phosphate from
starch. This comes from a study that showed firstly that the SEX4 protein is able to
remove phosphate from the amylopectin molecule and, secondly, that the sex4 mutant
accumulates phosphorylated malto-oligosaccharides (which are starch breakdown
products) (Kötting et al., 2009).
There are two other genes in the Arabidopsis genome coding for proteins with a
high degree of similarity to SEX4, known as Like Sex Four 1 (LSF1; At3g01510) and
LSF2 (AT3g10940). A recent paper has demonstrated that a mutation in LSF1 also leads
to an impairment of starch degradation (Comparet-Moss et al, 2009), but it isn’t clear
whether LSF1 acts similarly to SEX4, or has another role. There is no data for the role of
LSF2 in starch metabolism.
There are still a number of open questions about SEX4 and LSF proteins. They
are the focus of much work examining their functions in Arabidopsis, but their roles have
not been examined in other plants. In addition the specific glucans that these enzymes
bind to have not yet been studied. For example, they may bind to starch granules as a
substrate, or to starch breakdown products. These questions will be examined in this
project through a number of techniques. These involve the production of antibodies
against the proteins, the repression of these proteins in Nicotiana benthamiana using

12
virus induced gene silencing, and the production of starch breakdown product based
glyco-arrays.
1.4 Glyco-Array Technology
Glyco-arrays are a relatively new technology, and can be defined as a micro-
array of carbohydrates. The technology usually involves attaching some kind of
oligosaccharide to a membrane, which can then be probed with the enzymes being
studied. In recent years a number of studies have been done which have employed these
arrays. A study by Shipp et al, (2007) was performed where the activities
glycosyltransferases involved in plant cell wall biosynthesis were assayed. That study
aimed at the characterization of various enzymes based on their biochemical activities on
plant cell wall polysaccharides, which were attached to a thin-coated photo-activatable
glass slide. They showed that the technique was not only relatively simple, but also
provided a high-throughput method to assign biochemical function to enzymes as well as
to increase the understanding of the roles played by these enzymes in this complex
network. Another study where glyco-arrays were used was done by Meenakshi et al
(2007), where they aimed to investigate the usefulness of mucins in understanding the
progression of gastric cancer and gallstone formation. Mucins are essential cytoprotective
glycoproteins and changes in epithelial mucins have been shown in different pathological
conditions. The study involved formalin-fixing paraffin-embedded gastric biopsy
specimens as well as surgically resected gallbladder tissue samples. These were then
stained with various dyes to give an indication of the pH of the samples. The study
showed that in normal gastric and gallbladder mucosae, the mucins were found to be at a

13
neutral pH, whereas in intestinal metaplasia, gastric carcinoma and stone-containing
gallbladder, showed a significant increase in acidic mucins. The two studies mentioned
are quite diverse which shows that this technology is useful for the study of protein
interactions with a variety of carbohydrates.
The examples that I have given above demonstrate that glyco-arrays can be used
to study many aspects of metabolism. I wish to set up such arrays to examine the binding
of SEX4, LSF1 and LSF2 proteins to starch breakdown products, however they will also
have the potential to study the formation of starch metabolic enzyme complexes as well
as opening up the possibility of identifying new proteins involved in either synthesizing
or degrading starch.
1.5 Virus Induced Gene Silencing
There are several techniques for gene silencing mechanism in plants, for
example antisense and RNAi. These have been used to effectively down-regulate specific
genes in many plants. Most of these methods rely on the production of double-stranded
RNAs (dsRNAs), which correspond to the gene of interest leading to the initiation of the
homology-based RNA degradation process. One disadvantage of producing transgenic
plants is the time that it takes to do so, and the necessity to study multiple transgenic lines
in order to overcome the problem of somaclonal variation. This can be overcome using
virus-induced gene silencing (VIGS).
VIGS allows for transient induction of gene silencing. It involves the construction
of an engineered virus which contains the sequence of a target gene that is also present
within the host plant. The pathway leading to RNA silencing is known to be separated

14
into three distinct phases, the initiation, effector and amplification stages (Hannon, 2002).
The initiation of RNA silencing is triggered by double stranded RNA (Fire et al. 1998).
dsRNA is recognized by a highly specific ribonuclease known as Dicer, which falls into
the RNaseIII ribonuclease family (Bernstein et al. 2001). It acts to degrade long dsRNA
molecules into 21 - 25 nucleotide fragments known as small interfering RNAs (siRNAs).
Cleavage by the dicer enzyme produces double stranded siRNAs with a 5’-phosphate and
a two nucleotide 3’ overhang (Elbashir et al. 2001). The population of siRNA molecules
created is then available for integration into a large multimeric nuclease complex, which
can target and cleave single stranded RNA with high specificity. The assembly of
enzymes with a siRNA molecule is known as the RNA-induced silencing complex
(RISC) (Hammond et al. 2000). Upon integration into the RISC the siRNA acts as a
guide, targeting the complex in a sequence specific manner to homologous RNA
(Nykänena et al. 2001). Endonucleolytic cleavage of the target mRNA then occurs which
effectively disables it.
The elucidation of plant gene function has traditionally been based on the
isolation of mutations in the gene of interest, or the production of transgenic plants where
the genes expression has been repressed. There are several advantages of VIGS over the
production of transgenic or mutant plants. For example it abolishes the need for laborious
and time-consuming transformation, as well as the selection of the transgenics. VIGS
can also be used to study the role of essential genes where the isolation of knockout
mutants is impossible. The experimentation is relatively easy with the cost associated
with the production of VIGS knockout plants being much lower when being compared to
more traditional silencing techniques. It is also more amenable to high-throughput studies

15
and has been used successfully in model and non-model host systems (Lu et al. 2003;
Burch-Smith et al. 2004; 2006b; Constantin et al. 2004; Fofana et al. 2004; Ding et al.
2006). The main drawbacks of using VIGS are that it leads only to a temporary repression
of transcription. This means that if a phenotype needs time to develop following infection
it may not be noticed. In addition, VIGS does not necessarily lead to a complete
repression of a genes transcription, meaning that if a phenotype is not noted it may be
that the small amounts of protein produced from small amounts of residual RNA is
sufficient. At present efficient VIGS systems have not been well developed for organs
other than leaves, so the role of genes cannot be studied in other parts of the plant, such
as storage organs, using VIGS.
Tobacco-rattle virus (TRV) has been developed as a VIGS vector. It provides
robust silencing, exhibiting a broad host range, is efficient in infecting meristematic tissue
and produces only mild disease symptoms (Ratcliff et al. 2001; Liu et al. 2002; Burch-
Smith et al. 2006b). Using Agrobacterium as a tool to introduce TRV into the host also
overcomes the need for in vitro transcription of viral RNA or biolistic delivery
techniques. VIGS has been used to study the Leafy gene which regulates flower
development. Loss-of-function leafy mutants produce modified flowers that are
phenocopied in TRV-leafy-infected plants (Ratcliff et al, 2001). A TRV vector containing
the cellulose synthase (CesA) gene was used to silence that gene in tobacco leading to a
modified cell wall (Burton et al, 2000).

16
Figure 1.4: An overview of the silencing pathway and the various phases and enzymes involved. (Sijen
et al, 2001)
1.6. Fruit metabolism
Carbohydrate metabolism in fruits has not been studied as extensively as it has
been in leaves or other storage organs such as maize seeds or potato tubers. The main
model plant that people have used to study fruit metabolism is tomato, and the reasons for
the lack of progress in this area is probably because of the relatively large genome size
(approximately 950 Mb; Asamizu (2007)) of tomato which means that it is more difficult

17
to isolate mutants in this species than in Arabidopsis. However in recent times the study
of carbohydrate metabolism in developing tomato fruit has received more attention,
owing to the uniqueness of the process as well as the importance of fruits in the human
diet (Carrari and Fernie, 2006). Several features of the tomato fruit make it a highly
interesting system to study, all of them linked to the dramatic metabolic changes that
occur during development. Tomato fruit follows a transition from partially photosynthetic
to true heterotrophic metabolism during development by accompanied by the
differentiation of chloroplasts into chromoplasts and the dominance of carotenoids and
lycopene on ripening. (Carrari and Fernie, 2006). Several studies have recently
determines the role of specific enzymes on fruit metabolism, such as plastidial fructose
1,6-bisphosphatase (Obiadalla-Ali et al, 2004) and invertase (Fridman et al, 2004).
One advance that helps to study fruits has been the development of the dwarf
Micro-tom tomato cultivar (Scott and Harbaugh, 1987) which is used as a model
(Meissner et al, 1997). In a study by Obiadialla-Ali et al (2003) carbohydrate metabolism
was analyzed during the fruit development of this cultivar. That study showed that starch
accumulates very early in development and is then degraded as the fruit ripens, as has
been demonstrated previously in normal tomato fruit (Ohyama et al, 1995; Klann et al,
1996; Chengappa et al, 1999; D’Aoust et al, 1999; Nguyen-Quoc et al, 1999). The study
also demonstrated that the metabolism of the pericarp (outer tissue of the fruit) was
different to that of the placenta (inner tissue of the fruit). It is not clear whether or not the
starch in tomato fruits is of physiological relevance. One way to examine this would be in
tomato plants which are unable to degrade starch. Recently a GWD mutant in tomato has
been identified (Nashilevitz et al, 2008) and given that plants in other species which lack

18
GWD are unable to degrade starch (Lorberth et al 1998; Yu et al, 2001) it is reasonable to
assume that this will also be the case in tomato fruit. This will also be examined as part of
this project.
1.7. Aim of the project
In this project I aim to study the function of SEX4, LSF1 and LSF2 cDNAs in
tobacco using VIGS. Through the production of constructs and silencing of these genes,
an indication of their function in this plant may be obtained. It will also be attempted to
characterise these genes with respect to their substrate utilization by setting up a glyco-
array. The glucans to be used on the array will be a series of differently phosphorylated
starches which have been degraded by starch catabolytic enzymes and then fractionated
by anion exchange chromatography. SEX4 and LSF1 and LSF2 proteins will be purified
and used to probe the filter. Mass spectroscopy will then be used to identify which
substrates they bind to best and may allow identification of the substrates which these
enzymes act upon. I also aim to investigate the effect the SEX4 has on E. coli glycogen
contents. This project also investigates the effect that a gwd mutation has on carbohydrate
metabolism in leaves and fruits of the Micro-tom tomato cultivar variety.

19
Chapter 2
Protein Expression and Purification
20
2. Protein Expression and Purification
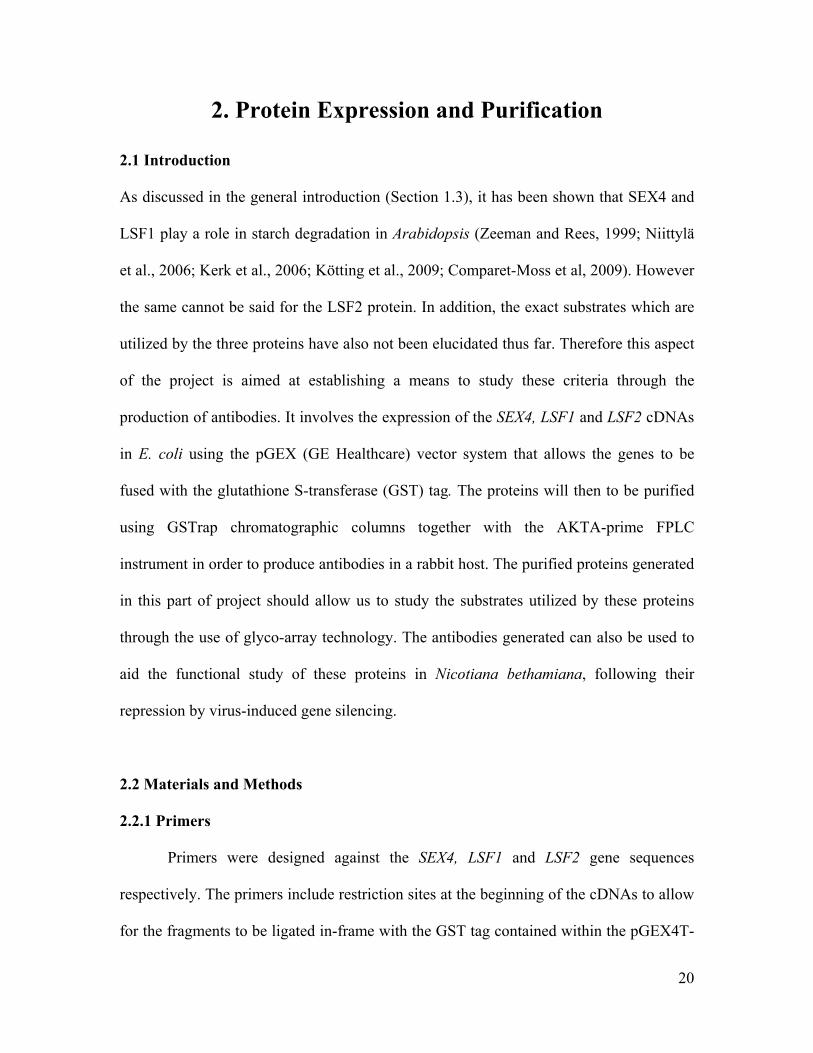
2.1 Introduction
As discussed in the general introduction (Section 1.3), it has been shown that SEX4 and
LSF1 play a role in starch degradation in Arabidopsis (Zeeman and Rees, 1999; Niittylä
et al., 2006; Kerk et al., 2006; Kötting et al., 2009; Comparet-Moss et al, 2009). However
the same cannot be said for the LSF2 protein. In addition, the exact substrates which are
utilized by the three proteins have also not been elucidated thus far. Therefore this aspect
of the project is aimed at establishing a means to study these criteria through the
production of antibodies. It involves the expression of the SEX4, LSF1 and LSF2 cDNAs
in E. coli using the pGEX (GE Healthcare) vector system that allows the genes to be
fused with the glutathione S-transferase (GST) tag. The proteins will then to be purified
using GSTrap chromatographic columns together with the AKTA-prime FPLC
instrument in order to produce antibodies in a rabbit host. The purified proteins generated
in this part of project should allow us to study the substrates utilized by these proteins
through the use of glyco-array technology. The antibodies generated can also be used to
aid the functional study of these proteins in Nicotiana bethamiana, following their
repression by virus-induced gene silencing.
2.2 Materials and Methods
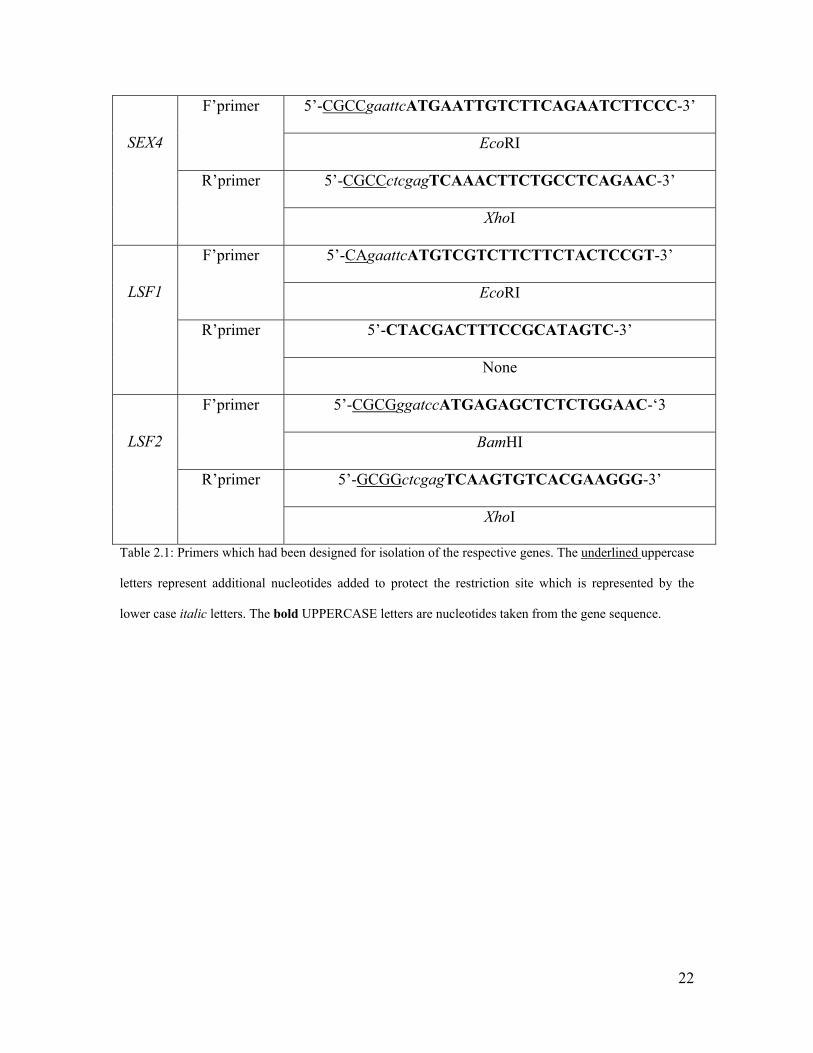
2.2.1 Primers
Primers were designed against the SEX4, LSF1 and LSF2 gene sequences
respectively. The primers include restriction sites at the beginning of the cDNAs to allow
for the fragments to be ligated in-frame with the GST tag contained within the pGEX4T-

21
1 protein expression vector. (Table 2.1) the sequences were amplified by PCR using
plasmid DNA as template and then analysed by agarose gel electrophoresis. PCR
products were excised from the gel and purified using the Qiagen Gel Extraction Kit.
SEX4 and LSF2 PCR products were ligated into the EcoRV site within pBluescriptSK
(Stratagene, La Jolla, California) using T4 DNA Ligase (Promega) while LSF1 was
ligated into the pGEM-T-Easy vector system (Promega Corporation). This was done
because SEX4 and LSF2 were amplified using pfu Taq polymerase (Fermentas), whilst
the LSF1 was amplified using Taq polymerase (Bioline). SEX4 was excised from
pBluescript using EcoRI and XhoI while LSF1 was cut with EcoRI alone. LSF2 was
excised by cutting with BamHI and XhoI. All fragments were separated from the vector
using agarose gel electrophoresis and purified from the gel using a commercially
available kit (Qiagen gel clean up) before ligation into the pGEX-4T-1 vector using T4
DNA ligase. The genes were ligated into the same sites of the enzymes that were used to
excise them from the pBluescript and pGEM-T-Easy vectors. Ligations were transformed
into E. coli DH5α and grown on LB media containing ampicillin at 37°C overnight.
Colonies obtained from the ligation were screened using colony PCR using the primers
that were designed to amplify the respective genes and colonies containing inserts were
transformed into E. coli BL21- CodonPlus cells (Stratagene).
22
5’-CGCCgaattcATGAATTGTCTTCAGAATCTTCCC-3’ F’primer
EcoRI
5’-CGCCctcgagTCAAACTTCTGCCTCAGAAC-3’
SEX4
R’primer
XhoI
5’-CAgaattcATGTCGTCTTCTTCTACTCCGT-3’ F’primer
EcoRI
5’-CTACGACTTTCCGCATAGTC-3’
LSF1
R’primer
None
5’-CGCGggatccATGAGAGCTCTCTGGAAC-‘3 F’primer
BamHI
5’-GCGGctcgagTCAAGTGTCACGAAGGG-3’
LSF2
R’primer
XhoI
Table 2.1: Primers which had been designed for isolation of the respective genes. The underlined uppercase
letters represent additional nucleotides added to protect the restriction site which is represented by the
lower case italic letters. The bold UPPERCASE letters are nucleotides taken from the gene sequence.

23
Figure 2.2: Protein expression constructs a) SEX4, b) LSF1 and c) LSF2 in pGEX4T-1
b)a)
c)

24
2.2 Protein Expression
Prior to protein purification the presence of the fusion protein was analysed by
SDS-PAGE on proteins extracted from the various cultures containing the proteins. This
involved inoculating BL21 containing the appropriate plasmid into 2ml LB media
containing 20µg/ml ampicillin. The culture was incubated at 37ºC overnight and 2ml of
overnight culture was inoculated into 200ml fresh LB media with the same antibiotic.
This was again incubated at 37ºC with shaking until OD600 of 0.3 was reached.
Expression of the protein was induced by the addition of IPTG to a final concentration of
2mM, 0.5mM, 1mM for SEX4, LSF1 and LSF2 respectively. The culture was then
incubated at 22ºC overnight and 2ml of this was centrifuged at 20 000g for 2min and the
supernatant discarded. The pellet was re-suspended in 0.4ml of SDS-reducing buffer
(0.5M Tris-HCl ph 6.8; 40% (v/v) glycerol; 10% (w/v) SDS; 0.05% (w/v) Bromophenol
Blue) and heated at 95ºC for 5mins. The sample was centrifuged at 20 000 g with the
resulting supernatant being separated by SDS-PAGE. The gels were stained using
Coomassie Colloidal Blue (Invitrogen) to examine if a protein of the correct molecular
size was produced.
The remainder of the overnight culture was centrifuged at 7700g for 10 min at
4°C and the supernatant discarded. The cells were re-suspended in 10ml of ice-cold PBS
(0.14M NaCl; 2.7mM KCl; 10mM Na2PO4; 1.8mM KH2PO4, pH 7.3) and frozen at -20ºC
overnight. Once it was determined that the cells contained the fusion protein the sample
was thawed by incubation at 37ºC for 15min then stored on ice prior to disruption by
sonication. The sonicated sample was centrifuged at 7700 g for 10mins at 4ºC. The

25
soluble extracts were examined using SDS-PAGE to examine presence of the protein in
the soluble fraction prior to further purification.
2.3 Protein Purification
The proteins were purified using 1ml GSTrap columns together with an AKTA
prime fast protein chromatography instrument. The column was equilibrated using 10
column volumes (CV) of PBS (pH 7.3). The protein sample was filtered through a
0.45µM membrane and then loaded onto the column. This was again washed with 10 –
20 CV of PBS before being eluted using glutathione elution buffer (20mM reduced
glutathione in 50mM Tris-HCl, pH 8.0). Fractions were collected and separated by SDS-
PAGE before staining with Coomassie Colloidal Blue (Invitrogen Life Technologies).
2.4 Immunoblot Analysis
Proteins were separated by 10% (w/v) SDS-PAGE and blotted onto a PVDF
transfer membrane using a semi-dry blotting system (Bio-Rad). The membrane was
removed and blocked in 4% (w/v) fat free milk powder in water overnight. Primary
antibody (1:1000 dilution) was added to each of the membranes in TBST-T (20mM Tris
(pH 7.6, 137mM NaCl2, 0.1% (v/v) Tween-20) buffer and incubated for 1 hour, followed
by the removal of primary antibody before being washed three times for 5 minutes in
TBS-T buffer. Secondary antibody (ReserveAPTM phophatase labelled Goat anti Rabbit
IgG (KPL, Gaithersburg, MD 20878 USA) was then added (1:10000 dilution) and
incubated for 1 hour in TBS-T. Upon removal of the secondary antibody, another three 5
minute washes were performed. The membranes were rinsed in H2O, before substrates
BCIP/NBT (5-Bromo-4-Chloro-3’- Indolyl Phosphate p-Toluidine/ Nitro-Blue

26
Tetrazolium Chloride) were added. Once the desired staining is obtained the reaction was
stopped by rinsing the membranes with H2O.
2.5 Results and Discussion
2.5.1 Construct Production
Figure 2.3: 0.8% (w/v) agarose gel showing inserts present within the pGEX-4T-1 protein expression
vector. Lane 1: Lambda PST Molecular marker; Lane 2: Sex4; Lane 3 Lsf1 and Lane 4: Lsf2.
I manufactured three constructs in pGEX4T-1 designed to allow purification of
SEX4, and LSF2 from tobacco and LSF1 from Arabidopsis. The reason for the different
species is that I wish to study the function of these proteins in tobacco using VIGS, so
would prefer to manufacture antibody against the tobacco proteins, however I was unable
to amplify a full length tobacco cDNA coding for this. I obtained a full length
Arabidopsis LSF1 cDNA from Dr Oliver Kötting and Prof. Samuel Zeeman (ETH,
M LSF2 LSF1 SEX4
1159
1700
4507
5077
11499
1093
805

27
Zurich). Given that antibodies against proteins from one species normally cross-react to
antibodies from other species it was decided that this would be used to produce antibody
against LSF1. Figure 2.3 shows a 0.8% agarose gel. Lane 1 contains the marker, while
lanes 2, 3 and 4 contain restriction enzyme digests of the various constructs. These have
been digested either side of the insertion site. The SEX4 construct was cut with a
combination of EcoRI and XhoI, LSF1 was cut with EcoRI and LSF2 was cut with a
combination of BamHI and XhoI. The gel confirms that inserts of the correct size were
present within the pGEX-4T-1 with lanes 2, 3 and 4 showing inserts of 1137bp for SEX4,
1520bp for LSF1 and 849bp for LSF2.
2.5.2 Protein Expression
Figure 2.4: 10% (w/v) SDS-PAGE Lane M: Fermentas pre-stained protein marker; Lane 2: SEX4; Lane
3:LSF1 and Lane 4: LSF2; Lane 5: Glutathione S Transferase (GST)
100
170
70
55
40
35
25
15
130
M GSTLSF2 LSF1 SEX4

28
Figure 2.4 shows a SDS-PAGE gel stained with colloidal Coomassie Colloidal
blue where proteins extracted from pellets by heating in SDS reducing buffer have been
separated SDS-PAGE. The figure shows that all the heterologously expressed plant
proteins are present at the correct molecular size. Lane 2 shows a band at 70 kDa which
corresponds to the SEX4 GST fusion protein, lane 3 shows a band at around 80 kDa,
corresponding to the LSF1 GST fusion protein and a band at 55 kDa which represents the
LSF2 GST fusion protein in present in lane 4. Lane 5 shows a band at approximately 28
kDa that corresponds to GST alone, produced by the empty pGEX-4T-1 vector. This
demonstrates that the proteins are being manufactured in the bacteria and can be used for
further purification.
I was unable to produce soluble extracts from containing the LSF1 protein (data
not shown). This is probably because LSF1 is present in inclusion bodies, something that
has been observed by other groups (Prof Samuel Zeeman, Dr Oliver Kötting, ETH Zurich
Pers. Comm.). As such I was unable to continue the purification of LSF1.

29
2.5.3 Protein Purification
Figure 2.5 10% (w/v) SDS-PAGE gel with purified fractions of a) SEX4 and b) LSF2 proteins. Fractions of
each of these were combined and an aliquot containing 1mg/ml was used to produce antibodies against the
respective proteins.
I manufactured soluble extracts containing either SEX4 or LSF2 fusion proteins
and purified them using a GSTrap column. Figure 2.5a shows the various fractions
which eluted from the column after loading with the SEX4 fusion protein extract. These
were separated by 10% SDS PAGE and stained with Coomassie Colloidal Blue
(Invitrogen Life Systems). Figure 2.5b shows a similar gel containing the LSF2 fusion
protein fractions. It can be seen that both proteins were fractionated successfully, with
minor contamination from other proteins. The protein concentration of the various
fractions were determined with a 1ml sample of each of the proteins at a concentration of
1 mg total protein/ml being submitted to Prof. Dirk Belstedt (Stellenbosch University) for
antibody production. As I was unable to purify the LSF1 protein I obtained an antibody
raised against the Arabidopsis protein from Prof. Samuel Zeeman and Dr Oliver Kötting
b) a) 1 2 3 4 5 6 7 8 9 10
7055
40
35
25
15
130170
100
1 2 3 4 5 6 7 8 9 10
100 130 170
70
55
40
35
25

30
(Institute of Plant Science, ETH Zurich, Switzerland) which has previously been used to
recognise LSF1 in Arabidopsis leaf extracts (Comparet-Moss et al, 2009).

31
2.5.4 Immunoblot Analysis
Figure 2.6a-c: Immunoblot analysis of E.coli extracts tested against the a) SEX4, b) LSF1 and c) LSF2
antibody.
a)
170
70
55
40
35
25
15
100 130
M GSTLSF2 LSF1 SEX4
b)
130
15
70
55
40
35
25
170
100
M GSTLSF2LSF1 SEX4
c)
100
70
55
40
35
25
130
M GSTLSF2 LSF1 SEX4

32
To test the potential cross-reactivity of the antibodies I separated extracts
containing the fusion proteins using SDS-PAGE and blotted them onto nylon membranes.
These were then probed with the various antibodies and analysed for binding using
immunoblots. Figures 2.6a, b and c show the results for the anti-SEX4, anti-LSF1 and
anti-LSF2 antibodies respectively. The first thing to point out is that the anti-SEX4 and
anti_LSF2 antibodies both recognise the GST tag alone (Fig 2.6a,c). Unsurprisingly both
of these antibodies also recognise both SEX4:GST and LSF2:GST fusion proteins. The
LSF2, but not the SEX4 antibody also recognises the LSF1:GST fusion protein (Fig
2.6a,c). It isn’t clear whether the cross-reactivity is due to their attachment to the GST
part of the fusion protein alone, or is genuine cross-reactivity to the plant proteins due to
similarities in peptide sequences. Figure 2.6b shows that the LSF1 antibody is able to
detect the LSF1:GST fusion protein, but does not recognise the other two or the GST
alone.
These data demonstrate that the three antibodies recognise the heterologously
expressed fusion proteins that they are designed to recognise. This does not mean,
however, that they will recognise the proteins in plant extracts. It might be that the
proteins are not present in high enough concentrations in plants for the antibodies to pick
them up or, in the case of the anti SEX4 and anti LSF2 antibodies, that they only
recognise the GST. There appears to be a high amount of background in the antibodies,
which is probably due to the small amounts of native proteins that were co-purified from
the GSTrap column. This is unlikely to be a problem when studying the protein in plant
extracts as they will not contain these proteins, but this will be tested in Chapter 4.

33
Chapter 3
Production of starch breakdown products for use in
glyco-arrays

34
3. Production of starch breakdown products for use in
glyco-arrays
3.1 Introduction
As was discussed in the general introduction, the function of the SEX4, LSF1 and LSF2
genes is becoming better understood with roles being assigned for the SEX4 and LSF1
proteins (Zeeman et al., 1998; Niittylä et al., 2006; Fordham-Skeltonet al, 2002; Kerk et
al, 2006; Sokolov et al, 2006; Kötting et al., 2009; Comparet-Moss et al, 2009). No
studies have been performed as yet that have elucidated the exact substrates utilized by
these proteins. It is known that SEX4 can dephosphoylate amylopectin (Niittylä et al.,
2006), but during the starch breakdown process amylopectin is degraded by many
different enzymes. It is possible that one of these breakdown products is the preferred
substrate for SEX4 and LSF proteins. The aim of this part of the thesis is to try and
produce a system to allow this to be studied. One way to do this would be to utilize
glyco-array technology where glucans are bound to a surface and are probed with either a
purified protein or a mixture of proteins. The glucan to which the protein binds
preferentially can be examined using antibodies that recognize the protein, or by using a
mass spectrometer. In this section I describe the production of starch degradation
products which will be used in such glyco-arrays in future.

35
3.2 Materials and Methods
3.2.1 Analysis of starches used in the study
Starches isolated from nine different types of genetically modified potato lines
were used. These starches were a kind gift of Bayer Crop Science GmBh and were
isolated from transgenic potatoes where one or several enzymes within the starch
metabolic pathway have been repressed, resulting in starches with different structures.
3.2.2 Determination of the glucose 6-phosphate content of the starches
0.5ml of 0.7M HCl solution was added to 150mg of starch. The mixture was
heated at 95°C for 4 hours before 100µl of this solution was added to 100µl of 0.7M
KOH. 30µl was combined with 230µl assay buffer containing (100mM MOPS pH 7.5;
10mM MgCl2; 2mM EDTA; 2mM NAD). An absorbance reading was taken at 340nm
before 1U glucose 6-phosphate dehydrogenase from Leuconostoc was added. The
difference in absorbance is used to calculate the G 6-P amount.
3.2.3 Isolation of amylopectin using thymol
200mg of starch was dissolved in 12ml 90% DMSO overnight. 3 volumes of
ethanol was added and mixed well. The samples were then centrifuged at 5000g for 5
minutes to harvest the degranularised starch. The precipitate was ground to a fine powder
and ethanol was added to wash and the sample centrifuged again as before. This pellet
was dissolved in 40 ml of 1% (w/v) NaCl at 80°C and the solution cooled to 30°C before
80mg thymol was added with stirring. This was incubated at 30°C for 60hr without

36
stirring to precipitate amylose. Amylose was harvested by centrifugation as before. This
was washed twice with thymol-saturated water, re-suspended in ethanol and then again
centrifuged as before followed by washing twice with acetone at -20°C.
Amylopectin was precipitated by adding 3 volumes of ethanol to the supernatant
from the 60h incubation, followed by harvesting by centrifugation at 5000g for 5 min.
The precipitate was then washed with ethanol, ground to a powder in a pestle and mortar
and washed twice with acetone that was at -20°C.
3.2.4 Anion Exchange Chromatography
10mg of potato starch or the isolated amylopectin was placed in a 2ml
microcentrifuge tube, to which 1.5ml water was added. The solution was incubated at
100ºC for 2min to dissolve the starch. The solution was then cooled to room temperature
before 14U of isoamylase was added and incubated at 37ºC for 2 – 3hrs. The solution is
then incubated at 100ºC to inactivate the enzyme. The same experiment was repeated
using 14U β-amylase or 14U of α-amylase.
A DEAE sepharose column was prepared by placing a piece of glass wool inside
a Pasteur pipette. 2ml of DEAE sepharose was added to the column. 10 column volumes
(CV) of 5mM Tris-HCl (pH 7.8) solution were passed through the column to equilibrate
the column. 100µl of the enzyme-digested sample was added and non-phosphorylated
glucans were eluted in 1ml aliquots of water. 10µl of each eluted sample was added to
100µl of Lugols solution (4% (w/v) Potassium Iodide, 2% (w/v) Iodine reagent to
monitor elution of glucans. The eluted samples were tested until no colour change

37
occured indicating that all the non-phosphorylated chains had been isolated. Once this
happened the phosphorylated glucans were eluted using 1ml aliquots of a solution
containing 100mM NaCl and 10mM HCl. The eluted samples were then again tested
using Lugols reagent to test for the presence of eluted glucans.
3.3 Results and Discussion
The transgenic potato lines from which the starch was extracted are described in Table 1.
All transgenic lines were in the Desirée cultivar
Enzymes repressed
Wild Type
Glucan, Water Dikinase (GWD)
Starch Synthase III (SSIII)
Branching enzyme I (BEI)
BEI and SSIII
BEI and GWD
GWD, BEI and Branching Enzyme II (BEII)
BEI, BEII and SSIII
BEII, BEI and SSIII
Table 3.1: Genetically modified potato lines from which the different starches were derived.
38
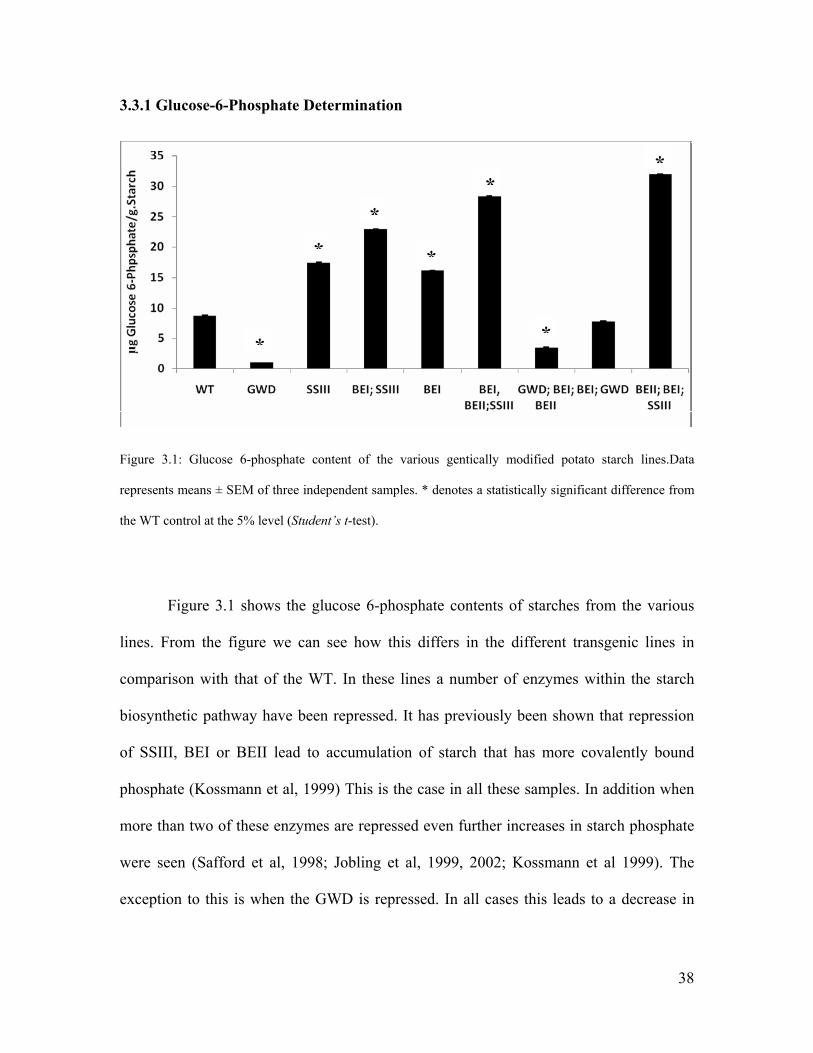
3.3.1 Glucose-6-Phosphate Determination
Figure 3.1: Glucose 6-phosphate content of the various gentically modified potato starch lines.Data
represents means ± SEM of three independent samples. * denotes a statistically significant difference from
the WT control at the 5% level (Student’s t-test).
Figure 3.1 shows the glucose 6-phosphate contents of starches from the various
lines. From the figure we can see how this differs in the different transgenic lines in
comparison with that of the WT. In these lines a number of enzymes within the starch
biosynthetic pathway have been repressed. It has previously been shown that repression
of SSIII, BEI or BEII lead to accumulation of starch that has more covalently bound
phosphate (Kossmann et al, 1999) This is the case in all these samples. In addition when
more than two of these enzymes are repressed even further increases in starch phosphate
were seen (Safford et al, 1998; Jobling et al, 1999, 2002; Kossmann et al 1999). The
exception to this is when the GWD is repressed. In all cases this leads to a decrease in
*
**
*
*
*
*

39
starch phosphate, consistent with its known role in incorporating phosphate into starch
(Ritte et al., 2002, Mikkelsen et al, 2004).
3.3.2 Qualitative Glucan Concentration Determination
Figure 3.2: Elution pattern of glucans from DEAE sepharose column. Digested glucan samples were added to the column and eluted with water to isolate non-phospohorylated chains (Fraction 1-2) or NaCl and HCl to elute phosphorylated glucans (Fractions 3-4)The figure shows an example of starch isolated from untransformed control potatoes digested with the enzymes β-amylase, α-amylase or isoamylase. Aliquots of the fractions were added to Lugols solution and absorbance was determined at 600nm to qualitatively determine presence of glucans.
The aim of this aspect of the project was to digest starch and separate them into
phosphorylates and unphosphorylated chains.. This was done for all the starches from the
transgenic lines as well as amylopectin isolated from the starches. An example is shown
in Figure 3.2 for a sample of WT amylopectin which had been degraded with α-amylase,
β-amylase or iso-amylase before being loaded onto the anion exchange column. Fraction
Water elution HCl elution

40
1 and 2 represent the non-phosphorylated glucans which eluted with water while fractions
3 and 4 represent the phosphorylated glucan chains which eluted with an NaCl/HCl
solution. The sample digested with α- or β-amylases produced relatively little glucan,
although this might be because the elution of the glucans was only monitored
qualitatively using an iodine solution. As the colouration of iodine by glucans depends on
the chain length, it might be that small molecules were produced by digestion using α- or
β-amylases which would not stain intensively. Digestion with isoamylase though
produced more pronounced fractions, indicating longer chains. This would be expected as
isoamylase only cleaves the α1-6 branchpoints within amylopectin, while α- and β-
amylases digest α1-4 bonds, which make up the majority of the starch molecule..
These samples are the start of a longer term project. I have produced 109 fractions
of starch and amylopectin breakdowbn products. What remains to be done now is to spot
these onto chips and probe them with the purified SEX4, LSF1 and LSF2 proteins that I
described in Chapter 2.

41
Chapter 4
Examination of the roles of the SEX4 and LSF proteins
in Nicotiana benthamiana leaf starch degradation using
virus induced gene silencing

42
4. Examination of the roles of the SEX4 and LSF
proteins in Nicotiana benthamiana leaf starch
degradation using virus induced gene silencing
4.1 Introduction
As mentioned in the general introduction much work has been done to examine leaf
starch degradation in the past decade. Most of this has been performed in Arabidopsis,
but it isn’t clear whether the knowledge gathered from these studies is applicable in other
species. In addition, although it has been demonstrated in Arabidopsis that SEX4 and
LSF1 play a role in starch degradation (Zeeman and Rees, 1999; Niittylä et al., 2006;
Kerk et al., 2006; Kötting et al., 2009; Comparet-Moss et al, 2009), it hasn’t been
examined if LSF2 is involved also. To do this in Arabidopsis would require the isolation
of a knockout mutant in the AtLSF2 gene, or production of transgenic plants lacking the
protein. A quicker way to study the role of LSF2 would be to repress its activity in
tobacco using virus induce gene silencing (VIGS). In addition this technique can be used
to examine the roles of SEX4 and LSF1 in a species other than Arabidopsis.
For this component of the project, therefore, I aim to ascertain the function of the SEX4,
LSF1 and LSF2 proteins in Nicotiana benthamiana by repressing their activities using
VIGS and examining whether or not this impairs starch degradation. The system involves
infection of the plants with TRV vector system. This system uses two vectors, derived
from binary transformation plasmids, which have cDNAs encoding the TRV RNA1
43
(TRV1) and TRV RNA2 (TRV2) which has been inserted into the T-DNA region
(Ratcliff et al, 2001). What this means essentially is that when the each vector contain
different parts of the TRV genome. The two vectors can be combined by transforming
them separately in Agrobacterium tumefaciens and then combining cultures containing
the vectors. These can be infiltrated into plants and leads to the production of TRV in the
plants. Both vectors contain a duplicated 35S promoter and a self-cleaving ribozyme
sequence to enable rapid generation of intact viral transcripts (Gould and Kramer, 2007).
Genes essential for plant to plant transmission of TRV through its nematode vector
(Hernandez et al, 1997) have been deleted from TRV2 (Ratcliff et al, 2001), however,
TRV2 has been engineered to contain a polylinker into which plant cDNA’s can be
ligated. When this is done and the vectors are used to produce TRV in plants it leads to
specific down regulation of the plant gene inserted into TRV2.
4.2 Materials and Methods
4.2.1 Construct Production
Tobacco rattle virus VIGS vectors were obtained from Prof. Dinesh-Kumar (Yale
University). These were TRV1, TRV2 and TRV::PDS (Dinesh-Kumar et al, 2003). The
last vector contains a tobacco sequence for the phytoene desaturase (PDS) gene which is
used as a positive control. TRV2 contains a polylinker which allows the insertion of
DNA coding for plant genes to be repressed.
Three vectors containing SEX4, LSF1 and LSF2 cDNAs were obtained from Dr
James Lloyd (Institute of Plant Biotechnology, Stellenbosch University). They were

44
originally Nicotiana tabacum expressed sequence tags (EST) which were obtained from
the French Plant Genomic Resource Center (http://cnrgv.toulouse.inra.fr/en). The ESTs
used were KL4B.111M23F (Sex4), KT7B.107M01F (LSF1) and KP1B.110M02F (LSF2).
These sequences were present within pBluescriptSK+ (Stratagene, La Jolla, California).
Inserts were excised from this plasmid using a combination of BamHI and XhoI and
ligated into the TRV2 vector cut with the same restriction enzymes.
4.2.2 Plant Preparation
Seeds of N. benthamiana were sterilized by suspending them in 1ml of 70% (v/v)
ethanol. The tube was mixed by inversion for 2mins, after which the ethanol was
decanted and the same step was repeated. Subsequently the seeds were re-suspended in
1ml 1% (w/v) sodium hypochloride. The tube was again mixed by inversion then allowed
to stand for 20mins. The bleach solution was decanted and 1ml of sterile distilled water
added to wash the seeds. The tube was again mixed by inversion, the water removed and
the washing step repeated for a second time. The seeds were germinated on MS media
containing 4.3 % (w/v) Murashige and Skoog (MS) medium with vitamins, 1.5% (w/v)
sucrose and 4% (w/v) PlantGel (Highveld Biological).
The seeds were left to grow for 7 to 10 days before they were sub-cultured onto
MS media. 2 weeks after this transfer the plantlets were infiltrated with an Agrobacterium
suspension and planted into seedling mix (Master Organics).
45
4.2.3 Agrobacterium transformation
The Agrobacterium tumefaciens strain GV2206 was transformed with either the
pTRV2 vector containing a cDNAs coding for one of SEX4, LSF1, LSF2, PDS, the empty
pTRV2 vector to act as a control or the TRV1 vector (Ratcliff et al, 2001) using the
freeze/thaw method (An et al, 1988).
4.2.4 Vacuum Infiltration
A. tumefaciens GV2206 containing TRV-VIGS vectors were grown at 28˚C in LB
liquid media containing the antibiotics streptomycin (10µg/ml), carbenicillin (20µg/ml),
kanamycin (50µg/ml) and rifampicin (25µg/ml). The cells were collected by
centrifugation, re-suspended in sterile infiltration media (10mM MgCL2; 10mM MES-
KOH pH 5.6; 150µM acetosyringone) and the OD600 adjusted to 0.5 using the infiltration
media.
For the plant infiltration the Agrobacterium containing the TRV1 vector was
mixed in a ratio of 1:1 with Agrobacterium containing TRV2, TRV2::SEX4,
TRV2::LSF1, TRV2::LSF2 or TRV2::PDS. The plantlets are then placed inside a plastic
60ml syringe with 20ml Agrobacterium solution. The plunger of the syringe was pulled
out to reduce the air pressure within the syringe of approximately 50 kPa which was
maintained for 30 seconds before the vacuum was broken, resulting in the media being
infiltrated into the leaves of the plant. The plants were then placed into seedling mix
(Master Organics) in 10cm pots. 14 – 21 days after the infiltration leaf discs of the plants
were collected and used to determine starch contents when photobleaching was noticed in

46
the control plants infiltrated with a VIGS vector designed to repress the activity of
phytoene desaturase.
4.2.5 Determination of leaf starch content
30mm2 leaf discs were taken and incubated with 1ml of 80 % (v/v) ethanol at
80°C for 1 hour. Following removal of the supernatant, the leaf discs were washed with
80 % (v/v) ethanol. Upon removal of this, 0.4 ml of 0.2 M KOH was added. The samples
were heated at 95 °C for 1 hour to solubilise the starch, after which 70µl of 1M acetic
acid was added to neutralise the solution.
10µL of the solubilised starch solution was mixed with 10µL of 50 mM NaAC pH
5.6 containing 10 U/ml amyloglucosidase (from Aspergillus niger) and incubated at 37°C
for 2 hours to digest the starch to glucose. 250µL of assay buffer (10 mM Imidazole (pH
6.9), 5 mM MgCL2, 1 mM ATP, 1 mM NAD) was then added. The reaction was started
by addition of 1 U/ml hexokinase from yeast and 1 U/ml glucose 6-phosphate
dehydrogenase from Leuconostoc and the increase in absorbance at 340nm was
determined. This was used to calculate the amount of hexose equivalents present in the
sample.
4.2.6 Extraction of soluble protein from plant leaf material
The different plants which had been silenced with the various genes as well as the
unsilenced control plants were harvested. They were ground in liquid nitrogen using a
mortar and pestle. 200mg fresh weight was placed into a 2ml microcentrifuge tube to
which 500µl of protein extraction buffer (50mM Tris-HCl pH 8.0; 2mM EDTA; 5mM

47
dithiotreitol (DTT) was added. Samples were vortexed for 1 minute and then centrifuged
at 7700g for 10min with the supernatant taken and separated using SDS-PAGE
electrophoresis.
4.2.7 Immunoblots
Proteins were separated as described in Section 2.2. The blots were tested using
antibodies raised against the SEX4, LSF1 and LSF2 mentioned in chapter 2.
4.3. Results and Discussion:
4.3.1 Construct production
Figure 4.1: 0.8% (w/v) agarose gel showing plasmid DNA of the VIGS constructs following restriction. M
denotes the molecular marker (λDNA digested with PstI). LSF2, SEX4 and LSF1 denote TRV2 vectors
containing inserts of those cDNA’s digeseted with BamHI and XhoI.
Figure 4.1 confirms that the three inserts that were required for the silencing
experiment were successfully cloned into the TRV2 vector. The figure shows the three
M LSF1LSF2 SEX4
1159
1700
4507
5077
11499
1093
805

48
respective cDNAs encoding LSF2, SEX4 and LSF1 were indeed present within the TRV
vector. The sequences used here were full length clones for the SEX4 and LSF2 while a
partial clone was used for LSF1. The figure shows a 0.8% (w/v) agarose gel with each of
the constructs being subjected to restriction digest with BamHI and XhoI. In lane M
Lambda Pst molecular marker was used. In lane LSF2 and SEX4, a band of
approximately 900bp as well as a band of 1100bp can be seen, which represents the LSF2
and SEX4 cDNAs present within the TRV2 vector. Lane LSF1 shows bands of
approximately 1500bp and 11500bp, which correspond to the LSF1 and TRV2 vector
respectively.
4.3.2 Virus Induced Gene Silencing
Figure 4.2: Photo bleaching of a tobacco plant that through silencing of the PDS gene. The plant of the left
has been infiltrated with the empty TRV2 vector, while the plant on the right was infiltrated with the
TRV2::PDS vector.

49
The VIGS system that I used utilises two vectors, TRV1 and TRV2, both of
which have to be present within Agrobacterium tumefaciens for the silencing protocol to
succeed. I manufactured three TRV2 constructs which should allow silencing of SEX4,
LSF1 or LSF2 in N. benthamiana. As a positive control I used a previously manufactured
construct (Kumagai et al, 1995), which allows silencing of the PDS gene, and leads to a
bleaching phenotype in plants due to an inability to manufacture chlorophyll. These were
transformed into A. tumefaciens which was then grown in appropriate growth media, re-
suspended in infiltration media and combined with A. tumefaciens containing TRV1.
Figure 4.2 shows plants where PDS has been silenced. I used this phenotype as a marker
for gene repression assuming that when this phenotype was noted plants which were
infiltrated at the same time, but with other constructs, would also be exhibiting gene
repression.
4.3.3 Analysis of SEX4, LSF1 and LSF2 protein levels using immunoblots
130
70
55
40
35
25
100
170
15
1 2 3 4 5 6 7 8 9 10
a)

50
Figure 4.3a- c: Immunoblot analysis of the a) Sex4 b) LSF2 and c) LSF1 silenced plants. The figure shows
Fermentas pre-stained protein marker lane 1. Soluble protein extracts from silenced plants were loaded in
lanes 2 – 7 and protein extracts from control plants were loaded in lanes 8 – 10. The arrows represent the
location where the expected protein bands should be seen which corresponds to the MW of the protein
b)
130
70
55
40
35
25
100
1 2 3 4 5 6 7 8 9 10
c) 1 2 3 4 5 6 7 8 9 10
130
70
55
40
35
25
100

51
To elicit silencing of SEX4, LSF1 and LSF2 in N. benthamiana I took A.
tumefaciens containing the appropriate TRV2 vectors that I had manufactured, combined
them with TRV1 containing A. tumefaciens and infiltrated seedlings. As a control I used
the TRV2 empty vector.
To see whether infiltration of seedlings with the constructs led to repression of
SEX4, LSF1 and LSF2 proteins, immunoblots were performed. The antibodies used were
manufactured as described in Chapter 2 where the SEX4 and LSF2 antibodies had been
tested using recombinant protein expressed in E. coli. The LSF1 antibody has been
demonstrated to recognise the Arabidopsis protein in plant extracts from that species
(Comparet-Moss et al, 2009).
Plant samples were harvested from the various silenced and control plants. Total
protein was extracted, separated by SDS-PAGE and blotted onto nylon membranes prior
to being probed with antibodies. Figure 4.3a-c shows extracts from the SEX4, LSF1 and
LSF2 silenced plants respectively, in lane 2 to 7 as well as those from the control in lanes
8 to 10. The results are difficult to interpret as all the antibodies appear to demonstrate
much non-specific binding. This would not matter if a specific protein of the correct size
was present in the control and not present in the silenced plants. However, it is not clear
if this is the case in these plants.
Fig 4.3a shows results from the Sex4 silenced plants probed with the anti-SEX4
antibody. No protein of the appropriate size can be seen in lanes from either the silenced

52
or control plants. The LSF1 blot (Fig 4.3b) shows a band of the appropriate size (55kDa)
in control plant lanes 9 and 10. However it is difficult to say if there is repression of this
protein as it still seems to be present within the silenced plants. That could mean that the
silencing did not work, or that there is a protein in N. benthamiana of the same size as
LSF1, which cross reacts with the antibody. From figure 4.3c, a clear band, probably
representing LSF2, was obtained at approximately 25 kDa in the controls (lanes 8 and 9),
with a clear reduction in that particular protein within the silenced plants. The antibodies
were obtained relatively late into this study and due to time constraints this experiment
was not able to be repeated. However to ascertain a more accurate result it this
experiment will be repeated.
4.3.4 Starch contents of Nicotiana benthamiana leaves
Figure 4.4: Starch contents in leaves of N. benthamiana plants infiltrated with A. tumefaciens containing
VIGS vectors. The control plants were infiltrated with the empty TRV2 vector, while the SEX4, LSF1 and
LSF2 plants were infiltrated with TRV2:SEX4, TRV2:LSF1 and TRV2:LSF2 respectively. Figures
* * *

53
represent means ± SEM of 8 independent samples. * denotes a statistically significant difference from the
WT control at the 5% level (Student’s t-test).
Despite the difficulty in confirming repression of the proteins, I measured starch
contents in the leaves of the plants at the end and beginning of the light period (Figure
4.3). The results of this experiment shows that although no significant difference can be
seen in the starch contents of all the lines at the end of the day, the starch contents of the
silenced lines all contain significantly increased amounts of starch when compared to the
control at the beginning of the day. This is an indication that these silenced plants are
repressed in starch degradation. Such a result parallels the literature regarding the starch
excess phenotype observed in mutant Arabidopsis plants lacking the Sex4 and LSF1
proteins (Zeeman and Rees, 1999; Niittylä et al., 2006; Kerk et al., 2006; Kötting et al.,
2009; Comparet-Moss et al, 2009), indicating that they play the same role in tobacco as
in Arabidopsis. This is the first evidence, however, that LSF2 may also play a role in
starch degradation. It is not clear whether or not LSF2 is present in the chloroplast as
there is evidence from computer predictions that the LSF2 protein does not contain the
transit peptide as well as the carbohydrate domain that is seen in the two other isoforms,
and only contains a phosphatase domain (Kötting et al., 2009). Further experimentation
would be required to ascertain the true function of the LSF2 protein, perhaps the glyco-
array mentioned in Chapter 3 can be used to determine the substrate for this protein could
potentially point to the function.

54
Chapter 5
The effect of expression of AtSEX4 in E.coli on glycogen
contents

55
5. The effect of expression of AtSEX4 on glycogen
contents in E. coli
5.1 Introduction
This part of the project aimed at studying the effect that the SEX4 protein has on E. coli
glycogen metabolism. The reason for this is because expression of SEX4 in has been
demonstrated to lead to bacteria that are unable to accumulate glycogen (Dr James Lloyd,
Institute of Plant Biotechnology, University of Stellenbosch, Pers. Comm.). Figure 5.1
shows the results of expression of such an experiment where an empty vector control and
vector allowing expression of the SEX4 gene in wild-type and glgX mutant strains. The
glgX mutant lacks isoamylase, an enzyme that has been shown to be crucial in glycogen
turnover as in the mutant there is decreased glycogen degradation (Dauvillee et al, 2005).
The strains have been grown on rich media and then stained for glycogen production
using iodine. It can be seen that WT expressing SEX4 do not accumulate glycogen, while
the glgx mutant does. The purpose of the work in this chapter is to obtain quantitative
data about how the SEX4 protein affects glycogen accumulation in the different strains. It
is hoped that this will provide information to help explain why SEX4 has the effect that it
does.

56
E. coli Strain Control SEX4
WT
Glgx
Table 5.1: Glycogen accumulation in WT and glgx mutant E. coli strains expressing SEX4 compared to the
empty vector control. Cells were grown on media containing 2% (w/v) glucose and stained with iodine
vapour to examine glycogen accumulation. Photo obtained from Dr James Lloyd.
5.2 Materials and Methods
5.2.1 Escherichia coli strains
The bacterial strains used in this study were obtained from the E. coli Genetic
Resource Centre, Yale University. (http://cgsc.biology.yale.edu). The strains used were a
glgx mutant strain from the Keio collection (Baba et al., 2006; CGSC# 10526) and its
respective WT (CGSC# 7636).
5.2.2 Growth
The AtSEX4 cDNA was present in the pBluescriptSK+ plasmid in sense
orientation with respect to the LacZ promoter. This and the empty vector control were
transformed into both the WT and glgX E. coli strains using the heat shock method.
Transformed bacteria were grown in 2ml overnight cultures before being inoculated into
200ml of liquid media that contained 1.1% (w/v) K2HPO4, 0.85% (w/v) KH2PO4, 0.6%
(w/v) yeast extract and 2% (w/v) glucose. 5 replicates were performed for each strain

57
containing each plasmid. 1ml samples were harvested at 2, 4, 6, 8, 10, 12, 24, 30, 50 and
72hrs after innoculation. The OD600 was determined by taking an absorbance reading at
600nm in order to compare the growth rates of the various strains. After 30 hours, once
the cultures had reached stationary phase, the cells were harvested by centrifugation at
8000g for 10mins at 4°C. These were then re-suspended in M9 minimal media without a
carbon source and further samples were harvested at 50 and 72 hours in order to
investigate the resultant glycogen degradation.
Glycogen contents within the bacteria were determined by using the following
method. 1ml samples of liquid culture were removed from the culture and the cells
harvested by centrifugation at 10000g for 10 minutes and 4°C. The supernatant was
discarded and the pellet re-suspended in 1 ml of 80% (v/v) ethanol by vigorous pipetting.
To remove soluble sugars the samples were heated at 80ºC for 1 hour. This was followed
by centrifugation at 8000g for 10 minutes after which the supernatant was again
discarded. The pellet was re-suspended in 0.4ml of 0.7M HCl and heated at 95ºC for 4
hours. To this 0.4ml of 0.7M KOH was added to neutralize the reaction. The samples
were then vortexed briefly and centrifuged at 10000g for 10 minutes. To measure glucose
a buffer containing 300mM TRIS-HCl pH 8.1, 1mM MgCl2, 1mM NAD, 1mM ATP was
added to 50µl of sample. Then 1U of glucose 6-phosphate dehydrogenase/hexokinase
mix (from Leuconostoc) was added to each of the samples with glucose being determined
by monitoring the change in absorbance at 340nm.

58
5.3 Results and Discussion
5.3.1 E. coli Growth and Glycogen Determination
Figure 5.2: Shows the growth rate and glycogen contents of WT E. coli containing either the empty
pBluescriptSK+ plasmid or one allowing expression of the Arabidopsis SEX4 protein. Figures represent
means ± SEM of 5 samples.

59
Figure 5.3: shows the growth rate and glycogen contents of glgx E. coli containing either the empty
pBluescriptSK+ plasmid or one allowing expression of the Arabidopsis SEX4 protein. Figures represent
means ± SEM of 5 samples
Glycogen contents in both WT and glgX mutant strains expressing the
Arabidopsis SEX4 protein were determined during growth in liquid culture. The glgX
strain lacks the debranching enzyme isoamylase and accumulates glycogen containing
short external chains (Dauvillee et al, 2005). This strain was chosen as it is able to
accumulate glycogen when SEX4 is expressed in it, while the WT does not (Fig 5.1).
One theory for this difference between the WT and glgx mutant would be that the SEX4
protein affects the glycogen somehow so that it is degraded more quickly by GlgX. It is
hoped that experiments such as this will help to explain this phenomonen.
The growth of the various E. coli cultures was monitored to see if there were
differences between them. Figure 5.2 shows the rate of the WT strain either containing
60
the SEX4 protein, or not while Figure 5.3 shows similar data for the glgX mutant. Both
WT lines grew at the same rate indicating that the expression of the SEX4 gene didn’t
influence this. Although there were significant differences in OD600 in the glgX mutant
expressing SEX4 than in the empty vector control between 4 and 12 hours after
inoculation, the rate of increase was not changed. This indicates that the differences in
OD600 are due to the SEX4-expressing glgX coming out of lag phase later than the
control.
Glycogen accumulation was then determined in the lines. The accumulation of the
glycogen in the SEX4 expressing E. coli strain was not significantly different from the
control. This is unexpected as the WT strain expressing SEX4 does not accumulate
glycogen when grown on solid media (Fig. 5.1). I then plated out the cells from the liquid
culture onto solid media and left them to grow overnight before staining with iodine
vapour. In this case the WT expressing SEX4 appeared to accumulate as much glycogen
as the control (data not shown). The most likely explanation for this is that the SEX4 gene
is no longer being expressed in the WT. The strains that this experiment was performed
in contain a wild type RecA gene. RecA is involved in DNA recombination (Howard-
Flanders et al, 1984; DiCapua et al, 1996) and is mutated in most laboratory strains as its
presence leads to plasmid instability. It is likely that this has occurred in this experiment,
although I did not test for the presence of the SEX4 protein using the antibody that I
produced so cannot say for sure. Currently a mutant in this gene is being manufactured
within the Institute of Plant Biotechnology in the TOP10 (Invitrogen) strain in order to
overcome this problem. This strain is mutated in the RecA gene. Once this mutant is
available the experiment will be repeated.

61
Chapter 6
Analysis of carbohydrate metabolism in fruit of a gwd
tomato mutant

62
6. Analysis of carbohydrate metabolism in fruit of a gwd
tomato mutant
6.1 Introduction
As was discussed in the General Introduction (Chapter 1 Section 2) an investigation into
the influence of starch over tomato fruit carbohydrate metabolism would be interesting.
One way to do this has become available with the production of a gwd mutant in tomato
(Nashilevitz et al, 2008). In these lines a transposon has inserted in the GWD gene. The
gwd mutation, however, caused lethality in pollen grains carrying the mutation due to
their inability to degrade starch (Nashilevitz et al., 2009) and meant that the mutation
from the original heterozygous line could only be propagated as a heterozygote. This
problem was overcome by manufacturing a plant transformation construct where the
potato GWD cDNA was driven in sense orientation by the pollen specific LAT52
promoter (Twell et al., 1990). The construct was transformed into wild-type tomatoes,
and lines expressing the potato cDNA were crossed into the heterozygote mutant. Plants
were then identified which were homozygous for the mutation which expressed the
potato GWD in their pollen (Nashilevitz et al., 2009).
The conditional gwd mutant described above demonstrates the normal starch excess
phenotype in leaves (Nashilevitz et al., 2009) as described in other GWD repressed plants
(Lorberth et al, 1998; Yu et al, 2001). This demonstrates that the GWD has the same
effect on leaf metabolism in tomatoes as it does in potato and Arabidopsis. It is not clear
whether the mutation in the GWD gene will also repress starch degradation in tomato
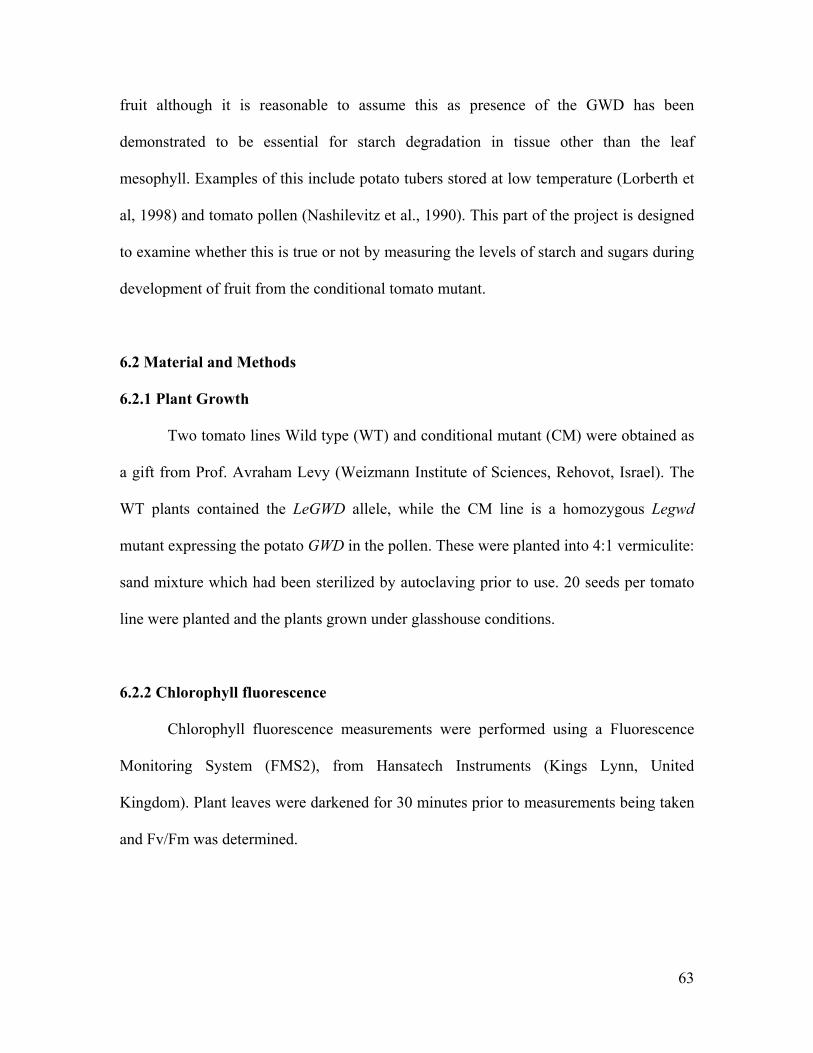
63
fruit although it is reasonable to assume this as presence of the GWD has been
demonstrated to be essential for starch degradation in tissue other than the leaf
mesophyll. Examples of this include potato tubers stored at low temperature (Lorberth et
al, 1998) and tomato pollen (Nashilevitz et al., 1990). This part of the project is designed
to examine whether this is true or not by measuring the levels of starch and sugars during
development of fruit from the conditional tomato mutant.
6.2 Material and Methods
6.2.1 Plant Growth
Two tomato lines Wild type (WT) and conditional mutant (CM) were obtained as
a gift from Prof. Avraham Levy (Weizmann Institute of Sciences, Rehovot, Israel). The
WT plants contained the LeGWD allele, while the CM line is a homozygous Legwd
mutant expressing the potato GWD in the pollen. These were planted into 4:1 vermiculite:
sand mixture which had been sterilized by autoclaving prior to use. 20 seeds per tomato
line were planted and the plants grown under glasshouse conditions.
6.2.2 Chlorophyll fluorescence
Chlorophyll fluorescence measurements were performed using a Fluorescence
Monitoring System (FMS2), from Hansatech Instruments (Kings Lynn, United
Kingdom). Plant leaves were darkened for 30 minutes prior to measurements being taken
and Fv/Fm was determined.
64
6.2.3 Soluble sugar and starch measurements
For measurement of starch from leaf samples, discs of about 30mm2 were
harvested at the beginning and end of the day using a cork borer. Similarly starch as well
as sugar measurements were also performed from fruit material where 25 mg samples
were taken from the inner (placenta) or outer (pericarp) tissue of the tomato fruit at green,
breaker and red stages. To these samples 1ml of 80% (v/v) ethanol was added to each
disc (or fruit sample) in a micro-centrifuge tube and heated at 80°C for 1 hour to remove
soluble sugars. The ethanol was removed and used to determine glucose, fructose and
sucrose amounts by the following method. 50µl of the sample was combined with 250 µl
of assay buffer (10mM MOPS (pH 6.9), 5mM MgCl2, 1mM ATP, 1mM NAD, 1U/ml
glucose-6-phosphate dehydrogenase from Leuconostoc. Glucose, sucrose and fructose
were determined by measuring the increase in absorbance at 340nm following the
sequential addition of 1U/ml hexokinase, 1U/ml phosphoglucoisomerase and excess β-
fructosidase.
For determination of starch the ethanol extracted sample was further washed with
1ml 80% (v/v) ethanol. The liquid was removed and 0.4ml 0.2M KOH was added and
heated at 95°C for 1 hour to solubilise the starch and then neutralised by addition of 70µl
of 1M acetic acid. 10µl of this was mixed with 10µl of 50mM NaAC pH 5.6 and 10U/ml
amyloglucosidase and incubated at 37°C for 2 – 3 hours. Assay buffer containing 10mM
MOPS (pH 6.9), 5mM MgCl2, 1mM ATP, 1mM NAD was added to the sample and the
amount of glucose was determined by addition of 1U/ml glucose 6-phosphate
dehydrogenase from Leuconostoc and following the change in absorbance at 340nm.

65
6.3 Results and Discussion:
Figure 6.1: Micro-tom tomato plants: a) Wild Type (WT); b) Conditional Mutant (CM)
Figure 6.1 shows the two plant lines that were analysed during this study a) WT and b)
CM. The plants appeared phenotypically identical.
b)a)

66
6.3.1 Chlorophyll Fluorescence
Figure 6.2: Fv/Fm in WT and CM lines. The measurements were determined following 30 minutes of
darkening. Values represent means ± SEM of 7 separate measurements. * denotes a statistically significant
difference from the WT control at the 5% level (Student’s t-test).
The results of the chlorophyll fluorescence indicate that both of the WT and CM
plant lines (shown in Figure 6.1) have an Fv/Fm value between 0.8 and 0.9, which is an
indication that both plants have normal levels of photosynthesis. Fv/Fm is described as
the quantum efficiency or yield of photosynthesis. The yield is a measure of how
effectively photosynthesizing material can assimilate light or photosynthesize (Parkhill et
al, 2001). It is effectively a measure of how well a plant is able to use solar energy to
produce fixed carbon. Dark adapted values of Fv/Fm reflect the potential quantum
efficiency of photo-system II (PSII) and are used as a sensitive indicator of plant
photosynthetic performance (Maxwell and Johnson, 1999). Optimum values of 0.83 have
been recorded for most plant species (Bjorkman and Demming, 1987; Johnson et al
*

67
1993). The results indicate that there is a small, but significant increase in Fv/Fm in the
CM. Fv/Fm has been used as a proxy for photosynthetic carbon fixation, although some
caution should be used in interpreting this without measuring that parameter also. This
was not done and should be included in future experiments.
If the increase in Fv/Fm observed in the CM is indeed a result of increased carbon
fixation it is interesting to speculate that this might come about to compensate for an
inability to export sucrose at night in the CM. Normally starch is broken down in leaves
at night and converted to sucrose for export and as starch degradation is impaired in the
mutant that metabolic route cannot happen. Although I did not measure export from the
leaves it is likely that this will be increased during the daytime and decreased at night as
was demonstrated in the Arabidopsis sex1 (gwd) mutant (Zeeman and ap Rees, 1999),
which might mean that photosynthesis would increase to produce more sucrose during
the day. It should be said, however, that in the study of Zeeman and ap Rees (1999) they
measured carbon fixation in the mutant and could find no difference with the wild type
control. Given that the difference seen in the CM was relatively small, it cannot be ruled
out that this is a type 1 error, and the experiment should be repeated to examine this
6.3.2 Starch analysis in leaves
It has previously been demonstrated using iodine staining that the CM contains
starch in its leaves at the end of the dark period (Nashilevitz et al., 2009). In order to
obtain some quantitative data about this I took samples from the leaves at the beginning
and end of the night and measured starch contents (Fig 6.3) The results obtained in this
experiment shows that the starch content of leaves from the CM is significantly higher

68
than that of the WT both at the beginning and the end of the day. This indicates that the
CM is repressed in starch degradation in its leaves and is consistent with the known role
of the GWD in starch mobilisation in other plants (Lorberth et al 1998; Yu et al, 2001).
Figure 6.3: Starch contents at the beginning and end of the day in WT and CM lines. Figures represent
means ± SEM of 8 individual samples. * denotes a statistically significant difference from the WT control
at the 5% level (Student’s t-test).
6.3.3 Starch and Soluble sugar analysis in developing fruits
Figure 6.4: green, breaker (orange) and red tomato fruits harvested from the various lines for analysis. Each
individual fruit was separated into the pericarp, which is the outer tissues of the fruit and into the placenta
tissue, which are the inner tissues.
**

69
Figure 6.4 shows the different developmental stages of the tomato fruit as it
proceeds in ripening from green (left) through breaker (orange) to red fruits. In this study
we aimed to establish what was happening to the carbohydrate metabolism through fruit
development, specifically looking at the starch and soluble sugar content of the fruit. This
was done by harvesting the fruit at these three different developmental stages.
6.3.4 Starch content in tomato fruit
Figure 6.5: Starch content of pericarp (PE) and placenta (PL) of green (G), breaker (B) and red (R) fruit in
the WT and CM lines. Figures represent means ± SEM of 5 individual samples. * denotes a statistically
significant difference from the WT control at the 5% level (Student’s t-test).
I measured starch contents in the placenta and pericarp in green, breaker and red
fruit. The data for starch contents in the fruits indicates that there is little difference
between the WT and CM. The fruits were harvested from both plant lines at different
developmental stages and are shown in Figure 6.4. The only significant changes were in
*
*

70
the pericarp in green fruit (where the CM contained less starch) and in the placenta in red
fruit (where the CM contained more starch) (Fig 6.5). This data differs from that of
Obiadalla-Ali et al (2003) in that there is no significant decrease in starch contents during
fruit development. In that study it was shown that starch decreases in both the placenta
and pericarp during development, and that in red fruit it is almost non-existent. The most
likely reason for this is that differences in growth conditions between the studies may
influence fruit metabolism. The plants in this study were grown under natural light
conditions during the spring which meant that the plants were grown with 13 hours light
and 11 hours of darkness. In the study of Obiadalla-Ali et al (2003) in contrast the plants
were grown with 16 hours light and 8 hours dark.
6.3.5 Soluble sugar content in tomato fruit
a)
*
***
*
71
Figure 6.6 a) Glucose, b) Fructose and c) Sucrose content of placenta (PL) and pericarp (PE) of green (G),
breaker (B) and red (R) fruit in the WT and CM lines. Figures represent means ± SEM of 5 individual
samples. * denotes a statistically significant difference from the WT control at the 5% level (Student’s t-
test).
When examining soluble sugar levels, it seems clear that there are significant
differences between the CM and WT (Fig 6.6a-c). Glucose and fructose are reduced in
b)
*
**
**
*
c)
**

72
the CM in both the pericarp and placenta at all stages, while sucrose is reduced in the
pericarp in red fruit, and in the placenta at the green and breaker stages. Taken together
this indicates that soluble sugar levels are reduced in all tissue types in the fruit at all
stages. Given that the starch content in the fruit was not changed in the CM compared
with the WT, it cannot be that these changes are due to a decrease in starch degradation in
the CM. The more likely explanation would be that it is due to a decrease in soluble sugar
export from the leaves to the fruits. This theory is contradicted somewhat by the
chlorophyll fluorescence measurements which suggest an increased rate of
photosynthesis in the CM. As carbon fixation and export wasn’t measured, it isn’t
possible to show conclusively that the plants export more sugar to the fruits. In addition
I was not able to see if the GWD protein was present within the fruit. I
investigated this by performing an immunoblot, where total protein extracted from the
fruit were tested against the potato GWD antibody (data not shown). In the CM, GWD
expression is driven by a pollen specific promoter. It is highly unlikely that the protein is
expressed in the fruit; however since I could not establish the presence of the GWD
protein I assume it was being repressed as in the study by Twell et al, 1990. In that study
the activity of the GUS: Lat52 fusion protein was tested by performing a GUS assay,
which indicated that tomato plants exhibited high levels of GUS activity in extracts from
mature anthers, with essentially no GUS activity in other vegetative or floral organs,
including fruit pericarp and seeds (Twell et al, 1990).

73
The study was designed to examine carbohydrate metabolism in a conditional
tomato gwd mutant. I used a chlorophyll fluorometer to measure Fv/Fm in the leaves, as
well as measuring starch in leaves and fruit and soluble sugars in the fruit. Although
Fv/Fm was significantly increased in leaves of the CM, this was a very small increase and
is inconsistent with data from another gwd mutant (Zeeman and Rees, 1999) where no
change in photosynthesis was noted. The data in fruit is also puzzling as there is a clear
and consistent decrease in soluble sugars in the fruits of the CM, but no change in starch
contents. One of the problems with this study is that the fruits were only taken in the
green, breaker and red fruit stages, and no account was made for age. In a previous study
on sugar and starch levels in fruits of the Microtom variety flowers were tagged at
anthesis and only one fruit per bunch was allowed to develop (Obiadalla-Ali et al 2003).
In that study it was shown that fruits stay different colours for relatively long periods of
time, during which metabolite levels change. This is especially true for green fruit. By
not taking such developmental changes into account the data from this study become very
difficult to interpret. As such I would recommend that the study is repeated in the same
manner as was performed by Obiadalla-Ali et al (2003).

74
Chapter 7
Conclusions

75
7. Conclusions
The project required that constructs be built to allow SEX4, LSF1 and LSF2 to be
expressed in E.coli as well as to be silenced in Nicotiana bethamiana. The proteins were
expressed in bacteria with the SEX4 and LSF2 fusion proteins being successfully purified
and used to raise antibodies against the respective proteins. The antibodies were required
to ascertain whether or not the starch excess phenotype I obtained in the VIGS silencing
experiment could be attributed to the result of these proteins being repressed.
Unfortunately the antibodies were not very specific with a large amount of non-specific
binding being observed. This resulted in not being able to determine whether the starch
excess phenotype noticed in leaves was due to the silencing of these specific three genes.
Starch degradation products were also produced which will be used in glyco-arrays to
help establish the substrate for the various SEX4 and LSF proteins. Finally the role of
starch phosphate in tomato fruit was assessed. A conditional gwd mutant was examined
for starch and soluble sugar contents during fruit development. Although soluble sugar
levels were reduced in all fruit stages tested, starch contents were not. This is most likely
due to green fruits being harvested too late at times when they did not contain starch.
76
Reference List
• An G, Ebert PR, Mitra A and Ha SB. 1988. Binary vectors. In Plant Molecular
Biology Manual A3:1-19.
• Asamizu E, 2007. Tomato genome sequencing: deciphering the euchromatin
region of the chromosome 8. The Plant Biotechnology 24: 5-9.
• Baba, T., Ara, T., Hasegawa, M., Takai, Y., Okumura, Y., Baba, M., Datsenko,
K.A., Tomita, M., Wanner, B.L. and Mori, H. Construction of Escherichia coli K-
12 in-frame, single-gene knock-out mutants -- the Keio collection. Molecular
Systems Biology doi:10.1038/msb400050.
• Baldwin PM, Melia CD and Davies MC, 1997. The surface chemistry of starch
granules studied by time-of-flight secondary ion mass spectrometry. Journal of
Cereal Science 26: 329-346.
• Ball SG and Morell MK, 2003. From bacterial glycogen to starch. Annual
Review of Plant Biology 54:207-33.
• Baulcombe DC, 1999. Fast forward genetics based on virus-induced gene
silencing. Current Opinion in Plant Biology 2:109-113.

77
• Baunsgaard L, Lütken H, Mikkelsen R, Glaring MA, Pham TT and Blennow A,
2005. A novel isoform of glucan, water dikinase phosphorylates
prephosphorylated α-glucans and is involved in starch degradation in Arabidopsis.
Plant Journal 41: 595-605.
• Bernstein E, Caudy AA, Hammond SM and Hannon CJ, 2001. Role for a
bidentate ribonuclease in the initiation step of RNA interference. Nature 409:
363-366.
• Björkman O and Demming B, 1987. Photon yield of O2 evolution and
chlorophyll fluorescence at 77k among vascular plants of diverse origins. Planta
170: 489-504.
• Blennow A, Engelsen SB, Munck L and Moller BL, 2000. Starch molecular
structure and phosphorylation investigated by a combined chromatographic a
chemometric approach. Carbohydrate Polymers 41: 163-174.
• Blennow A, Engelsen SB, Nielsen TH, Baunsgaard L and Mikkelsen R, 2002.
Starch phosphorylation: a new front line in starch research. Trends in Plant
Science 7: 445-450
78
• Burch-Smith TM, Anderson JC, Martin GB and Dinesh-Kumar SP, 2004.
Applications and advantages of virus-induced gene silencing for function studies
in plants. The Plant Journal. 39:734-746.
• Burton RA, Gibeaut DM, Bacic A, Findlay K, Roberts K, Hamilton A,
Baulcombe DC and Finchera GB, 2000. Virus-induced silencing of a plant
cellulose synthase gene. The Plant Cell 12: 691-705.
• Burton RA, Jenner H, Carrangis L, Fahy B, Fincher GB, Hylton C, Laurie DA,
Parker M, Waite D, van Wegen S, Verhoeven T and Denyer K, 2002. Starch
granule initiation and growth are altered in barley mutants that lack ISA activity.
Plant Journal 31: 97-112.
• Bustos R, Fahy B, Hylton CM, Seale R, Nebane NM, Edwards A, Martin C and
Smith, AM, 2004. Starch granule initiation is controlled by a heteromultimeric
ISA in potato tubers. Proceedings of the National Academy Science of the USA
101: 2215-2220.
• Carrari F and Fernie AR, 2006. Metabolic regulation underlying tomato fruit
development. Journal of Experimental Botany 57: 1883-1897.

79
• Chengappa S, Loader N and Shields N, 1998. Cloning expression and mapping of
a second tomato (Lycopersicum esculentum) sucrosesynthase gene, Sus 3
(accession nos. AJ011319, AJ011534) (PGR98-190). Plant Physiology 118: 15-33
• Comparot-Moss S, Kötting O, Stettler M, Edner C, Graf A, Weise SE, Streb S,
Lue WL, MacLean D, Ritte G, Steup M, Chen J, Zeeman SC and Smith AM,
2009. A Putative Phosphatase, SEX4L1, is required for normal starch turnover in
Arabidopsis leaves. Plant Physiology. In Press
• Constantin GD, Krath BN, MacFarlane SA, Nicolaisen M, Johansen IE, Lund OS,
2004. Virus-induced gene silencing as a tool for functional genomics in a legume
species. Plant Journal 40: 622-631.
• Dale JE, 1969. Gibberellins and early growth in seedlings of Phaseolus vulgaris.
Planta 89: 155-64.
• Dauvillée D, Kinderf IS, Li Z, Kosar-Hashemi B, Samuel MS, Rampling L, Ball
S and Morell MK, 2005. Role of the Escherichia coli glgX gene in glycogen
metabolism. Journal of Bacteriology 187: 1465-1473.
• D’Aoust MA, Yelle S, Nguyen-Quoc B, 1999. Antisense inhibition of tomato
fruit sucrose synthase decreases fruit setting and the sucrose unloading capacity of
young fruit. The Plant Cell 11: 2407-2418.

80
• Delatte T, Umhang M, Trevisan M, Eicke S, Thorneycroft D, Smith SM and
Zeeman SC, 2006. Evidence for distinct mechanisms of starch granule
breakdown in plants. The Journal of Biological Chemistry 281: 12050-12059.
• DiCapua, E., Cuillel, M. Hewat, E., Schnarr, M., Timmins, P.A. and Ruigrok,
R.W. (1992). The inactive form of recA protein: the 'compact' structure. Journal
of Molecular Biology. 226: 707-719.
• Dinesh-Kumar SP, Anandalakshmi R, Marathe R, Schiff M, Liu Y, 2003. Virus-
Induced Gene Silencing. Plant Functional Genomics 236: 287-293.
• Dinges JR, Colleoni C, James MG and Myers AM, 2003. Mutational analysis of
the pullulanase-type debranching enzyme of maize indicates multiple functions in
starch metabolism. Plant Cell 15: 666-680.
• Ding XS, Schneider WL, Chaluvadi SR, Mian MA, Nelson RS, 2006.
Characterization of a Brome mosaic virus strain and its use as a vector for gene
silencing in Monocotyledonous hosts. Molecular Plant–Microbe Interactions 11:
1229-1239.
• Dunn G. 1974. A model for starch breakdown in higher plants. Phytochemistry
13: 1341-46.
81
• Edner C , Li J, Albrecht T, Mahlow S, Hejazi M, Hussain H, Kaplan F, Guy C,
Smith SM, Steup M and Ritte G, 2007. Glucan, water dikinase activity stimulates
breakdown of starch granules by plastidial β-amylases. Plant Physiology 145: 17-
28.
• Elbashir SM, Martinez J, Patkaniowska A, Lendeckel W and Tuschi T, 2001.
Functional anatomy of siRNAs for mediating efficient RNAi in Drosophila
melanogaster embryo lysate. The EMBO Journal 20: 6877-6888.
• Fincher GB, 1989. Molecular and cellular biology associated with endosperm
mobilization in germinating cereal grains. Annual Review of the Plant
Physiology .Plant Moleclar Biology: 40, 305-346
• Fire A, Xu S, Montgomery MK, Kostas SA, Driver SE, Mello CC, 1998. Potent
and specific genetic interference by double-stranded RNA in Caenorhabditis
elegans. Nature 391: 806-811.
• Fofana IBF, Sangare A, Collier R, Taylor C, Fauquet CM, 2004. A geminivirus-
induced gene silencing system for gene function validation in cassava. Plant
Molecular Biology 56: 613-624.

82
• Fordham-Skelton AP, Chilley P, Lumbreras V, Reignoux S, Fenton TR, Dahm
CC, Montserrat P and Gatehouse JA, 2002. A novel higher plant protein tyrosine
phosphatase interacts with SNF1-related protein kinases via a KIS (kinase
interaction sequence) domain. Plant Journal 29: 705-715.
• Fridman E, Carrari F, Liu YS, Fernie AR, Zamir D. 2004. Zooming in on a
quantitative trait for tomato yield using interspecific introgressions. Science
305:1786–1789.
• Fulton DC, Stettler M, Mettler T, Vaughan CK, Jing Li J, Francisco P, Gil M,
Reinhold H, Eicke S, Messerli G, Dorken G, Halliday, K, Smith AM, Smith SM
and Zeeman SC, 2008. β-amylase4, a non-catalytic protein required for starch
breakdown, acts upstream of three active β-amylases in Arabidopsis chloroplasts.
The Plant Cell 20: 1040-1058.
• Gallant DJ, Bouchet B and Baldwin PM, 1998. Microscopy of starch: evidence of
a new level of granule organization. Carbohydrate Polymers 32: 177-191.
• Gérard C, Colonna P, Buléon A, Planchot V, 2001. Amylolysis of maize mutant
starches. Journal of the Science of Food and Agriculture 81: 1281-1287.

83
• Gould B and Kramer EM, 2007. Virus-induced gene silencing as a tool for
functional analyses in the emerging model plant Aquilegia (columbine,
Ranunculaceae). Plant Methods 3: 6.
• Hammond SM, Bernstein E, Beach D and Hannon G, 2000. An RNA-directed
nuclease mediates post-transcriptional gene silencing in Drosophila cell extracts.
Nature 404: 293-296.
• Hannon GJ, 2002. RNA interference. Nature 418: 244-251.
• Hernandez C, Visser PB, Brown DJ and Bol JF, 1997. Transmission of tobacco
rattle virus isolate PpK20 by its nematode vector requires one of the two non-
structural genes in the viral RNA 2. Journal of General Virology 78: 465-467.
• Hejazi M, Fettke J, Haebel S, Edner C, Paris O, Frohberg C, Steup M and Ritte G,
2008. Glucan, water dikinase phosphorylates crystalline maltodextrins and
thereby initiates solubilization. The Plant Journal 55: 323-334.
• Hejazi M, Fettke J, Paris O and Steup M, 2009. The two plastidial starch-related
dikinases sequentially phosphorylate glucosyl residues at the surface of both the
A- and B-allomorph of crystallized maltodextrins but the mode of action differs.
Plant Physiology Preview 10: 104-109.

84
• Hizukuri S, Tabata S, Kagoshima, Nikuni Z, 1970. Studies on Starch Phosphate
Part 1. Estimation of glucose-6-phosphate residues in starch and the presence of
other bound phosphate(s) Staerke 22: 338–343
• Howard-Flanders P, West SC. and Stasiak A. (1984).The binding of RecA protein
to duplex DNA molecules is directional and is promoted by a single stranded
region. Nature, 309, 215-220.
• Hussain MH, Mant A, Seale R, Zeeman SC, Hincliffe E, Edwards A, Hylton C,
Bornemann S, Smith AM and Martin C, 2003. Three isoforms of isoamylase
contribute different catalytic properties for debranching of potato glucans. Plant
Cell 15: 133-149.
• Hussain MH, 2002. Analysis of debranching enzymes from pea and potato. PhD
thesis. University of East Anglia, Norwich, UK
• Jane J, Chen YY, Lee LF, McPherson AE, Wong KS, Radosavljevic M and
Kasemsuwan T, 1999. Effects of amylopectin branch chain length and amylose
content on the gelatinization and pasting properties of starch. Cereal Chemistry
76: 629-637.
85
• Jobling, S.A., Schwall, G.P. Westcott, R.J. Sidebottom, C.M. Debet, M. Gidley,
M.J. Jeffcoat, R. & Safford, R. 1999. A minor form of starch branching enzyme in
potato (Solanum tuberosum L.) tubers has a major effect on starch structure:
Cloning and characterisation of multiple forms of SBE A. Plant Journal 18, 163-
171.
• Jobling SA, Westcott RJ, Tayal A, Jeffcoat R and Schwall GP. 2002. Production
of a freeze-thaw-stable potato starch by antisense inhibition of three starch
synthase genes. Nature Biotechnology. 20: 295-299
• Johnson GN, Young AJ, Scholes JD and Horton P, 1993. The dissipation of
excess excitation energy in British plant species. Plant, Cell and Environment 16:
673-679.
• Juliano BO and Varner JE, 1969. Enzymic degradation of starch granules in the
cotyledons of germinating peas. Plant Physiology 44: 886-892.
• Kaplan F and Guy CL, 2005. RNA interference of Arabidopsis β-amylase
prevents maltose accumulation upon cold shock and increases sensitivity of PSII
photochemical efficiency to freezing stress. Plant Journal 44: 730-743.
• Kerk D, Conley TR, Rodriguez FA, Tran HT, Nimick M, Muench DG and
Moorhead GBG, 2006. A chloroplast-localized dual-specificity protein

86
phosphatase in Arabidopsis contains a phylogenetically dispersed and ancient
carbohydrate-binding domain, which binds the polysaccharide starch. The Plant
Journal 46: 400-413.
• Klann EM, Hall B, Bennett AB. 1996. Antisense acid invertase (TIV1) gene alters
soluble sugar composition and size in transgenic tomato fruit. Plant Physiology
112: 1321-1330.
• Kötting O, Pusch K, Tiessen A, Geigenberger P, Steup M and Ritte G, 2005.
Identification of a novel enzyme required for starch metabolism in Arabidopsis
leaves. The phosphoglucan, water dikinase. Plant Physiology 137: 242–252.
• Kötting O, Santelia D, Edner C, Eicke S, Marthaler T, Gentry MS, Comparot-
Moss S, Chen J, Smith AM, Steup M, Ritte G, Zeeman SC (2009)
STARCHEXCESS4 is a laforin-like phosphoglucan phosphatase required for
starch degradation in Arabidopsis thaliana. Plant Cell 21: 334-346
• Kossmann J, Abel GJW, Springer F, Lloyd JR and Willmitzer L. 1999. Cloning
and functional analysis of a cDNA encoding a starch synthase from potato
(Solanum tuberosum L,) that is predominantly expressed in leaf tissue. Planta
208: 503-511

87
• Kossman J and Lloyd JR, 2000. Understanding and influencing starch
biochemistry. Critical Review in Plant Science 19: 171-226.
• Kumagai MH, Donson J, della-Cioppa G, Harvey D, Hanley K, and Grill LK,
1995. Cytoplasmic inhibition of carotenoid biosynthesis with virus-derived RNA.
Proceedings of the National Academy of Sciences USA 92, 1679–1683.
• Laemmli UK, 1970. Cleavage of structural proteins during the assembly of the
head of bacteriophage T4. Nature 227: 680-685.
• Liu Y, Schiff M, Marathe R and Dinesh-Kumar SP, 2002. Tobacco Rar1, EDS1
and NPR1/NIM1 like genes are required for N-mediated resistance to tobacco
mosaic virus. The Plant Journal 30: 415-429.
• Lloyd JR, Blennow A, Burhenne K and Kossmann J, 2004. Repression of a novel
isoform of disproportionating enzyme (stDPE2) in potato leads to inhibition of
starch degradation in leaves but not tubers stored at low temperature. Plant
Physiology 134: 1347-1354.
• Lloyd JR, Kossmann J and Ritte G, 2005. Leaf starch degradation comes out of
the shadows. Trends Plant Science 10: 130-137.

88
• Lorberth R, Ritte G, Willmitzer L and Kossmann J, 1998. Inhibition of a starch-
granule-bound protein leads to modified starch and repression of cold sweetening.
Nat. Biotechnol. 16: 473-477.
• Luan S, 2003. Protein phosphatases in plants. Annual Review of the Plant
Biology 54: 63-92.
• Lu S, Lin T and Cao D, 2003. Inverse emulsion of starch-graft-polyacrylamide,
Starch/Starke 55: 222-227.
• Lu Y and Sharkey T, 2004. The role of amylomaltase in maltose metabolism in
the cytosol of photosynthetic cells. Planta 218: 466-73.
• Maxwell K and Johnson GN, 2000. Chlorophyll Fluorescence, a practical guide.
Journal of Experimental Botany 51: 659-668.
• Meenakshi Ganesh I, Subramani D and Halagowder D, 2007. Mucin glycoarray
in gastric and gallbladder epithelia. Journal of Carcinogenesis. 6: 10
• Meissner R, Jacobson Y, Melamed S, Levyatuv S, Shalev G, Ashri A, Elkind Y
and Levy AA, 1997. A new model system for tomato genetics. The Plant Journal
12: 1465-1472.

89
• Mikkelsen R, Baunsgaard L and Blennow A, 2004. Functional characterization of
α-glucan, water dikinase, the starch phosphorylating enzyme. Biochemical
Journal 377: 525-532.
• Nashilevitz S, Melamed-Bessudo C, Aharoni A, Kossmann J, Wolf S and Levy
AA, 2009. The legwd mutant uncovers the role of starch phosphorylation in
pollen development and germination in tomato. The Plant Journal 57: 1-13.
• Nguyen-Quoc B, N'tchobo H, Foyer CH, Yelle S, 1999. Over-expression of
sucrose phosphate synthase increase sucrose unloading in transformed tomato
fruit. Journal of Experimental Botany 50: 785-791.
• Nielsen TH, Wischmann B, Enevoldsen K and Møller BL, 1994. Starch
phosphorylation in potato tubers proceeds concurrently with de novo biosynthesis
of starch. Plant Physiology 105: 111-117.
• Niittylä T, Comparot-Moss S, Lue WL, Messerli G, Trevisan M, Seymour MDJ,
Gatehouse JA, Villadsen D, Smith SM, Chen J, Zeeman SC and Smith AM, 2006.
Similar protein phosphatases control starch metabolism in plants and glycogen
metabolism in mammals. The Journal of the Biological Chemistry. 281: 11815–
11818

90
• Nykänen A, Haley B and Zamore P.D, 2001. ATP requirements and small
interfering RNA structure in the RNA interference pathway. Cell 107: 309-321.
• Obiadalla-Ali H, Fernie AR, Kossmann J and Lloyd JR, 2004. Developmental
analysis of carbohydrate metabolism in tomato (Lycopersicum esculentum cv.
Micro-Tom) fruits. Plant Physiology 120: 196-204.
• Ohyama A, Ito H, Sato T, Nishimura S, Imai T and Hirai M, 1995. Suppression
of acid invertase activity by antisense RNA modifies the sugar composition of
tomato fruit. Plant Cell Physiology 36: 369-376.
• Parkhill JP, Maillet G and Cullen JJ, 2001. Flourescence-based maximal quantum
yield for PSII as a diagnostic of nutrient stress. Journal Phycol 37: 517-529.
• Pilling E and Smith AM, 2003. Growth ring formation in the starch granules of
potato tubers. Plant Physiology 132: 365-371.
• Ratcliff F, Martin-Hernandez AM and Baulcombe DC, 2001. Tobacco rattle virus
as a vector for analysis of gene function by silencing. The Plant Journal 25: 237-
245.

91
• Ritchie S, Swanson SJ and Gilroy S, 2000. Physiology of the aleurone layer and
starchy endosperm during grain development and early seedling growth: new
insights from cell and molecular biology. Seed Sci. Res. 10: 193-212.
• Ritte G, Scharf A, Eckermann N, Haebel S and Steup M, 2004. Phosphorylation
of transitory starch is increased during degradation. Plant Physiology 135: 2068-
2077.
• Ritte G, Lloyd JR, Eckermann N, Rottmann A, Kossmann J and Steup M, 2002.
The starch related R1 protein is an α-glucan, water dikinase. Proceedings
National Academy of Science of the USA. 99: 7166–7171.
• Safford R, Jobling SA, Sidebottom CM, Westcott RJ, Cooke D, Tober KJ,
Strongitharm BH, Russell A and Gidley MJ. (1998) Consequences of antisense
RNA inhibition of starch branching enzyme activity on properties of potato
starch. Carbohydrate Polymers 35, 155–168
• Scheidig A, Fröhlich A, Schulze S, Lloyd JR and Kossmann J, 2002. Down
regulation of a chloroplast-targeted β-amylase leads to a starch-excess phenotype
in leaves. The Plant Journal 30: 581-591.
• Scott JW and Harbaugh BK, 1989. Micro-Tom. A miniature dwarf tomato.
Florida Agricultural Experimental Station Circular S-370: 1–6

92
• Shipp M, Nadella R, Gao H, Farkas V, Sigrist H and Faik A, 2008. Glyco-array
technology for efficient monitoring of plant cell wall glycosyltransferase
activities. Glycoconj Journal. 25: 49-58.
• Sijen T, Fleenor J, Simmer F, Thijssen KL, Parrish S, Timmons L, Plasterk RH,
Fire A, 2001. On the role of RNA amplification in dsRNA-triggered gene
silencing. Cell 107: 465-476.
• Smith AM, Zeeman SC, Thorneycroft D, Smith SM. 2003. Starch mobilization in
leaves. Journal of Experimental Botany 54: 577-583.
• Smith AM, Zeeman SC and Smith SM, 2005. Starch degradation. Annual
Reviews of Plant Biology. 56: 73-98.
• Sun Z and Henson CA, 1990. Degradation of native starch granules by barley α-
glucosidases. Plant Physiology 94: 320-27.
• Sokolov LN, Dominguez-Solis JR, Allary AL, Buchanan BB, and Luan S, 2006.
A redox-regulated chloroplast protein phosphatase binds to starch diurnally and
functions in its accumulation. Proceedings of the National Science. USA. 103:
9732-9737.

93
• Tabata S, Nagata K. and Hizukuri S. (1975).Studies on starch phosphates Part 3.
On the esterified phosphatesin some cereal starches. stärke. 27: 333-335.
• Tarr´ago J and Nicol´as G, 1976. Starch degradation in the cotyledons of
germinating lentils. Plant Physiology. 58: 618-621.
• Twell D, Yamaguchi J and McCormick S, 1990. Pollen-specific gene expression
in transgenic plants: coordinate regulation of two different tomato gene promoters
during microsporogenesis. Development. 109: 705-713.
• Waigh TA, Hopkinson I, Donald AM, Butler MF, Heidelbach F and Riekel C,
1997. Macromolecules. 31, 7980–7984
• Wang MB and Waterhouse PM, 2002. Application of gene silencing in plants.
Current Opinion in Plant Biology 5: 146-150.
• Wattebled F, Dong Y, Dumez S, Delvallée D, Planchot V, Berbezy P, Vyas D,
Colonna P, Chatterjee M, and Ball S, 2005. Mutants of Arabidopsis lacking a
chloroplastic isoamylase accumulate phytoglycogen and an abnormal form of
amylopectin. Plant Physiology138: 184-195.
• Worby CA, Gentry MS and Dixon JE, 2006. Laforin: a dual specificity
phosphatase that dephosphorylates complex carbohydrates. Journal Biological
Chemistry 281: 30412-30418.

94
• Yu TS, Zeeman SC, Thorneycroft D, Fulton DC, Dunstan H, Lue WL, Hegemann
B, Tung SY, Umemoto T and Chapple A, 2005. α-Amylase is not required for
breakdown of transitory starch in Arabidopsis leaves. Journal Biological
Chemistry 280: 9773-9779.
• Yomo H and Varner JE. 1973. Control of the formation of amylases and
proteases in the cotyledons of germinating peas. Plant Physiology 51: 708-713.
• Zeeman SC and Ap Rees TA, 1999. Changes in carbohydrate metabolism and
assimilate export in starch-excess mutants of Arabidopsis. Plant, Cell and
Environment 22: 1445-1453.
• Zeeman SC, Umemoto T, Lue WL, Au-Yeung P and Martin C, 1998. A mutant
of Arabidopsis lacking a chloroplastic isoamylase accumulates both starch and
phytoglycogen. Plant Cell. 10: 1699-1711.
• Zeeman SC, Smith SM and Smith AM, 2007. The diurnal metabolism of leaf
starch. Biochemistry Journal 401: 13-28.