analysis of economic factors that influence net …
TRANSCRIPT

ANALYSIS OF ECONOMIC FACTORS
THAT INFLUENCE NET PROFIT MARGIN
OF PT. UNILEVER INDONESIA FOR 2005 – 2012
By
Rumba Nella Theresia Tarigan
014201000105
A Skripsi Presented to the
Faculty of Business President University
In partial Fulfillment of the Requirements for
Bachelor Degree in Economics Major in Management
February 2014

ii
PANEL OF EXAMINERS
APPROVAL SHEET
The Panel of Examiners declare that the skripsi entitled “ANALYSIS
OF ECONOMIC FACTORS THAT INFLUENCE NET PROFIT
MARGIN OF PT. UNILEVER INDONESIA FOR 2005 – 2012”
that was submitted by Rumba Nella Theresia Tarigan majoring in
Managament from the Faculty of Business was assessed and approved
to have passed the Oral Examinations on February 6th, 2014.
Purwanto, ST, MM
Chair - Panel of Examiners
Ir. Erny E. Hutabarat, MBA
Examiner I
Ir. Farida Komalasari, M.Si.
Examiner II
iii
SKRIPSI ADVISER
RECOMMENDATION LETTER
This skripsi entitled “ANALYSIS OF ECONOMIC FACTORS
THAT INFLUENCE NET PROFIT MARGIN OF PT.
UNILEVER INDONESIA FOR 2005 – 2012” prepared and
submitted by Rumba Nella Theresia Tarigan in partial fulfillment
of the requirements for the degree of Economy – Bachelor in the
Faculty of Business has been reviewed and found to have satisfied the
requirements for a skripsi fit to be examined. I therefore recommend this
skripsi for Oral Defense.
Cikarang, Indonesia, January 17th, 2014
Acknowledged by, Recommended by,
Vinsensius Jajat Kristanto SE., MM., MBA. Ir. Farida Komalasari M.Si
Head, Management Study Program Advisor

iv
DECLARATION OF
ORIGINALITY
I declare that this skripsi, entitled “ANALYSIS OF ECONOMIC
FACTORS THAT INFLUENCE NET PROFIT MARGIN OF PT.
UNILEVER INDONESIA FOR 2005 – 2012” is the best of my
knowledge and belief, an original piece of work that has not been
submitted, either in whole or in part, to another university to obtain a
degree.
Cikarang, Indonesia, January 17th, 2014
Rumba Nella Theresia Tarigan

v
ABSTRACT
The company was founded with the aim of increasing the value of a company that
can provide prosperity for owners or shareholders. In analyzing and assessing the
financial position and the potential or the progress of the company, there are
several factors that need to be considered, and one of the most important is
profitability. Sample taken from one of the largest manufacturing company in
Indonesia, Unilever Indonesia, that has grown to be a leading company of Home
and Personal Care as well as Foods, Beverages, and Ice Cream products in
Indonesia. The performance of Unilever Indonesia could be maintained so that
continuity of business also could be well maintained. Those performances could
be measured by the size of the company’s profitability. The factors affecting the
profitability of Unilever Indonesia that used in this study are the Exchange Rate,
Inflation Rate, Current Ratio, and Sales Growth Rate. While the purpose of this
study was to determine the factors among Exchange Rate, Inflation Rate, Current
Ratio, and Sales Growth Rate that dominantly affect the Net Profit Margin (NPM)
as one of the profitability ratios in company’s financial performance.
The population used for the study are Unilever’s financial statements (internal
factors) that have been audited by public accountant, and the external factors are
taken by Bank Indonesia and Indonesia Bureau of Labor Statistic official website.
All the data, which are secondary data, are taken from 2005 to 2012. For its
sampling in this study used purposive sampling and the method of data analysis
which is used is multiple linear regression analysis.
The results of this study indicate that the Inflation Rate variable has a negative
insignificant effect on NPM, Exchange Rate and Current Ratio have negative
significant on NPM, while Sales Growth Rate has a positive significant effect on
NPM.
Keywords: Profitability, Exchange Rate, Inflation Rate, Currrent Ratio, Sales
Growth, Net Profit Margin.

vi
ACKNOWLEDGEMENT
The author realized that the implementation of research and the completion of this
skripsi is becaused the Lord God who gives blessings of health, strength and
ability as well as people who are always ready to help in all terms and time, God
always gives more according to His will and giving it more than we requested.
Praise and Gratitude therefore the authors give to the Lord God.
A sincere thank you from my heart for my father, Mr. Tarigan and my beloved
mother, who has given birth to, raise, educate, pray and pay for writer in the
study. Precious brothers and sisters, who have supported, helped and comforted at
all times, and also the author’s nephews Alvaro and Theovano who entertain
writer every time.
Acknowledgements the author accompanied respect goes to Mr. Albert
Hasudungan as my adviser during the research implementation, who always give
idea and solution for every part in finishing the research program, and also to Ms.
Farida.
The writer says thanks for BF 1 class that very attractive, cheerful, and colorful.
For all the mates Gandi, Bobby, Efrin, Lentina, Rizka, and Sry who always
support each other.
On this opportunity, the writer also admits could not finish this research without
support from society. So, the writer also appreciate the othe parties those are
impossible to be mentioned one by one who have helped the writer to finish this
research.
And the last for my best friend, the special one, Arjuna Sinuhaji, who always
support, remind, and always help the writer in daily activities, even during this
research completion. Hoping the best for us, and let God do His part on us.

vii
Writer apologizes for any inconveniences and mistakes done during this research
completion and would be responsible for everything written in this skripsi. Writer
expects this research would bring positive contribution(s) to many parties
including students and staffs of President University. Finally, the writer also
admits that if this skripsi still requires a lot of improvemnets concerning the
limited knowledges and abilities. Therefore, writer would be glad to accept any
constructive comments or suggestion given.
Cikarang, Indonesia, January 17th
, 2014
Rumba Nella Theresia Tarigan

viii
TABLE OF CONTENT
PANEL OF EXAMINERS APPROVAL SHEET ............................... i
SKRIPSI ADVISER RECOMMENDATION LETTER .................... ii
DECLARATION OF ORIGINALITY .............................................. iii
ABSTRACT ....................................................................................... iv
ACKNOWLEDGEMENT .................................................................. v
TABLE OF CONTENT .................................................................... vii
LIST OF TABLES ............................................................................. ix
LIST OF FIGURE ............................................................................... x
LIST OF EQUATION ........................................................................ xi
LIST OF ACRONYMS .................................................................... xii
CHAPTER I - INTRODUCTION ............................................... 1-7
1.1. Research Background ................................................................................. 1
1.2. Statement of Problem ................................................................................. 4
1.3. Research Objectives ................................................................................... 5
1.4. Research Limitation ................................................................................... 5
1.5. Definition of Terms .................................................................................... 6
1.6. Significance of the Study ........................................................................... 6
CHAPTER II - LITERATURE REVIEW ................................ 8-23
2.1. Theoretical Review ..................................................................................... 8
2.1.1. Exchange Rate ................................................................................ 8
2.1.2. Inflation Rate ................................................................................ 11
2.1.3. Consumer Price Index .................................................................. 16
2.1.4. Current Ratio ................................................................................ 17
2.1.5. Sales Growth Rate ........................................................................ 18
2.1.6. Net Profit Margin ......................................................................... 19
2.2. Previous Research .................................................................................... 21
2.3. Theoretical Framework ............................................................................ 22
2.4. Hypothesis ................................................................................................ 23
ix
CHAPTER III - RESEARCH METHODOLOGY.................. 24-34
3.1. Research Method ...................................................................................... 24
3.2. Operational Definitions ............................................................................ 25
3.3. Research Instrument ................................................................................. 26
3.4. Data Collection ......................................................................................... 27
3.5. Data Analysis ........................................................................................... 27
3.5.1. Multiple Regression Analysis ...................................................... 27
3.5.2. Classical Assumption Testing ...................................................... 28
3.5.3. Hypothesis Testing ....................................................................... 30
CHAPTER IV - ANALYSIS AND INTERPRETATION ...... 35-55
4.1. Company Profile ....................................................................................... 35
4.1.1. History of Unilever Indonesia ...................................................... 35
4.1.2. Vision of Unilever Indonesia ........................................................ 36
4.1.3. Company Structure ....................................................................... 38
4.1.4. Products ........................................................................................ 39
4.1.5. Most Significant Awards during 2011 – 2012 ............................. 39
4.1.6. Economic Performance Indicator ................................................. 40
4.2. Data Analysis ........................................................................................... 41
4.2.1. Descriptive Statistics .................................................................... 41
4.2.2. Classical Assumption Testing ...................................................... 42
A. Normality Test ........................................................................ 43
B. Multicollinearity Test ............................................................. 43
C. Autocorrelation Test ............................................................... 44
D. Heterocedasticity Test ............................................................ 45
4.2.3. Hypothesis Testing ....................................................................... 46
A. F-Test ..................................................................................... 46
B. T-Test ..................................................................................... 47
4.2.4. R2
: Coefficient of Determination ................................................. 50
4.3. Interpretation of Results ........................................................................... 51
CHAPTER V - CONCLUSION AND RECOMMENDATION
....................................................................................................... 56-58
5.1. Conclusion ................................................................................................ 56
5.2. Recommendation ...................................................................................... 58
REFERENCES ........................................................................... 59-62
APPENDICES ............................................................................ 63-66

x
LIST OF TABLES
Table 4.1. Descriptive Statistics ........................................................................... 42
Table 4.2. Tolerance and VIF for Multicollinearity Test ..................................... 44
Table 4.3. Durbin Watson for Autocorrelation .................................................... 44
Table 4.4. ANOVA Table for F-test .................................................................... 46
Table 4.5. T-test for Variable Significance Test .................................................. 47
Table 4.6. Coefficient of Determination (R2) ....................................................... 51

xi
LIST OF FIGURE
Figure 1.1. Net Profit Margin of Unilever Indonesia ............................................. 4
Figure 2.1. Indonesian Rupiah toward Dollar Graph ............................................. 9
Figure 2.2. Indonesia Inflation Rate Graph .......................................................... 14
Figure 2.3. Theoretical Framework ...................................................................... 22
Figure 4.1 Organizational Structure of Unilever Indonesia ................................. 38
Figure 4.2. Histogram of Regression Standardized Residual .............................. 43
Figure 4.3. Scatterplot for Heterocedasticity Test ............................................... 45
xii
LIST OF EQUATIONS
Equation 1 - Consumer Price Index ..................................................................... 16
Equation 2 – Current Ratio .................................................................................. 17
Equation 3 – Sales Growth Rate .......................................................................... 19
Equation 4 – Net Profit Margin ............................................................................ 20
Equation 5 – Multiple Regressions ...................................................................... 28
Equation 6 – Tolerance and VIF .......................................................................... 30
Equation 7 – Regression Model of the Research ................................................. 47
Equation 8 – Forecasting Model for NPM ........................................................... 57
xiii
LIST OF ACRONYMS
ER : Exchange Rate
IR : Inflation Rate
CR : Current Ratio
SGR : Sales Growth Rate
NPM : Net Profit Margin
ROI : Return On Investment
ROE : Return On Equity
ROCE : Return On Capital Employed
CROCI : Cash Return On Capital Invested
CPI : Consumer Price Index
VIF : Variance Inflationary Factor
SPSS : Statistical Package for Social Science
MNC : Multi National Company


1
CHAPTER I
INTRODUCTION
1.1. Research Background
Profitability is a key point in doing business, without any profitability
measurement, the business will not run so long. Profitability on company always
related to the income and expenses things. Business people need to analyze the
profitability of the business, whether its current profits even the past, so it can be
used to identify the future profits (projecting profitability). For example, if crops
and livestock are produced and sold, income is generated. Borrowing money to be
counted as cash in debit does not create money as the profits. In business, the
transaction of borrowing money to generate the cash is categorized as loan for
operating expenses or buying assets.
Profitability of a company will affect the company policy of investors on
investment. Company’s ability to generate profits will be able to attract the
investors to invest their funds in order to expand its business. And the vice versa,
lower profitability will cause investors to withdraw their funds. As for the
company, profitability itself can be used as an evaluation of the effectiveness for
managing the business. As stated by Peavler, “every firm is most concerned with
its profitability. Profitability measurements are important to company managers
and owners alike. Profitability ratios show a company's overall efficiency and
performance.” (Peavler, 2011).
Profitability ratio is the ratio that aims to determine the company's ability to
generate profits for a certain period and also give an idea of the effectiveness of
management in carrying out its operations. Management effectiveness here seen
from the profit generated on sales and investment companies. This ratio is also

2
called the profitability ratio. Profitability ratio also describes the company's ability
to gain profit through all existing capabilities and resources such as sales
activities, cash, capital, number of employees, number of branches, etc.
There are several ratios that used to describe the profitability. Grimsley explains
that “common examples of profitability ratios include return on sales, return on
investment (ROI), return on equity (ROE), return on capital employed
(ROCE), cash return on capital invested (CROCI), gross profit margin and net
profit margin (NPM).” (Grimsley, 2003). All of these ratios indicate how well a
company performed in generating profits or revenues relative to the certain
metric.
This research uses Net Profit Margin as the dependent variable. Net profit margin
is being used because this research only identifies the basic of profitability, not to
expand the profitability into return or investment side. Companies with profit
margins reflecting competitive advantages are able to improve their market share
during the hard times - leaving them even better positioned when things improve
again. According to McClure, “margin analysis is a great way to understand the
profitability of companies. It tells how effectively management can wring profits
from sales, and how much room a company has to withstand a downturn, fend off
competition and make mistakes.” (McClure, 2011).
Profitability assessment is a process to determine how well the business activities
carried out in order to achieve strategic objectives, eliminate redudancy, and
provide the information in a timely manner to carry out improvements
continuously. Different ratio of profitability has a different role also in determine
the profitability itself, either for the company’s health or for its performance. For
instance, gross profit and net profit ratios are generally used to determine the
expenses thing of the company. More specific, those ratios tell how well the
company manages its expenses.
The use of profitability ratios can be done by using a comparison between the
various components are reported financial balance sheet and profit and loss.

3
Measurements can be made for some period of operation. The goal is to make a
look of the company’s development during certain time, whether it decreases or
increases, as well as find the cause of these changes.
Economic factors are divided into two kinds, macroeconomics and
microeconomics. Macroeconomic factor is the economic factor or variable that
focus on the larger pattern of the economic condition. Most of the macroeconomic
factors are depend on the government decision on economic stability. As stated by
Beggs, macroeconomic is the study of whole economic systems aggregating over
the functioning of individual economic units. It is primarily concerned with
variables which follow systematic and predictable paths of behaviour and can be
analysed independently of the decisions of the many agents who determine their
level. More specifically, it is a study of national economies and the determination
of national income. (Beggs, 2010)
While in the contrast, microeconomic factors is the study that more focus on the
economic condition of the business in the company or household industry.
Microeconomic factors may not affect the economic condition globally because it
is more depend on the company management decision. As explained by
Anderson, microeconomics looks at the behavior of individual people and
companies within the economy. It is based on the idea of a market economy, in
which consumer demand is the driving force behind the prices and production
levels of goods and services. (Anderson, 2008)
The financial condition of beneficial company in one country is an interesting
object to be identified. In this research, PT. Unilever Indonesia is chosen as the
object because of its effect on economic stability of Indonesia. Most of the
households cares in Indonesia are the brands of Unilever, which means most of
Unilever products are using every day by every people for daily needs. People
importance on Unilever products shows that this company has great impact on
Indonesia economic growth by its market share.
4
1.2. Statement of Problem
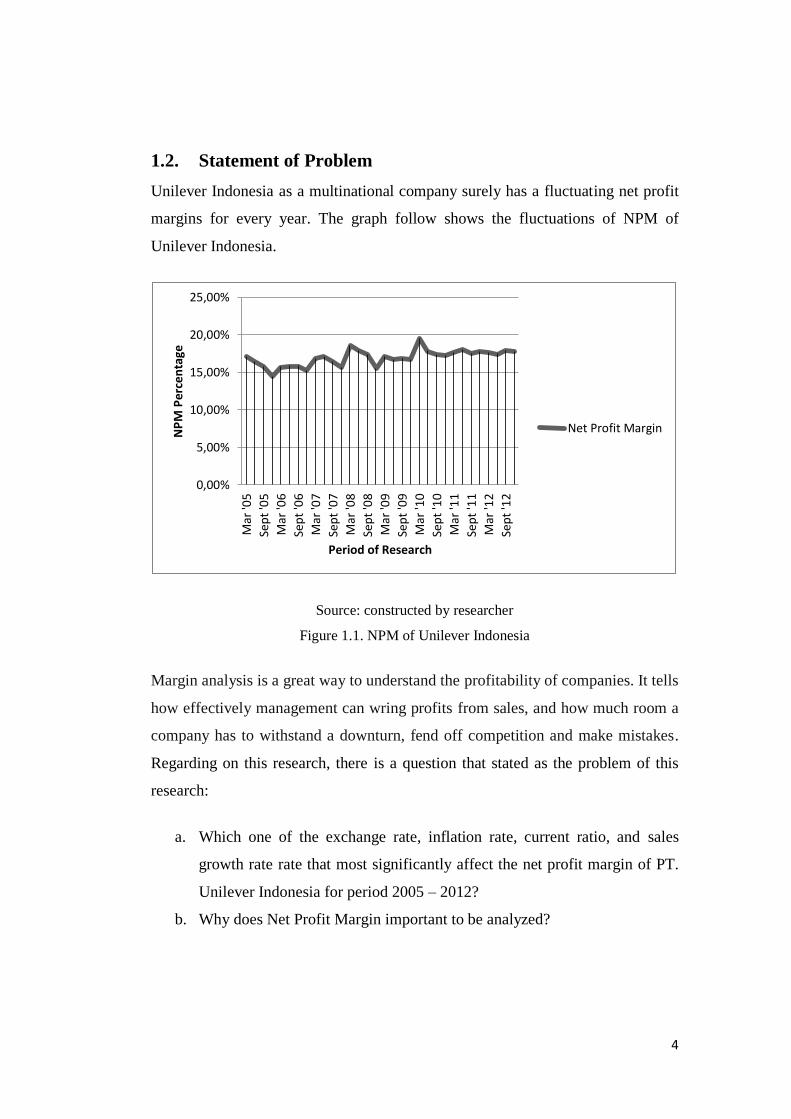
Unilever Indonesia as a multinational company surely has a fluctuating net profit
margins for every year. The graph follow shows the fluctuations of NPM of
Unilever Indonesia.
Source: constructed by researcher
Figure 1.1. NPM of Unilever Indonesia
Margin analysis is a great way to understand the profitability of companies. It tells
how effectively management can wring profits from sales, and how much room a
company has to withstand a downturn, fend off competition and make mistakes.
Regarding on this research, there is a question that stated as the problem of this
research:
a. Which one of the exchange rate, inflation rate, current ratio, and sales
growth rate rate that most significantly affect the net profit margin of PT.
Unilever Indonesia for period 2005 – 2012?
b. Why does Net Profit Margin important to be analyzed?
Mar
'05
Sep
t '0
5
Mar
'06
Sep
t '0
6
Mar
'07
Sep
t '0
7
Mar
'08
Sep
t '0
8
Mar
'09
Sep
t '0
9
Mar
'10
Sep
t '1
0
Mar
'11
Sep
t '1
1
Mar
'12
Sep
t '1
2
0,00%
5,00%
10,00%
15,00%
20,00%
25,00%
Period of Research
NP
M P
erce
nta
ge
Net Profit Margin

5
1.3. Research Objectives
This research has objectives that wanted to be achieved, such as:
a. To identify the dominant factor from both of macro and microeconomics
factors that affects net profit margin of PT. Unilever Indonesia for period
of 2005 -2012.
b. To identify the role of Net Profit Margin on a multinational company.
1.4. Research Limitation
The scope and limitation of the study are made in order to identify the areas to be
included and those which are not included in the study. Since the title of the
research is about analysis of economic variables that influence net profit margin
of PT. Unilever Indonesia for period of 2005 – 2012, there are several scopes and
limitations that being made.
The variables of macroeconomic / external factors (exchange rate and inflation
rate) and microeconomic / internal factors (current ratio and sales growth rate
rate) will be compared to the net profit margin. These variables were selected by
researcher because of the willing to assess how much macroeconomic (external)
and microeconomic (internal) variables influence the net profit margin.
The scope of company that being investigated is one of the giant companies in
Indonesia, PT. Unilever Indonesia. The period of research also limited from
January 2005 to December 2012 due to the researcher’s expectation to have 8
years quarterly data, so there will be 32 data. The length period of data research is
considered sufficient to obtain the expected and also to know the performance of
the company in last eight years, included the years when Indonesia was in
monetary crisis around 2008 – 2009.
The data was collected from reliable source. Exchange rate and inflation rate
were collected from Bank Indonesia, while the Current Ratio, Sales growth rate,

6
and Net Profit Margin were collected from PT. Unilever Indonesia. The data
from Unilever itself were original and after audited by public accountant.
1.5. Definition of Terms
a. Profitability: The state or condition of yielding a financial profit or gain.
b. Return on Sales: Ratio measuring the operating performance of a firm,
expressed as a percentage of sales revenue.
c. Return on Investment: A performance measure used to evaluate the
efficiency of an investment or to compare the efficiency of a number of
different investments.
d. Return on Equity: The amount of net income returned as a percentage of
shareholders equity.
e. Return on Capital Employed: Ratio of net profit of a company to its
capital employed.
f. Cash Return on Capital Invested: A method of valuation that compares a
company’s cash return to its equity.
g. Gross Profit Margin: Ratio of gross profit (gross sales less cost of sales)
to sales revenue.
h. Net Profit Margin: A financial ratio comparing a company’s net profit
after taxes to revenue.
i. Dependent Variable: the variable (Y) in regression model that in which
the element that is being predicted.
j. Independent Variable: the variable (X) in a regression model that is used
to help predict the dependent variable
1.6. Significance of The Study
This research is held for some reasons that absolutely gives several benefits for
the company and academic aspect.

7
1.6.1. For PT. Unilever Indonesia
a. Allow the company to better serve its customers through the contributions
and analysis of the research.
b. Stimulate the investors to invest their money in this company.
c. Provide short-term direction to increase the net profit margin based on the
research’s analysis.
1.6.2. For Academic
a. This research can be used as the reference for next research.
b. Provide the reader with a huge of information about the company itself and
also the factors that influence company’s success.

8
CHAPTER II
REVIEW OF LITERATURE
2.1. Theoretical Review
2.1.1. Exchange Rate
The exchange rate states the price, in terms of one currency, at which another
currency be bought, and thus translate one country’s prices into the currencies of
other nations. Exchange rates therefore influence patterns of world trade. There is
an exchange rate between every pair of currencies. Baumol stated that “for
international trade to take place there must be some way to convert one currency
into another. The rates at which such conversions are made are called exchange
rate.” (Baumol, 2006).
Exchange rate has two condition during the fluctuation, there are condition when
exchange rate sppreciate and depreciate. According to Pettinger (2008), “demand
for a nation’s currency is derived from foreigners’ desires to purchase that
country’s goods and services or to invest in its assets. Under floating rates,
anything that increases the demand for a nation’s currency will cause its
exchange rate to appreciate. Several effects of appreciation are:
a. Exports more expensive, therefore less exports will be demanded
b. Imports are cheaper, therefore more imports will be bought
c. Lower inflation
Adams (2011) also explains a condition when exchange rate said depreciated.
“Supply of a nation’s currency is derived from the desire of that country’s citizens
to purchase foreign goods and services or to invest in foreign assets. Under
floating rates, anything that increases the supply of a nation’s currency will cause
its exchange rate to depreciate. Several effects of depreciation are:

9
a. Exports more competitive and appear cheaper to foreigners. This will
increase demand for exports
b. Imports will become more expensive, then will reduce demand for imports
c. Higher inflation
Economists divide the exchange rate into two: Nominal and Real exchange rate.
Nominal exchange rate is the relative price of domestic currency in terms of
foreign currency. This is the most common type of exchange rate that people
used. Based on Mankiw, “real exchange rate is the relative price of domestic
goods in terms of foreign goods.” (Mankiw, 2007).
Exchange rates are determined by supply and demand. Pettinger stated that
“several factors which determine the demand and supply of a currency, such as:
inflation, interest rate, speculation, changes in competitiveness, relative strength
of other currencies, and balance of payments.” (Pettinger, Exchange Rate -
Macroeconomics, 2008).
Below the chart of Indonesian Rupiah for 2005 – 2012:
Source: www.tradingeconomics.com | OTC Interbank
Figure 2.1. Indonesian Rupiah toward Dollar Graph

10
i. Exchange Rate Fluctuation on Company’s Profitability
The fluctuations of exchange rate is affecting both of economic value and the
company’s value. However, not all company maybe are affected by those
fluctuations. The key point of the fluctuations is its impact on the profits of
company.
Changes in the exchange rate becomes important implications for financial
decision making and profitability of the company. Several empirical studies have
been conducted to analyze the effect of exchange rate changes on the profitability
of the company.
Although the company operates domestically, it may also be influenced by the
exchange rate, if the input and output prices are affected by changes in currency.
The exchange rate is always associated with the net income of the foreign
currency and the profit margin of the company so that the impact of the exchange
rate can be seen directly. Based on Riley statement, “companies with overseas
branches or those trades internationally, are at the mercy of global currency
fluctuations. Currencies change in value against each other all the time. This is
because most currencies are based on flexible exchange rates. Currencies change
in value because there is a change in demand for holding that currency” (Riley,
Economy - Exchange Rates, 2012). Households, governments and businesses
need other countries currencies to buy their goods and services. A change in
exchange rates might affect a business in the following ways:
a. Exchange rates changes can increase or lower the price of a product sold
abroad
b. The price of imported raw materials may change
c. The price of competitors’ products may change in the home market
For example an increase in the exchange rate will mean that price abroad goes up,
lowering sales; price of imported raw materials falls, either leading to a fall in
price and more sales, or an increase in profits; competitors’ prices fall, meaning
lower sales.
11
“Dealing with currency exposure is all about managing risk, as fluctuations are
by their very nature unpredictable. There are four options to counteract the
currency exposure.” (EuroInvestor, 2012).
The simplest approach is just to monitor the changes, and this can be the best
option if companies do not think that they are at a particularly high risk from
exchange rate fluctuations.
Another option is to lock into an exchange rate for a fixed period of time by
setting up a forward contract. If the exposure estimates are correct, this can be a
beneficial approach. Some businesses will also purchase currency in advance if
they know that they will be making big purchases and are concerned about
volatility.
A third option is to hedge against this exposure via derivatives. Although this may
be the most complicated option, it can be effective in limiting exposure to
volatility. It can also give a clearer picture of how a company's overseas
operations are really performing.
Finally, firms can choose to manage their currency exposure through business
practices. Having a truly international company can help with this as,
theoretically, losses made when one currency falls will be recovered when another
rises. Where contracts are concerned businesses can also set up clauses that reduce
this exposure. In many cases this comes in the form of an agreement to protect the
client and the company should exchange rate movements exceed the agreed-upon
level. Some businesses also agree on setting all contracts in their core currency,
protecting them from any exposure as they will always be paid the same relative
amount.
2.1.2. Inflation Rate
Inflation is a trend of increasing in the price level commonly and persistently. The
increase in the price of only one or two items are not referred to as inflation,
unless the increase is extended (or resulting increase) to most of the price of other
12
goods. For a better understanding, “inflation means that your money won’t buy as
much today as you could yesterday.” (Pettinger, 2010)
Increasing prices continuously which can cause inflation caused by the increase in
the value of foreign currency exchange rates significantly the domestic currency.
Inflation rate is the rate at which the general level of prices for goods and services
are rising, and, subsequently, purchasing power is falling. “Central banks attempt
to stop severe inflation, along with severe deflation, in an attempt to keep the
excessive growth of prices to a minimum. As inflation rises, every dollar will buy
a smaller percentage of a good. For example, if the inflation rate is 2%, then a $1
pack of gum will cost $1.02 in a year.
Most countries' central banks will try to sustain an inflation rate of 2-3%.”
(Investopedia, 2013).
But if the increased price in goods and services only one or a few types, cannot be
said to have occurred inflation, as well as the increase of goods and services that
are a surprise (once upon a time or seasonal) such on holidays Islam and
Christmas, also cannot be called with inflation. There is often misunderstanding
of the concept of inflation in the society. Misunderstanding that exist in the
community such as the presumption that level of inflation makes goods prices
become more expensive, and also high inflation rate being a sign that people are
becoming poor.
Inflation actually means the average level of prices has increased. Inflation also
does not always make people become poor if it is followed by an increase in
people's income during the inflation period. Inflation can be both beneficial to
economic recovery and, in some cases, negative. If inflation becomes too high the
economy can suffer; conversely, if inflation is controlled and at reasonable levels,
the economy may prosper.
Inflation is likely to occur because:
a. Imports are more expensive causing cost push inflation.
b. Printing too much money

13
c. Increases in production cost
d. Tax rises
e. Declines in exchange rates
f. Decreases in the availability of limited resources such as food or oil
g. War or other events causing instability
h. With exports becoming cheaper manufacturers may have less incentive to
cut costs and become more efficient. Therefore overtime costs may
increase.
i. Classification of Inflation
In economics theory, inflation can be classified into several categories
(Permatasari, 2008), such as:
Based on its degree of severity:
a. Light Inflation: it happens if there is a price increase that is still below
10% per year.
b. Medium Inflation: it happens if there a price increases for about 11% -
30% per year.
c. Heavy Inflation: it happens if there is a price increase for about 31% -
100% per year.
d. Hyper Inflation: it happens if the inflation is out of control because the
price increases above 100% per year.
Based on its origin:
a. Domestic Inflation: inflation is entirely due to the mismanagement of the
economy either in the real sector or in domestic monetary sector by
economic factors and society.
b. Imported Inflation: inflation is due to increases in prices of commodities
from abroad (in foreign countries that have trade relations with the
countries concerned).

14
ii. Benefit of Inflation
When people see the costs of inflation, they hope economists can help reduce
inflation to zero point. But, some economists believe that sometimes inflation can
bring benefit to the society. Such as:
a. Labor Market Adjustments
Low rate inflation, around 2 to 3 percent a year can bring benefit like nominal of
wages are rarely reduced, even when the equilibrium real wage falls. Inflation
allows the real wages to reach equilibrium levels without nominal wage cuts.
Therefore, low rate inflation improves the functioning of labor markets.
b. Debt Relief
Another benefit is debt relief. Debtors who have debts with a fixed nominal rate
of interest will see a reduction in the “real” interest rate if the inflation rate rises.
The “real” interest on a loan is the nominal rate minus the inflation rate.
c. Economic Growth
Low rate inflation can increase national income and get people excited to work,
make savings and make investment.
Below the chart of Indonesia inflation rate for 2005 – 2012:
Source: www.tradingeconomics.com | Statistics Indonesia
Figure 2.2. Indonesia Inflation Rate Graph

15
iii. Inflation Rate Towards Company’s Profitability
Inflation makes it harder to create value for several reasons, especially when its
annual growth rate exceeds long-term levels of between 2 and 3 per cent, and
becomes unpredictable for managers and investors. When that happens, it can
push up the cost of capital in real terms and lead to losses on net asset positions
that are fixed in nominal terms.
“A country with a low inflation trend makes an attractive proposition for
investment because it suggests economic stability, economic maturity and less risk
associated with the investment. Countries with persistently low inflation make an
attractive place for investment because they offer economic stability which
encourages firms and investors” (Tejvan, 2008).
The business will be affected as the value of all required raw materials like oil,
steel and copper increases. This will also have impact on turnover as there will be
a fall in business due to increased prices. Inflation makes it harder for businesses
to sell goods and services because they are less competitive due to their high
prices.
Constantly increasing prices lead to uncertainty, making planning of production
difficult. Prices need to be raised and this infuriates the consumers who blame
producers for increasing prices. So businesses try to keep from raising prices. As
stated by Mahon, “the raising prices squeeze profit margin and can cause
companies to produce products that sell for less in real terms than they cost to
produce. This surely is a recipe for bankruptcy in the long term.” (Mahon, 2013).
A low inflation rate is beneficial to a country and zero or negative inflation is
considered as bad. Also, a high inflation is harmful to an economy.
According to Manivasugen, “inflation may sometimes actually have this effect in
its early stages. If it raises final selling prices more than it raises wages and other
costs, and if it is expected to be only a temporary condition, it can stimulate
increased investment and increased production.” (Manivasugeni, 2011). But
when the inflation continues and is expected to continue, people begin to make

16
compensating adjustments. Wages, interest rates, raw material prices and other
costs begin to go up as fast as or faster than final retail prices. Profit margins
begin to narrow or to become increasingly uncertain for individual firms. The
"stimulus" of inflation becomes a deterrent.
2.1.3. Consumer Price Index
CPI (Consumer Price Index) is data that measures the average change in prices
paid by consumers (in average) for a certain group of goods and services. CPI is
an inflation indicator that most commonly used and considered also as an
indicator of the effectiveness of government policy. The rise in the CPI indicates
that inflation rates will cause a drop in bond prices and rising interest rates. Unlike
other indicators of inflation, which only cover items of local production, the CPI
also includes imported goods.
As explore on Investopedia, “hard assets, such as a home or real estate, often
increase in value as the CPI rises; however, fixed income instruments - Treasuries
or bank Certificate of Deposits, for example - lose value, because their yields
don't increase with inflation. One notable exception, however, are treasury
inflation protected securities (TIPS). Interest on these securities is paid twice
yearly at a fixed rate as the principal increases in step with the CPI, thus
protecting the investment against inflation.” (Investopedia, 2010)
Bureau of Labor Statistics of Indonesia calculate consumer price index by
measures a price change for a constant market basket of goods and services from
one period to the next within the same area (city, region, or nation). Inflation is
measured by the percentage increase in an index number of prices, which shows
how the cost of some basket of goods has changed over a period of time.
CPI in given year =
x 100
Equation 1- Consumer Price Index formula
17
Because relative prices are always changing, and because different families
purchase different items, no price index can represent precisely the experience of
every family.
2.1.4. Current Ratio
Current ratio is very useful to measure the company's ability to repay its short-
term obligations, which can be seen to how extent the actual amount of current
assets of a company can ensure its current liabilities. Higher ratio means that the
company can assure its debts to the creditors. Loth said that “the current ratio is a
popular financial ratio that used to test a company’s liquidity by deriving the
proportion of current assets available to cover current liabilities. The concept
behind this ratio is to ascertain whether a company’s short-term assets are
readily available to pay off its short-term liabilities.” (Loth, 2010).
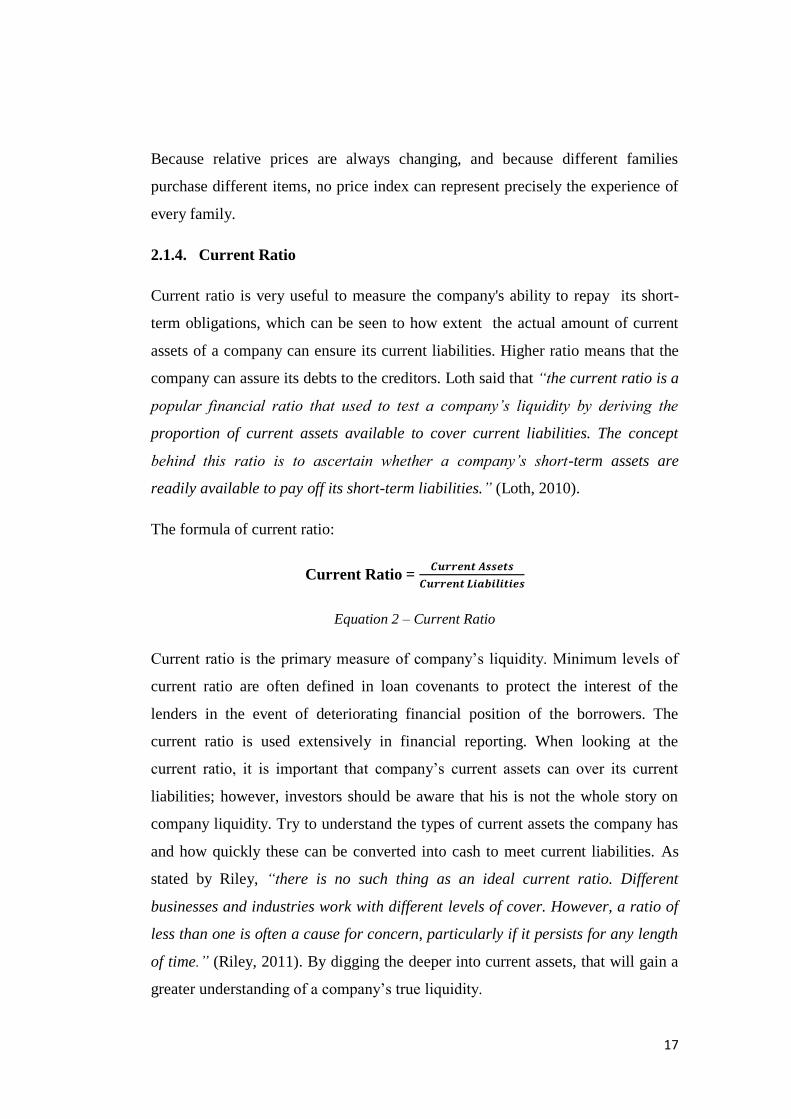
The formula of current ratio:
Current Ratio =
Equation 2 – Current Ratio
Current ratio is the primary measure of company’s liquidity. Minimum levels of
current ratio are often defined in loan covenants to protect the interest of the
lenders in the event of deteriorating financial position of the borrowers. The
current ratio is used extensively in financial reporting. When looking at the
current ratio, it is important that company’s current assets can over its current
liabilities; however, investors should be aware that his is not the whole story on
company liquidity. Try to understand the types of current assets the company has
and how quickly these can be converted into cash to meet current liabilities. As
stated by Riley, “there is no such thing as an ideal current ratio. Different
businesses and industries work with different levels of cover. However, a ratio of
less than one is often a cause for concern, particularly if it persists for any length
of time.” (Riley, 2011). By digging the deeper into current assets, that will gain a
greater understanding of a company’s true liquidity.

18
A current ratio of 2.0 is considered good for most industries. A higher ratio is
generally an indication of a stronger financial position, and may mean there is
cash available for the owner to withdraw. But there are exceptions; high ratios can
sometimes mask hidden financial problems. For instance:
a. An inventory backlog
b. Slow collections on accounts receivable
c. Recent sales of fixed assets
Any of these conditions may reduce the productive capacity of the business or
indicate financial trouble. It is important to look at why the current ratio is high or
low, as well as looking at the number itself.
2.1.5. Sales growth rate Rate
Sales growth rate ratio is ratio measures the company's sales growth rate by
measuring the difference in the value of sales in the period. Sales growth rate is an
indicator of market acceptance of the products or services that produced, and
revenue generated from the sales can be used to measure the rate of sales growth
rate. According to Farlex, “it may result in increasing dividends for shareholders
and / or higher stock price.” (Farlex, 2012).
Sales growth rate helps the management to grow the business by examining the
sales records to identify the sales trends. The company needs new customers,
repeat customers, and more sales in order for the business to grow and profitable.
In most companies, even a five percent sales improvement will have a positive
effect on the bottom line. If a business does not grow its sales volume, it will
become stagnant. Rarely does a company that maintains the same sales volume
year after year thrive.
As a matter of fact, sales growth rate does not occur magically. Revenue growth is
a planned process that takes place as a result of analysis and decision making by
the management. Based on Dunsford statement, “the decisions made by
management are thereafter implemented to result in sales growth rate. The

19
decisions could do with the introduction of new products, expanding to new
markets, new staff and training programs, additional promotional campaigns,
better customer service, better pricing, logistics etc” (Dunsford, 2009). Sales
growth rate must be planned since it affects cash in a big way. Sustaining sales
growth rate takes a lot of planning as it means looking at the business ability to
generate cash without increasing its debt, since this means even more risk.
Because of this, the business might incur more interest charges since suppliers and
lenders might manage their receivables based on the increased risk. This could
place constraints on the inventory, getting in the way of production and
merchandizing.
Sales growth rate can simplify defined as a measure of the percentage increase in
sales between the two time periods.
The formula of sales growth rate rate:
Sales growth rate rate =
x 100% or
=
x 100%
Equation 3 – Sales growth rate Rate
2.1.6. Net Profit Margin
According to Alexandri, “net Profit Margin (NPM) is a ratio that used to indicate
the company’s ability to gain the net profit after taxes” (Alexandri, 2008).
As stated by Bastian in his book, “net profit margin is a comparison or ratio
between net income and sales” (Bastian, 2006). High NPM ratio indicates a better
productivity of the company that can improve the belief of the shareholders to
invest in that company. This ratio shows how much the percentage of net income
from every sale, the higher the ratio, the better company’s ability to gain higher
profit.
20
Net profit margin is very useful when comparing companies in similar industries.
A higher profit margin indicates a more profitable company that has better control
over its costs compared to its competitors. The formula of Net Profit Margin:
Net Profit Margin =
x 100%
Equation 4 – Net Profit Margin
This figure shows how large a percentage of revenue generated any sales. The
greater this ratio, the better because it is considered the company's ability to earn
income is high enough.
It is important to reiterate that, in some cases; lower net profit margins represent a
pricing strategy and are not a failure on part of management. As stated by
Kennon, “some businesses, especially retailers, some discount hotels, or some
chain restaurants, may be known for their low-cost, high-volume approach. In
other cases, a low net profit margin may represent a price war which is lowering
profits.” (Kennon, 2009).
The higher the margin is, the more effective the company is in converting revenue
into actual profit. “A low net profit margin indicates a low margin of safety:
higher risk that a decline in sales will erase profits and result in a net loss. Net
profit margin is an indicator of how efficient a company is and how well it
controls its costs.” (C.C.D. Consultants, 2009).
Net profit margin is mostly used to compare company’s results over time. To
compare net profit margin, even between companies in the same industry, might
have little meaning. For instance, if a company recently took a long-term loan to
increase its production capacity, the net profit margin will significantly be
reduced. That does not mean, necessarily, that the company is less efficient than
other competitors.

21
2.2. Previous Research
Based on Fitri, “changes of currency exchange rates also affect the profitability of
the company. Company’s profitability negatively affected by the exchange rate.
The company does not earn profits due to the depreciation of the local currency.
Depreciation also results in decreased market share of the manufacturing
industry.” (Fitri, 2008).
According to Wibowo, “for a company, inflation is leading to higher costs of
productions and operations that will ultimately harm to the company itself.
Thereby, inflation has a negative effect on profitability.” (Wibowo, 2012).
According to Grant and Mathews, “inflation influences the recorded level of
business profits through what may describe as its accounting effects, while
inflation also affects the volume and source distribution of external finance.”
(Grant, 1956).
As stated by Bisma, “if company put more emphasis on liquidity, causing more
current assets settles, and it will cause the decreasing of profitability. Vice versa
if the company emphasizes profitability, means that all assets should be
productive that can bother the liquidity. From the description above can be
concluded that between liquidity and profitability, there is an inverse
relationship.” (Bisma, 2009).
According to Kadir and Stefanie on the research (2012), “the greater the ratio of
sales growth rate rate, the better because it is considered that sales activities are
running quickly, and then produces a better profit rate. Means the faster inventory
turnover, will gives a positive effect on profitability” (Abdul Kadir, 2012).

22
2.3. Theoretical Framework
Source: Constructed by researcher
Figure 2.3. Theoretical Framework
This research is using NPM as the independent variable in which this variable is
used in the company to indicate the ability to generate the net income from the
sales revenue. According to Kadir and Stefanie (2012), “analysis of financial
ratio can be used for every kind of analysis model to manage the operation
effectiveness, evaluate and improve the performance.”
Current ratio is used as one of the independent variables that affect the NPM
because this ratio indicates the company’s ability to pay the short-term liabilities.
Amount in current ratio also gives impact to investor side, because higher the
current ratio means the company has no significant problem in pay back the
dividends to the investor. Kadir and Stefanie also stated that “sales growth rate
also gives impact on company’s NPM by the profit that gained after sales. If the
sales activities run faster, it will gain more profit. It means the amounts of sales
by time affects the profitability of the company.” (Abdul Kadir, 2012).
Macroeconomic factors also play roles as the important factors that affect the
NPM of a company. For instance, exchange rate movements can affect the value
of MNC’s value. Based on Madura statement in his book, “MNC (Multi National
Company) with less risk can obtain funds and higher income at lower financing
Inflation Rate (X2)
Exchange Rate (X1)
Current Ratio (X3)
Net Profit Margin (Y)
Sales growth rate (X4)

23
cost in which this cost is mostly affected by exchange rate movements.” (Madura,
2003). As Grant and Mathews stated in the book, “inflation, as one of the
macroeconomic factors, also affects profits by reacting on sales volume, by
influencing the level of costs and by changing the relationship between costs and
prices.” (J. McB.Grant, 2007).
2.4. Hypothesis
H0: β1 = Exchange Rate has no significant influence on net profit margin
H1: β1 = Exchange rate has significant influence on net profit margin
H0: β2 = Inflation rate has no significant influence on net profit margin
H1: β2 = Inflation rate has significant influence on net profit margin
H0: β3 = Current Ratio has no significant influence on net profit margin
H1: β3 = Current Ratio has significant influence on net profit margin
H0: β4 = Sales growth rate has no significant influence on net profit margin
H1: β4 = Sales growth rate has significant influence on net profit margin
H0: β5= Inflation rate, exchange rate, current ratio, and sales growth rate have no
significant influence on net profit margin
H1: β5= Inflation rate, exchange rate, current ratio, and sales growth rate have
significant influence on net profit margin.

24
CHAPTER III
RESEARCH METHODOLOGY
3.1. Research Method
In this chapter, the researcher will explain about the methodology that applied in
this research. There are two types of research, such as quantitative and qualitative
research. Quantitative research uses numbers to prove or disprove a notion or
hypothesis. Quantitative research uses data that are structured in the form of
numbers or that can be immediately transported into numbers; it is very
controlled, exact approach to research (President University, 2010).
In contrast, qualitative research is placed in general category of non experimental
method because they do not directly test for cause and effect. General purpose of
qualitative research is to examine human behavior in the society, cultural, and
political context in which they occur. Done through a variety of tools such as
interview, historical method, case, study, and ethnography (President University,
2010).
In this thesis, the researcher use quantitative method because of use data that are
structured in the form of number to analyze. In doing this quantitative analysis,
the researcher uses secondary data to collect the data and information, in which
this information mostly gets from internet. This research also used factor analysis
method to determine the dominant factor of the result in this research. Factor
analysis is used to reduce the number of variables, so that the researcher can get
new dominant factor that makes inflation rate, exchange rate, sales growth rate,
and current ratio are affecting the net profit margin of PT. Unilever Indonesia for
2005 – 2012.

25
3.2. Operational Definitions
This research divides the variables into two types, dependent variable and
independent variables. In this research, it is important to know the definition of
each variable, both of dependent and independent variables.
a. Dependent variable: the variable (Y) in regression model that in which the
element that is being predicted.
b. Net Profit Margin (NPM): net profit margin is a comparison or ratio
between net income and sales.
c. Independent Variable: the variable (X) in a regression model that is used
to help predict the dependent variable.
d. Exchange Rate: Price for which the currency of a country can be
exchanged for another country's currency.
e. Inflation Rate: The rate at which the general level of prices for goods and
services are rising, and, subsequently, purchasing power is falling.
f. Current Ratio: Indicator of a firm's ability to meet short-term financial
obligations, it is the ratio of current assets to current liabilities.
g. Sales growth rate: The amount by which the average sales volume of a
company's products or services has grown, typically from year to year.
h. Hypothesis: a supposition or proposed explanation made on the basis of
limited evidence as a starting point for further investigation.
i. Qualitative research: Research that placed in general category of non
experimental method because they do not directly test for cause and effect.
j. Quantitative research: Research uses numbers to prove or disprove a
notion or hypothesis.

26
3.3. Research Instrument
Research instruments that used in this research are:
3.3.1. Instrument for Data Collection
The data that used in this research is the secondary data. Secondary data in this
study is essentially gathered from audited financial statements including income
statement and balance sheet published by PT. Unilever Indonesia. In addition, this
study also use number of books, journal,, and internet sources as supporting data
or information. Hence, this study is conducted with the use of secondary data
obtained from number of sources as books, journal, and internet sources.
As propose the intention of this study is mainly to analyze factors that influencing
net profit margin, multiple regression models is used to analyze the data.
3.3.2. Instrument for Data Analysis
a. SPSS version 20
SPSS (Statistical Package for Social Science) is software that used for
statistical purpose. Further information, this software serves to analyze
data, perform statistical calculations both parametric and non parametric.
It makes the researcher easier to calculate the data and analyze the
statistical data result.
b. Microsoft Excel
Microsoft excel is used to record and calculate some data that needed to be
inputted to SPSS. This software is really useful because helps the
researcher in doing some data calculation.
c. Data Collection
The researcher being use is secondary data, the data that already published
by the companies in their web site. The important data such as exchange
rate and inflation rate historical data are taken from Bank Indonesia
website; Current Ratio, Sales growth rate rate, and Net Profit Margin are
taken from PT. Unilever Indonesia official website. All of these data are
27
used to identify the dominant factor that directly affects the NPM of PT.
Unilever Indonesia.
3.4. Data Collection
Data collection is a process used in research to get the data that needed in
completing the research process. The methodology used to sample from a larger
population will depend on the type of analysis being performed, but will include
simple purposive sampling.
The researcher uses secondary data and gets the population from quarterly reports
of PT. Unilever Indonesia. This research takes the period of January 2005 until
December 2012 as the period of data analyzed so the number of N is 32 samples.
3.5. Data Analysis
The researcher use Multiple Regression Analysis as the analysis of data. Multiple
regression analysis is a statistical technique that predicts values of one variable on
the basis of two or more other variables.
The purpose of this analysis is to fulfill the regression model that most suitable for
identifying the relevant factors which is correlated with the dependent variable.
The predicted value of Y is linear transformation of the X variables such that the
sum of the observed and predicted Y is a minimum. That will be consisted the F-
test, T-test, and other assumption to get the research objectives.
3.5.1. Multiple Regression Analysis
In this study, the researcher analyzed the data set through the use of multiple
regression models. Through this analysis, the researcher would like to examine
the influence of the independent variables (ER, IR, CR, SGR) toward the
dependent variable (NPM).

28
The relationship model of independent variable with dependent variable can be
arranged in linear regression equation as follow:
Y = a +b1X1 + b2X2 + b3X3 + b4X4 + e
Equation 5 – Multiple Regressions
Whereas:
Y = Net Profit Margin
a = Constants
X1 = Exchange Rate
X2 = Inflation Rate
X3 = Current Ratio
X4 = Sales growth rate
b1.... bn = Regression Coefficient
e = Error term
3.5.2. Classical Assumption Testing
A. Normality Test
Normality test is the first classic assumption test using the SPSS application for
evaluating whether data are normally distributed or not. Generally, this test is used
by implementing Kolmogorof – Smirnov (K-S) and can be seen through graphic
of Normal P-P of Regression Standardized Residual through SPSS application.
The plot is used to estimate how well the data while approaching a normal
distribution. The data will be analyzed as normal if the actual data plotting is
located close to diagonal line, it means that the data is normally distributed and if
the actual plotting is located spread far from the diagonal line or do not follow

29
directions diagonal line, it means the data is not normally distributed or nearly
normal (Gujarati, 2003).
B. Autocorrelation Test
Autocorrelation is the correlation that happens between the variables from the
observation data in the time series. If autocorrelation happens in the regression
model, so the sample cannot show its variance of population and the result of
regression model cannot be used to predict the value of dependent variable toward
particular independent variable.
In testing the existence of autocorrelation, an autocorrelation test is implemented,
which generally uses Durbin-Watson test. Santoso said in his book, that the value
of Durbin Watson should be in range between -2 and +2 to be no correlation
(Santoso, 2000).
C. Heterocedasticity Test
Heterocedasticity test is a test that is used to analyze whether there is a
disturbance or error (e) owned by the same variant from one observation to the
other observations. This test will use a scatter plot to see the spread of data. A
good regression model is not incurred heterocedasticity. In this case, the
significance value of each independent variable that would be used is the one
gained from the regression analysis between the values of absolute residual with
the independent variables.
If it does not form a specific pattern ad spread randomly above and below the zero
spot, it can be assumed that the heterocedasticity does not exist in this regression
model. On the other words, the regression model does not have any different
variability in the residual (error) variances that indicates it is a good model to be
analyzed.

30
D. Multicollinearity Test
This test is to find out any correlation between independent variables. One method
of measuring collinearity is the Variance Inflationary Factor (VIF) for each
independent variable. Multicollinearity test aims to assess whether two or more
independent variables within the regression model are highly correlated (Ghozali,
2009).
One alternative to detect the presence of multicollinearity within the regression
model is the use of value of tolerance and its opponent (Variance Inflation
Factor). However, formula that might be used to determine value of tolerance and
Variance Inflation Factor (VIF) are shown as follow:
Tolerance = 1 – Rj2
VIF =
Equation 6 – Tolerance and VIF
Where Rj2
is the coefficient of determination of regression explanatory j on all
other explanatory. Both of these measurements might indicate which independent
variable that is explained by other predictors. In addition, Gujarati stated that a
regression model is assumed to have multicollinearity if the value of tolerance is
less than 0.10 or if the value of VIF is more than 10.
3.5.3. Hypothesis Testing
A. F-test
Simultaneous affect test is used to see whether all independent variables affect
dependent variable (Ghozali, 2006). In order to measure the collective influence
of all independent variables tested in this study, the hypothesis statement that
might be used is:
H0 : β5 = 0
H1 : β5 ≠ 0
In testing the null hypothesis (H0), the value of all independent variables within
the regression model used in this research including ER, IR, CR, and SGR are

31
assumed to be significant toward the dependent variable, NPM, if all the
coefficient regression (β1, β2, β3, β4) is equal to zero.
On the other words, there is no collective influence of all independent variables
(ER, IR, CR, SGR) on dependent variable (NPM). Whereas if all of the
coefficient regression (β1, β2, β3, β4) is unequal to zero, it means there is collective
significant effect from independent variables to dependent variable.
ANOVA table shows the value of F calculation. If the significance result is below
0.05, it means a set of independent variables in the regression model can influence
the dependent variable.
If the significance value is greater than the given parameter (0,05) then, accept the
null hypothesis which means there is no collective influence of all independent
variables tested in this research on the dependent variable.
B. T-test
The researcher used t-test in order to identify the significance of independent
variables individually toward dependent variable in the regression model. The test
measures the contribution of a variable while the remaining variables are included
in the model. The hypothesis statement to test the significance of particular
independent regression coefficient (βx) are:
H0 : βx = 0
H1 : βx ≠ 0
Same like f-test, the level of significance to determine the relationship is below
0.05.
In testing the null hypothesis, particular independent variable within the
regression model is assumed to be a significant variable as if the regression
coefficient is unequal to zero. That means the independent variable seems to be
unimportant. While tests the alternate hypothesis (H1), particular independent
variable is viewed to be significant variable if the value of regression coefficient is
greater than zero. If the value is smaller than zero, the independent variable is then
unimportant.

32
The hypothesis statement used to test the significance of each independent
regression coefficient in this research would be expressed as follow:
H0 : β1 = 0
H1 : β1 ≠ 0
The researcher tries to acknowledge whether ER is significant variable within the
regression model used in this research. In order to measure the significance of ER
toward NPM, the researcher might test either null or alternate hypothesis. In
testing the null hypothesis, the ER is supposed to be significant variable if the
regression coefficient is not equal to zero unless it is insignificant. Yet, in testing
the alternate hypothesis, ER has to be significant if regression coefficient is
greater than zero otherwise unimportant.
If the significance value of certain independent variable tested in this research
such as ER is greater than the given parameter (0,05), accept the null hypothesis.
It indicates there is no influence of ER on the NPM. But if the significance value
of particular independent variable tested in this research such as ER is less than
given parameter, reject null hypothesis that signifies ER is significant toward the
NPM.
The hypothesis statement used to test the significance of each independent
regression coefficient in this research would be expressed as follow:
H0 : β2 = 0
H1 : β2 ≠ 0
The researcher tries to acknowledge whether IR is significant variable within the
regression model used in this research. In order to measure the significance of IR
toward NPM, the researcher might test either null or alternate hypothesis. In
testing the null hypothesis, the IR is supposed to be significant variable if the
regression coefficient is not equal to zero unless it is insignificant. Yet, in testing
the alternate hypothesis, IR has to be significant if regression coefficient is greater
than zero otherwise unimportant.

33
If the significance value of certain independent variable tested in this research
such as IR is greater than the given parameter, accept the null hypothesis. It
indicates there is no influence of IR on the NPM. But if the significance value of
particular independent variable tested in this research such as IR is less than given
parameter, reject null hypothesis that signifies IR is significant toward the NPM.
The hypothesis statement used to test the significance of each independent
regression coefficient in this research would be expressed as follow:
H0 : β3 = 0
H1 : β3 ≠ 0
The researcher tries to acknowledge whether CR is significant variable within the
regression model used in this research. In order to measure the significance of CR
toward NPM, the researcher might test either null or alternate hypothesis. In
testing the null hypothesis, the CR is supposed to be significant variable if the
regression coefficient is not equal to zero unless it is insignificant. Yet, in testing
the alternate hypothesis, CR has to be significant if regression coefficient is
greater than zero otherwise unimportant.
If the significance value of certain independent variable tested in this research
such as CR is greater than the given parameter, accept the null hypothesis. It
indicates there is no influence of CR on the NPM. But if the significance value of
particular independent variable tested in this research such as CR is less than
given parameter, reject null hypothesis that signifies CR is significant toward the
NPM.
The hypothesis statement used to test the significance of each independent
regression coefficient in this research would be expressed as follow:
H0 : β4 = 0
H1 : β4 ≠ 0
The researcher tries to acknowledge whether SGR is significant variable within
the regression model used in this research. In order to measure the significance of
SGR toward NPM, the researcher might test either null or alternate hypothesis. In

34
testing the null hypothesis, the SGR is supposed to be significant variable if the
regression coefficient is not equal to zero unless it is insignificant. Yet, in testing
the alternate hypothesis, SGR has to be significant if regression coefficient is
greater than zero otherwise unimportant.
If the significance value of certain independent variable tested in this research
such as SGR is greater than the given parameter, accept the null hypothesis. It
indicates there is no influence of SGR on the NPM. But if the significance value
of particular independent variable tested in this research such as SGR is less than
given parameter, reject null hypothesis that signifies SGR is significant toward the
NPM.
C. Coefficient of Determination (R2)
In multiple regressions, the coefficient of determination (R2) represents the
proportion of the variation in dependent variable (Y) that is explained by the set of
the independent variables. This will ensure how strong correlation exists between
independent variables on the dependent variable. R2 values are out of range high
low 0 to 1 as follows:
i. If R2 = 0, it states if X as the independent variables explained 0% of
the variability in Y as the dependent variable, or it can be said that the
correlation between X and Y is low.
ii. If R2
= 1, it states that all points contained in the sample have been in
the regression line and do not have the error (e=0). Moreover, it stated
that X has a strong correlation to Y and can explain the variability of Y
using the regression equation. That is the reason why the value has to
be closed to 1.

35
CHAPTER IV
ANALYSIS AND INTERPRETATION
4.1. Company Profile
4.1.1. History of Unilever Indonesia
Unilever products touch the lives of over 2 billion people every day – whether
that's through feeling great because they've got shiny hair and a brilliant smile,
keeping their homes fresh and clean, or by enjoying a great cup of tea, satisfying
meal or healthy snack. Unilever Indonesia was established on 5th
December 1933.
Unilever Indonesia has grown to be a leading company of Home and Personal
Care as well as Foods and Ice Cream products in Indonesia. The Company offered
its shares to the public in 1981 and has been listed on the Indonesia Stock
Exchange since 11th January 1982. As at the end of 2011, the Company ranked
six on the Indonesia Stock Exchange in terms of market capitalization. The
Company has two subsidiaries: PT Anugrah Lever (in liquidation), a 100% owned
subsidiary (previously a joint venture marketing company for soy sauce) that has
been consolidated and PT Technopia Lever, a 51% owned subsidiary that engages
in distribution, export, and import of goods under the Domestos Nomos
trademark. The Company owns six factories in Jababeka Industrial Estate,
Cikarang, Bekasi and two factories in Rungkut Industrial Estate, Surabaya, East
Java, with its head office in Jakarta. Its products consist of about 43 key brands
and 1,000 SKUs which are sold through a network of about 500 independent
distributors covering hundreds of thousands of outlets throughout Indonesia.
Products are distributed through its own central distribution centers, satellite
warehouses, depots and other facilities.

36
j. Unilever Indonesia Nowadays
Rising inflation, in combination with a weaker rupiah and a higher interest rate
environment in Southeast Asia’s largest economy, will hurt sales at consumer-
goods firms such as Unilever Indonesia. A weakening rupiah would result in an
increase in the cost of imported foodstuffs, in which Unilever Indonesia imports
many of its food requirements such as soybeans.
Despite this, strong income growth could still provide good prospects for
companies like Unilever. Some consumers reduce their usage, or move to less
costly brands. Luckily, Unilever have brands and products in many different
segments.
Banking on strong consumer goods spending in Indonesia, Unilever Indonesia has
been able to keep annual profit growth of above 15 percent in the last 15 years.
despite of the challenges, Indonesia still offered lots of opportunities. The $900
billion economy, the largest in Southeast Asia, still has a low per capita use of
some consumer goods. In the past three years, Unilever has boosted investment,
as it races to cash in on higher demand for fast-moving consumer goods in
Indonesia. Domestic consumption, accounting for around two-thirds of the
economy, is expected to drive the growth in Indonesia.
ii. Timeline
1920 -30 Import by van den Bergh, Jurgen and Brothers
1933 Soap Factory - Lever’s Zeepfabrieken NV – Angke, Jakarta
1936 Margarine and oil production van den Bergh’s Fabrieken NV -
Angke, Jakarta
1941 Cosmetics factory - Colibri NV, Surabaya
1942 -46 Unilever control discontinued (World War II)
1965 -66 Under government control

37
1967 Control of business back to Unilever under foreign investment
law
1981 Go public and listed in Jakarta Stock Exchange
1982 Construction of Elida Gibbs Factory in Rungkut, Surabaya
1988 Transfer of the Toilet Soap Factory from Colibri to Rungkut
Factory, Surabaya
1990 Enter into the tea business
1992 Opening of ice cream factory
1995 Construction of detergents and foods factory in Cikarang, Bekasi
1996 -98 Consolidation of manufacturing facilities – Cikarang, Rungkut
1999 NSD Liquid Detergents – Cikarang
2000 Enter into soya sauce business
2001 Opening of tea factory – Cikarang
2002 Opening of central distribution centre Jakarta
2003 Enter into mosquito coil business
2004 Enter into snack business
2005 Opening of liquid / shampoo factory Cikarang
2008 Enter into fruit-based Vitality drinks business
2010 The company enters the water purification business by launching
Pureit
2011 The new Dove soap factory opens in Surabaya, while the Wall’s
ice cream and Skin Care factories in Cikarang are expanded

38
4.1.2. Vision of Unilever Indonesia
a) We work to create a better future every day
b) We help people feel good, look good and get more out of life with brands
and services that are good for them and good for others.
c) We will inspire people to take small everyday actions that can add up to a
big difference for the world.
d) We will develop new ways of doing business with the aim of doubling the
size of our company while reducing our environmental impact.
4.1.3. Company Structure
Source: constructed by researcher
Figure 4.1. Organizational Structure of Unilever Indonesia
Maurits Daniel Rudolf Lalisang
(President Director)
Akhmad Saeful
(Internal Audit)
Director
Franklin Chan Gomez
(Chief Financial Officer)
Vishal Gupta
(Director Home Care)
Debora Herawati Sadrach
(Director Personal Care)
Ainul Yaqin
(Director Foods)
Ira Noviarti
(Director Ice Cream & Marketing Service)
Ramakrishnan Raghuraman
(Director Supply Chain)
Hadrianus Setiawan
(Director Customer Development)
Enny Hartati Sampurno
(Director Human Resources)
Sancoyo Antarikso
(Director External Relations & Corporate Secretary)

39
4.1.4. Products
A. Food and Drink Brands: Bango, Blue Band, Buavita, Lipton, Royco,
Sariwangi, Unilever Food Solution, Wall’s.
B. Home Care Brands: Cif, Domestos, Molto, Rinso, Sunlight, Super Pell,
Surf, Vixal, Wipol Karbol, Wipol Ultra Protection.
C. Personal Care Brands: Axe, Brylcreem, Citra, Clear, Close Up, Dove,
Lifebuoy, Lux, Pond’s, Rexona, She, Vaseline, Zwitsal, TRESemme.
4.1.5. Most Significant Awards during 2011 – 2012
Unilever Indonesia’s policies, programs, and other activities in areas related to
sustainability were recognized in a long list of awards, of which the most
significant are set out below:
i. Awards 2011
1. Asia’s Best Managed Companies 2012 (1st
Rank) from Finance Asia.
2. Ranking Companies in Asia (1st
Rank Asia Sustainability Rating).
3. Best Managed Company 2011 (Large Cap, ASIAMONEY)
ii. Awards 2012
1. Asia’s Best Companies 2012 by Finance Asia
2. 3rd
Asia’s Best Employer Brand Awards by Universum
3. World Class Quality Achievement – Global Customer Satisfaction Standard)
2012.
4. Indonesian Customer Satisfaction Standard Award 2012.
5. Anugrah Peduli Pendidikan 2012.
6. Best Corporate Governance 2012.
7. Indonesia Sustainability Reporting Award 2012.
4.1.6. Economic Performance Indicators
In general, the creation and distribution of economic value is based on the revenue
and expenditure of the operational activities of Unilever. The increasing national
economic growth has expanded the range of consumer goods offered to the
market.

40
In 2012, Unilever presented an outstanding performance improvement. The
revenue increased by 16% from 23,469 billion in 2011 to 27,303 billion in 2012,
despite intense competition. This growth is supported by an increase in the
volume growth from two principal product divisions, Home and Personal Care
with total sales of Rp. 17,200 billion (2011) and Rp. 19,900 billion (2012) and
Foods & Beverages with total net sales of Rp. 6,300 billion (2011) and Rp. 7,400
billion (2012). This growth was driven by capacity expansion in manufacturing
plant sand product innovation. Total net profits before income tax moved up by
16.2 percent to Rp. 4,839 billion in 2012 from Rp. 4,164 billion in 2011.
During 2012 and 2011, Unilever successfully increased its economic value of Net
Sales to Rp. 27,384 billion in 2012, up from Rp. 23,615 billion in 2011. The
increasing of sales every year indicates the rotation of goods in inventory goes
fast, and result the higher income, then higher Net Profit Margin as one of the
profitability ratios. Unilever also continues to invest in Indonesia to increase
capacity for growth. Unilever yesterday unveiled expansion to production
facilities in Indonesia that will help drive sustainable growth for the company in
the fast-growing developing and emerging markets.
The company has invested about €90 million to build a new, state-of-the-art
personal care factory and to expand existing ice cream and personal care factories
to increase Unilever’s capacity for growth and service increasing demand for
beauty products and ice cream in Indonesia and in other parts of Asia and Africa.
These developments complement the additional capacity already being built in the
Home Care and Foods categories in Indonesia this year and will better enable
Unilever to deliver bigger and better innovation more quickly to consumers.
These markets contribute significantly to the 54% that Unilever currently
generates from emerging markets, a figure that expected to rise substantially over
the next ten years. Unilever is excited by the enormous possibilities these markets
offer and more investments will undoubtedly follow.
With almost 80 years of Unilever history in Indonesia, Unilever has demonstrated
long-term commitment to its growth and prosperity so far. Unilever continuing
and significant investment in Indonesia shows that Unilever company is equally

41
committed to Indonesia’s future growth, economic and environmental
development.
4.2. Data Analysis
The instrument that used to analyze the data is SPSS 20.0. The researcher
analyzed the data gained and gathered during the research of the study. The data
analysis done in order to find out the correlation of NPM (Y) as the dependent
variable to ER, IR, CR, and SGR (X) as the independent variables.
After the researcher gathering the data collection from the PT. Unilever Indonesia,
Bank Indonesia, and Indonesia Bureau of Labor Statistics reviewed the related
literature, theories, and the methodology that has been used, the researcher are
going to analyze the data and to interpret the result has been made using SPSS
20.0. So, in this chapter the null hypothesis and alternative hypothesis are going to
be tested whether the hypothesis is rejected or accepted.
The data analysis in this study presented in both descriptive and statistical. This
research utilizes the multiple regression models and the hypothesis testing was
initially conducted in this research prior to the classical assumption testing which
including the normality test, multicollinearity, autocorrelation, and
heterocedasticity test.
4.2.1. Descriptive Statistic
The descriptive statistic might provide an illustration of data used in this research.
The population in this research is PT. Unilever Indonesia, where the limits of the
research for the period 2005 – 2012, and then there will be 32 quarterly data that
being analyzed. The descriptive statistic includes the average value and the
standard deviation of all variables tested in this research. The following table
might offer descriptive analysis that being used.

42
Table 4.1. Descriptive Statistics
Descriptive Statistics
Mean Std. Deviation N
Net Profit Margin .1694 .01134 32
Exchange Rate 1.0028 .04623 32
Inflation Rate .5747 .58417 32
Current Ratio 1.1172 .28696 32
Sales growth rate .0406 .09761 32
The table above shows the result of descriptive statistic for five variables with 32
samples. The table is described as the following:
a) Net Profit Margin of Unilever Indonesia for period 2005 – 2012 has been
averaged and its mean is 0.1694 while the value of standard deviation is
0.01134.
b) Exchange Rate (USD/IDR) of Indonesia for period 2005 – 2012 that
already converted to decimal form and have mean as 1.0028 while the
value of standard deviation is 0.04623.
c) Inflation Rate of Indonesia for period 2005 – 2012 has been averaged and
its mean is 0.5747 while the value of standard deviation is 0.58417.
d) Current Ratio of Unilever Indonesia for period 2005 – 2012 has been
averaged and its mean is 1.1172 while the value of standard deviation is
0.28696.
e) Sales growth rate Rate of Unilever Indonesia for period 2005 – 2012 has
been averaged and its mean is 0.0406 while the value of standard deviation
is 0.09761.
4.2.2. Classical Assumption Testing
The classical assumption testing is supposed to be conducted to acknowledge the
quality of data used to test the multiple regression models in this study. The
classical assumption testing including the normality test, multicollinearity,
autocorrelation, and heterocedasticity test might indicates whether deviation exist
within the results gain from the regression analysis.

43
A. Normality Test
In conducting the normality test, the researcher uses scatter plot graphic. This test
aims to find out how likely the dependent and independent variables in this
research are normally distributed. If the data are spread around the diagonal line
or histogram charts then it illustrates a normal distribution pattern.
Figure 4.2. Histogram of Regression Standardized Residual
Looking at the histogram, the curve has a bell shaped normal distribution. Also
from P – P plot, the actual data plot is surrounding the diagonal line telling the
distribution of the data is normal.
B. Multicollinearity Test
In detecting the presence of multicollinearity within a regression model, one
might use the value of tolerance and its opponent, VIF. A regression model is
assumed to have multicollinearity if the value of tolerance is less than 0.10 or if

44
the value of VIF is more than 10. The result of collinearity testing in this research
is shown as follows:
Table 4.2. Tolerance and VIF for Multicollinearity Test
Table above expressed that the tolerance values of Exchange Rate, Inflation Rate,
Current Ratio, and Sales growth rate Rate are 0.987; 0.813; 0.727; 0.796. As
shown also by the table, all of the independent variables have the VIF values are
below 10 and the tolerance values are above 0.10. It means there is no
multicollinearity among the independent variables in the regression model of this
research. On the other words, no one of the independent variables in this research
that correlated between each other.
C. Autocorrelation test
This test aims to examine whether a correlation of a time series with its own past
and future values exist or not within the model used in this research. In detecting
the presence of autocorrelation within the model, the researcher uses Durbin –
Watson test. This table below shows the result of autocorrelation test:
Table 4.3. Durbin Watson for Autocorrelation
Model Summaryb
Model R R Square Adjusted R
Square
Std. Error of the
Estimate
Durbin-Watson
1 .816a .667 .617 .00702 1.574
a. Predictors: (Constant), Sales growth rate , Exchange Rate, Inflation Rate, Current
Ratio

45
b. Dependent Variable: Net Profit Margin
According to Santoso (2004), the autocorrelation does not exist when the value of
Durbin – Watson is between +2 and -2. From the table above, the Durbin –
Watson shows the value of 1.574 which means there is no autocorrelation in this
regression model.
D. Heterocedasticity test
Heterocedasticity test intends to examine whether the regression model have a
different variability in the residual (error) variances. In detecting the presence of
heterocedasticity within the model, the researcher uses the scatterplot model.
Figure 4.3. Scatterplot for Heterocedasticity Test
From displayed figure above, there is no heterocedasticity because the pattern of
the plots is spread randomly. In other word it is called homocedasticity. It
indicates the regression model is good to be analyzed since it does not have

46
different variability in residual (error) variances that could invalidate the statistical
test of significance.
4.2.3. Hypothesis Testing
In order to approve or disapprove the hypothesis in this research, there are several
statisticcal test used as follow:
A. F – Test
Simulteanous effect test is used to see whether all independent variables affect the
dependent variable. In assessing the collective influence of all independent
variables in this research including ER, IR, CR, SGR on the dependent variable,
NPM, the hypothesis statement used are:
H0 : β5 = 0
H1 : β5 ≠ 0
The null hypothesis (H0) suggests that there is no collective influence of all
independent variables including ER, IR, CR, SGR on NPM. However, the
alternate hypothesis (H1) implies that at least one of independent variable tested in
this research influence the dependent variable.
ANOVA table shows the value of F calculation. If the significance result is below
0.05, it means a set of independent variables in the regression model can influence
the dependent variable. This ANOVA table below shows the result of F-test:
Table 4.4. ANOVA Table for F-test
ANOVAa
Model Sum of Squares df Mean Square F Sig.
1
Regression .003 4 .001 13.492 .000b
Residual .001 27 .000
Total .004 31
a. Dependent Variable: Net Profit Margin
b. Predictors: (Constant), Sales growth rate , Exchange Rate, Inflation Rate, Current Ratio

47
The table above shows that significance (sig.) value is 0.000. It means there is
collective influence of the independent variables on dependent variable
significantly in the regression model, and subsequently the null hypothesis (H0 : β5
= 0) is rejected. The alternative hypothesis is accepted (H1 : β5 ≠ 0), which means
all independent variables tested in this research including ER, IR, CR, and SGR
have collective influence on NPM.
B. T - Test
The researcher uses T-test in order to identify the significance of independent
variables individually toward dependent variable in the regression model. Same
like F-test, the level of significance to determine the relationship is below 0.05.
The significance value is shown by the table of coefficient:
Table 4.5. T-test for Variable Significance Test
According to the data shown in the table above, the regression model in this study
might be presented as:
NPM = 0.257 – 0.248 ER – 0.630 CR + 0.610 SGR
Equation 7 – Regression Model of the Research
Where:
NPM = Net Profit Margin (Y)
ER = Exchange Rate (X1)
CR = Current Ratio (X3)
SGR = Sales growth rate (X4)

48
The model regression above might be interpreted as following statement:
i. The value of constant (NPM) is 0.257 which shows the value of NPM
increases when the value of ER, IR, CR, SGR are zero.
ii. The regression coefficient ER is equal to -0.248. That interprets the NPM
might decrease 0.248 for each increasing of ER with assumption all other
factors remained the constant value.
iii. The regression coefficient of CR is equal to -0.630. That NPM might
decrease 0.630 for each increasing of the CR with assumption all other
factors remained the constant value.
iv. The regression coefficient of SGR is equal to 0.610. That interprets the
NPM might increase 0.610 for each increasing of SGR with assumption all
other factors remained the constant value.
According to the data shown by the T-test table above, the researcher also gain the
several analyses for each hypothesis of this research as follow:
a. Exchange Rate (ER)
The hypothesis that used to examine the significance of ER towards NPM
might be shown as follow:
H0: β1 = Exchange Rate has no significance influence on net profit margin
H1: β1 = Exchange rate has significance influence on net profit margin
The null hypothesis states that ER has no significant influence on NPM while
the alternate hypothesis states that ER has significant influence on NPM.
The alternate hypothesis would be accepted if the significance value of the
exchange rate is below the given parameter (0.05) otherwise it would be
rejected. On the other words, ER supposed to have significant influence on net
NPM if the significance value is less than 0.05. However, the data in T-test
table show the significance value of ER is 0.033. That value is less than the
given parameter (0.05), which indicates the alternate hypothesis is accepted

49
and null hypothesis is rejected. It means the ER has significant influence on
NPM.
b. Inflation Rate (IR)
The hypothesis that used to examine the significance of IR towards NPM
might be shown as follow:
H0: β2 = Inflation Rate has no significance influence on net profit margin
H1: β2 = Inflation rate has significance influence on net profit margin
The null hypothesis states that IR has no significant influence on NPM while
the alternate hypothesis states that IR has significant influence on the NPM.
The alternate hypothesis would be accepted if the significance value of the IR
is below the given parameter (0.05) otherwise it would be rejected. On the
other words, IR supposed to have significant influence on NPM if the
significance value is less than 0.05. Yet, the data in T-test table show the
significance value of IR is 0.203. That value is greater than the given
parameter (0.05), which indicates the null hypothesis is accepted and alternate
hypothesis is rejected. It means the IR has no significant influence on NPM.
c. Current Ratio (CR)
The hypothesis that used to examine the significance of CR towards NPM
might be shown as follow:
H0: β3 = Current Ratio has no significance influence on net profit margin
H1: β3 = Current Ratio has significance influence on net profit margin
The null hypothesis states that CR has no significant influence on NPM while
the alternate hypothesis states that CR has significant influence on the NPM.
The alternate hypothesis would be accepted if the significance value of the
CR is below the given parameter (0.05) otherwise it would be rejected. On

50
the other words, CR supposed to have significant influence on NPM if the
significance value is less than 0.05. Yet, the data in T-test table show the
significance value of CR is 0.000. That value is less than the given parameter
(0.05), which indicates the null hypothesis is rejected and alternate hypothesis
is accepted. It means the CR has significant influence on net NPM.
d. Sales growth rate
The hypothesis that used to examine the significance of SGR towards NPM
might be shown as follow:
H0: β4 = Sales growth rate has no significance influence on net profit margin
H1: β4 = Sales growth rate has significance influence on net profit margin
The null hypothesis states that SGR has no significant influence on NPM
while the alternate hypothesis states that SGR has significant influence on
NPM.
The alternate hypothesis would be accepted if the significance value of the
SGR is below the given parameter (0.05) otherwise it would be rejected. On
the other words, SGR supposed to have significant influence on NPM if the
significance value is less than 0.05. Yet, the data in T-test table show the
significance value of SGR is 0,000. That value is less than the given parameter
(0.05), which indicates the null hypothesis is rejected and alternate hypothesis
is accepted. It means the SGR has significant influence on NPM.
4.2.4. R2: Coefficient of Determination
In multiple regressions, the coefficient of determination (R2) represents the
proportion of the variation in dependent variable (Y) that is explained by the set of
independent variables (X). R2
value falls between 0 and 1. The larger the value,
the better the prediction of y by the independent variables within regression model
used in this research. On the other words, the closer R2 value to 1, the better the

51
independent variables in providing information required to predict dependent
variable. The value of coefficient of determination is shown as follow:
Table 4.6. Coefficient of Determination (R2)
Model Summaryb
Model R R Square Adjusted R
Square
Std. Error of the
Estimate
Durbin-Watson
1 .816a .667 .617 .00702 1.574
a. Predictors: (Constant), Sales growth rate , Exchange Rate, Inflation Rate, Current
Ratio
b. Dependent Variable: Net Profit Margin
From the output calculation by SPSS 20 software, the value of coefficient of
determination (R2) is 0.667. It illustrates only 66.7% of the dependent variable
could be explained by the variation of the independent variable. Further, this value
means only 66.7% the proportion of the total variation in dependent variable
(NPM) that might be explained by all the independent variables in regression
model in this research, including ER, IR, CR, and SGR. Therefore, it might be
assumed that independent variables that used in this research are good enough in
providing the information required to predict dependent variable.
4.3. Interpretation of Results
In accordance to F-test and the result on the F-test table that shows the
significance value is 0.000 which is less than the given parameter (0.05). This
significance value indicates that all the independent variables are collectively
significant affecting the dependent variable. It means the ER, IR, CR, and SGR is
collectively influencing the NPM of Unilever Indonesia for period 2005 – 2012.
From the result of regression analysis, the value of R2 is 0.672. It means that all
the independent variables are able to explain the dependent variable 67.2 %. The
rest is explained by other variables that are not included in the regression equation
model. In other words, the independent variables used in the research (ER, IR,
CR, SGR) are able to explain the variability of NPM in PT. Unilever Indonesia.

52
For each independent variable that affects the dependent variable, the researcher
concludes the hypothesis as follow:
4.3.1. Analysis Each Variable
a. Exchange Rate
The data in T-test table shows the significance value of ER is 0.035. That value is
less than the given parameter (0.05), which indicates the alternate hypothesis is
accepted and null hypothesis is rejected. It means the ER has significant influence
on NPM.
As stated by Walker in his journal, the fact that profit margins among European
car makers seem to be less sensitive or low significant affected by bilateral
exchange rates during the local depreciation or appreciation (Walker, 2007).
As said by Sancoyo Antarikso (director and corporate strategy), the value of
exchange rate is influencing on the profitability of Unilever Indonesia because
this company is importing the raw material such as food requirements from
another country for around 50 % of total raw material. That is why exchange rate
value has an important role on profitability of Unilever Indonesia.
Exchange rate also as the independent variable has a vice versa relationship with
net profit margin as the dependent variable. As shown in the T-test table, the ER
variable has negative relation toward the NPM. It means when the NPM is
decreasing, the ER will increase. And the vice versa, when the ER is decreasing,
then, the NPM is increasing. In accordance to prove this result, the researcher
searches the previous research which states the same result. Based on Fitri,
company’s profitability negatively affected by the exchange rate. The company
does not earn profits due to the depreciation of the local currency. Depreciation
also results in decreased market share of the manufacturing industry (Fitri, 2008).
The researcher concludes that actually ER has negative or vice versa relation with
NPM and it is significantly affecting the NPM.

53
b. Inflation Rate
The data in T-test table show the significance value of IR is 0.279. That value is
greater than the given parameter (0.05), which indicates the null hypothesis is
accepted and alternate hypothesis is rejected. It means the IR has insignificant
influence on NPM.
Inflation rate is insignificantly affecting the profitability of Unilever Indonesia
because from the data that analyzed, the rate of inflation refers to the stable
condition. There is no significant fluctuation of inflation rate during the period
that used in this research while the income of people is increasing every year.
Then, the increasing income can cover the change of inflation rate so the sales of
Unilever Indonesia still at the stable condition and won’t affect the profits too
much. According to Lalisang as the Director of Unilever Indonesia, the company
has set up some strategic steps, such as the efficiency of the company's internal
financing in anticipation of subsidized fuel price-hike, so the overall inflation
impact will not significantly affect the company's performance.
Inflation rate also as the independent variable has a vice versa relationship with
net profit margin as the dependent variable. As shown in the T-test table, the IR
variable has negative relation toward the NPM. It means when the NPM is
decreasing, the IR will increase. And the vice versa, when the IR is decreasing,
then, the NPM is increasing. In accordance to prove this result, the researcher
searches the previous research which states the same result. According to
Wibowo, for a company, inflation is leading to higher costs of productions and
operations that will ultimately harm to the company itself. Thereby, inflation has a
negative effect on profitability (Wibowo, 2012).
The researcher concludes that actually IR, although has negative or vice versa
relation, it has insignificant influence on the NPM of a company.
c. Current Ratio
The data in T-test table show the significance value of CR is 0.000. That value is
less than the given parameter (0.05), which indicates the null hypothesis is

54
rejected and alternate hypothesis is accepted. It means the CR has significant
influence on NPM.
As stated by Vieira, a statistical relation between two or more variables such that
systematic changes in the value of one variable are accompanied by systematic
changes in the other. It was observed for all the studied years a significant and
negative correlation between the liquidity and the profitability variables (Vieira,
2010).
Current ratio also as the independent variable has a vice versa relationship with
net profit margin as the dependent variable. As shown in the T-test table, the CR
variable has negative relation toward the NPM. It means when the NPM is
decreasing, the CR will increase. And the vice versa, when the CR is decreasing,
then, the NPM is increasing. In accordance to prove this result, the researcher
searches the previous research which states the same result. As stated by Bisma, if
company put more emphasis on liquidity, causing more current assets settles, and
it will cause the decreasing of profitability. Vice versa if the company emphasizes
profitability, means that all assets should be productive that can bother the
liquidity. From the description above can be concluded that between liquidity and
profitability, there is an inverse relationship (Bisma, 2009).
The researcher concludes that actually CR, although has negative or vice versa
relation, it strongly has a significant influence on the NPM of a company.
d. Sales growth rate
The data in T-test table show the significance value of SGR is 0.000. That value is
less than the given parameter (0.05), which indicates the null hypothesis is
rejected and alternate hypothesis is accepted. It means the SGR has significant
influence on NPM.
SGR also as the independent variable has a proportional relationship with NPM as
the dependent variable. As shown in the T-test table, the SGR variable has
positive relation toward the NPM. It means when the NPM is decreasing, the SGR
will decrease. And the vice versa, when the SGR is increasing, then, the NPM is
increasing. In accordance to prove this result, the researcher searches the previous
research which states the same result. According to Kadir & Phang, the greater the

55
ratio of sales growth rate rate, the better because it is considered that sales
activities are running quickly, and then produces a better profit rate. Means the
faster inventory turnover, will gives a positive effect on profitability and exactly
significantly affects the net profit margin as one of the profitability ratio (Abdul
Kadir, 2012).
The researcher concludes that actually SGR that has positive relationship toward
the NPM also strongly has a significant influence on that dependent variable on a
company.

56
CHAPTER V
CONCLUSION AND RECOMMENDATION
5.1. Conclusion
The purpose of this research is to identify whether there is correlation between
ER, IR, CR, and SGR toward the NPM of PT. Unilever Indonesia. The data used
are quarterly basis data from year 2005 to 2012. In order to answer the statement
of problem, several tests are done.
1.1.1. Answer for Statement of Problem
Based on the research and test done in this study, the answers to the statement of
problem are:
1. Based on F-test, yes there is correlation between ER, IR, CR, and SGR to
NPM of Unilever Indonesia. The score of significance value is 0.000 which is
less than 0.005. From there we have reason to reject Null Hypothesis H0: β5
and accept H1: β5. In the NPM theory in chapter 2 contains news that
describes how ER, IR, CR, and SGR can affect manufacturing industry. They
can affect the production cost thorough the increasing of raw material cost.
They also affect economic growth especially in household manufacturing
sector. Many developers have fears to make more development on the
products because of the cost and purchasing power of society which goes
down. Then it will lead to demand problem in household manufacturing
industry, then affect its productivity, demand, and profitability to Unilever
Indonesia products.
2. Based on T-test, the score of significance value for independent variables ER,
IR, CR, and SGR are 0.035, 0.279, 0.000, and 0.000. There are three
variables that have value below the given parameter, and unfortunately there
is one of the variables has value above the given parameter. ER, CR, and
SGR are the variables that significantly influence the NPM with the value

57
below 0.005. And IR is the variable that insignificantly affects the NPM with
value above 0.005.
3. From the significance value on T-test, the researcher can conclude the most
significant factor that influences the NPM is SGR, and then followed by CR
and ER.
4. NPM as the dependent variable is important to be analyzed because this ratio
is an indicator of how efficient a company is and how well it controls its
costs. High NPM ratio indicates a better productivity of the company that can
improve the belief of the shareholders to invest in that company.
5. In the Coefficient of Determination presented with R2, the value showed is
0.667. It means only 66.7% of the variation in NPM van be explained by the
variation of independent variables ER, IR, CR, and SGR. The other 33.3% is
influenced by another factor.
1.1.2. Forecasting Model
For the forecasting process, this research have resulted an equation model that can
be used for predicting NPM value when it comes to ER, IR, CR, and SGR
influences. Below is the equation:
NPM = 0.257 – 0.248 ER – 0.630 CR + 0.610 SGR
Equation 8 – Forecasting Model for NPM
The equation can be explained as follow:
1. The value of constant (a) is 0.257 which show the value of NPM increases
when the value of ER, IR, CR, and SGR is zero.
2. The value of coefficient β1 or ER is -0.248 which has negative relationship.
Means when the value of ER increases, the value of NPM will decrease, and
vice versa.
3. The value of coefficient β2 or IR is -0.144 which has negative relationship.
Means when the value of IR increases, the value of NPM will decrease, and
vice versa.

58
4. The value of coefficient β3 or CR is -0.630 which has negative relationship.
Means when the value of CR increases, the value of NPM will decrease, and
vice versa.
5. The value of coefficient β4 or SGR is 0.610 gives signal of positive
relationship between SGR and NPM. Means if the value of SGR increases,
the value of NPM will also increases.
5.2. Recommendation
A. For Unilever Indonesia
The researcher has several recommendations as follow:
1. Unilever Indonesia may use the regression model in this research to help
in profits forecasting using NPM ratio if the company is using ER, IR, CR,
and SGR as the indicators.
2. SGR effect on NPM are quite good, it has positive relationship. When
SGR increases, the NPM also is likely to increase and vice versa. But
company should be careful because if the sales are increasing more and
more, the production cost also increase that may effect on higher selling
price time by time. Usually the customers will change their option from
Unilever product to others competitor’s products. So the researcher
recommends the Unilever Indonesia to watch out the production costs to
stable even the sales are going up.
B. For Next Research
The variation in dependent variable that is explained by the set of independent
variables is about 67.2%. Therefore, the researcher hope that next researcher can
identify stronger variables, such as Interest Rate or other financial ratios that
influence the NPM in Unilever Indonesia and also provide better regression
model.

59
REFERENCES
TEXT BOOKS
Alexandri, M. B. (2008). Manajemen Keuangan Bisnis. Bandung: Alfabeta.
Bastian, I. S. (2006). Akuntansi Perbankan. Jakarta: Salemba Empat.
Baumol, B. (2006). Economics Principles and Policy. Mason: Pre-Press
Company, Inc.
Gujarati, D. (2003). Basic Econometrics, Second Edition. New York: McGraw
Hill.
J. McB.Grant, R. L. (2007). Economic Record. In R. L. J. McB.Grant, THE
EFFECT OF INFLATION ON COMPANY PROFITS and FINANCIAL
STRUCTURES (pp. 78-98). Adelaide: John Wiley & Sons, Inc.
Madura, J. (2003). International Financial Management, 7e. Ohio: South-
Western.
Mankiw, G. N. (2007). Macroeconomics. Jakarta: Erlangga.
Santoso, S. (2000). Buku Latihan SPSS Statistik Parametrik. Jakarta: PT. Elex
Media Komputindo.
HAND BOOKS
Ghozali. (2006). Aplikasi Analisis Multivariate dengan Program. Semarang:
Badan Penerbit Universitas Diponegoro.
Ghozali. (2009). Ekonometrika: Teori, Konsep dan Aplikasi dengan SPSS 17.
Semarang: Badan Penerbit Universitas Diponegoro.
President University. (2010). Thesis Guidelines : Faculty of Economics 2010.
Cikarang: President University.

60
President University. (2010). Thesis Guidelines : Faculty of Economics 2010.
Cikarang: President University.
Vieira, R. S. (2010). The relationship between liquidity and profitability: An
exploratory study of airline companies between 2005 and 2008. Swedia: Umeå
University.
JOURNALS
Abdul Kadir, S. P. (2012). Analisis Faktor-Faktor yang Mempengaruhi Net Profit
Margin Perusahaan Manufaktur yang Terdaftar Pada Bursa Efek Indonesia. Jurnal
Akuntansi , 13 (1), 1-15.
Bisma, I. D. (2009). Hubungan Antara Likuiditas (Current Ratio) Dengan
Profitabilitas (Earning Per Share) Pada Sektor Industri Kimia Yang Listed Di BEI
Tahun 2002 – 2008. Jurnal Ekonomi , 3 (2), 88-95.
Fitri, A. (2008). Analisis Pengaruh Nilai Tukar Mata Uang Terhadap Harga
Saham Pada Perusahaan Yang Terdaftar Di BEJ. Jurnal Ekonomi , 9-26.
Grant, M. (1956). THE EFFECT OF INFLATION ON COMPANY PROFITS
and FINANCIAL STRUCTURES. Economic Record , 78-98.
Manivasugeni, T. (2011). Analysis of Exchange Rate and Inflation Rate Towards
Sales of PT. System Indonesia. Journal of Business Management , 131-151.
Permatasari, E. (2008). Membangun Leading Dan Coincident Indicators Untuk
Inflasi Di Indonesia. Jurnal Ekonomi , 10-11.
Walker, J. (2007). THE IMPACT OF EXCHANGE RATE FLUCTUATIONS
ON PROFIT MARGINS: THE UK CAR MARKET, 1971-2002. Journal of
Applied Economics , 213 - 235.
Wibowo, E. S. (2012). Analisis Pengaruh Suku Bunga, Inflasi, CAR, BOPO, NPF
Terhadap Profitabilitas Bank Syariah. Journal Thesis , 2-10

61
INTERNET SOURCES
http://www.accounting-simplified.com/financial/ratios-analysis/current.html
http://www.ccdconsultants.com/documentation/financial-ratios/net-profit-margin-
interpretation.html
http://www.arcashflow.com.au/cash-flow-revenue-sales-growth-effect/1351
http://www.euroinvestor.com/ei-news/2012/07/17/how-exchange-rate-
fluctuations-affect-companies/19796
http://www.financial-
dictionary.thefreedictionary.com/_/dict.aspx?rd=1&word=Sales+Growth
http://beginnersinvest.about.com/od/incomestatementanalysis/a/net-profit-
margin.htm
http://www.investopedia.com/university/ratios/liquidity-measurement/ratio1.asp
http://inflationdata.com/articles/2013/01/31/costs-of-inflation/
http://www.investopedia.com/articles/fundamental/04/042804.asp
http://bizfinance.about.com/od/financialratios/a/Profitability_Ratios.htm
http://www.economicshelp.org/macroeconomics/exchangerate/effects.html
http://www.economicshelp.org/macroeconomics/exchangerate/factors-influencing
http://www.economicshelp.org/macroeconomics/inflation/definition
http://www.tutor2u.net/business/gcse/external_environment_economic_exchange
_rates.htm
http:/www.tutor2u.net/blog/index.php/business-studies/comments/qa-how-is-the-
current-ratio-calculated-and-interpreted
http://www.investopedia.com/terms/i/inflation.asp

62
http://www.investopedia.com/financial-edge/0212/inflation-and-economic-
recovery.aspx
http://www.investopedia.com/terms/p/profitmargin.asp
http://www.economicshelp.org/blog/476/inflation/importance-of-inflation-for-
industry/

63
APPENDICES
A. Data That Constructed in Microsoft Excel
Table 1. Value of Rupiah per Dollar 2005 – 2012
Month 2005 2006 2007 2008 2009 2010 2011 2012
Mar 9.324 9.126 9.118 9.217 11.575 9.128 8.717 9.119
June 9.568 9.316 9.054 9.225 10.225 9.103 8.521 9.404
Sept 10.181 9.098 9.137 9.378 9.681 8.931 8.721 9.518
Dec 9.809 9.041 9.419 10.950 9.400 8.978 9.043 9.598
Source: www.bi.go.id
Table 2. Exchange Rate of Rupiah per Dollar 2005 – 2012
Month 2005 2006 2007 2008 2009 2010 2011 2012
Mar 1.00 0.93 1.00 0.99 1.06 0.97 0.97 1.01
June 1.03 0.98 0.99 1.00 0.88 1.00 0.98 1.03
Sept 1.05 1.00 1.03 1.02 0.95 0.98 1.02 1.01
Dec 1.00 1.00 1.01 1.17 0.97 1.01 1.04 1.01
Source: Constructed by researcher
Table 2. Inflation Rate Data 2005 – 2012
Month 2005 2006 2007 2008 2009 2010 2011 2012
March 1.06 0.66 0.63 1.12 0.12 0.33 0.23 0.29
June 0.35 0.29 0.06 0.66 -0.05 0.47 0.12 0.30
Sept 0.67 0.39 0.76 0.95 0.69 0.92 0.62 0.55
Dec 3.32 0.80 0.69 0.18 0.16 0.53 0.26 0.26
Source: www.bps.go.id

64
Table 3. Current Ratio Data 2005 – 2012
Month 2005 2006 2007 2008 2009 2010 2011 2012
March 160% 171% 160% 120% 124% 128% 100% 84%
June 127% 116% 120% 97% 95% 88% 77% 76%
Sept 162% 145% 140% 119% 112% 96% 80% 84%
Dec 135% 127% 111% 100% 100% 85% 69% 67%
Source: www.unilever.co.id
Table 4. Sales growth rate Rate 2005 – 2012
Month 2005 2006 2007 2008 2009
Mar 11.15% 16.86% 19.06% 28.75% 17.27%
June 0.75% 1.09% 5.42% 1.21% 0.20%
Sept 11.40% 13.73% 14.13% 7.89% 1.87%
Dec 12.27% 14.86% 14.15% 7.57% 3.89%
Source: www.unilever.co.id
Cont’d Sales growth rate Rate
*note: number in the red one means minus (decreasing)
Table 5. Net Profit Margin 2005 – 2012
Month 2005 2006 2007 2008 2009
Mar 17.14% 15.71% 16.88% 18.57% 17.16%
June 16.46% 15.85% 17.06% 17.96% 16.70%
Sept 15.76% 15.84% 16.41% 17.41% 16.86%
Dec 14.42% 15.19% 15.66% 15.45% 16.68%
Source: www.unilever.co.id
Cont’d Net Profit Margin
Month 2010 2011 2012
Mar 5.04% 13.25% 7.43%
June 0.47% 2.25% 2.29%
Sept 3.78% 1.07% 3.39%
Dec 5.10% 4.93% 0.36%

65
Month 2010 2011 2012
Mar 19.54% 17.63% 17.61%
June 17.84% 18.05% 17.44%
Sept 17.37% 17.47% 17.96%
Dec 17.20% 17.74% 17.72%
B. Data that Constructed in SPSS 20
ER IR CR SGR NPM
1.00 1.06 1.60 .11 .17
1.03 .35 1.27 -.01 .16
1.05 .67 1.62 .11 .16
1.00 3.32 1.35 -.12 .14
.93 .66 1.71 .17 .16
.98 .29 1.16 -.01 .16
1.00 .39 1.45 .14 .16
1.00 .80 1.27 -.15 .15
1.00 .63 1.60 .19 .17
.99 .06 1.20 -.05 .17
1.03 .76 1.40 .14 .16
1.01 .69 1.11 -.14 .16
.99 1.12 1.20 .29 .19
1.00 .66 .97 .01 .18
1.02 .95 1.19 .08 .17
1.17 .18 1.00 -.08 .15
1.06 .12 1.24 .17 .17
.88 -.05 .95 .00 .17
.95 .69 1.12 .02 .17
.97 .16 1.00 .04 .17
.97 .33 1.28 .05 .19
1.00 .47 .88 .00 .18
.98 .92 .96 -.04 .17
1.01 .53 .85 .05 .17
.97 .23 1.00 .13 .18
.98 .12 .77 .02 .18
1.02 .62 .80 .01 .17
1.04 .26 .69 .05 .18
1.01 .29 .84 .07 .18
1.03 .30 .76 .02 .17

66
1.01 .55 .84 .03 .18
1.01 .26 .67 .00 .18