analysis of displacement- controlled fretting …itzhak.green.gatech.edu/rotordynamics/analysis...
TRANSCRIPT

Huaidong YangG. W. Woodruff School of Mechanical
Engineering,
Georgia Institute of Technology,
Atlanta, GA 30332-0405
e-mail: [email protected]
Itzhak GreenG. W. Woodruff School of Mechanical
Engineering,
Georgia Institute of Technology,
Atlanta, GA 30332-0405
e-mail: [email protected]
Analysis of Displacement-Controlled Fretting Betweena Hemisphere and a Flat Blockin Elasto-Plastic ContactsThis work employs a three-dimensional (3D) finite element analysis (FEA) to investigatethe fretting metallic contact between a deformable hemisphere and a deformable flatblock. Fretting is governed by displacement-controlled action where the materials of thetwo contacting bodies are set to have identical properties; studied first is steel-on-steeland then copper-on-copper. At contact onset, a normal interference (indentation) isapplied, which is then followed by transverse cyclic oscillations. A large range of coeffi-cients of friction (COFs) is imposed at the interface. The results show that the maximumvon Mises stress is confined under the contacting surface for small COFs; however, thatmaximum reaches the contacting surface when the COFs are sufficiently large. It is alsoshown that fretting under sufficiently large COFs forms large plastic strains in “ring”like patterns at the contacting surfaces. Junction growth is found where the contactingregion is being stretched in the direction of the fretting motion. At large COFs, pileupsshow up at the edges of the contact. The fretting loops of the initial cycles are foundalong with the total work invested into the system. At certain interference, there exists acertain COF, which results in the largest work consumption. The magnitude of the COFis found to produce either partial slip (prone for fretting fatigue) or gross slip (prone forfretting wear). A scheme of normalization is proposed, and it is shown to be effective forthe two said materials that have vastly different material properties. Hence, the normal-ized results may well characterize a range of contact scales (from micro to macro) of var-ious ductile material pairs that behave in an elastic–plastic manner with strainhardening. [DOI: 10.1115/1.4041535]
1 Introduction
Fretting is a physical phenomenon that takes place between twosurfaces in contact under cyclic motion [1]. It occurs in assembliesof engineering elements with the existence of vibration, cyclicloading or cyclic temperature changes, as well as bearing racesand shafts, electrical contacts, reactor elements, turbine enginedisks [2–5], etc. Three different regimes of fretting are observedaccording to the types of the contact conditions: stick, mixedstick–slip, and gross slip [6]. The stick conditions correspond tolow damage fretting. The mixed stick–slip conditions mainlyresult in a fatigue crack formation, while the gross slip conditionsare mainly responsible for wear [7]. This work studies the effectsof elasto-plastic three-dimensional (3D) spherical contact on themechanisms of fretting damage, and the propensity for wear,crack initiation, and propagation.
Gordelier and Chivers suggest a method of categorizing thefretting by the loading conditions [8]. A load-controlled conditionrepresents the situation when the force is given while the relativedisplacement is an output. A displacement-controlled conditionrepresents the situation when the relative displacement is imposedwhile the force is an output. While practical situations may fallbetween these two extremes, the loading condition in this work isdisplacement-controlled as it is in Ref. [9].
The experiments conducted by Courtney-Pratt and Eisner [10]may be of the earliest studies related to the fretting phenomenon.They examine the underlying phase of the oscillatory tangentialloading applied at the contact between a metallic sphere andmetallic flat surfaces. The hysteresis loop is reported, and the
junction growth is indicated by the difference in the electrical con-ductance. Junction growth is also found by Parker and Hatch [11],and by Tabor [12]. Fretting damage (wear and fatigue) is investi-gated by increasing the number of loading cycles to the order ofthousands or even millions [13–17]. Coatings and lubricant condi-tions are found to mitigate fretting damage in these works. Someanalytical works on fretting contacts are done in Refs. [18–20].Jin et al. [18] proposed a geometry-independent coefficients offriction (COF) method in a two-dimensional (2D) cylinder-on-flatgross-slip fretting contact. Eriten et al. [19] proposed a physics-based partial slip modeling approach in 3D elastic andelastic–plastic contacts, and they further apply their model to flatrough surfaces [20].
Numerical analyses on fretting initiation start with the study ofpurely normal contact, where customarily they are done by thefinite element analysis (FEA) methodology. The elastic–plastic tofully plastic spherical normal contacts are studied in detail inRefs. [21–23]. The critical values at the onset of plasticity in thecontact including the interference, the maximum contact pressure,and the load are found by Jackson and Green [22]. Unidirectionalsliding in spherical 3D contacts is investigated numerically byFEA [24–26]. In the model by Holmberg et al. [24], of a rigidsphere pressed against elastic–plastic flat surfaces, ploughing andpileups are apparent in the results. The works of Green [26] inves-tigate the unidirectional sliding contact between two interferinghemispheres. The comparison between the results of FEA and asemi-analytical method (SAM) [27] is made in ample detail inRef. [26]. While the SAM results show similar trends compared tothose obtained from the FEA, the SAM cannot handle dissimilarmaterials where its results deviate steeply from those obtained byFEA with the increase of the interference (i.e., with the intensify-ing of strains and the spreading effects of plasticity). The aim inthis work is the fretting mechanism and its outcomes. The
Contributed by the Tribology Division of ASME for publication in the JOURNAL
OF TRIBOLOGY. Manuscript received June 21, 2018; final manuscript receivedSeptember 15, 2018; published online November 1, 2018. Assoc. Editor: WenzhongWang.
Journal of Tribology MARCH 2019, Vol. 141 / 031401-1Copyright VC 2019 by ASME
Downloaded From: https://tribology.asmedigitalcollection.asme.org on 02/11/2019 Terms of Use: http://www.asme.org/about-asme/terms-of-use

numerical means by which the results are obtained is of a lessersignificance. The numerical packages chosen for this investigation(ANSYS and ABAQUS) are tried-and-true, possessing vast arrays ofdatabase management and visualization. This is compounded witha meticulous effort undertaken to establish mesh and modelconvergence.
Fretting fatigue and wear happen under oscillatory motion.Stick and/or slip regions at the contact depend on the normal load-ing and the traction conditions at the interface. Fretting in 2Dcylindrical contact are investigated by FEA in Refs. [28–30]. Themodel in Refs. [30] and [31] utilizes displacement-controlled fret-ting conditions between a half cylinder and a flat block havingidentical [29] and dissimilar [31] material properties. The largevon Mises stresses (near the yield strength) and plastic strains arefound at the edges of the contact. The junction growth and thepileup at the edges are observed. The 3D fretting contacts arestudied in Refs. [32] and [33]. Both works model the contactbetween a rigid flat and a deformable hemisphere. Zolotarevskiyet al. [32] focused on the full stick and force-controlled condi-tions. The evolution of the tangential load and the shake downphenomenon are reported. Shi et al. [33] focused on the partialslip condition with both force-controlled and displacement-controlled loadings. The junction growth and shake down areinvestigated. However, the sliding and gross slip conditions, orscars on the flat are excluded from these two analyses.
The fretting phenomenon is investigated in this work by model-ing a 3D contact between a hemisphere and a flat block subject tocontrolled displacements. The block is sufficiently large and thickto be considered as a half-elastic space. A constant interference isfirst applied to the top surface of the hemisphere followed then byoscillatory tangential displacements. The current 3D point contactloading (or indentation) is distinctly different from the line contactinvestigated in Ref. [25]. The material properties of the two con-tacting bodies are identical. First, steel pairs and later copperpairs, both having 1% strain hardening, are used to test a normal-ization scheme that is offered. Different coefficient of frictionsand interferences are applied in the model. The distribution of thevon Mises stresses, plastic strains, deformed surface profiles, junc-tion growth, the evolution of the tangential force, and the workdone to the system are reported in this work.
2 The Model
The fretting model represents contact between an oscillatinghemisphere and a stationary flat block (Fig. 1). In order to takeadvantage of the symmetry of the problem, the hemisphere andthe block are cut in half along the vertical plane. As shown inFig. 1(a), a quarter sphere with radius R¼ 0.5 m is in contact witha 4R� 2R�R block. The coordinate system is shown in Figs. 1(b)and 1(c). For brevity, the positive and negative X directions areimplicitly represented by “right” and “left.”
Roller boundary conditions of no displacement normal to theplane are applied to the vertically cut plane of the quarter sphere(due to the symmetry with respect to XY plane) and to all the fivefaces of the block, except to the top face (the XZ plane), which isfree to deform in all directions. Such boundary conditions makethe block behave as an elastic half space due to the Saint Venantprincipal, as discussed later.
The hemisphere and the block are set to possess identical mate-rial properties, and the reported results are obtained first for asteel-on-steel interface. Later, the case of copper-on-copper isused to generate results for verification of a normalization scheme.The material properties are listed in Table 1. Both materials areassumed to possess a 1% strain hardening based on the elasticmodulus. That amount of the tangential modulus is verified not tosignificantly affect the FEA results, yet it improves the conver-gence times in ANSYS. The code ABAQUS is used too on select casesjust to verify result. Adhesion is not considered in this work.
The fretting model is shown in Fig. 1(d). A vertical displace-ment, x, is first applied on the top surface of the hemisphere and
is kept constant throughout. Then, a following oscillatory horizon-tal displacement in the X direction, d, is applied. The hemisphereis initially forced to the “right.” The movement is achieved quasi-statically. It takes 40 loading steps to finish one cycle of horizon-tal displacement. The fretting model in this work is similar to the2D fretting model in Ref. [30], but here the model is 3D. Someadditional details can be found in Ref. [25].
In the regime of static elastic normal contact, the Hertziantheory gives the solution to the 3D spherical contact [34]. Given anormal load, P, the contact radius, a, is obtained by
a ¼ 3PR
4E0
� �13
(1)
E0 is the equivalent elastic modulus
1
E0¼ 1� �2
1
E1
þ 1� �22
E2
(2)
Since the material properties of the hemisphere and block are thesame, herein, E1¼E2¼E, and �1¼ �2¼ �. The maximum contactpressure, p0, and the interference, x, are given in the followingequations:
p0 ¼3P
2pa2(3)
x ¼ pp0
2E0
� �2
R (4)
According to Green [35], the ratio between the maximum pressureand the maximum von Mises stress in normal elastic contact isdefined by Cð�Þ ¼ po=re�max, where C(v) ¼1.30075þ 0.87825 vþ0.54373 v2. At the onset of yielding, the distortion energy theoryasserts that re�max ¼ Sy. The critical maximum pressure, P0c, is,therefore, replaced by the product C(�)Sy, to establish critical val-ues via Eqs. (1)–(4). The critical contact radius, ac, the criticalload, Pc, the critical interference, xc, and the critical elastic strainenergy, Uc, at which the maximum von Mises stress reaches theyield strength, Sy, are derived in Ref. [35]
ac ¼pCSyR
2E0(5)
Pc ¼pCSyð Þ3R2
6E02(6)
xc ¼pCSy
2E0
� �2
R (7)
Uc ¼pCSyð Þ5R3
60E04(8)
Note that C(�) and Sy always appear together as a single productterm representing a combined material property. By substitutingthe material properties of Table 1 in Eqs. (5)–(8), the said criticalparameters are obtained and are listed in Table 2. The critical con-tact area is calculated based on ac, Ac¼ p ac
2. Note that the criti-cal values of the two loading cases are vastly different. Thesecritical values are subsequently used to normalize (i.e., generalize)results within this work.
The scheme of normalization in this work is achieved by utiliz-ing the normalized interference, namely 1*xc, 2*xc, 3*xc, whilekeeping the amplitude of the horizontal displacement 1*xc con-stant throughout. It allows the results to be applied to the practicalsituations both microscopically and macroscopically. As adisplacement-controlled model, the interference and the horizon-tal displacement are inputs, and the normal and tangential forces
031401-2 / Vol. 141, MARCH 2019 Transactions of the ASME
Downloaded From: https://tribology.asmedigitalcollection.asme.org on 02/11/2019 Terms of Use: http://www.asme.org/about-asme/terms-of-use

are obtained as reaction forces from the software (from eitherANSYS or ABAQUS).
3 Mesh
Elements Solid 186 and Solid 187 are used to mesh the modelin ANSYS 17.1 (shown in Fig. 2). There are 161,830 elements. Thesize of the refined mesh in the contact area is 5� 10�4m. Approxi-mately 6000 contact elements (CONTA174 and TARGE170) oneach side of the contact are used to simulate frictionless and fric-tional contacts.
In order to validate the model, the mesh convergence is firstperformed in the regime of elastic contact for which a closed-form Hertzian solution exists [34], and the results are thencompared. The following results are shown for contacts betweenidentical steels. The same procedure is performed for the contactbetween an identical pair of copper with similar outcomes and forbrevity these are omitted.
With the input of x/xc, the interference, x, is obtained usingthe aforementioned xc¼ 0.222 mm. By substituting x intoEq. (4), the maximum contact pressure, p0, is obtained, and byusing Eqs. (1)–(3), the total load applied to the contact, P, andcontact radius, a, are then calculated. In the FEA simulation, with
the input of the interference, x, the total of the normal reactionforce at the bottom of the block, P, the maximum contact pressureon the contacting region, p0, and the radius of the contactingregion, a, are extracted from ANSYS. The results are shown inTable 3 for steel-on-steel normal contact. Varying x/xc from 0.2to the onset of plasticity, x/xc ¼ 1, the load differs by a maximumof 2.28%, contact radius 3.70%, and maximum contact pressure4.07%. The difference is higher when the interference is lowerbecause extremely fine meshes are needed at lower interferencesto capture the contact. However, the results are rather accurateabout the 1*xc interference and above. Therefore, the model andmesh converge using ANSYS have been established. It is noted thatfor verification purposes a similar model is executed using ABAQUS
with practically identical results, with similar execution times.Since, for elastic–plastic contacts under combined normal and
tangential loads, there is no closed-form solution, in that regimethe elements of the mesh are iteratively refined by a factor of twountil there is less than 2% difference in the contact radius betweeniterations.
With the converged mesh, the 4R� 4R�R flat block is scaledby a factor a in all three dimensions, ranging from 1/16 to 4, inorder to verify the reasonability of taking the block as a half elas-tic space. The comparison between the theoretical and the numeri-cal values at the critical interference, xc, is shown in Table 4,where %dif represents the relative percentage difference. In thetable, the FEA results agree very well with the theoretical valueswhen a varies from 1/2 to 4. When a is 1/4 or smaller, however,
Fig. 1 Schematic of a 1=4 sphere in contact with a flat block, along with the loading definitions
Table 1 Material properties of steel and copper [12]
MaterialsElastic
modulus (GPa) EYielding
strength (MPa) Sy
Poisson’sratio �
Steel 200 911.5 0.32Copper 115 124 0.34
Table 2 The critical values for steel-on-steel and copper-on-copper contacts
Materials C(�) xc (lm) Pc (kN) Uc (J) ac (mm) Ac (mm2)
Steel 1.639 222 347 30.789 10.5 346.4Copper 1.662 12.4 2.68 0.013 2.49 19.48
Fig. 2 Finite element model in ANSYS 17.1
Journal of Tribology MARCH 2019, Vol. 141 / 031401-3
Downloaded From: https://tribology.asmedigitalcollection.asme.org on 02/11/2019 Terms of Use: http://www.asme.org/about-asme/terms-of-use

the numerical values start to deviate from the theoretical values.The smaller the block is, the larger the deviation. In that range ofa< 1=4, the boundary conditions applied on the block affect thestress distribution in the contact region, which changes the maxi-mum pressure, the contact area, and the load. But for a> 1=2, theclassical Saint-Venant’s Principle holds. Hence, a flat block ofdimensions 4R� 4R�R (a¼ 1) can clearly be regarded as a half-elastic space.
4 Results and Discussion
The results of the model described earlier are presented for nor-malized vertical interference, x� ¼ ðx=xcÞ, ranging from 1 (thelimit of the elastic regime) to 3 (in the elastic–plastic regime). Threedifferent COFs are applied, 0, 0.3, and 1. According to the wear con-trol handbook by Peterson and Winer [36], a COF¼ 0.3 is “typical”for metallic surface in dry contact, where a COF¼ 1 represents ahigh value. Therefore, with COFs¼ 0, 0.3, and 1, the contact condi-tions range from “frictionless” through “typical” to “high.” Nonethe-less, additional cases with different COFs have also been executedfor the parametric study in forthcoming Sec. 4.6. As shown in Fig. 3,load steps are used to impose the oscillatory horizontal displacementand extract results of the intermediate state. Step 0 corresponds tothe loading condition where the interference has been just appliedwhile the hemisphere is about to move horizontally. Each cycle ofthe horizontal displacement is achieved by 40 loading steps. Themaximum number of cycles of the oscillatory horizontal displace-ment is three because of the vast computational effort (132 h for asingle case on a 4 cores 3 GHz personal computer with a Xeon cen-tral processing unit).
In order to describe the location and the cycle number explic-itly, the following convention of notation is utilized. Points(A,B,C,D) represent, respectively, d¼ (0,1,0,�1)xc, and the cyclenumber is specified by n¼ 1,2,3. For instance, A2 corresponds tothe end of the first cycle, where d¼ 0* xc.
4.1 The Evolution of von Mises Stress. Figure 4 shows theevolution of the von Mises stress during three cycles of the
horizontal loading at 1*xc with l ¼ 0.3. Each picture is held atthe same gray scale with the highest intensity representing thelargest von Mises stress. The first parameter describes the viewfrom which the distribution of the von Mises stress is given, corre-sponding to the views defined in Fig. 1(a). The next two parame-ters are used to identify the horizontal load step, as discussedpreviously. For example, Figs. 4(a)–4(c) represent the horizontaldisplacement of the sphere, d¼ (0, 0.2, 1)*xc, respectively, inbranch A1–B1 (defined in Fig. 3) from the front view. Since thevon Mises stress distributions in the hemisphere and the blockappear as mirror images with very slight difference (caused by thegeometry dissimilarity), only the progressions of the von Misesstresses in the hemisphere are discussed in the following.
In order to analyze the von Mises stress under the contactingsurface (where plasticity is first to appear), the distributions of thevon Mises stress in the cut plane of the front view are shown inFigs. 4(a)–4(h). At the beginning, as shown in Fig. 4(a), there isonly one point under the contacting surface reaching the yieldstrength in the sphere after 1*xc interference is just applied. Itagrees with the prediction by Green [35]. Then, the hemispherestarts to move to the right as shown in Fig. 4(b). The region withlarge von Mises stresses in the hemisphere increases due to the
Table 3 Comparison of selected values between theoretical predictions and FEA results for a hemisphere of radius, R, in an elas-tic contact with a 4R 3 4R 3 R block
Theoretical predictions
Input Eq. (2) Eq. (1) Eq. (4) p0/C FEA results
x/xc x (mm) a (mm) P (kN) p0 (GPa) remax (GPa) a (mm) % dif P (kN) %dif p0 (GPa) %dif remax(GPa) %dif
0.2 0.044 4.71 31.0 0.668 0.408 4.88 3.70 30.3 �2.28 0.641 �4.07 0.393 �3.660.6 0.133 8.16 161 1.157 0.706 8.28 1.55 160 �0.82 1.147 �0.91 0.690 �2.331 0.222 10.53 347 1.494 0.911 10.6 0.65 344 �0.77 1.487 �0.47 0.899 �1.35
Note: x ranges from 0.2*xc to 1* xc. The prediction remax¼ p0/C is according to Green [35]. Herein, R¼ 0.5 m, �1¼ �2¼ 0.32, and E1¼E2¼ 200 GPa.
Table 4 Comparison of the critical values between theoretical predictions and FEA results for a hemisphere whose radius is R, incontact with a 4R 3 4R 3 R block scaled by a
Theoretical predictions FEA results
Scale factor a ac (mm) Pc (kN) P0c (GPa) remax (GPa) ac (mm) %dif Pc (kN) %dif P0c (GPa) %dif remax (GPa) %dif
1/16 10.53 347 1.494 0.9115 11.34 7.70 394 13.68 1.572 5.22 0.9864 8.221/8 11.08 5.25 369 6.25 1.530 2.45 0.9339 2.461/4 10.97 4.32 356 2.56 1.510 1.11 0.9123 0.101/2 10.78 2.36 350 0.86 1.501 0.52 0.9052 �0.701 10.60 0.65 344 �0.76 1.487 �0.46 0.8992 �1.352 10.74 2.01 346 �0.37 1.495 0.10 0.9008 �1.174 10.74 1.98 345 �0.57 1.494 0.04 0.9002 �1.24
Note: The scale factor a varied from 1/16 to 4. Herein, R¼ 0.5 m, �1¼ �2¼ 0.32, and E1¼E2¼ 200 GPa.
Fig. 3 Three cycles of oscillatory horizontal displacement
031401-4 / Vol. 141, MARCH 2019 Transactions of the ASME
Downloaded From: https://tribology.asmedigitalcollection.asme.org on 02/11/2019 Terms of Use: http://www.asme.org/about-asme/terms-of-use

introduction of the resisting tangential force. In Fig. 4(c), thehemisphere reaches the rightmost position, where von Mises stresson the contacting surface increases as another effect of the tangen-tial force. Then, the hemisphere turns back to the left, where theshakedown phenomenon is observed, as shown in Fig. 4(d), whereplasticity disappears, leaving only an elastic state. As the hemi-sphere slides to the further left, the largest von Mises stressesreappear under the contacting surface (Fig. 4(e)). The distributionof the von Mises stress stabilizes after the sphere passes the origin,and keeps that pattern until the hemisphere reaches the leftmostposition (Fig. 4(f)). As the hemisphere turns back to the right,another shakedown appears (Fig. 4(g)). Then, the largest vonMises stresses again reappear under the contacting surface as thehemisphere moves back to the origin (Fig. 4(h)), finishing onecycle of horizontal loading. The evolution of the von Misesstresses remains the same for the second and the third cycle, withthe same distributions of von Mises stress at A2, A3, and A4, asshown by ANSYS.
In addition to the front view, the bottom view of the distributionof the von Mises stresses showing the contacting surface of thehemisphere is shown in Fig. 4(i). Since the COF is relative small,the von Mises stress on the contacting surface is smaller than thatunder the surface in the bulk material and never reaches the yieldstrength during oscillatory horizontal loading (indicated byFig. 4(i), the evolutions of the other bottom views are omitted forbrevity). For this case of 1*xc and l¼ 0.3, the largest von Misesstress shows up always under the surface, where the cracks andfatigue are most likely to initiate and propagate.
However, as the COF increases, different evolutions of the vonMises stresses show up. Figure 5 depicts the evolution of the vonMises stress during three cycles of the horizontal loading at 1*xc
with l¼ 1. As shown in the front view, Fig. 5(a), after threecycles of loading, the largest von Mises stress appears at the edges
of the contact. In order to analyze the von Mises stress on the con-tacting surface, the bottom views of the von Mises stress distribu-tion in the hemisphere are shown in Figs. 5(b)–5(l).
At the very being beginning just after the vertical interference isapplied, the von Mises stress on the surface, as shown in Fig. 5(b),is relatively small, since the tangential force has not been intro-duced yet. Then, the hemisphere moves to the right. In Fig. 5(c),the large von Mises stresses form “rings” at the contacting edges.As the hemisphere slides further to the right, the “rings” spread tothe center until the whole contacting area is covered by the largevon Mises stresses (Fig. 5(d)). This is caused by continued accumu-lation of plastic deformation. After reaching the rightmost position(Fig. 5(d)), the hemisphere turns back to the left (Fig. 5(e)), whereshakedown is apparent. As the sphere slides to the left further, the“ring” of large von Mises stresses appears at the edges of the con-tact again (Figs. 5(f)–5(h)). When the hemisphere reaches the left-most position, the whole contacting area is covered by the largevon Mises stresses (Fig. 5(i)). Seemingly, Figs. 5(d) and 5(i) aremirror images at the two extreme side positions. Then, the hemi-sphere turns back to the right, and another shakedown appears (Fig.5(j)). As the hemisphere returns to the origin (Fig. 5(k)), the “rings”of large von Mises stresses show up at the contacting edges again.Comparing the distributions of von Mises stresses at the end of thefirst cycle and third cycle, the “rings” of large von Mises stress arestretched in the X direction, which indicates the stretching of thecontacting area (discussed in Sec. 4.3). In this case, once the fret-ting motion commences, the largest von Mises stress stays at theedges of the contacting area, where cracking and fatigue are mostlikely to initiate and propagate.
A conclusion can be drawn that, with small COF, the largestvon Mises stress is located under the surface, while with sufficientlarge COF, the largest von Mises stress shows up at the contactingsurface and is located at the edge of the contact.
Fig. 4 The evolution of von Mises stresses during three cycles of horizontal loading at 1* xc interference with l 5 0.3: (a) Frontview, 0*xc at A1-B1, (b) front view, 0.2*xc at A1-B1, (c) front view, 1*xc at A1-B1, (d) front view, 0.8*xc at B1-C1, (e) front view, 0*xc
at B1-C1, (f) front view, 21*xc at C1-D1, (g) front view, 20.8*xc at D1-A2, (h) front view, 0*xc at A2, and (i) bottom view, 0*xc at A4
Journal of Tribology MARCH 2019, Vol. 141 / 031401-5
Downloaded From: https://tribology.asmedigitalcollection.asme.org on 02/11/2019 Terms of Use: http://www.asme.org/about-asme/terms-of-use

4.2 The Evolution of the Equivalent Plastic Strain. Withthe von Mises stress reaching the yield strength, there are equivalentplastic strains, Ep, appearing in the model. Figure 6 shows the evolu-tion of the plastic strain at 1* xc interference with l¼ 1 for threecycles of horizontal loading. Figure 6(a) depicts the front view of thedistribution of Ep at the end of the third cycle. Evidently, the largeplastic strains are located at the surface of the contact. In order totrack the evolution of the plastic strain on the contacting surface, thebottom of the hemisphere during the fretting is shown in Figs.6(b)–6(h). There is no plastic strain shown on the bottom surfaceuntil the hemisphere slides 0.4* xc to the right (Fig. 6(b)), where theearliest plastic strain appears at the edge of the contact. As the hemi-sphere moves further to the right, the plastic strain gradually forms a“ring” at the edges of the contact (Figs. 6(c)–6(e)). This “ring” staysthere at the end of the first cycle, and it is stretched in the X directionjust as the distribution of the von Mises stresses do in Sec. 4.2. Asthe fretting motion proceeds, the “ring” of the plastic strain remainsat the edges of the contact (Figs. 6(f) and 6(g)), with multiple peaks,which are caused by the oscillatory motion.
The plastic strain is not found on the contacting surface for theabove case when the COF drops to 0.3. Instead, there is only slight
plastic strain under the surface (Epmax¼ 0.001 at A4) comparedwith that of the case of COF¼ 1 (Epmax¼ 0.1 at A4).
4.3 Junction Growth. During the fretting motion, the contactarea is found to increase in some cases, which is known as thejunction growth. Figure 7 shows the schematics of the contactregion at 1*xc with l¼ 1. The symbol “o” represents the regionat the loading step A1, i.e., at the beginning of the loading. Thesymbol “x” represents the region at the loading step A4, i.e., at theend of the three cycles of loading. In the figure, the contact regiongrows radially. However, the growth in the X direction is largerthan that in the Z direction, which stretches the contact region inthe X direction. It is corresponding to the stretch of the distribu-tion of von Mises stresses and plastic strains in the X direction(Secs. 4.2 and 4.3).
In order to calculate the contact area, the trapezoidal rule is uti-lized to integrate the discretized data as shown in Fig. 7. Figure 8shows the evolutions of the contact area at 1*xc with l¼ 0.3 andl¼ 1 during three cycles of horizontal loading. When the COF issmall (l¼ 0.3), the von Mises stress on the contacting surfacenever reaches the yield strength (Sec. 4.1), which introduces no
Fig. 5 The evolution of von Mises stresses during three cycles of horizontal loading at 1* xc interference with l 5 1: (a) Front view,0*xc at A4, (b) bottom view, 0*xc at A1, (c) bottom view, 0.4*xc at A1-B1, (d) bottom view, 1*xc at A1-B1, (e) bottom view, 0.8*xc at B1-C1,(f) bottom view, 0.6*xc at B1-C1, (g) bottom view, 0.4*xc at B1-C1, (h) bottom view, 0.2*xc at B1-C1, (i) bottom view, 21*xc at C1-D1, (j)bottom view, 20.6*xc at C1-D1, (k) bottom view, 0*xc at A2, and (l) bottom view, 0*xc at A4
031401-6 / Vol. 141, MARCH 2019 Transactions of the ASME
Downloaded From: https://tribology.asmedigitalcollection.asme.org on 02/11/2019 Terms of Use: http://www.asme.org/about-asme/terms-of-use

plastic deformation on the surface (Sec. 4.2). As a result, there isno junction growth at 1*xc with l¼ 0.3. However, as the COFincreases to l¼ 1, the tangential force introduces plastic strain onthe surface (Sec. 4.2), which eventually causes the junction growth,as shown in Fig. 7. The junction growth continues during threecycles of loading, and it tends to stabilize after sufficient cycles.
4.4 Scars on the Surfaces of the Block. Figure 9 shows theprofile of the contacting region of the block after three cycles ofhorizontal loading, while the vertical interference is still main-tained at 1*xc with l¼ 1 at location A4. There are pileups at theedges of the contact (see also the inset). This is due to the plastic-ity on the surface, introduced by the friction force. When the COFdecreases to l¼ 0.3 with the same interference 1*xc, there is nopileup after three cycles of horizontal loading, as shown inFig. 10. It can be explained by the absence of plastic strain at thesurface, as indicated in Sec. 4.2. When the interference increasesto 3*xc with the COF of l¼ 1, the pileups show up again(Fig. 11), but they are not as pronounced as those for 1*xc inter-ference (Fig. 9). The explanation is as follows. First, it should benoted that ANSYS provides specific information regarding the statusof the contact, i.e., whether it is in full stick, partial slip, or grossslip. So, as the hemisphere starts to move from the original contactposition, the contact status is in full stick at first, but then it goesinto partial slip, and finally, it transitions to gross slip (i.e., whenthe local tangential stress reaches the value of COF*normal-pres-sure). For the cases with pileups, the contact status is full stick atthe rightmost and leftmost positions. The horizontal displacementapplied on the top surface of the hemisphere causes in general anelastic deformation of the bulk material and the displacement ofthe stick region. The smaller the displacement of the stick regionis, less pronounced the scar is. With a larger interference, the stickarea is more firmly fixed and it displaces less. Therefore, the
larger interferences introduce less pronounced scars with the sameCOF.
4.5 The Evolution of the Tangential Force. Figure 12shows the evolution of the tangential force during three cycles ofhorizontal loading with l¼ 1 at 1*xc interference. The tangentialforce (or traction), Q, is extracted from ANSYS similar to the nor-mal force, P. Specifically, the reaction forces on the top surface ofthe hemisphere are summed up in the horizontal direction, anddesignated as Q, to be the active force necessary to displace thehemisphere as prescribed. That force, Q, is normalized by the crit-ical load, Pc. As shown in Fig. 12, the normalized tangential force,
Fig. 6 The evolution of equivalent plastic strain during three cycles of horizontal loading at 1* xc interference with l 5 1: (a)Front view, 0*xc at A4, (b) bottom view, 0.4*xc at A1-B1, (c) bottom view, 0.6*xc at A1-B1, (d) bottom view, 0.8*xc at A1-B1, (e)bottom view, 1*xc at B1, (f) bottom view, 0*xc at A2, (g) bottom view, 0*xc at A3, and (h) bottom view, 0*xc at A4
Fig. 7 The schematics of the contact zone at the beginningand ending of the three cycles (A4) of loading at 1*xc with l 5 1
Journal of Tribology MARCH 2019, Vol. 141 / 031401-7
Downloaded From: https://tribology.asmedigitalcollection.asme.org on 02/11/2019 Terms of Use: http://www.asme.org/about-asme/terms-of-use

Q/Pc, tends to stabilize after the first quarter of the cycle. The evo-lution has the similar trend of the initial few cycles of the frettingloop as reported in Ref. [37]. The enclosed area represents thework consumption during the fretting motion. The maximum nor-malized tangential load increases after each cycles, and tends toreach the COF applied, l¼ 1. It is relatively smaller than theapplied COF due to the partial slip and partial stick contact condi-tions occurring at the rightmost and leftmost positions.
When the COF decreases to 0.3, the evolution of the normal-ized tangential force is shown in Fig. 13 (see the loop). The loopstabilizes after the first quarter of the cycle. The evolutions of thesecond and the third cycles are the same, which means the frettingmotion has stabilized after two cycles. Additionally, the maximumnormalized tangential force, which quantitatively equals to theeffective COF (le¼Q/Pc), stabilizes at the value of the COFapplied, l¼ 0.3. It is attributed to the full slip contact conditions(indicated by ANSYS) at the rightmost and leftmost positions.
The frictionless evolution of the tangential force at 1*xc is alsoshown in Fig. 13 (see the horizontal line). In that case, the tangen-tial force is always zero, which means that the elastic resistancecaused by the indentation is subtle. The frictionless evolutions ofthe tangential force are also investigated at different interferences.The tangential force stays at zero even when the interference isextended to 10* xc. The explanation is that since the two bodiesare made of the same material, the sphere is geometrically, i.e.,structurally, weaker than the block. The sphere then is deformedmore, so that there is no effective plowing during the frettingmotion, which leads to the zero tangential force. Therefore, whenfriction is present, the tangential force is generated by the fric-tional traction at the interface.
4.6 The Work Done to the System. As shown in Sec. 4.5, thearea under hysteresis curve of the tangential force represents thework invested into the system (Figs. 12 and 13). Considering loadingas quasi-static, the kinetic energy is not considered. Therefore, thework transfers to three kinds of energy: elastic strain energy, plasticstrain energy, and frictional energy dissipation.
The work, U, is derived by Eq. (9), where Q is the active tan-gential force applied on the top surface of the hemisphere toimpose d, which is the horizontal displacement of the hemisphere
Fig. 8 The evolution of junction growth at 1*xc with l 5 0.3 andl 5 1 during three cycles of horizontal loading
Fig. 9 The surface profile of the contacting region of the blockat 1*xc after three cycles of horizontal loading with l 5 1
Fig. 10 The surface profile of the contacting region of theblock at 1*xc after three cycles of horizontal loading withl 5 0.3
Fig. 11 The surface profile of the contacting region of theblock at 3*xc after three cycles of horizontal loading with l 5 1
Fig. 12 The evolution of the tangential force during threecycles of horizontal loading at 1*xc with l 5 1
031401-8 / Vol. 141, MARCH 2019 Transactions of the ASME
Downloaded From: https://tribology.asmedigitalcollection.asme.org on 02/11/2019 Terms of Use: http://www.asme.org/about-asme/terms-of-use
top surface. The trapezoidal rule is utilized to integrate the discre-tized data extracted from ANSYS
U ¼ð
Q dd (9)
Figure 14 shows the evolution of the total work done to the systemat 3*xc during three cycles of loading with different COFs.The work is normalized by the critical work, Uc¼ 30.789J (seeTable 2). The sliding distance represents the absolute distance thehemisphere passes, and the corresponding fretting motion position
is shown. Note that additional COFs cases are added here, includ-ing 0.001, 0.05, 0.08, 0.1, and 10. Taking the work evolution withl¼ 0.3 as an example, the work increases during the sliding of thehemisphere first to the right, which contains the three work formsdiscussed above. As the hemisphere turns back to the left at B1,the work drops because of the release of the elastic strain energy,which is further verified by the shakedown phenomenon in Sec.4.1. When the hemisphere approaches the origin at C1, the effectof the elastic strain energy is overshadowed by the dissipation offrictional and plastic effects. The work starts to increase againuntil another shakedown occurring at D1. The fluctuating natureof the evolution is caused by the restoration (i.e., release) of elas-tic strain energy, and the cumulative increase of the evolution iscaused by the dissipation of the fictional and plastic effects.
As the COF increases, the elastic strain energy effect becomesdominant, and the frictional dissipation decreases since most ofthe contacting area during fretting is in the stick condition (asindicated by ANSYS). Therefore, comparing l¼ 0.1 and l¼ 0.3,the work done to the system is larger in case with l¼ 0.3 initially,but then it becomes smaller as fretting continues. As the COFdecreases, the elastic strain energy effect is not dominant. But thefriction dissipation decreases as a result of the drop of the COF.Therefore, at a certain interference, there exists a certain(“critical”) COF, which produces the largest work dissipation.
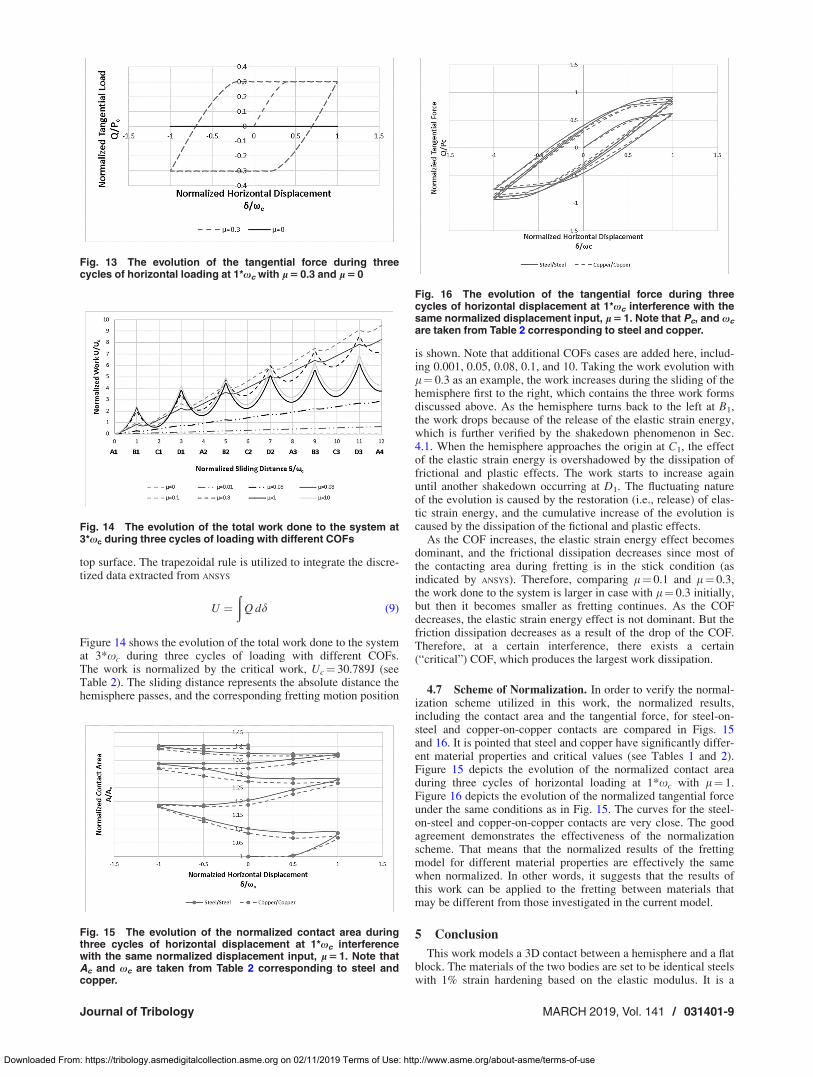
4.7 Scheme of Normalization. In order to verify the normal-ization scheme utilized in this work, the normalized results,including the contact area and the tangential force, for steel-on-steel and copper-on-copper contacts are compared in Figs. 15and 16. It is pointed that steel and copper have significantly differ-ent material properties and critical values (see Tables 1 and 2).Figure 15 depicts the evolution of the normalized contact areaduring three cycles of horizontal loading at 1*xc with l¼ 1.Figure 16 depicts the evolution of the normalized tangential forceunder the same conditions as in Fig. 15. The curves for the steel-on-steel and copper-on-copper contacts are very close. The goodagreement demonstrates the effectiveness of the normalizationscheme. That means that the normalized results of the frettingmodel for different material properties are effectively the samewhen normalized. In other words, it suggests that the results ofthis work can be applied to the fretting between materials thatmay be different from those investigated in the current model.
5 Conclusion
This work models a 3D contact between a hemisphere and a flatblock. The materials of the two bodies are set to be identical steelswith 1% strain hardening based on the elastic modulus. It is a
Fig. 13 The evolution of the tangential force during threecycles of horizontal loading at 1*xc with l 5 0.3 and l 5 0
Fig. 14 The evolution of the total work done to the system at3*xc during three cycles of loading with different COFs
Fig. 15 The evolution of the normalized contact area duringthree cycles of horizontal displacement at 1*xc interferencewith the same normalized displacement input, l 5 1. Note thatAc and xc are taken from Table 2 corresponding to steel andcopper.
Fig. 16 The evolution of the tangential force during threecycles of horizontal displacement at 1*xc interference with thesame normalized displacement input, l 5 1. Note that Pc, and xc
are taken from Table 2 corresponding to steel and copper.
Journal of Tribology MARCH 2019, Vol. 141 / 031401-9
Downloaded From: https://tribology.asmedigitalcollection.asme.org on 02/11/2019 Terms of Use: http://www.asme.org/about-asme/terms-of-use

displacement-controlled model with various COFs being appliedat the interface. Several conclusions are drawn:
(1) The largest von Mises stress is confined under the contact-ing surface with small COFs, while with sufficiently largeCOFs, the largest von Mises stress shows up at the contact-ing surfaces and is located at the edge of the contact.
(2) With sufficiently large COFs, the large plastic strains formmultiple “rings” on the contacting surfaces after the oscilla-tory fretting motion.
(3) Junction growth is found when there is plastic deformationon the surface of the contact. The contacting region isstretched in the direction of the fretting motion.
(4) There are scars on the surface of the block caused by thefretting motion. There are pileups at the edges of the con-tact with large COF. Since the magnitude of the oscillatorysliding distance is relatively small, 1*xc, the pileup phe-nomenon is not pronounced.
(5) The fretting loop of the initial cycles is found. The evolu-tion of the tangential force stabilizes fast with small COFs.The maximum effective COF during the cyclic loadingequals to the COF applied to the model after the stabiliza-tion. The tangential force is always zero at frictionless con-tact without the plowing effect, which is due to the spherebeing structurally weaker than the block.
(6) The work done to the system equals to the enclosed area ofthe hysteresis curve, which is the evolution of the tangentialloading. It corresponds to three kinds of energy: elasticstrain energy, plastic strain energy, and frictional energydissipation. The fluctuating nature of the evolution of thework is caused by the reservation of the elastic strainenergy, while the cumulative increase of the effect iscaused by the dissipation of the frictional and plastic dissi-pation. At certain interference, there exists a certain COF,which will yield the largest work done to the system.
(7) The current normalization scheme has been proven effec-tive to generate results for various material properties andscales.
Funding Data
� Department of Energy under Project 2506U87, AwardRH452.
Nomenclature
a ¼ contact radiusA ¼ contact areaac ¼ critical contact radiusAc ¼ critical contact areaC ¼ Poisson’s ratio parameterE ¼ elastic modulusE0 ¼ equivalent elastic modulusP ¼ normal force
p0 ¼ maximum contact pressurep0c ¼ critical maximum contact pressurePc ¼ critical normal forceQ ¼ tangential forceR ¼ radius of sphereS ¼ absolute sliding distance
Sy ¼ yield strengthUc ¼ critical elastic strain energyd ¼ horizontal displacement
Ep ¼ equivalent plastic strainl ¼ coefficient of friction
le ¼ effective coefficient of friction� ¼ Poisson’s ratio
re ¼ equivalent von Mises stressx ¼ interference
xc ¼ critical interferencex* ¼ normalized interference, x/xc
References
[1] Varenberg, M., Etsion, I., and Halperin, G., 2005, “Nanoscale Fretting WearStudy by Scanning Probe Microscopy,” Tribol. Lett., 18(4), pp. 493–498.
[2] Li, G., Ding, S., Bao, M., and Sun, H., 2017, “Effect of Actively ManagedThermal-Loading in Optimal Design of an Aeroengine Turbine Disk,” Int.Commun. Heat Mass Transfer, 81, pp. 257–268.
[3] Yang, Q., Zhou, W., Gai, P., Zhang, X., Fu, X., Chen, G., and Li, Z., 2017,“Investigation on the Fretting Fatigue Behaviors of Ti–6Al–4V Dovetail JointSpecimens Treated With Shot-Peening,” Wear, 372–373, pp. 81–90.
[4] Shi, L., Wei, D-S., Wang, Y-R., Tian, A-M., and Li, D., 2016, “An Investiga-tion of Fretting Fatigue in a Circular Arc Dovetail Assembly,” Int. J. Fatigue,82, pp. 226–237.
[5] Chan, K. S., Enright, M. P., Moody, J. P., Golden, P. J., Chandra, R., and Pentz,A. C., 2010, “Residual Stress Profiles for Mitigating Fretting Fatigue in GasTurbine Engine Disks,” Int. J. Fatigue, 32(5), pp. 815–823.
[6] Vingsbo, O., and S€oderberg, S., 1988, “On Fretting Maps,” Wear, 126(2), pp.131–147.
[7] Varenberg, M., Etsion, I., and Halperin, G., 2004, “Slip Index: A New UnifiedApproach to Fretting,” Tribol. Lett., 17(3), pp. 569–573.
[8] Hoeppner, D., Adibnazari, S., and Moesser, M. W., 1994, “Literature Review andPreliminary Studies of Fretting and Fretting Fatigue Including Special Applicationsto Aircraft Joints,” Utah University, Salt Lake City, UT, Report No. DOT/FAA/CT-93/2.
[9] Chivers, T., and Gordelier, S., 1985, “Fretting Fatigue and Contact Conditions:A Rational Explanation of Palliative Behaviour,” Proc. Inst. Mech. Eng., PartC, 199(4), pp. 325–337.
[10] Courtney-Pratt, J., and Eisner, E., 1957, “The Effect of a Tangential Force onthe Contact of Metallic Bodies,” Proc. R. Soc. London A, 238(1215),pp. 529–550.
[11] Parker, R., and Hatch, D., 1950, “The Static Coefficient of Friction and theArea of Contact,” Proc. Phys. Soc. Sect. B, 63(3), p. 185.
[12] Tabor, D., 1959, “Junction Growth in Metallic Friction: The Role of CombinedStresses and Surface Contamination,” Proc. R. Soc. London A: Math., Phys.Eng. Sci., 251(1266), pp. 378–393.
[13] Leonard, B. D., Sadeghi, F., Evans, R. D., Doll, G. L., and Shiller, P. J., 2009,“Fretting of WC/aC: H and Cr2N Coatings Under Grease-Lubricated and Unlu-bricated Conditions,” Tribol. Trans., 53(1), pp. 145–153.
[14] Leonard, B. D., Sadeghi, F., Shinde, S., and Mittelbach, M., 2012, “A NovelModular Fretting Wear Test Rig,” Wear, 274–275, pp. 313–325.
[15] Warhadpande, A., Leonard, B., and Sadeghi, F., 2008, “Effects of FrettingWear on Rolling Contact Fatigue Life of M50 Bearing Steel,” Proc. Inst. Mech.Eng., Part J, 222(2), pp. 69–80.
[16] Zhu, M., Zhou, Z., Kapsa, P., and Vincent, L., 2001, “Radial Fretting FatigueDamage of Surface Coatings,” Wear, 250(1–12), pp. 650–657.
[17] Xu, J., Zhu, M., Zhou, Z., Kapsa, P., and Vincent, L., 2003, “An Investigationon Fretting Wear Life of Bonded MoS2 Solid Lubricant Coatings in ComplexConditions,” Wear, 255(1–6), pp. 253–258.
[18] Jin, X., Sun, W., and Shipway, P., 2016, “Derivation of a Wear Scar Geometry-Independent Coefficient of Friction From Fretting Loops Exhibiting non-Coulomb Frictional Behaviour,” Tribol. Int., 102, pp. 561–568.
[19] Eriten, M., Polycarpou, A., and Bergman, L., 2010, “Physics-Based Modelingfor Partial Slip Behavior of Spherical Contacts,” Int. J. Solids Struct.,47(18–19), pp. 2554–2567.
[20] Eriten, M., Polycarpou, A., and Bergman, L., 2011, “Physics-Based Modelingfor Fretting Behavior of Nominally Flat Rough Surfaces,” Int. J. Solids Struct.,48(10), pp. 1436–1450.
[21] Kogut, L., and E, I., 2002, “Elastic–Plastic Contact Analysis of aSphere and a Rigid Flat,” ASME J. Appl. Mech., 69(5), pp. 657–662.
[22] Jackson, R. L., and Green, I., 2005, “A Finite Element Study of Elasto-PlasticHemispherical Contact Against a Rigid Flat,” ASME J. Tribol., 127(2), pp.343–354.
[23] Tsukizoe, T., and Hisakado, T., 1968, “On the Mechanism of Contact BetweenMetal Surfaces—Part 2: The Real Area and the Number of the Contact Points,”ASME J. Lubr. Technol., 90(1), pp. 81–88.
[24] Holmberg, K., Laukkanen, A., Ronkainen, H., Wallin, K., Varjus, S., and Kos-kinen, J., 2006, “Tribological Contact Analysis of a Rigid Ball Sliding on aHard Coated Surface—Part I: Modelling Stresses and Strains,” Surf. Coat.Technol., 200(12–13), pp. 3793–3809.
[25] Moody, J. J., 2007, “A Finite Element Analysis of Elastic-Plastic Sliding of Hem-ispherical Contacts,” M.S. thesis, Georgia Institute of Technology, Atlanta, GA.
[26] Green, I., 2018, “An Elastic-Plastic Finite Element Analysis of TwoInterfering Hemispheres Sliding in Frictionless Contact,” Phys. Sci. Int. J.,19(1), pp. 1–34.
[27] Boucly, V., Nelias, D., and Green, I., 2007, “Modeling of the Rolling andSliding Contact Between Two Asperities,” ASME J. Tribol., 129(2), pp.235–245.
[28] Gupta, V., Bastias, P., Hahn, G. T., and Rubin, C. A., 1993, “Elasto-Plastic Finite-Element Analysis of 2-D Rolling-Plus-Sliding Contact WithTemperature-Dependent Bearing Steel Material Properties,” Wear, 169(2),pp. 251–256.
031401-10 / Vol. 141, MARCH 2019 Transactions of the ASME
Downloaded From: https://tribology.asmedigitalcollection.asme.org on 02/11/2019 Terms of Use: http://www.asme.org/about-asme/terms-of-use

[29] Ghosh, A., Leonard, B., and Sadeghi, F., 2013, “A Stress Based DamageMechanics Model to Simulate Fretting Wear of Hertzian Line Contact in PartialSlip,” Wear, 307(1–2), pp. 87–99.
[30] Yang, H., and Green, I., 2018, “An Elastoplastic Finite Element Study ofDisplacement-Controlled Fretting in a Plane-Strain Cylindrical Contact,”ASME J. Tribol., 140(4), p. 041401.
[31] Yang, H., and Green, I., 2018, “A Fretting Finite Element Investigation of aPlane-Strain Cylindrical Contact of Inconel 617/Incoloy 800H at Room andHigh Temperature,” Proc. Inst. Mech. Eng. Part J (epub).
[32] Zolotarevskiy, V., Kligerman, Y., and Etsion, I., 2011, “Elastic–Plastic Spheri-cal Contact Under Cyclic Tangential Loading in Pre-Sliding,” Wear,270(11–12), pp. 888–894.
[33] Shi, X., Wu, A., Zhu, C., and Qu, S., 2013, “Effects of Load Configuration onPartial Slip Contact Between an Elastic Plastic Sphere and a Rigid Flat,” Tribol.Int., 61, pp. 120–128.
[34] Johnson, K. L., 1987, Contact Mechanics, Cambridge University Press, Cam-bridge, UK.
[35] Green, I., 2005, “Poisson Ratio Effects and Critical Valus in Spherical andCylindrical Hertzian Contacts,” Appl. Mech. Eng., 10(3), p. 451.
[36] Peterson, M. B., and Winer, W. O., 1980, Wear Control Handbook, AmericanSociety of Mechanical Engineers, New York.
[37] Walvekar, A. A., Leonard, B. D., Sadeghi, F., Jalalahmadi, B., and Bolander,N., 2014, “An Experimental Study and Fatigue Damage Model for FrettingFatigue,” Tribol. Int., 79, pp. 183–196.
Journal of Tribology MARCH 2019, Vol. 141 / 031401-11
Downloaded From: https://tribology.asmedigitalcollection.asme.org on 02/11/2019 Terms of Use: http://www.asme.org/about-asme/terms-of-use