analysis of differential prediction of law school performance by
TRANSCRIPT

LSAT TECHNICAL REPORT SERIES
Analysis of Differential Prediction of Law School Performance by Racial/Ethnic Subgroups Based on 2008–2010 Entering Law School Classes Deborah A. Suto Lynne L. Norton Lynda M. Reese
Law School Admission Council LSAT Technical Report 12-02 October 2012
A Publication of the Law School Admission Council

The Law School Admission Council (LSAC) is a nonprofit corporation that provides unique, state-of-the-art admission products and services to ease the admission process for law schools and their applicants worldwide. More than 200 law schools in the United States, Canada, and Australia are members of the Council and benefit from LSAC's services.
© 2012 by Law School Admission Council, Inc. LSAT, The Official LSAT PrepTest, The Official LSAT SuperPrep, ItemWise, and LSAC are registered marks of the Law School Admission Council, Inc. Law School Forums, Credential Assembly Service, CAS, LLM Credential Assembly Service, and LLM CAS are service marks of the Law School Admission Council, Inc. 10 Actual, Official LSAT PrepTests; 10 More Actual, Official LSAT PrepTests; The Next 10 Actual, Official LSAT PrepTests; 10 New Actual, Official LSAT PrepTests with Comparative Reading; The New Whole Law School Package; ABA-LSAC Official Guide to ABA-Approved Law Schools; Whole Test Prep Packages; The Official LSAT Handbook; ACES
2; ADMIT-LLM; FlexApp; Candidate Referral Service;
DiscoverLaw.org; Law School Admission Test; and Law School Admission Council are trademarks of the Law School Admission Council, Inc. All rights reserved. No part of this work, including information, data, or other portions of the work published in electronic form, may be reproduced or transmitted in any form or by any means, electronic or mechanical, including photocopying and recording, or by any information storage and retrieval system without permission of the publisher. For information, write: Communications, Law School Admission Council, 662 Penn Street, PO Box 40, Newtown PA, 18940-0040. LSAC fees, policies, and procedures relating to, but not limited to, test registration, test administration, test score reporting, misconduct and irregularities, Credential Assembly Service (CAS), and other matters may change without notice at any time. Up-to-date LSAC policies and procedures are available at LSAC.org.

i
Table of Contents
Executive Summary ........................................................................................................ 1 Introduction ..................................................................................................................... 2 Methods ........................................................................................................................... 3
Sample ................................................................................................................... 3 LSAT Version ......................................................................................................... 4 Variables Used in the Study ................................................................................... 5 Analysis Methods ................................................................................................... 5
Results ............................................................................................................................. 6
Descriptive Statistics .............................................................................................. 6 Predictive Validity ................................................................................................. 16 Predicting First-Year Averages ............................................................................. 16
Conclusions ................................................................................................................... 23 References ..................................................................................................................... 24


1
Executive Summary
In the law school admission process, it is essential that the criteria used for admission are fair to all subgroups in the applicant population. One method used to evaluate the fairness of the admission process is to compare the predicted and actual first-year averages (FYAs) within individual law schools for various subgroups of the applicant population. The current study was designed to address questions of differential prediction of law school grades for various racial/ethnic subgroups.
The sample used in this study was drawn from the 2008, 2009, and 2010 entering law school classes, using data that were available from the Law School Admission Council (LSAC)-sponsored correlation studies. The study examined results for three racial/ethnic minority subgroups and the nonminority (White) subgroup. Data were analyzed from 178 law schools, each of which over the 3-year period enrolled 10 or more first-year students who identified themselves as Asian American, Black, or Latino and 10 or more first-year students who identified themselves as White.
Statistical analyses were used to predict FYAs using Law School Admission Test (LSAT) score alone, undergraduate grade point average (UGPA) alone, and the best predictive combination of LSAT score and UGPA. Analyses were carried out separately for all individual law schools included in the study, resulting in three prediction equations for each law school.
The results of the analyses indicate that FYA tended to be, on average, slightly overpredicted (i.e., predicted FYAs exceeded actual FYAs) for all three of the racial/ethnic minority subgroups studied here, with Black law students exhibiting the most overprediction and Asian American law students exhibiting the least overprediction. The combination of both LSAT score and UGPA provided the least amount of overprediction for racial/ethnic minority subgroups on the school level compared to the use of either single predictor alone. Overall, these results do not support the concern that LSAT score alone or the combination of LSAT score and UGPA may contribute to unfair admission decisions for the racial/ethnic subgroups studied here.
While considering the results of this study, the reader should keep in mind that they refer only to subgroup behavior and not to individuals. For example, while results may suggest that UGPAs alone may overpredict FYAs for Black law students on average, the performance of many individual Black law students may be underpredicted based solely on their UGPAs.
Finally, it is worth repeating that the average amount of overprediction or underprediction of FYAs found for the four racial/ethnic subgroups studied was very slight, regardless of the prediction equation that was used. In other words, this study provided no evidence that LSAT score, UGPA, or the combination of those two predictor variables unfairly predict future law school performance for any racial/ethnic subgroup.

2
Introduction
Over the past two decades, the proportion of racial/ethnic minority students in law schools has increased, due in part to efforts to increase diversity among law school students and, ultimately, within the legal profession. Between the academic years spanning from 1988–1989 to 2009–2010, Asian American representation among first-year law school students rose from 3.0% to 7.7%; Black representation among first-year law school students rose from 5.7% to 7.3%; and Latino representation among first-year law school students rose from 3.4% to 6.5% (Law School Admission Council and the American Bar Association Section of Legal Education and Admissions to the Bar, 2010).
While the representation of these racial/ethnic subgroups in first-year law school classes has increased, the difference between minority and nonminority performance on the Law School Admission Test (LSAT) remains significant. These differences in average LSAT scores continue to raise questions about the validity of the test for racial/ethnic minority test takers and about possible differences in prediction of law school performance as a consequence of relying in whole or in part on LSAT scores. One method used to evaluate the fairness of the LSAT is to compare the predicted and actual first-year averages (FYAs) for each law school for various subgroups of the applicant population. If one subgroup of the applicant population experiences either significantly more overprediction (i.e., average predicted FYA greater than average actual FYA) or significantly more underprediction (i.e., average predicted FYA less than average actual FYA) than some other subgroup, then differential prediction is said to occur. The purpose of the current study is to address questions of differential prediction for four student subgroups (three racial/ethnic minority subgroups and the nonminority [White] subgroup) based on data from the 2008, 2009, and 2010 first-year classes.
Indeed, these questions are not new to research sponsored by the Law School Admission Council (LSAC), nor are they unique to the LSAT or to the law school admission process. Several studies using LSAT data to investigate questions of differential subgroup validity have been sponsored previously by LSAC (Anthony & Liu, 2003; Linn & Hastings, 1984; Norton, Suto, & Reese, 2006; Norton, Suto, & Reese, 2009; Powers, 1977; Schrader & Pitcher, 1976a, 1976b; Stilwell & Pashley, 2003; Stilwell, Reese, & Pashley, 1998; Wightman & Muller, 1990). Differential prediction has also been the subject of research studies for other admission-testing programs such as the SAT (e.g., Breland, 1979; Mattern, Patterson, & Kobrin (2012); Mattern, Patterson, Shaw, Kobrin, & Barbuti, 2008; Ramist, Lewis, & McCamley-Jenkins, 1994; Sackett et al., 2012; Shaw, Kobrin, Patterson, & Mattern (2012); Stricker, Rock, & Burton, 1991; Willingham, Lewis, Morgan, & Ramist, 1990); the ACT (e.g., Noble, 2003; Noble, Crouse, & Schulz, 1996); the GMAT (e.g., Braun & Jones, 1981); and the GRE (e.g., Burton & Wang, 2005). Numerous studies focusing on the same questions in the arena of employment testing have also been reported (e.g., Houston & Novick, 1987; National Research Council, 1989; Schmidt & Hunter, 1981). Most of these studies concluded that, although there is evidence of differential prediction for racial/ethnic minorities, there is no evidence of test bias against those subgroups. That is, the use of the majority regression model or the pooled regression model tends to overpredict (or at least not underpredict) minority performance on the criterion variable.

3
The present study is part of an ongoing monitoring effort designed to address the following question: Does either of the traditional predictors of first-year law school performance—LSAT score and undergraduate grade point average (UGPA), or the combination of both—result in differential prediction for racial/ethnic minority applicants?
Earlier studies looked at similar questions. The Wightman and Muller (1990) study included data from Hispanic law students as well as from Black and Mexican American law students. That study provided limited representation among law schools, including data from 51 schools that had a sufficient number of Black students, 7 schools that had a sufficient number of Mexican American students, and 13 schools that had a sufficient number of Hispanic students. The Anthony and Liu (2003) study included data from Asian American students as well as from Black and Latino students. That study provided broad representation among law schools, including data from 118 schools that had a sufficient number of Asian American students, 142 schools that had a sufficient number of Black students, and 108 schools that had a sufficient number of Latino students. The Stilwell and Pashley (2003) study was similar to the Anthony and Liu (2003) study and was based on a sample that displayed a slight increase in school representation. That study included data from 128 schools that had a sufficient number of Asian American students, 147 schools that had a sufficient number of Black students, and 111 schools that had a sufficient number of Latino students. The Norton et al. (2006) study analyzed data from students who entered law school in 2002, 2003, and 2004. That study included data from 147 schools that had a sufficient number of Asian American students, 148 schools that had a sufficient number of Black students, and 124 schools that had a sufficient number of Latino students. The Norton et al. (2009) study analyzed data from students who entered law school in 2005, 2006, and 2007. Reflecting increased racial/ethnic minority enrollments, that study included data from 148 schools that had a sufficient number of Asian American students, 150 schools that had a sufficient number of Black students, and 133 schools that had a sufficient number of Latino students. The current study examines data for 2008, 2009, and 2010 law school entering classes. Continued increases in racial/ethnic minority enrollments were evident: The sample for this study comprised 157 schools that had a sufficient number of Asian American students, 153 schools that had a sufficient number of Black students, and 151 schools that had a sufficient number of Latino students.
Methods
Sample
The sample used in this study was drawn from the 2008, 2009, and 2010 entering law school classes. With a few exceptions, the data closely mirror the data that were used for the 2011 LSAT Correlation Studies. In general, this study includes law schools that participated in the 2011 LSAT Correlation Studies and had sufficient racial/ethnic minority and nonminority data available for the combined years of classes. Canadian law schools were excluded from this report because they did not participate in LSAC’s Credential Assembly Service (CAS). Three additional law schools were also excluded from this report because of insufficient numbers of nonminority students and evidence

4
that preselection effects distorted their results. The data from each participating ABA-approved law school were combined across years to ensure stability in the analysis and to increase the representation of the law school. In instances where a school experienced a change in grading scale or did not participate every year in the correlation studies, less than 3 years of data were available. While 182 ABA-approved and Canadian law schools participated in the 2011 LSAT Correlation Studies, 188 schools were represented in this study. The 188 schools included 176 ABA-approved schools that were participants in 2008, 184 ABA-approved schools that participated in 2009, and 176 ABA-approved schools that participated in 2010. Of the 188 schools, 165 had data for all three entering classes, 18 had data for two of the three classes, and 5 had data for a single class. The total pool included approximately 109,871 law school students across the three entering classes.
The current study focused on Asian American, Black, and Latino student subgroups. The racial/ethnic identity used for the correlation study data was based on a self-reported description code provided by students. Note that for the 2008 and 2009 entering classes, the Latino subgroup consisted of students who reported their ethnicity as either Hispanic or Mexican American. For the 2010 entering class, the Hispanic/Latino category is displayed as “Latino,” and the new categories of Native Hawaiian/Other Pacific Islander and Asian are combined and displayed as “Asian American.”
Data were analyzed separately for each law school that had 10 or more students from at least one of the racial/ethnic minority subgroups of interest and 10 or more students from the nonminority subgroup. Among the schools included in the sample, 157 had 10 or more students in both the Asian American and White student subgroups, 153 schools had 10 or more students in both the Black and White student subgroups, and 151 schools had 10 or more students in both the Latino and White student subgroups. Overall, 178 individual law schools had a sufficient number of students in one or more of the racial/ethnic minority subgroups of interest.
LSAT Version
All students whose data were used in this study were tested with the version of the LSAT given in 2010 or earlier. That version of the test included four 35-minute sections and one 35-minute variable section containing material that is used to pretest new questions or pre-equate new test forms. The variable section did not contribute to the test taker’s score. The specific item-type makeup was as follows:
Item Type No. of Items Time
Reading Comprehension 26–28 35 minutes
Logical Reasoning A 24–26 35 minutes
Logical Reasoning B 24–26 35 minutes
Analytical Reasoning 22–23 35 minutes

5
The total number of scored items on a form ranged from 100 to 102. A single score was derived from the sum of the total number of questions answered correctly across the four scored sections and then equated and reported on an LSAT scale ranging from 120 to 180. A writing sample was administered at the end of the test. Beginning in June 2005, the writing sample was extended from 30 minutes to 35 minutes. This writing assessment was not scored by LSAC, but copies of the writing sample were sent to all law schools to which the test taker applied.
Variables Used in the Study
The variables analyzed in this study are the same ones that are currently used in the correlation studies: FYA, UGPA, and LSAT score. LSAT score and UGPA are the predictor variables (i.e., the variables that are used to predict performance in the first year of law school). FYA—the measure of performance in the first year of law school—is the criterion variable, or the variable that is predicted using LSAT score and UGPA. Only students for whom data were available on each of the three variables were included in this study.
Additional operational details related to these three variables are given below:
First-year average. This variable is the average grade earned by the student in the first year of law school. FYA is provided for each student by the individual law schools. Different law schools use different scales for first-year grades. In order to maintain the confidentiality of the individual schools and to allow direct comparison across law schools, FYA values were transformed to a scale having a mean of 50 and a standard deviation of 10. Results presented in this report are on the transformed 50/10 scale.
Undergraduate grade point average. The average grade earned by each student during his or her undergraduate study is computed by the CAS, according to CAS procedures. Grades computed in this manner are expressed on a scale from 0.00 to 4.33. The UGPAs used in these studies are the same as those used in the correlation studies carried out for individual law schools.
LSAT scores. Only LSAT scores reported on the 120–180 scale were used in this study. For students with multiple LSAT scores, a single arithmetic average (i.e., mean) of the multiple scores was used. If any student took the test more than three times, only the most recent three scores were averaged.
Analysis Methods
This study was undertaken to evaluate the fairness and appropriateness of using LSAT score and UGPA to predict performance in law school for racial/ethnic minority students from a single prediction equation. This equation is developed from the combined data of all racial/ethnic minority and nonminority students. In other words, the study sought to evaluate the potential for differential prediction across Asian American, Black, Latino, and White law school student subgroups. The methods used to predict

6
FYA in the current study were the same as those used in the ongoing predictive validity studies for individual schools that participate in the correlation studies. As in the correlation studies, data were pooled from the 3 years under investigation in order to achieve stable results within schools. The evaluation included descriptive, validity, and predictive analyses. These analyses were carried out separately for each law school that had a sufficient number of students in the racial/ethnic minority and nonminority subgroups. The following is a more detailed description of these analyses:
The descriptive analysis presents statistics comparing racial/ethnic minority and nonminority student populations.
The validity analysis computes and compares the correlation coefficients for the different subgroups. Correlation coefficients are used to measure the linear relationship between the predictor variables (LSAT score and UGPA) and the criterion variable (FYA). Correlation values were calculated separately for each law school included in the study and averaged across schools.
For the predictive analysis, three separate least-squares regression calculations were used to predict FYA using LSAT score alone, UGPA alone, and a linear combination of LSAT score and UGPA as predictors. The difference between the predicted and actual FYA was calculated for each student within a law school and averaged for each subgroup at each school.
Results
The results from this study are presented in three parts. The first part includes descriptive data about the racial/ethnic minority and nonminority first-year students. The second part reports the validity coefficients between the predictor variables and FYA for each subgroup included in the analyses. In the third part, the results of applying the prediction equations derived using the total group data are reported for the separate subgroups.
Descriptive Statistics
Descriptive statistics for the sample of students within the law schools used in this study are presented in Tables 1–5 and Figures 1–3. These data provide information about the number and proportion of racial/ethnic minority and nonminority students and the size of the racial/ethnic minority subgroups among the law schools included in this study. The tables and figures allow for the comparison of LSAT score, UGPA, and FYA between racial/ethnic minority and nonminority student subgroups.
Table 1 describes the overall racial/ethnic subgroup breakdown among the 182 schools that participated in the 2011 LSAT Correlation Studies. Table 2 provides similar information for the 188 schools with data available for the current study. A comparison of the two tables shows that this study is very representative of the 2011 LSAT Correlation Studies sample. Of the 109,871 students at the 188 schools represented across the 3 years, 8,341 (7.6%) were Asian American; 7,562 (6.9%) were Black; 6,732

7
(6.1%) were Latino; and 79,659 (72.5%) were White. The analyses included 178 schools that met the sample size requirements. A total of 107,794 students were represented, of whom 8,176 (7.6%) were Asian American; 7,367 (6.8%) were Black; 6,520 (6.0%) were Latino; and 77,830 (72.2%) were White. The percentages of racial/ethnic minorities among schools included in this study are similar to the percentages reported by the Law School Admission Council and American Bar Association (2010) for all law schools.
Note that LSAC revised its method of race/ethnicity data collection beginning with the 2009–2010 testing year. The categories from which test takers may choose to describe themselves were updated. In addition, the category “Other” was dropped starting with this testing year. Test takers were also permitted to choose more than one race/ethnicity category, resulting in the category “Multiple Ethnicities.” Those who chose not to respond to the optional demographic questions are included in the respective “No Response” subgroups. For schools participating in the 2011 LSAT Correlation Studies, the changes to ethnic coding caused an increase in “No Response” rates in 2010 to 2,412 (6.3%) from 255 (0.8%) in 2008 and 226 (0.6%) in 2009. Overall, for the pooled data in Table 1, the “No Response” rate is 2,893 (2.7%).

8
TABLE 1 Number and percentage of Asian American, Black, Latino, and White first-year students among schools that were included in the 2011 LSAT Correlation Studies
Asian American Black Latino White
Entering Class
Total
No. of Schools
n
%
n
%
n
%
n
%
2008 33,584 172 2,597 7.7 2,272 6.8 1,945 5.8 24,532 73.0 2009 36,919 179 2,800 7.6 2,508 6.8 2,270 6.1 26,917 72.9 2010 38,226 182 2,835 7.4 2,530 6.6 2,220 5.8 27,687 72.4
Pooled data 108,729 182 8,232 7.6 7,310 6.7 6,435 5.9 79,136 72.8
Note: For the 2008 and 2009 entering classes, the Hispanic and Mexican American categories are combined and displayed as “Latino.” For the 2010 entering class, the Hispanic/Latino category is displayed as “Latino,” and the new categories of Native Hawaiian/Other Pacific Islander and Asian are combined and displayed as “Asian American.” TABLE 2 Number and percentage of Asian American, Black, Latino, and White first-year students among schools that were included in the current study
Asian American Black Latino White
Entering Class
Total
No. of Schools
n
%
n
%
n
%
n
%
2008 34,546 176 2,727 7.9 2,410 7.0 2,102 6.1 25,028 72.4 2009 37,905 184 2,870 7.6 2,633 6.9 2,414 6.4 27,532 72.6 2010 37,420 176 2,744 7.3 2,519 6.7 2,216 5.9 27,099 72.4 Pooled data 109,871 188 8,341 7.6 7,562 6.9 6,732 6.1 79,659 72.5 Analysis sample 107,794 178 8,176 7.6 7,367 6.8 6,520 6.0 77,830 72.2
Note: For the 2008 and 2009 entering classes, the Hispanic and Mexican American categories are combined and displayed as “Latino.” For the 2010 entering class, the Hispanic/Latino category is displayed as “Latino,” and the new categories of Native Hawaiian/Other Pacific Islander and Asian are combined and displayed as “Asian American.”

9
Table 3 provides a distribution of law schools by percentage of subgroup enrollment across the 188 law schools. Table 3 reveals that Asian American, Black, and Latino student subgroups have a representation of 0–10% in most of the law schools included in this study. Consequently, it also displays quite clearly that most of the law schools included in this study are made up primarily of White students.
TABLE 3 Distribution of law schools by percentage of subgroup enrollment
Asian American Black Latino White
% of Subgroup Enrollment
%
n
%
n
%
n
%
n
0–10 79.8% 150 89.9% 169 88.8% 167 0.5% 1 11–20 16.5% 31 6.9% 13 8.5% 16 0.5% 1 21–30 3.2% 6 0.5% 1 1.6% 3 0.5% 1 31–40 0% 0 0% 0 1.1% 2 1.6% 3 41–50 0% 0 1.1% 2 0% 0 2.1% 4 51–60 0.5% 1 1.1% 2 0% 0 9.0% 17 61–70 0% 0 0% 0 0% 0 17.0% 32 71–80 0% 0 0% 0 0% 0 34.0% 64 81–90 0% 0 0.5% 1 0% 0 32.4% 61 91–100 0% 0 0% 0 0% 0 2.1% 4
Note: For the 2008 and 2009 entering classes, the Hispanic and Mexican American categories are combined and displayed as “Latino.” For the 2010 entering class, the Hispanic/Latino category is displayed as “Latino,” and the new categories of Native Hawaiian/Other Pacific Islander and Asian are combined and displayed as “Asian American.”
Table 4 indicates that the sample included 157 law schools that met the sample size
requirements for Asian American and White students, 153 schools that met the requirements for Black and White students, and 151 schools that met the requirements for Latino and White students. For one or more of the three racial/ethnic minority subgroups of interest, 178 individual schools had sufficient data available for the analysis sample used in this study. This number was greater than that for earlier studies. The greatest increase occurred in the number of schools included for the Latino and White comparison. In this study period, 18 more schools met the sample requirements for this comparison as compared to the previous study period (Norton et al., 2009).
TABLE 4 Summary of the number of included law schools by size of racial/ethnic minority subgroup
Size of Subgroup
Race/Ethnicity 10–29 30–49 50–74 75–99 100 or More Total
Asian American 65 37 20 11 24 157 Black 70 40 24 8 11 153 Latino 69 37 22 11 12 151
Note: For the 2008 and 2009 entering classes, the Hispanic and Mexican American categories are combined and displayed as “Latino.” For the 2010 entering class, the Hispanic/Latino category is displayed as “Latino,” and the new categories of Native Hawaiian/Other Pacific Islander and Asian are combined and displayed as “Asian American.”

10
Table 5 provides descriptive statistics by racial/ethnic subgroup for the three variables used in the study. The data indicate that all three variables tend to be highest for the White subgroup, followed by the Asian American, Latino, and Black subgroups. These results are consistent with those for LSAT taker populations. The standard deviations for FYAs demonstrate the opposite pattern, with the greatest amount of variation among the Black subgroup and the least variation among the White subgroup. The variation in LSAT scores is highest for the Asian American and White subgroups. TABLE 5 Descriptive statistics of study variables for included law schools
Mean LSAT Mean UGPA Mean FYA
Race/Ethnicity Schools Mean SD Mean SD Mean SD
Asian American 157 156.54 5.68 3.30 0.22 47.07 2.13 Black 153 150.54 4.21 3.20 0.19 42.17 3.18 Latino 151 154.26 4.81 3.30 0.20 45.70 2.41 White 178 157.59 5.35 3.41 0.18 51.50 0.78
Note: For the 2008 and 2009 entering classes, the Hispanic and Mexican American categories are combined and displayed as “Latino.” For the 2010 entering class, the Hispanic/Latino category is displayed as “Latino,” and the new categories of Native Hawaiian/Other Pacific Islander and Asian are combined and displayed as “Asian American.”
Figure 1a presents the differences between mean LSAT score for Black and White
students. To analyze the data presented in this figure, the mean LSAT score was first calculated separately for each subgroup at each school. The difference between the means for the two subgroups being compared (i.e., LSAT mean for White students minus LSAT mean for Black students) was then determined. Figure 1a summarizes the number of schools displaying each LSAT mean difference observed. Figures 1b and 1c present similar analyses of mean differences in UGPA and FYA for the Black and White student subgroups, respectively. Figures 1a–1c reveal that White students tend to outperform Black students on each of the predictor variables (LSAT score and UGPA) and on the criterion variable (FYA in law school).

11
FIGURE 1a. Frequency distribution of differences between LSAT means for the Black and White student subgroups at the participating law schools
FIGURE 1b. Frequency distribution of differences between UGPA means for the Black and White student subgroups at the participating law schools
12
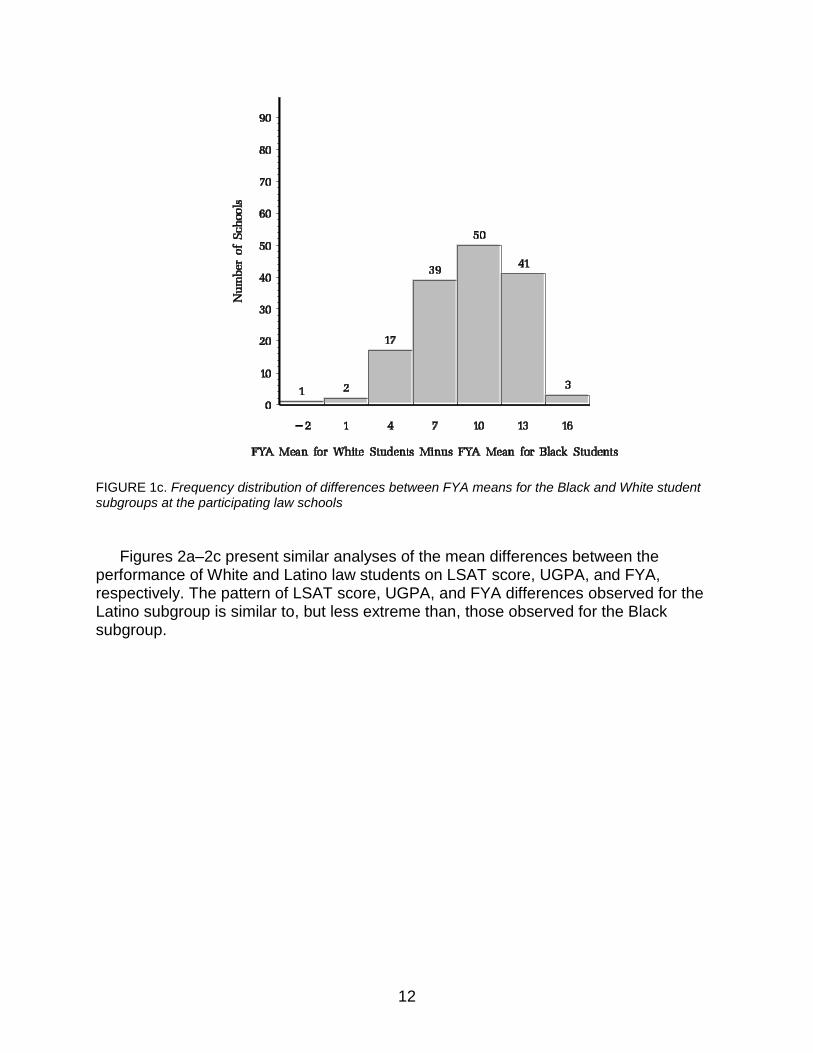
FIGURE 1c. Frequency distribution of differences between FYA means for the Black and White student subgroups at the participating law schools
Figures 2a–2c present similar analyses of the mean differences between the
performance of White and Latino law students on LSAT score, UGPA, and FYA, respectively. The pattern of LSAT score, UGPA, and FYA differences observed for the Latino subgroup is similar to, but less extreme than, those observed for the Black subgroup.

13
FIGURE 2a. Frequency distribution of differences between LSAT means for the Latino and White student subgroups at the participating law schools
FIGURE 2b. Frequency distribution of differences between UGPA means for the Latino and White student subgroups at the participating law schools

14
FIGURE 2c. Frequency distribution of differences between FYA means for the Latino and White student subgroups at the participating law schools
Figures 3a–3c present results comparing the performance of White and Asian
American law students on these variables. Differences reported for the Asian American subgroup tend to be smaller, but in the same direction as those reported for the other two minority subgroups.
FIGURE 3a. Frequency distribution of differences between LSAT means for the Asian American and White student subgroups at the participating law schools

15
FIGURE 3b. Frequency distribution of differences between UGPA means for the Asian American and White student subgroups at the participating law schools
FIGURE 3c. Frequency distribution of differences between FYA means for the Asian American and White student subgroups at the participating law schools

16
Predictive Validity
The relationships between the predictor variables (LSAT score and UGPA) and the criterion variable (FYA) are measured through the computation of correlation coefficients. Correlation coefficients can range in value from −1 to 1, where 1 represents a perfect positive linear relationship. For each school with a sufficient number of racial/ethnic minority students, the correlation coefficients for each subgroup were calculated separately by law school and averaged for all schools included in the comparison sample. Table 6 provides the correlations between the predictors—both alone and in combination—and FYA. For both racial/ethnic minority and nonminority subgroups, the combination of LSAT score and UGPA produces higher correlations than either predictor alone. The correlation coefficient for the combination of LSAT score and UGPA is highest for the Latino subgroup, with the other subgroups yielding slightly lower values. LSAT is a better predictor than UGPA for all subgroups. While these results are lower than those reported for the 2011 LSAT Correlation Studies, the ranges of scores and grades for the subgroups are narrower than for the complete first-year classes. This restriction of range contributes to understated correlation coefficients for these subsets of data. TABLE 6 Correlations of LSAT score, UGPA, and the combination of LSAT score and UGPA with FYA by racial/ethnic subgroup
Correlation
Race/Ethnicity Schools Students LSAT UGPA LSAT & UGPA
Asian American 157 8,176 0.26 0.19 0.41 Black 153 7,367 0.30 0.17 0.43 Latino 151 6,520 0.31 0.17 0.45 White 178 77,830 0.26 0.24 0.40
Note: For the 2008 and 2009 entering classes, the Hispanic and Mexican American categories are combined and displayed as “Latino.” For the 2010 entering class, the Hispanic/Latino category is displayed as “Latino,” and the new categories of Native Hawaiian/Other Pacific Islander and Asian are combined and displayed as “Asian American.”
Predicting First-Year Averages
The primary research question addressed by this study was whether or not LSAT score alone, UGPA alone, and the combination of both predictor variables differentially predicted FYA for racial/ethnic minority law school students as compared to nonminority law school students. One method to address this question is to determine how accurately LSAT score, UGPA, and a combination of both predictor variables predict performance in law school for various racial/ethnic subgroups. Figures 4–6 examine the differences between predicted and actual FYAs for the Asian American, Black, Latino, and White subgroups. Using least-squares regression, separate equations were derived to predict law school FYA for the total group of law school students within each individual law school for LSAT score alone, UGPA alone, and the combination of both predictor variables. Differences between predicted and actual FYA were then calculated for each subgroup based on each regression equation. For the difference calculation, the mean actual FYA earned by students at a participating school was subtracted from
17
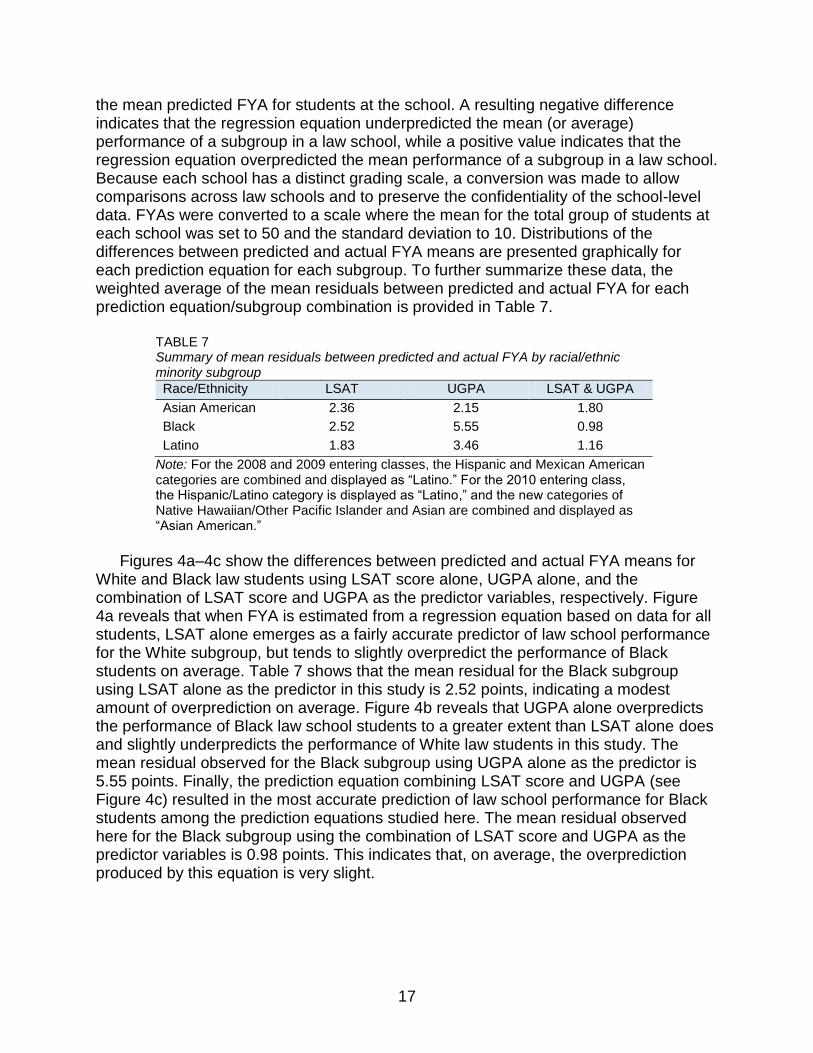
the mean predicted FYA for students at the school. A resulting negative difference indicates that the regression equation underpredicted the mean (or average) performance of a subgroup in a law school, while a positive value indicates that the regression equation overpredicted the mean performance of a subgroup in a law school. Because each school has a distinct grading scale, a conversion was made to allow comparisons across law schools and to preserve the confidentiality of the school-level data. FYAs were converted to a scale where the mean for the total group of students at each school was set to 50 and the standard deviation to 10. Distributions of the differences between predicted and actual FYA means are presented graphically for each prediction equation for each subgroup. To further summarize these data, the weighted average of the mean residuals between predicted and actual FYA for each prediction equation/subgroup combination is provided in Table 7.
TABLE 7 Summary of mean residuals between predicted and actual FYA by racial/ethnic minority subgroup
Race/Ethnicity LSAT UGPA LSAT & UGPA
Asian American 2.36 2.15 1.80
Black 2.52 5.55 0.98
Latino 1.83 3.46 1.16
Note: For the 2008 and 2009 entering classes, the Hispanic and Mexican American categories are combined and displayed as “Latino.” For the 2010 entering class, the Hispanic/Latino category is displayed as “Latino,” and the new categories of Native Hawaiian/Other Pacific Islander and Asian are combined and displayed as “Asian American.”
Figures 4a–4c show the differences between predicted and actual FYA means for
White and Black law students using LSAT score alone, UGPA alone, and the combination of LSAT score and UGPA as the predictor variables, respectively. Figure 4a reveals that when FYA is estimated from a regression equation based on data for all students, LSAT alone emerges as a fairly accurate predictor of law school performance for the White subgroup, but tends to slightly overpredict the performance of Black students on average. Table 7 shows that the mean residual for the Black subgroup using LSAT alone as the predictor in this study is 2.52 points, indicating a modest amount of overprediction on average. Figure 4b reveals that UGPA alone overpredicts the performance of Black law school students to a greater extent than LSAT alone does and slightly underpredicts the performance of White law students in this study. The mean residual observed for the Black subgroup using UGPA alone as the predictor is 5.55 points. Finally, the prediction equation combining LSAT score and UGPA (see Figure 4c) resulted in the most accurate prediction of law school performance for Black students among the prediction equations studied here. The mean residual observed here for the Black subgroup using the combination of LSAT score and UGPA as the predictor variables is 0.98 points. This indicates that, on average, the overprediction produced by this equation is very slight.

18
FIGURE 4a. Frequency distributions of differences between predicted and actual FYA means for Black and White student subgroups at participating law schools using LSAT as the predictor variable
FIGURE 4b. Frequency distributions of differences between predicted and actual FYA means for Black and White student subgroups at participating law schools using UGPA as the predictor variable

19
FIGURE 4c. Frequency distributions of differences between predicted and actual FYA means for Black and White student subgroups at participating law schools using LSAT score and UGPA as the predictor variables
The results for the Latino subgroup, presented in Figures 5a–5c, reveal a pattern
similar to the results observed for the Black subgroup, though performance of this subgroup is overpredicted by the single predictors to a lesser extent than that observed for the Black students. The mean residuals observed for the Latino subgroup using LSAT alone, UGPA alone, and the combination of LSAT score and UGPA as predictor variables were 1.83, 3.46, and 1.16, respectively (see Table 7). As was the case with the results reported for the Black subgroup, the combination of LSAT score and UGPA emerges as the most accurate predictor of law school performance for Latino students, and the use of UGPA alone to predict FYA results in the most overprediction among the equations studied here.

20
FIGURE 5a. Frequency distributions of differences between predicted and actual FYA means for Latino and White student subgroups at participating law schools using LSAT as the predictor variable
FIGURE 5b. Frequency distributions of differences between predicted and actual FYA means for Latino and White student subgroups at participating law schools using UGPA as the predictor variable

21
FIGURE 5c. Frequency distributions of differences between predicted and actual FYA means for Latino and White student subgroups at participating law schools using LSAT score and UGPA as the predictor variables
Predictive validity results for the Asian American subgroup are presented in Figures
6a–6c. The mean residuals observed for the Asian American subgroup were 2.36 for the equation using LSAT alone as the predictor, 2.15 for the equation using UGPA alone as the predictor, and 1.80 for the equation combining LSAT score and UGPA to predict FYA (see Table 7). These results differ from the pattern observed for the Black and Latino student subgroups in that the use of LSAT alone results in the most overprediction of FYA for the Asian American subgroup. Again, the overprediction observed for all three prediction equations is slight, on average.
FIGURE 6a. Frequency distributions of differences between predicted and actual FYA means for Asian American and White student subgroups at participating law schools using LSAT as the predictor variable

22
FIGURE 6b. Frequency distributions of differences between predicted and actual FYA means for Asian American and White student subgroups at participating law schools using UGPA as the predictor variable
FIGURE 6c. Frequency distributions of differences between predicted and actual FYA means for Asian American and White student subgroups at participating law schools using LSAT score and UGPA as the predictor variables

23
Conclusions
This study analyzed data from 178 law schools, each of which enrolled 10 or more first-year students who identified themselves as a member of one of three racial/ethnic minority subgroups—Asian American, Black, or Latino—and had 10 or more first-year students who identified themselves as a member of the nonminority subgroup. The present study, like earlier studies of its kind (Anthony & Liu, 2003; Norton et al., 2006, 2009; Stilwell & Pashley, 2003; Wightman & Muller, 1990), was conducted to determine whether there is evidence of differential prediction for members of different racial/ethnic subgroups. More importantly, results of this study were evaluated to determine whether the current practices used to predict law school performance are unfair to certain racial/ethnic minority subgroups. Use by admission committees of a regression equation that systematically excludes members of some racial/ethnic minority subgroup by underpredicting the performance of its members or overpredicting the performance of some other subgroup could result in admission decisions that are unfair to certain racial/ethnic minority subgroup members.
Regression equations derived by combining data for all four racial/ethnic subgroups included in this study were used to evaluate differential prediction of law school FYA when LSAT alone, UGPA alone, and the combination of LSAT score and UGPA were used as predictors. The use of UGPA alone as a predictor variable seemed to produce the most differential prediction for two of the three racial/ethnic minority subgroups studied. The exception was the Asian American subgroup, in which the use of LSAT alone produced slightly higher overprediction than did the use of UGPA alone. The data confirm that using the combination of LSAT score and UGPA produces the least amount of differential prediction, as compared to using either predictor variable alone for each of the subgroups studied. In fact, the overprediction observed when applying this equation was very small.
While the use of LSAT score and UGPA in combination resulted in the most accurate prediction of first-year law school performance, it is worth noting that none of the regression equations studied would serve to systematically exclude individual members of the three racial/ethnic minority subgroups studied here. Performance of the racial/ethnic minority students tended to be slightly overpredicted on average rather than underpredicted for all three of the regression models evaluated. The performance of White students was slightly underpredicted by the use of UGPA alone, but this difference was greatly diminished in the regression equation combining LSAT score and UGPA.
At least two caveats should be remembered when evaluating the results of this study. First, differences only in average predicted performance were analyzed. That is, individuals within a subgroup that is overpredicted on average may still be themselves underpredicted in terms of their individual law school performance. Second, differential prediction is only one aspect of an overall construct validity evaluation.

24
References
Anthony, L. C., & Liu, M. (2003). Analysis of differential prediction of law school performance by racial/ethnic subgroups based on the 1996–1998 entering law school classes (LSAC Technical Report 00-02). Newtown, PA: Law School Admission Council, Inc.
Braun, H., & Jones, D. (1981). The Graduate Management Admission Test prediction bias study (Graduate Management Admission Council, Report No. 81-04, and ETS RR-81-25). Princeton, NJ: Educational Testing Service.
Breland, H. (1979). Population validity and college entrance measures (Research Monograph No. 8). New York: College Entrance Examination Board.
Burton, N. W., & Wang, M. (2005). Predicting long-term success in graduate school: A collaborative validity study (Graduate Records Examination Board Research Report No. 99-14R and Educational Testing Service, RR-05-03). Princeton, NJ: Educational Testing Service.
Houston, W. M., & Novick, M. R. (1987). Race-based differential prediction in Air Force technical training programs. Journal of Educational Measurement, 24, 309–320.
Law School Admission Council and the American Bar Association Section of Legal Education and Admissions to the Bar. (2010). ABA-LSAC official guide to ABA-approved law schools (2011 ed.). Newtown, PA: Law School Admission Council, Inc.
Linn, R. L., & Hastings, C. N. (1984). Group differentiated prediction. Applied Psychological Measurement, 8, 165–172.
Mattern, K. D., Patterson, B. F., & Kobrin, J. L. (2012). The validity of SAT® scores in predicting first-year mathematics and English grades (College Board Research Report 2012-1). New York, NY: The College Board.
Mattern, K. D., Patterson, B. F., Shaw, E. J., Kobrin, J. L., & Barbuti, S. M. (2008). Differential validity and prediction of the SAT® (College Board Research Report 2008-4). New York, NY: The College Board.
National Research Council. (1989). Differential validity and differential prediction. In J. A. Hartigan & A. K. Wigdor (Eds.), Fairness in employment testing: Validity generalization, minority issues, and the general aptitude test battery (pp. 172–188). Washington, DC: National Academy Press.
Noble, J. (2003). The effects of using ACT composite score and high school average on college admission decisions for racial/ethnic groups (ACT Research Report 2003-01). Iowa City, IA: American College Testing.

25
Noble, J., Crouse, J., & Schulz, M. (1996). Differential prediction/impact in course placement for ethnic and gender groups (ACT Research Report 96-8). Iowa City, IA: American College Testing.
Norton, L., Suto, D., & Reese, L. (2006). Analysis of differential prediction of law school performance by racial/ethnic subgroups based on 2002–2004 entering law school classes (LSAC Technical Report, TR 09-02). Newtown, PA: Law School Admission Council, Inc.
Norton, L., Suto, D., & Reese, L. (2009). Analysis of differential prediction of law school performance by racial/ethnic subgroups based on 2005–2007 entering law school classes (LSAC Technical Report, TR 09-02). Newtown, PA: Law School Admission Council, Inc.
Ramist, L., Lewis, C., & McCamley-Jenkins, L. (1994). Student group differences in predicting college grades: Sex, language, and ethnic groups (College Board, CBR-93-01, and Educational Testing Service, RR-94-27). Princeton, NJ: Educational Testing Service.
Powers, D. E. (1977). Comparing predictions of law school performance for Black, Chicano, and White law students (LSAC Research Report, RR 77-3). Newtown, PA: Law School Admission Services, Inc.
Sackett, P. R., Kuncel, N. R., Beatty, A. S., Rigdon, J. L., Shen, W., & Kiger, T. B. (2012). The role of socioeconomic status in SAT-grade relationships and in college admission decisions. Psychological Science, 23(9), 1000–1007.
Schmidt, F. L., & Hunter, J. E. (1981). Employment testing: Old theories and new research findings. American Psychologist, 36, 1128–1137.
Schrader, W. B., & Pitcher, B. (1976a). Predicting law school grades for Black American law students (LSAC Research Report, RR 73-6). Princeton, NJ: Law School Admission Council, Inc.
Schrader, W. B., & Pitcher, B. (1976b). Prediction of law school grades for Mexican American and Black American students (LSAC Research Report, RR 74-8). Princeton, NJ: Law School Admission Council, Inc.
Shaw, E. J., Kobrin, J. L., Patterson, B. F., & Mattern, K. D. (2012). The validity of the SAT® for predicting cumulative grade point average by college major (College Board Research Report 2012-6). New York, NY: The College Board.
Stilwell, L. A., & Pashley, P. J. (2003). Analysis of differential prediction of law school performance by racial/ethnic subgroups based on the 1999–2001 entering law school classes (LSAC Technical Report, TR 03-03). Newtown, PA: Law School Admission Council, Inc.

26
Stilwell, L. A., Reese, L. M., & Pashley, P. J. (1998). Analysis of differential prediction of law school performance by racial/ethnic subgroups (LSAC Technical Report, TR 98-02). Newtown, PA: Law School Admission Council, Inc.
Stricker, L. J., Rock, D. A., & Burton, N. W. (1991). Sex differences in SAT predictions of college grades (College Board, CBR-91-02, and Educational Testing Service, RR-91-38). Princeton, NJ: Educational Testing Service.
Wightman, L. F., & Muller, D. G. (1990). An analysis of differential validity and differential prediction for Black, Mexican American, Hispanic, and White law school students (LSAC Research Report, RR 90-03). Newtown, PA: Law School Admission Council, Inc.
Willingham, W. W., Lewis, C., Morgan, R., & Ramist, L. (1990). Predicting college grades: An analysis of institutional trends over two decades. Princeton, NJ: Educational Testing Service.