analysis of developments in eu capital flows in the global...
TRANSCRIPT

mmmll
Final Report Bruegel
No 2016.3919
Analysis of developments in EU capital flows in the global
context – third annual report
Zsolt Darvas, Konstantinos Efstathiou, Pia Hüttl, Dirk
Schoenmaker*
November 2016
* We thank Uuriintuya Batsaikhan, Álvaro Leandro and Elena Vaccarino for excellent
research assistance.
Numéro de projet: 2016.3919
Titre: Analysis of global capital flows, with special emphasis on capital flows into and
from the EU
Version
linguistique Support/Volume
Numéro de
catalogue ISBN DOI
EN PDF/Volume_01 EV-01-16-452-
EN-N
978-92-79-
58214-1
10.2874/553086

Analysis of developments in EU capital flows in the global context
November 2016 [2]
“The information and views set out in this study are those of the author(s) and do not necessarily reflect the official opinion of the Commission. The Commission does not
guarantee the accuracy of the data included in this study. Neither the Commission nor
any person acting on the Commission’s behalf may be held responsible for the use which may be made of the information contained therein.”
DOI: 10.2874/9240 ISBN: 978-92-79-58222-6
© European Union, 2016.
Reproduction is authorised provided the source is acknowledged.

Analysis of developments in EU capital flows in the global context
November 2016 [3]
Table of Contents
Executive summary 6 1. Introduction 14 2. Global trends 15
2.1 Major country groups 16 2.2 Investment yields and valuation effects of foreign assets and liabilities 30 2.3 Global trends in the banking sector 36
3. A closer look at Europe 38 3.1 Gross financial flows 39 3.2 Net financial flows 53 3.3 Net international investment positions (NIIPs) 59 3.4 Cyprus, Greece and Iceland – capital flows and economic performances in times of capital controls 65 3.5 Annex to Chapter 3: country-specific data 76
4. Institutional investors and risk sharing in Europe’s Capital Markets Union 90 4.1 Rationale 90 4.2 Literature 91 4.3 Evolution of institutional investment and the supply of securities 93 4.4 A new pension fund foreign investment restrictions index 102
4.4.1 Description of the new index 102 4.4.2 Developments in pension fund restrictions 107
4.5 Home bias and euro-area bias 107 4.5.1 Data issues 107 4.5.2 Our home bias and euro-area bias indicators 109 4.5.3 Home bias and euro-area bias developments 111
4.6 Panel regression analysis: the determinants of home bias 120 4.8 Data annex for Section 4 129
References 134

Analysis of developments in EU capital flows in the global context
November 2016 [4]
List of Figures
Figure 1: Global gross financial flows (percent of GDP) 15 Figure 2: The evolution of gross and net capital flows in the world (percent of GDP) 17 Figure 3 Composition of net capital flows in major regions of the world (in percent of
GDP) 19 Figure 4 Stock of foreign exchange reserves (as share of world GDP) 23 Figure 5: Expansion of Central Bank’s balance sheets (in % of GDP) 24 Figure 6: Real effective exchange rate developments, January 1970 – June 2016 (average of 1970-2016 = 100) 25 Figure 7: Net international investment positions (in percent of GDP) 29 Figure 8: Gross foreign claims of domestically owned banks on the rest of the world
(percent of group GDP) 36 Figure 9: Gross financial flows in euro-area groups (percent of GDP) 40 Figure 10: Euro area banks foreign claims based on locational banking statistics
(percent of GDP) 42 Figure 11: Foreign claims of euro-area banks based on locational banking statistics
(percent of GDP) 44 Figure 12: Credit default swap (CDS) spreads of top financial corporations 46 Figure 13: Foreign claims on different regions and euro-area subgroups based on consolidated banking statistics (percent of GDP) 47 Figure 14: Gross financial flows in selected euro-area debtor countries (% GDP) 48 Figure 15: Gross financial flows in northern Europe, the UK and central and Eastern
Europe (percent of GDP) 50 Figure 16: Northern and UK bank foreign claims based on locational banking statistics
(percent of GDP) 52 Figure 17: Net financial flows in the three euro-area groups (percent of GDP) 54 Figure 18: Risk premia in the euro area and the United States 56 Figure 19: Net financial flows in the three euro-area groups (percent of GDP) 57 Figure 20: Net financial account of the euro-area debtor countries and Central and
Eastern Europe (percent of GDP) 59 Figure 21: Net international investment position the three euro-area groups (percent
of GDP) 60 Figure 22: Net international investment position of EU north, the UK and central and
eastern Europe (percent of GDP) 63 Figure 23: Net portfolio investment positions of Greece, Cyprus and Iceland 66 Figure 24: Net Foreign Banking exposures to Greece, Cyprus and Iceland 68 Figure 25: The share of non-performing loans in some financial assistance countries 70 Figure 26: Actual real GDP and unemployment rate developments in financial
assistance countries 72 Figure 27: Real GDP level: gap relative to GDP of trading partners in financial
assistance countries (year before the programme = 100) 73 Figure 28: Real GDP and unemployment rate in financial assistance countries: gap
between actual developments and programme assumptions 75 Figure 29: Financial account and net international investment position of EU countries 76 Figure 30: Assets managed by institutional investors in the EU (% of EU GDP), 2001-2015 93 Figure 31: Pension fund assets (% of GDP), selected countries, 2001-2014 95 Figure 32: Insurance corporation assets (% of GDP), 2001-2015 97 Figure 33: Investment fund assets (% of GDP), 2000 and 2014 98 Figure 34: Debt securities by issuer, selected countries (% of GDP), 2004 and 2015 99

Analysis of developments in EU capital flows in the global context
November 2016 [5]
Figure 35: Stock market capitalisation of listed companies in 2015, selected countries,
% of GDP 101 Figure 36: Total domestic equity market capitalisation held by residents and non-
resident (from the national accounts dataset), selected countries, 2014, % of GDP 101 Figure 37: Portfolio equity: home and euro-area biases 113 Figure 38: Portfolio debt securities: home and euro-area biases 116 Figure 39: Home bias in the euro area as a whole and in the United States 119
List of Tables
Table 1: External annualised yields for 26 EU countries and United States, Japan and Switzerland, in % 33 Table 2: Annualised revaluation effects for selected countries 34 Table 3: Total return (yield plus revaluation) for selected countries 35 Table 4: Our new pension fund foreign investment restrictions index 105 Table 5: Countries where different restrictions apply for different pension funds/options 106 Table 6: Average level of home bias and euro-area bias in four country groups, 2014 112 Table 7: Panel regression results: untransformed portfolio equity home bias based on stock market capitalisation data 122 Table 8: Panel regression results: logistic transformation of portfolio equity home bias based on stock market capitalisation data 123 Table 9: Panel regression results: untransformed portfolio equity home bias based on
national accounts equity data 124 Table 10: Panel regression results: logistic transformation of portfolio equity home
bias based on national accounts equity data 125 Table 11: Panel regression results: untransformed portfolio debt securities home bias
126 Table 12: Panel regression results: logistic transformation of portfolio debt securities
home bias 127
List of Boxes
Box 1: Components of capital flows 26

Analysis of developments in EU capital flows in the global context
November 2016 [6]
Executive summary The purpose of our report is to provide a comprehensive overview of capital
movements in Europe in a global context. Free movement of capital, which is one of the four fundamental economic freedoms of the European Union, can enhance welfare
if it leads to better allocation of financial and productive resources. However, it can
also be a source of vulnerability, with far-reaching spillovers. Monitoring and assessing capital flows is therefore crucial for policymakers, market participants and analysts.
Chapter one introduces the topic and presents the outline of our report.
Chapter two analyses global capital flows. We highlight several key developments.
Global gross capital flows continue remain at a subdued level
compared to the pre-crisis period (Figure 1). However, among the three
main components, foreign direct investment (FDI) declined the least and while
such flows are below the 2005-07 values, the 2013-15 average was actually
higher than in 2002-04. In contrast, gross portfolio investment in 2013-15 was
about half of what it was in 2005-07 and was also below values observed in
2002-04. Gross other investments (which mostly comprise cross-border loans)
fell even more and in several quarters during 2012-15, there was a
retrenchment of earlier other investment flows. These developments highlight
that FDI remained more stable than other capital flows during the
global reduction of gross flows in the aftermath of the 2007-08 global
financial and economic crisis.
However, the latest three quarters at the time of writing (2015Q4-
2016Q2) saw a reduction in global FDI flows. There was a significant
retrenchment of other investments in 2015Q5, though in the first two
quarters of 2016 other investments expanded again somewhat. It needs
to be seen whether these developments were a temporary setback to global
capital flows, or the beginning of a major slowdown in global FDI and other
capital flows.

Analysis of developments in EU capital flows in the global context
November 2016 [7]
Figure 1: Global gross financial flows (percent of GDP)
Source: Bruegel based on data from the IMF International Financial Statistics (quarterly capital
flows) and IMF World Economic Outlook (annual GDP). Note: the values shown are the aggregate of 77 countries, including all large economies. Therefore, the combined financial account of these countries (indicated by the solid line) should
be close to zero and the significant deviations from zero in 2006-13 likely indicate reporting errors. The left panel shows the ratio of the 4-quarter moving average capital flows to the 4-quarter moving average GDP level (for which we first interpolated annual GDP data at the quarterly level, assuming smooth within-year changes). We use 4-quarter averages to reduce
short-term noise and to be able to highlight key tendencies. The right panel shows the ratio of actual quarterly capital flows (i.e. no moving average) to the 4-quarter average GDP level. Thereby, the magnitudes in the two panels are comparable to the ratio of annual capital flows to
annual GDP. Negative values for assets, and positive values for liabilities, indicate retrenchment of earlier investments.
The recovery of capital flows in different regions in the post-crisis
period has been uneven. By the first quarter of 2010, gross capital flows
reached nearly pre-crisis levels in Latin America, in the ASEAN-4, and in Sub-
Saharan Africa, but remained subdued in central and eastern Europe (CEE) and
in Commonwealth of Independent States (CIS) countries. In 2015, gross flows
into Latin America and Sub-Saharan Africa stabilised at high levels – much
higher levels than before the crisis – while the Asean-4 and the BRICS
experienced capital outflows in recent quarters, suggesting that there is no
general trend of capital outflows from emerging countries and that two
large regions even continue to experience large-scale capital inflows. In CEE,
CIS and advanced countries, gross flows remain well below pre-crisis levels.
The euro area has been characterised by capital outflows since the end
of 2012, predominantly driven by bank-related outflows (loans and deposits) in
2013-14, which might have been the result of global bank deleveraging in
relation to the euro-area’s sovereign and banking crisis. However, this trend
-3
-2
-1
0
1
2
3
2015
Q2
2015
Q3
2015
Q4
2016
Q1
2016
Q2
Latest quarterly developments
-8
-6
-4
-2
0
2
4
6
2003
Q1
2004
Q1
2005
Q1
2006
Q1
2007
Q1
2008
Q1
2009
Q1
2010
Q1
2011
Q1
2012
Q1
2013
Q1
2014
Q1
2015
Q1
2016
Q1
World - Gross financial account items4-quarter moving average
Foreign direct Investment - ASS Foreign direct Investment - LIAB
Portfolio Investment - ASS Portfolio Investment - LIAB
Other Investment - ASS Other Investment - LIAB
Financial account

Analysis of developments in EU capital flows in the global context
November 2016 [8]
reversed in 2014Q3 and other investment is flowing in again, including an
unusually large inflow in 2016Q1, though in 2016Q2 such inflows moderated.
The renewed inflow of other investments might be related to the improved
soundness of financial institutions as a result of the preparation for, and the
actual take-over by the European Central Bank of the single supervisory role in
the euro area. On the other hand, in 2015 the euro area experienced portfolio
investments outflows practically for the first time since 2001, reflecting to
some extent the impact of the ECB’s asset purchase programme. Thereby, total
net capital outflow from the euro area has accelerated.
The CEE countries’ net financial inflows have receded substantially since
the height of the financial crisis and these countries became net capital
exporters in 2015-16. Net pre-crisis inflow of other investment switched to
outflows, net portfolio inflows went down to zero, and FDI inflows reduced
significantly.
In contrast to the euro area and CEE countries, Sweden, Denmark and
the United Kingdom experienced substantial net capital inflows from
2014 to our most recent observation of 2016Q1. This was driven by strong
portfolio and FDI inflows, while bank-related outflows over the same period
offset somewhat the observed inflows.
In non-EU advanced countries, the relatively stable earlier FDI outflows
suddenly halted in 2015, which might explain, at least partly, the recent
decline in global FDI. Improved domestic economic outlooks might have played
a role. Another major change is the switch from large portfolio investment
inflows to outflows in 2015, which might have been reinforced by the changed
behaviour of former reserve-accumulating central banks.
The global decline in foreign exchange reserves continues, which has
likely contributed to portfolio outflows from advanced countries. Significant
further reserve depletion of global foreign exchange reserves might lead to
interest rate increases in advanced countries.
Central bank policies in advanced countries, as well as the vote in the United
Kingdom’s June 2016 Brexit referendum to leave the EU, have likely influenced
exchange rate movements, which in turn will have an impact on capital
flows.
Latin America and Sub-Saharan Africa are the only two main emerging
regions that continue to receive large capital inflows, larger than in the pre-
crisis period. In Sub-Saharan Africa inflows are almost entirely composed of
FDI, while in Latin America, FDI and portfolio inflows account for about half of
net capital inflows.
Official statistics on foreign asset positions are imprecise because of
unrecorded financial wealth held in tax havens. Research shows, for
example, that consideration of such unrecorded wealth would turn the reported
negative net international investment position (NNIP) of the euro area positive.
Nevertheless, official statistics show that recent NIIP developments in EU
countries differ from most non-EU country groups. In the euro area, in
the group of Denmark, Sweden and the United Kingdom (DESEUK), and in the
group of CEE countries, a process of shrinking of both net assets and net
liabilities started in 2015-16, along with an increase in the total net position. In

Analysis of developments in EU capital flows in the global context
November 2016 [9]
contrast, net assets and liabilities of Latin American and CIS countries have
even increased recently.
Among the three components of the NIIP, it is notable that earlier positive net
FDI claims of the euro-area, the DESEUK group and non-EU advanced countries
have fallen, and the earlier negative net FDI positions of CEE countries, Brazil
and India, and to a lesser extent CIS countries have increased. These
developments highlight that a recent setback to global FDI linkages.
Large gross stocks are prone to major valuation changes, which can lead to
significant shifts in the net stock position even if net flows are small. Therefore
we assessed the investment yields and valuation effects of foreign
assets and liabilities.
Our analysis of the yields show that larger EU countries such as Germany,
France, Finland, the Netherlands, Sweden and the United Kingdom
have succeeded in replicating to some extent the privileges of the US
on equity returns throughout the periods taken into consideration. In
contrast, the CEE region experienced large negative spreads on equity
because of very high returns on their liabilities, but they had the
remarkable privilege of large positive spreads on debt-type foreign assets. It is
also worthwhile highlighting that the vulnerable euro-area countries where
financial assistance programmes were implemented (with the
exception of Greece) do not display largely negative tendencies on
returns on foreign assets and liabilities relative to other EU countries,
because of the financial assistance programmes and Eurosystem Central Bank
(ESCB) flows. Continued participation in the euro helped financial-assistance
countries to manage their external accounts during the crisis years.
Revaluation effects also show sizeable heterogeneity both across
countries, and through time. Germany, Spain and Sweden suffer from the
worst revaluation spreads in equity. In terms of debt revaluations, several EU
countries report negative spreads. This could mainly be due to the ‘other
investment’ component, which comprises inter- and intra-bank loans, reflecting
the period of financial disintegration starting with the crisis.
The difference between the total return on assets and liabilities was
especially large for equity in Greece, because of the collapse of Greek
liabilities. The United States has lost its positive overall return on equity,
primarily driven by revaluation gains of foreign investors in the US, due to the
strong US dollar and strong increase in US equity prices.
There is a striking difference between the gross foreign claims of EU
and non-EU advanced country banks: while claims of EU banks have
declined significantly since 2007-08 (and have even halved for euro-area
banks), claims of non-EU banks (after some volatility in 2007-09) continued to
increase even after 2009.
The third chapter focuses on capital flows in the European Union, with a special focus on the possible impacts of capital controls in Greece, Iceland and Cyprus.
To highlight the main tendencies in the heterogeneous EU, among first twelve euro-area countries we make a distinction between debtors (Greece, Portugal and Spain)
and creditors (Austria, Belgium, Germany, Luxembourg and the Netherlands) on the
Analysis of developments in EU capital flows in the global context
November 2016 [10]
basis of their net international positions, while France and Italy are explored
separately. The rest of the EU Member States that are are divided into the North (Denmark and Sweden), Central and Eastern Europe (Czech Republic, Croatia,
Estonia, Hungary, Latvia, Lithuania, Poland, Romania, Slovakia and Slovenia) and the UK.
In the euro area, gross flows remain subdued compared to the pre-crisis
period across all groupings. However, there have been significant fluctuations
over time, even if the level remains below the pre-crisis period. These
fluctuations are correlated across country groups but their relative size differs
substantially. Gross flows accentuated during the first quarters of 2012 and the
end of 2014 and were relatively more important in creditor and debtor
countries. Nevertheless, they had different implications with respect to the
direction of the net changes.
Similar dynamics emerge in debtor countries and Italy. These countries have
over time turned into net exporters of capital. The intensification of gross flows
during 2012 coincided with the most dramatic shift in their net financial
account. Initially, portfolio net outflows were only partly compensated for by
the inflow of other investment, which in turn also began flowing out from these
countries. During 2015, these countries ended up running small overall
surpluses. Net outflows in portfolio investment were somewhat counteracted by
net inflows of other investment. Their NIIP has stabilised and began to rise as a
result, while remaining in a debtor position. Almost the entirety of this position
is made up of other investment claims in the debtor countries, while in Italy its
composition has shifted once again after 2012 from portfolio to other
investment.
In creditor countries, the net financial account surplus widened up to 2015,
as these countries became net exporters in every category of cross-border
investment. After 2012, portfolio and direct investment net inflows turned into
large net outflows. This is reflected in their NIIP positions and its composition:
direct investment, a net asset, is increasing while portfolio investment, a net
liability, is falling. After peaking in 2015, however, the overall net outflow has
attenuated somewhat, owing to a complete reversal in the direction of other
investment flows.
France has experienced a significant attenuation in gross flows relative to the
pre-crisis period that has, nonetheless, caused very little change to its net
balance: the net financial account balance has remained close to zero. A
decomposition of the balance shows a consistent surplus in other investment
and a consistent deficit in the portfolio account, which was the primary reason
for France’s steadily negative NIIP.
The magnitude of gross flows in Northern Europe and in CEE tends to be
smaller than in the euro area. The north of Europe has been a net exporter of
capital since the end of 2009. It runs a negative position of portfolio net
liabilities, while other investments turn the overall position from negative to
positive.
Central and Eastern European countries experienced prolonged inflows,
mainly of direct investment, in the run-up to the crisis. By the end of 2011
though, other investment started flowing out, reflecting a massive withdrawal

Analysis of developments in EU capital flows in the global context
November 2016 [11]
of banking funds from the region. CEE had turned into a net exporter of capital
by 2013Q1, a trend that continues. CEE thus exhibits net liabilities in all
instruments but more than half of NIIP liabilities are direct investment.
In contrast, the UK, owing to its role as a major financial centre, experienced
gross flows of up to 80% of GDP during the financial crisis. It experienced large
inflows in 2007-08, mostly in terms of portfolio investment, which were then
abruptly reversed in 2009. Large net portfolio inflows re-emerged in 2014,
driving the net financial balance to a deficit of 20% of GDP, a trend which
subsided in the course of 2015. The UK remains a debtor in NIIP components
apart from direct investment.
We focus on the three EEA countries that introduced capital controls –
Iceland (in 2008), Cyprus (in 2013) and Greece (in 2015) – to assess their
likely impacts. Overall, the imposition of capital controls in both Cyprus and
Iceland led to a moderation of both portfolio and banking flows. Interestingly,
as capital controls were lifted in April 2015 in Cyprus, a major increase in
foreign bank claims was observed, as investment could flow again into the
country without restrictions. In contrast, portfolio and banking foreign claims
on Greece had already decreased substantially before capital controls were
imposed. A recovery in banking claims on Greece started in late 2015 and
continued into early 2016, suggesting some improvement in confidence in the
Greek economy. The diminished uncertainty related to the implementation of
the third financial assistance programme likely played a role in confidence
building.
Lacking a sufficiently comprehensive macro-financial model, we compare the
three EEA capital control countries to other countries that underwent financial
assistance programmes, both EU and non-EU, in order to gauge possible
impacts of capital controls on economic performance. We find that
developments in real GDP and unemployment developments in Iceland, Cyprus
and Greece were no worse than in other EU Member States with financial
assistance programmes and no capital controls. Moreover, relative to the initial
programme assumptions, these three countries outperformed both their EU and
non-EU counterparts that faced no restrictions on capital flows.
Chapter four presents the results of our in-depth study on institutional investors and
risk sharing in Europe’s Capital Markets Union.
Institutional investors, as professional parties, typically hold geographically
diversified portfolios of marketable securities. In that way, institutional
investors contribute to financial integration and risk sharing in Europe’s
Capital Markets Union and beyond.
Assets managed by institutional investors (defined as pension funds, insurance
companies and investment funds) have increased significantly in the past
fifteen years. Beyond the general increasing trend, the size of the funds
managed by the three types of institutional investors and their increase over
time varies significantly in different EU countries.
The key hypothesis we test with panel regression estimates: the larger the
assets managed by institutional investors, the smaller the home bias and
thereby the greater the scope for risk sharing.

Analysis of developments in EU capital flows in the global context
November 2016 [12]
We use a simple indicator of home bias in portfolio investments based on
the International Capital Asset Pricing Model (ICAPM). We define an indicator
measuring the euro-area bias in portfolio investments. The two indicators
are calculated for equity and debt securities separately. Our new indicators
show that in the euro area, Denmark, Sweden and the United Kingdom, home
bias is lower than in the newer EU member states and non-EU advanced
countries, while euro-area bias is comparably high in the euro-area and newer
EU Member States, but low in the other three older EU Member States and in
advanced countries. Furthermore, the euro area is unique in terms of debt
securities: home bias is the lowest and euro-area bias is the highest among the
country groups. Since non-EU countries are generally characterised by a higher
degree of home bias than EU countries, we conclude that EU membership may
foster financial integration and reduce information barriers, which sometimes
limit cross-country diversification.
We also calculate our home bias indicators for the aggregate of the euro
area as if the euro area was a single country, by consolidating intra-euro
area assets and liabilities. We report remarkable similarity between the euro
area as a whole and the United States in terms of equity home bias, while
there is a higher level of debt home bias in the United States than in the euro
area as a whole.
We create a new quantitative measure that we call ‘Pension fund foreign
investment restrictions index’ to control for the impact of prudential
regulations on the ability of institutional investors to diversify geographically
across borders. Our index suggests that most EU countries apply very limited,
if any, restrictions on foreign investment. However, some EU countries imposed
substantial limits in 2001 and have gradually relaxed these barriers in recent
years (Denmark, Finland, Germany, Hungary, Romania and Sweden). In the
EU, persistent barriers to cross-border investment are still present in Austria,
Greece and Poland.
To explore whether the size of the assets managed by institutional investors
contributes to home bias, we run a set of panel regressions for 25 countries.
We include a number or relevant controls, namely: GDP per capita, a proxy for
capital markets development (the Financial Development Index of the World
Economic Forum), a proxy for openness (share of exports of goods and
services to GDP), availability of domestic securities (domestic market
capitalisation relative to home GDP) and availability of foreign securities
(foreign market capitalisation relative to home GDP). For euro-area countries,
we also include euro-area home bias as a regressor. We use two functional
forms, two versions of equity home bias and estimates with and without
country and time fixed effects.
Our results provide strong support for our main hypothesis: all 48
estimated parameters have a negative sign and most of them are statistically
significantly different from zero.
Most of the control variables also have statistically significant coefficients
with the expected sign for economic interpretation.
o Higher GDP per capita is strongly associated with lower home bias, as
expected, given that it can serve as a proxy for several factors
influencing the ability of a country to diversify its asset holdings, such

Analysis of developments in EU capital flows in the global context
November 2016 [13]
as economic development, institutional quality, investor protection or
average education level in the country.
o Higher trade openness is strongly associated with lower home bias, as
expected; this result is therefore consistent with the argument that
cross-border trade integration drives financial integration.
o Home market capitalisation is positively related to home bias, as
expected, highlighting that countries with a larger home stock of
securities diversify less.
o The results of the availability of rest of the world securities are
more mixed: while the estimated parameter tends to be negative (as
expected), in a number of specifications the estimated parameter is
actually positive.
o The parameter estimate of the Financial Development Index (which
may capture effects similar to GDP per capita) is never significant and
the sign of the estimated parameter varies. The most likely reason for
this result is the strong correlation between the Financial Development
Index and GDP per capita relative to the United States.
o Importantly, our estimates tend to suggest that our new pension fund
foreign restriction index is positively related to home bias.
o Results for the euro-area bias are mixed: when fixed effects are not
included, the parameter estimate of euro-area bias is always negative
and statistically significant in most cases.

Analysis of developments in EU capital flows in the global context
November 2016 [14]
1. Introduction This is our third annual report that analyses capital movements in Europe in a global
context. Monitoring and analysing capital movements is crucial for policymakers, market participants and analysts, given that free capital movements can enhance
welfare if they lead to better allocation of financial and productive resources, but they
can also be a source of vulnerability, with far-reaching spillovers.
We do not repeat our reviews from previous reports (Darvas et al, 2014; Darvas et al, 2015) of the key theoretical aspects around capital flows, but start with an analysis of
global capital flows in Chapter 2. In order to be able offer the big picture, we split countries into ten groups and highlight different patterns of capital flows throughout
the world. We focus on more recent developments, while interested readers can find our analysis of pre-crisis developments in our previous report. We pay special
attention to emerging market economies given the recent turbulence there. In Chapter
2 we also report our analysis of the returns on investment and valuation effects of foreign assets and liabilities, which show great variation between countries. This
finding highlights the potential risks of large foreign asset positions, but also underline that cross-border positions enhance cross-country risk sharing.
Chapter 3 focuses on Europe. While we continue to focus on the euro area because of
its unique characteristics, we also pay more attention to non-euro area EU countries. We analyse the different capital flow patterns and developments in international
investment positions, including analysis of their compositions. An interesting picture
emerges when we compare euro-area countries that received financial assistance programmes with central and eastern European (CEE) EU countries. The imposition of
capital controls makes Cyprus, Iceland and recently Greece highly interesting cases for an analysis of capital flows under capital controls and the possible impact of capital
controls on economic performance.
Finally, Chapter 4 presents the results of our in-depth analysis, which this year focuses on institutional investors (pension funds, insurance companies, investment
funds) and risk sharing in Europe’s Capital Markets Union. We document the
substantial increase in assets managed by institutional investors in the EU, but also the great diversity of EU countries, both in terms of assets managed and the supply of
securities. We calculate home bias indicators for portfolio equity and debt securities holdings, and a new pension fund foreign investment restriction index for a large
number of countries. Our main hypothesis is that the greater the assets managed by institutional investors, the less the home bias and thereby the greater the scope for
risk sharing, ceteris paribus. We use panel regression analysis to test this hypothesis, using several control variables, and find strong support for it.

Analysis of developments in EU capital flows in the global context
November 2016 [15]
2. Global trends We start our analysis by examining capital flows and stocks at the global level. In order to offer the big picture, Figure 1 shows the three main types of capital flows for
a group of 77 countries.
The figure shows that global gross capital flows continue to be subdued
compared to the pre-crisis period. However, of the three main components, foreign direct investment (FDI) declined the least and while such flows are below the
values observed in 2005-07, the 2013-15 average is actually higher than in 2002-04. In contrast, gross portfolio investment in 2013-15 was about half the 2005-07 level
and was also below 2002-04 values, while gross other investments (mostly comprising cross-border loans) fell even more and in several quarters of 2012-15 there was a
retrenchment of earlier other investment flows. These developments highlight that FDI remained more stable during the global reduction of gross flows in the
aftermath of the 2007-08 global financial and economic crisis.
However, we also note that the latest three quarters (2015Q4-2016Q2) saw a
reduction in global FDI flows. There was a major retrenchment of other investments in 2015Q4, though in the first two quarters of 2016 other
investments expanded again somewhat. It needs to be seen whether these developments were a temporary setback to global capital flows, or the beginning of a
major slowdown in global FDI and other capital flows.
Figure 1: Global gross financial flows (percent of GDP)
Source: Bruegel calculations based on data from the IMF International Financial Statistics
(quarterly capital flows) and IMF World Economic Outlook (annual GDP).
Note: the values shown are the aggregate of 77 countries, including all large economies. Therefore, the combined financial account of these countries (indicated by the solid line) should be close to zero and the significant deviations from zero in 2006-13 likely indicate reporting
errors. The left panel shows the ratio of the 4-quarter moving average capital flows to the 4-quarter moving average GDP level (for which we first interpolated annual GDP data at the
-3
-2
-1
0
1
2
3
2015
Q2
2015
Q3
2015
Q4
2016
Q1
2016
Q2
Latest quarterly developments
-8
-6
-4
-2
0
2
4
6
2003
Q1
2004
Q1
2005
Q1
2006
Q1
2007
Q1
2008
Q1
2009
Q1
2010
Q1
2011
Q1
2012
Q1
2013
Q1
2014
Q1
2015
Q1
2016
Q1
World - Gross financial account items4-quarter moving average
Foreign direct Investment - ASS Foreign direct Investment - LIAB
Portfolio Investment - ASS Portfolio Investment - LIAB
Other Investment - ASS Other Investment - LIAB
Financial account

Analysis of developments in EU capital flows in the global context
November 2016 [16]
quarterly level, assuming smooth within-year changes). We use 4-quarter averages to reduce short-term noise and to be able to highlight key tendencies. The right panel shows the ratio of
actual quarterly capital flows (i.e. no moving average) to the 4-quarter average GDP level.
Thereby, the magnitudes in the two panels are comparable to the ratio of annual capital flows to annual GDP. Negative values for assets, and positive values for liabilities, indicate retrenchment
of earlier investments.
2.1 Major country groups
In order to highlight differences between the world’s main regions, we aggregate countries into ten groups: euro area 17, eight central and eastern European EU
countries (CEE8), the three other EU countries (UK, Denmark and Sweden), 11 non-EU advanced economies, four countries from the Association of Southeast Asian
Nations (ASEAN-4), Latin America 13, four Sub-Saharan African countries (SSA4), the
Commonwealth of Independent States excluding Russia (CIS 8 (excl. Russia)), Middle East and North Africa 5 (MENA5), and the aggregate of Brazil, Russia, India, China and
South Africa (BRICS). The time period we consider is from 2000Q1 to the latest data available, which is the first quarter 2016 for all but one country group1.
Figure 2 shows the evolution of gross and net capital flows for our country
groupings. In the run-up to the crisis, data indicates there were net capital inflows into most country groups2 (especially CEE8, Non-EU advanced, CIS8 and the BRICS),
while the euro area was characterised by capital outflows.
The eruption of the financial crisis in 2007 resulted in a collapse of gross financial
flows into all country groups. In the CEE8, the Other EU 3 and the non-EU advanced countries, net flows fell to zero for a few quarters, before rebounding by the end of
2009. Sizeable net capital outflows were registered from the CIS8 (excl. Russia), the BRICS, Latin America and the ASEAN-4.
The recovery of capital flows in the post-crisis period has been uneven in different
regions. By the first quarter of 2010, gross capital flows reached nearly pre-crisis
levels in Latin America, in the ASEAN-4, and in Sub-Saharan Africa, but remained subdued in central and eastern Europe and in Commonwealth of Independent States
(CIS) countries. Latin America and Sub-Saharan Africa in particular experienced increasing capital inflows between 2009 and 2016, while ASEAN-4 was characterised
by more overall volatility. The BRICS also experienced renewed capital inflows between 2010 and 2013, a trend that has reversed over the last two years.
In 2015, gross flows into Latin America and Sub-Saharan Africa stabilised at high
levels – much higher levels than before the crisis – while the Asean-4 and the BRICS
experienced capital outflows in recent quarters, suggesting that there is no general trend in capital outflows from emerging countries, and two large regions even
continue to experience large-scale capital inflows. In CEE, CIS and advanced countries, gross flows continue at well below pre-crisis levels.
1 This report follows the sign conventions set out in the 6th edition of the IMF’s Balance of Payments Manual. For more detail, see Box 1 in last year’s capital report, which presents a
short overview of major changes introduced with the changeover from IMF 5th BMP manual to IMF 6th BMP manual. 2 We highlight the findings by Zucman (2013), which show that official statistics substantially underestimate the net foreign assets position (and consequent flows) of rich countries, since
they fail to capture most of the assets held in offshore tax havens.

Analysis of developments in EU capital flows in the global context
November 2016 [17]
Figure 2: The evolution of gross and net capital flows in the world (percent of
GDP)
-15
-10
-5
0
5
10
15
-50
-40
-30
-20
-10
0
10
20
30
40
50
20
00
Q1
2001
Q1
2002
Q1
2003
Q1
2004
Q1
2005
Q1
2006
Q1
2007
Q1
2008
Q1
2009
Q1
2010
Q1
2011
Q1
2012
Q1
2013
Q1
2014
Q1
2015
Q1
2016
Q1
Euro area (in % of GDP)
GROSS OUTFLOWS GROSS INFLOWS NET FLOW (rhs)
-25
-20
-15
-10
-5
0
5
10
15
20
25
-50
-40
-30
-20
-10
0
10
20
30
40
50
20
00
Q1
20
01
Q1
20
02
Q1
20
03
Q1
20
04
Q1
20
05
Q1
20
06
Q1
20
07
Q1
20
08
Q1
20
09
Q1
20
10
Q1
20
11
Q1
20
12
Q1
20
13
Q1
20
14
Q1
20
15
Q1
20
16
Q1
CEE (in % of GDP)
GROSS OUTFLOWS GROSS INFLOWS NET FLOW (rhs)
-25
-20
-15
-10
-5
0
5
10
15
20
25
-150
-100
-50
0
50
100
150
20
00
Q1
20
01
Q1
20
02
Q1
20
03
Q1
20
04
Q1
20
05
Q1
20
06
Q1
20
07
Q1
20
08
Q1
20
09
Q1
20
10
Q1
20
11
Q1
20
12
Q1
20
13
Q1
20
14
Q1
20
15
Q1
20
16
Q1
DK, SE, UK (in % of GDP)
GROSS OUTFLOWS GROSS INFLOWS NET FLOW (rhs)
-25
-20
-15
-10
-5
0
5
10
15
20
25
-50
-40
-30
-20
-10
0
10
20
30
40
50
2000
Q1
2001
Q1
20
02
Q1
2003
Q1
2004
Q1
2005
Q1
2006
Q1
2007
Q1
2008
Q1
2009
Q1
2010
Q1
2011
Q1
2012
Q1
2013
Q1
20
14
Q1
2015
Q1
2016
Q1
Non EU advanced (in % of GDP)
GROSS OUTFLOWS GROSS INFLOWS NET FLOW (rhs)
-25
-20
-15
-10
-5
0
5
10
15
20
25
-50
-40
-30
-20
-10
0
10
20
30
40
50
20
02
Q1
20
03
Q1
20
04
Q1
20
05
Q1
20
06
Q1
20
07
Q1
20
08
Q1
20
09
Q1
20
10
Q1
20
11
Q1
20
12
Q1
20
13
Q1
20
14
Q1
20
15
Q1
20
16
Q1
CIS 9 EXCL. RUSSIA (in % of GDP)
GROSS OUTFLOWS GROSS INFLOWS NET FLOW (rhs)
-25
-20
-15
-10
-5
0
5
10
15
20
25
-50
-40
-30
-20
-10
0
10
20
30
40
50
20
00
Q1
20
01
Q1
20
02
Q1
20
03
Q1
20
04
Q1
20
05
Q1
20
06
Q1
20
07
Q1
20
08
Q1
20
09
Q1
20
10
Q1
20
11
Q1
20
12
Q1
20
13
Q1
20
14
Q1
20
15
Q1
20
16
Q1
BRICS (in % of GDP)
GROSS OUTFLOWS GROSS INFLOWS NET FLOW (rhs)

Analysis of developments in EU capital flows in the global context
November 2016 [18]
Source: IMF IFS (quarterly capital flows); WEO (annual GDP). Note: The country groups are as follows: Euro area = EA 17; other EU 3 = United Kingdom, Sweden, Denmark; CEE8 = Bulgaria,
Czech Republic, Croatia, Latvia, Lithuania, Hungary, Poland and Romania; non-EU advanced = Canada, Japan, United States, Australia, Hong Kong, Iceland, Israel, Korea, New Zealand, Norway, Switzerland; BRICS = Brazil, Russia, India, China, South Africa; CIS 9 (excl. Russia) =
Armenia, Azerbaijan, Belarus, Georgia, Kazakhstan, Kyrgyz Republic, Moldova, Tajikistan, Ukraine; Latin America = Argentina, Bolivia, Chile, Costa Rica, Colombia, El Salvador, Guatemala, Panama, Venezuela, Mexico, Uruguay, Middle East and North Africa = Jordan,
Lebanon, Morocco, Saudi Arabia, Yemen; Sub-Saharan Africa = Cabo Verde, Lesotho, Mozambique, Namibia; ASEAN-4 = Indonesia, Philippines, Thailand, Vietnam; Gross inflows/outflows are calculated as the sum of the liabilities/assets of the following instruments: direct investment, portfolio investment and other investment, where gross inflows are reported
with a negative sign. Net flow is the net financial account. See Box 1 for the definition of capital flow components. Note that gross flows can be negative, which means disposing earlier cross-border investments. Changes in official reserves and NEO are excluded from the financial
account for better readability.
While Figure 1 reported the composition of gross flows at global level, to conserve
space we do not report data on the composition of gross flows in the various country groups. Instead, we report the composition of net flows, which allows us to highlight a
number of interesting observations about recent developments in capital flows (Figure
3).
-15
-10
-5
0
5
10
15
-25
-20
-15
-10
-5
0
5
10
15
20
25
20
00
Q1
20
01
Q1
20
02
Q1
20
03
Q1
20
04
Q1
20
05
Q1
20
06
Q1
20
07
Q1
20
08
Q1
20
09
Q1
20
10
Q1
20
11
Q1
20
12
Q1
20
13
Q1
20
14
Q1
20
15
Q1
20
16
Q1
ASEAN-4 (in % of GDP)
GROSS OUTFLOWS GROSS INFLOWS NET FLOW (rhs)
-25
-20
-15
-10
-5
0
5
10
15
20
25
2003
Q1
20
04
Q1
2005
Q1
2006
Q1
2007
Q1
2008
Q1
20
09
Q1
2010
Q1
2011
Q1
2012
Q1
2013
Q1
20
14
Q1
2015
Q1
2016
Q1
Middle East and North Africa (in % of GDP)
GROSS OUTFLOWS GROSS INFLOWS NET FLOW (rhs)
-50
-40
-30
-20
-10
0
10
20
30
40
50
20
00
Q1
20
01
Q1
2002
Q1
2003
Q1
2004
Q1
2005
Q1
2006
Q1
2007
Q1
2008
Q1
2009
Q1
2010
Q1
2011
Q1
2012
Q1
2013
Q1
2014
Q1
2015
Q1
Sub-Saharan Africa (in % of GDP)
GROSS OUTFLOWS GROSS INFLOWS NET FLOW (rhs)
-15
-10
-5
0
5
10
15
-25
-20
-15
-10
-5
0
5
10
15
20
25
2000
Q1
2001
Q1
2002
Q1
2003
Q1
2004
Q1
2005
Q1
2006
Q1
2007
Q1
2008
Q1
2009
Q1
2010
Q1
2011
Q1
2012
Q1
2013
Q1
2014
Q1
2015
Q1
2016
Q1
Latin America (in % of GDP)
GROSS OUTFLOWS GROSS INFLOWS NET FLOW (rhs)

Analysis of developments in EU capital flows in the global context
November 2016 [19]
Figure 3 Composition of net capital flows in major regions of the world (in percent of GDP)
-6
-4
-2
0
2
4
6
8
2001
Q1
2002
Q1
2003
Q1
20
04
Q1
2005
Q1
2006
Q1
20
07
Q1
2008
Q1
2009
Q1
20
10
Q1
20
11
Q1
2012
Q1
2013
Q1
20
14
Q1
2015
Q1
2016
Q1
Euro area
4-quarter moving average
-10
-8
-6
-4
-2
0
2
4
6
8
10
20
15
Q2
20
15
Q3
20
15
Q4
20
16
Q1
20
16
Q2
Latest quarterly
developments
-6
-4
-2
0
2
4
6
20
15
Q2
20
15
Q3
20
15
Q4
20
16
Q1
20
16
Q2
Latest quarterly
developments
-15
-13
-11
-9
-7
-5
-3
-1
1
3
5
20
01
Q1
20
01
Q4
20
02
Q3
20
03
Q2
20
04
Q1
20
04
Q4
20
05
Q3
20
06
Q2
20
07
Q1
20
07
Q4
20
08
Q3
20
09
Q2
20
10
Q1
20
10
Q4
20
11
Q3
20
12
Q2
20
13
Q1
20
13
Q4
20
14
Q3
20
15
Q2
20
16
Q1
CEE
4-quarter moving average
-25
-15
-5
5
15
25
352
01
5Q
2
20
15
Q3
20
15
Q4
20
16
Q1
20
16
Q2
Latest quarterly
developments
-20
-15
-10
-5
0
5
10
15
20
01
Q1
20
02
Q1
20
03
Q1
20
04
Q1
20
05
Q1
20
06
Q1
20
07
Q1
20
08
Q1
20
09
Q1
20
10
Q1
20
11
Q1
20
12
Q1
20
13
Q1
20
14
Q1
20
15
Q1
20
16
Q1
DK, SE, UK
4-quarter moving-average
-5
-4
-3
-2
-1
0
1
2
3
4
5
20
01
Q1
20
02
Q1
20
03
Q1
20
04
Q1
20
05
Q1
20
06
Q1
20
07
Q1
20
08
Q1
20
09
Q1
20
10
Q1
20
11
Q1
20
12
Q1
20
13
Q1
20
14
Q1
20
15
Q1
20
16
Q1
Non EU advanced
4-quarter moving average
-5
-4
-3
-2
-1
0
1
2
3
4
5
2015
Q2
2015
Q3
2015
Q4
2016
Q1
2016
Q2
Latest quarterly
developments

Analysis of developments in EU capital flows in the global context
November 2016 [20]
-8
-6
-4
-2
0
2
4
62
00
1Q
1
20
01
Q4
20
02
Q3
20
03
Q2
20
04
Q1
20
04
Q4
20
05
Q3
20
06
Q2
20
07
Q1
20
07
Q4
20
08
Q3
20
09
Q2
20
10
Q1
20
10
Q4
20
11
Q3
20
12
Q2
20
13
Q1
20
13
Q4
20
14
Q3
20
15
Q2
20
16
Q1
ASEAN-4
4-quarter moving average
-8
-6
-4
-2
0
2
4
6
8
20
15
Q2
20
15
Q3
20
15
Q4
20
16
Q1
20
16
Q2
Latest quarterly
developments
-5
-4
-3
-2
-1
0
1
2
3
4
5
20
01
Q1
20
02
Q1
20
03
Q1
20
04
Q1
20
05
Q1
20
06
Q1
20
07
Q1
20
08
Q1
20
09
Q1
20
10
Q1
20
11
Q1
20
12
Q1
20
13
Q1
20
14
Q1
20
15
Q1
20
16
Q1
Latin America
4-quarter moving average
-7
-5
-3
-1
1
3
5
7
20
15
Q2
20
15
Q3
20
15
Q4
20
16
Q1
20
16
Q2
Latest quarterly
developments
-25
-20
-15
-10
-5
0
5
10
15
20
2001
Q1
2002
Q1
2003
Q1
2004
Q1
2005
Q1
2006
Q1
2007
Q1
2008
Q1
2009
Q1
2010
Q1
2011
Q1
2012
Q1
2013
Q1
2014
Q1
2015
Q1
Sub-Saharan Africa
4-quarter moving average
-30
-25
-20
-15
-10
-5
0
5
10
15
20
2014
Q4
2015
Q1
2015
Q2
2015
Q3
2015
Q4
Latest quarterly
developments
-10
-5
0
5
10
15
20
03
Q1
20
04
Q1
20
05
Q1
20
06
Q1
20
07
Q1
20
08
Q1
20
09
Q1
20
10
Q1
20
11
Q1
20
12
Q1
20
13
Q1
20
14
Q1
20
15
Q1
20
16
Q1
CIS 9 EXCL. RUSSIA
4-quarter moving average
-15
-10
-5
0
5
10
15
2015
Q2
2015
Q3
2015
Q4
2016
Q1
2016
Q2
Latest quarterly
developments
Analysis of developments in EU capital flows in the global context
November 2016 [21]
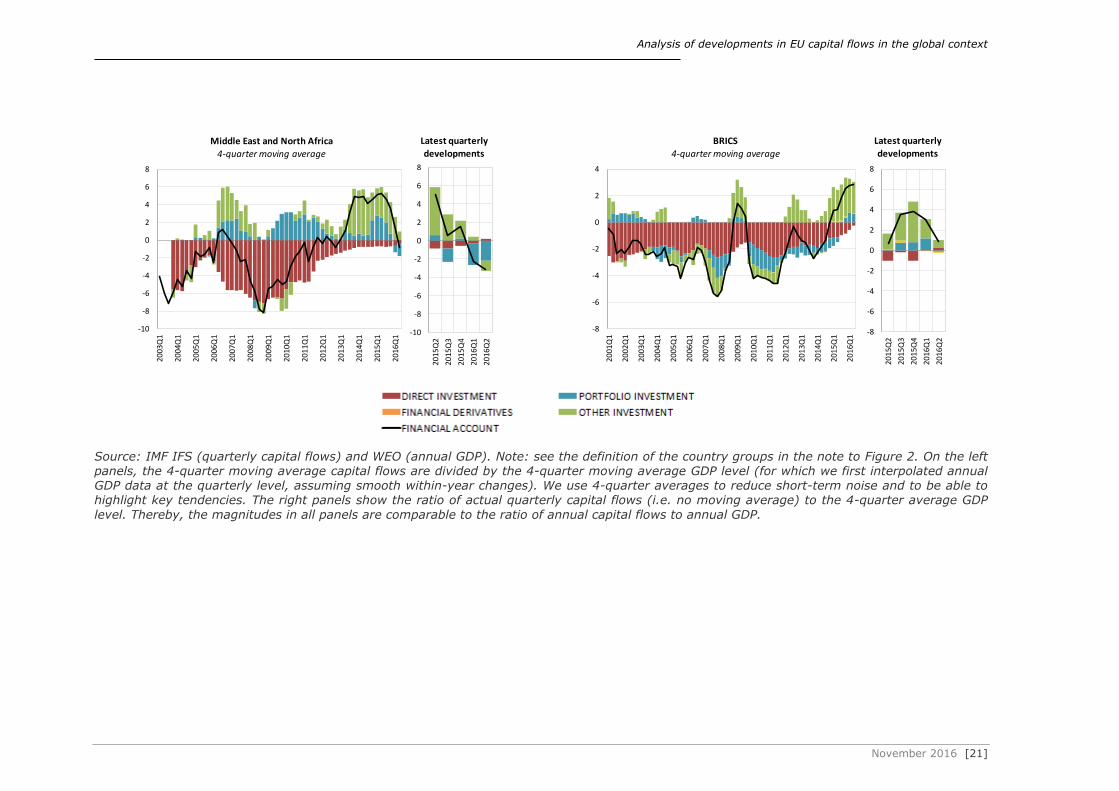
Source: IMF IFS (quarterly capital flows) and WEO (annual GDP). Note: see the definition of the country groups in the note to Figure 2. On the left panels, the 4-quarter moving average capital flows are divided by the 4-quarter moving average GDP level (for which we first interpolated annual GDP data at the quarterly level, assuming smooth within-year changes). We use 4-quarter averages to reduce short-term noise and to be able to highlight key tendencies. The right panels show the ratio of actual quarterly capital flows (i.e. no moving average) to the 4-quarter average GDP
level. Thereby, the magnitudes in all panels are comparable to the ratio of annual capital flows to annual GDP.
-10
-8
-6
-4
-2
0
2
4
6
82
00
3Q
1
20
04
Q1
20
05
Q1
20
06
Q1
20
07
Q1
20
08
Q1
20
09
Q1
20
10
Q1
20
11
Q1
20
12
Q1
20
13
Q1
20
14
Q1
20
15
Q1
20
16
Q1
Middle East and North Africa
4-quarter moving average
-10
-8
-6
-4
-2
0
2
4
6
8
2015
Q2
2015
Q3
2015
Q4
2016
Q1
2016
Q2
Latest quarterly
developments
-8
-6
-4
-2
0
2
4
20
01
Q1
20
02
Q1
20
03
Q1
20
04
Q1
20
05
Q1
20
06
Q1
20
07
Q1
20
08
Q1
20
09
Q1
20
10
Q1
20
11
Q1
20
12
Q1
20
13
Q1
20
14
Q1
20
15
Q1
20
16
Q1
BRICS
4-quarter moving average
-8
-6
-4
-2
0
2
4
6
8
20
15
Q2
20
15
Q3
20
15
Q4
20
16
Q1
20
16
Q2
Latest quarterly
developments

Analysis of developments in EU capital flows in the global context
November 2016 [22]
Figure 3 shows that in terms of net position and components3, the euro area was characterised by capital outflows after the end of 2012, predominantly driven by bank-
related outflows (loans and deposits) during 2012-14 that amounted to about 5% of euro-area GDP. This might have been the result of global bank deleveraging in response
to the euro area’s sovereign and banking crisis of 2012-13. It is notable that this trend reversed in 2014Q3 and other investment is flowing in again, which might relate to the
improved soundness of financial intuitions as a result of the preparation for, and the actual take-over by the European Central Bank of the single supervisory role in the euro
area. In 2015, the euro area experienced net portfolio investment outflows practically for
the first time since 2001, reflecting to some extent the impact of the ECB’s asset purchase programme. Thereby, the total net capital outflow from the euro area has
accelerated. Foreign investors lost interest in euro-area debt markets because euro-area government and corporate bond yields were compressed. In this context, Hüttl and
Merler (2016) look at the impact of quantitative easing on sovereign debt holdings in the euro area. They find that increases in central banks holdings of sovereign debt are offset
by decreases in holdings of other institutional sectors. In Germany and France in particular, non-resident holdings are diminishing. To the extent that nonresidents from
the perspective of Germany and France are also non-residents from the perspective of
the euro area as a whole, the decline in non-resident holdings of French and German sovereign debt contributed to the net outflow of portfolio investment from the euro area.
The CEE countries’ net financial inflows have receded substantially since the height of
the financial crisis and these countries became net capital exporters in 2015-16. The reduction of cross-border lending by foreign banks operating in the region since 2011
was a major factor in this development. The deleveraging averaged about 2% of CEE GDP in 2011-16 and there does not seem to be a major change in this trend. Eller et al
(2016) show that the global financial cycle explains by far the largest share of capital
flow volatility in this region. Portfolio investment inflows decreased significantly over the same period and turned into outflows by 2014Q2, a trend that continued in 2015.
Moreover, FDI net inflows have also diminished in 2015-16, contributing to the financial account surplus in the CEE.
In contrast to the euro area and CEE countries, Sweden, Denmark and the
United Kingdom experienced substantial net capital inflows from 2014 to our most recent observation of 2016Q1. This was driven by strong portfolio and FDI inflows, while
bank-related outflows over the same period offset somewhat the observed inflows.
In non-EU advanced countries, the relatively stable earlier FDI outflows at around 1%
of GDP between 2008-14 suddenly halted in 2015, which may explain, at least partly, the recent decline in global FDI flows as reflected in Figure 1. We cannot exclude that
improved domestic investment opportunities, as a consequence of improved economic outlook, played a role. It is really notable that the earlier large portfolio investment
inflows were gradually reduced and in fact turned into outflows in 2015. A likely factor that might explain the change from portfolio inflow to outflow in non-EU advanced
countries is the changed behaviour of the former reserve-accumulating central banks of
China, Middle East and many other emerging countries.
A rather marked trend change can be observed for the stock of foreign exchange reserves held by central banks. Up to 2013, there was a very rapid process of
reserve accumulation by central banks, as shown in Figure 4: the share of foreign currency reserves in world GDP increased from about 3 percent in the early 1990s to 15
percent by 2013, during a period in which world GDP also increased rapidly. A large literature has analysed the reasons for such reserve accumulation (such as precautionary
reserve accumulation as a kind of self-insurance against future capital outflows, the
3 See Box 1 for more detail.

Analysis of developments in EU capital flows in the global context
November 2016 [23]
desire to keep the currency exchange rate weaker to support export growth, or saving
large revenues from commodity sales, such as oil exports) and the consequences of it (such as welfare losses for reserve-holding countries); see for example Angeloni et al
(2011).
The trend clearly changed after 2013, when reserves started to decline both nominally (measured in US dollars) and as a share of GDP, while in 2015-16 the ratio of reserves
to GDP remained broadly stable. A fall in reserves indicates that net capital inflows to reserve-holding countries are smaller than their current account deficits (in absolute
terms). Related to monetary policy tightening in some advanced countries, like the US
‘tapering’ in 2013 and the more recent expectations of an interest rate increase, capital outflows from emerging economies accelerated. Central banks of reserve-holding
emerging countries decided to dampen the depreciating impact of capital outflows on the exchange rate by selling their foreign exchange reserves. The November 2016 election of
Donald Trump as the next president of the United States of America has led to an increase in US government bond yields and there are widespread expectations that US
yields will continue to rise. This may lead to further capital outflows from emerging and developing countries.
It needs to be seen whether the depletion of foreign exchange reserves is a temporary phenomenon, which will end once capital outflows moderate, or if a new trend has
started in which central banks that hold large reserves reassess their strategies. Even in the short-run, reserve depletion can have impacts on advanced economies: a large share
of reserves are held in liquid financial assets such as government bonds of advanced countries, and to reduce reserves, those government bonds should be sold first. This in
turn can lead to interest rate increases in advanced countries4.
Figure 4 Stock of foreign exchange reserves (as share of world GDP)
Source: IMF IFS (foreign exchange reserves) and IMF WEO April 2016 (GDP).
4 See Cohen-Setton (2015) for a survey of the debate in the blog-sphere on this issue.
0
2
4
6
8
10
12
14
16
18
19
80
19
82
19
84
19
86
19
88
19
90
19
92
19
94
19
96
19
98
20
00
20
02
20
04
20
06
20
08
20
10
20
12
20
14
2016M
6
United States Euro area 18 Rest of the World
China Oil exporters Emerging Asia
Rest of the EU Japan

Analysis of developments in EU capital flows in the global context
November 2016 [24]
The ASEAN-4 and the BRICS have been subject to increased capital inflows since the
global financial crisis. Most likely, accommodative monetary policies in advanced economies (as reflected in the increase of major central banks’ balance sheets, shown in
Figure 5) and the resulting global search for yields have played a role in these inflows. This is reflected in increased portfolio funding since 2010 in both regions. Since May
2013, when the Federal Reserve discussed for the first time its plans for tapering unconventional monetary policies, these emerging markets have experienced receding or
even reversing capital inflows at the same time as their domestic economic activities have slowed. In the BRICs, the net financial account strengthened further during 2014,
as other investment switched to net outflows in 2014Q2 – suggesting foreign investors’
withdrawals of deposits and loans from banks located in the BRICS. The ASEAN-4 was characterised by a similar picture during 2013-14, experiencing portfolio and bank-
related outflows during 2015. Interestingly, both regions had turned into net capital exporters by 2015.
Figure 5: Expansion of Central Bank’s balance sheets (in % of GDP)
Source: FRED and WEO; BoE data discontinued as of September 2014
We also note that the divergent monetary policies of advanced countries, with the
Federal Reserve having already increased its interest rate, while the European Central Bank and the Bank of Japan continue large-scale asset purchases, have likely also
influenced exchange rate developments (Figure 6). Moreover, the 23 June 2016 UK referendum on EU membership, which resulted in a victory for the campaign to leave the
EU, also sent shockwaves to currency markets and might have led to a ‘flight to safety’ of capital flows.
0
10
20
30
40
50
60
70
80
90
100
2006 2007 2008 2009 2010 2011 2012 2013 2014 2015 2016
BoE ECB FED BoJ

Analysis of developments in EU capital flows in the global context
November 2016 [25]
Figure 6: Real effective exchange rate developments, January 1970 – June
2016 (average of 1970-2016 = 100)
A: Selected advanced economies
B: BRIC countries
Note: To better capture the impact of the Brexit referendum, we use the 29 June 2016 exchange
rate for June 2016 (monthly average exchange rates are used for all other months). A higher value indicates a stronger home currency. Source: Bruegel real and nominal effective exchange rate dataset and author’s calculations.
Interestingly, the Japanese yen was on an appreciating path in 2016, despite the
massive asset purchases by the Bank of Japan. The yen gained further in value after the Brexit referendum. The Brazilian real and the Russian rouble also appreciated
significantly after the Brexit referendum, though these currencies have been rather volatile in the past few years, partly because of domestic economic problems in Brazil
and Russia, but also because of the monetary policy of advanced country central banks.
In this context, IMF research showed that in 2013, emerging markets were hit by
outflows indiscriminately at first, but over time there was greater differentiation, and good macroeconomic fundamentals helped dampen the market reaction (IMF, 2014a).
50
75
100
125
150
19
70
M0
1
19
75
M0
1
19
80
M0
1
19
85
M0
1
19
90
M0
1
19
95
M0
1
20
00
M0
1
20
05
M0
1
20
10
M0
1
20
15
M0
1
Euro area Japan United Kingdom United States
50
75
100
125
150
19
70
M0
1
19
75
M0
1
19
80
M0
1
19
85
M0
1
19
90
M0
1
19
95
M0
1
20
00
M0
1
20
05
M0
1
20
10
M0
1
20
15
M0
1
Brazil
China
India
Russia

Analysis of developments in EU capital flows in the global context
November 2016 [26]
Furthermore, much of the decline in inflows in the recent past can be explained by the
narrowing of the differences between emerging and advanced economy growth prospects (IMF, 2016).
The vector-autoregressive model estimates reported in our last year’s report (Darvas et
al, 2015) indicated that capital inflows to emerging countries increase when advanced country GDP is higher, the GDP of emerging countries is higher and when the VIX index
is lower. In turn, capital inflows increase the GDP of emerging countries. By assessing the three main types of capital flows, we also found that FDI flows to emerging
economies are not influenced by the VIX index (and consequently all factors that
influence the VIX index), while portfolio and other investments respond to changes in the VIX index in a broadly similar way. This is in line with Coerdacier et al (2015), who found
that the emerging world invests in advanced economies to insure against income volatility.
Among the main emerging country regions, only inflows to Latin America and Sub-
Saharan Africa seem to have held up (Figure 3). In Latin America, FDI and portfolio inflows account for about half of net capital inflows, while in Sub-Saharan Africa inflows
are almost entirely composed of FDI. In both of these regions, current inflows are much
higher than in the pre-crisis period.
An interesting picture emerges for Sub-Saharan Africa, which has benefitted from massive direct investment inflows since 2010, highlighting the attractiveness of this
region in recent years, especially to China (World Bank, 2015). In 2015, FDI receded somewhat (standing at 10% of group GDP in 2015 Q4), while increasing portfolio
investment inflows contributed to an even higher financial account deficit in 2015 Q4. Looking ahead, it will be interesting to see the impact of slower growth in China on this
region.
CIS 8 (excl. Russia) experienced cross-border deleveraging of banks operating in the
area between 2008 and 2013, a trend which slowed in 2013, before picking up again in 2014. At the same time, portfolio funding has been coming back to the region,
contributing to increasing net financial inflows at end 2014.
The Middle East and North Africa have experienced receding FDI inflows since 2011, a trend that stabilised during 2015. Over the same period, large outflows of portfolio and
banking-related instruments were recorded, contributing to an increased financial
account surplus, standing at 8% of group GDP by 2015 Q1.
Box 1: Components of capital flows
Capital flows are defined as cross-border financial transaction recorded in a country’s
external financial accounts, which produce a change in the assets and liabilities of
residents’ vis-á-vis non-residents and can be broken down into the following components:
Foreign direct investment: records financial flows between resident and non-
resident firms that are under a direct investment relationship. A direct investment relationship is established when a resident firm holds at least 10% in the share
capital of a non-resident firm, or vice versa.
Portfolio investment: records financial flows related to transactions between
residents and non-residents that affect their assets and liabilities vis-à-vis each other related to securities and derivatives. Securities are distinguished between
equities and debt securities, namely bonds and money market instruments.

Analysis of developments in EU capital flows in the global context
November 2016 [27]
Residents’ net investment in securities issued by non-residents are recorded
under ‘Assets’, whereas non-residents’ net investment in securities issued by residents are recorded under ‘Liabilities’.
Other investment: records financial flows stemming from transactions between
residents and non-residents related mainly to cross-border loans and deposits. Financial flows related to loans granted by residents to non-residents, as well as
residents’ deposits with non-resident monetary financial institutions are recorded under “Assets”. Financial flows related to loans granted by non-residents to
residents, as well as non-residents’ deposits with resident monetary financial
institutions are recorded under “Liabilities”.
Financial derivatives: records financial flows stemming from financial derivative contracts, which is a financial instrument that is linked to another specific
financial instrument/indicator or commodity and is traded in their own right in financial markets. These transactions are treated as separate transaction rather
than as integral parts of the values of the underlying transactions to which they are linked.
Reserve assets: are those external assets that are readily available to and controlled by the monetary authorities for meeting balance of payments financing
needs, for intervention in exchange markets to affect the currency exchange rate, and for other related purposes. Given the data limitations on a global scale, we
do not include reserve assets in Figure 2 and Figure 3.
The net international investment position (NIIP)5 reflects the accumulated stock of capital flows and changes in valuation of the earlier stock whenever the price of different
assets and liabilities changes. NIIP is relevant for monitoring the external wealth of an economy. It is important to note that large gross stocks are prone to major valuation
changes, which can lead to significant shifts in the net stock position even if net flows are small. As an example, net valuation losses for Germany amounted to 20% of
German GDP in 2011. Large parts of these loses were already being realised in 2007-08 as a result of the implosion of the US subprime mortgage debt market, reflecting the
high past exposure of German banks to US securities (European Commission, 2012). For
a more detailed discussion, please refer to section 2.2 on revaluation and return on investment effects.
As shown in Figure 7, the net position of the euro area was relatively stable between
2008-13 at about minus 10 percent of GDP. However, according to the estimates of Zucman (2013), around 8 percent of the global financial wealth of households is held in
tax havens, three-quarters of which goes unrecorded. If unrecorded assets are accounted for, the euro area turns into a net creditor and not a net debtor to the rest of
the world as indicated by official statistics. Therefore, we should interpret cautiously the
reported net position of the euro area. Still, it is important to highlight that in 2015-16, a process of shrinking both net assets and net liabilities has started, along with a slight
increase in the net position. The components of net positions highlight that the reported negative net position is largely due to accumulated negative net portfolio investment
stocks, while the euro area is a net investor in the rest of the world in terms of foreign
5 The international investment position is a measure of the assets that a country owns abroad and the assets that foreigners own in the country in question. In the graphs, the negative bars indicate
an increase in the claim of non-residents on a country in question, while the positive bars indicate an increase in the claims of the country in question on non-residents.

Analysis of developments in EU capital flows in the global context
November 2016 [28]
direct investment (FDI). The increasing share of net FDI claims on the rest of the world
(including other EU countries, such as central and eastern European Member States) was a clear trend from the mid-2000s up to 2013, as euro-area firms used FDI to penetrate
new markets or to achieve efficiency gains through splitting the value chain of production (European Commission, 2012). However, the net FDI claims of the euro area
started to fall in 2014, with the decline continuing up to 2016Q1, our most recent observation. In Chapter 3, which takes a closer look at Europe, we assess the
contribution of flows to this development, namely whether the main reason is lower euro-area FDI in the rest of the world, or increased foreign FDI in the euro area.
It is notable that two other EU groups (Denmark, Sweden and the UK on the one hand, and CEE countries on the other hand), display the same pattern of reducing net
assets and net liabilities in the past two years, while the overall net position is improving. In CEE countries, liabilities shrank in 2015-16, most notably FDI, while in the
Nordic non-euro members, practically all components of both net assets and net liabilities have shrunk recently.
Beyond the EU, we observe only some shrinkage of liabilities in Brazil and India (data
for China and Russia is unfortunately not available), but a reduction in various
components of net foreign assets and liabilities is not happening in all other non-EU country groups. Moreover, these other non-EU countries also differ from EU countries
by not undergoing an increase in their NIIP, and in fact in Latin America NIIP is gradually deteriorating, which is in line with the continued strong capital inflows into these
countries, as shown by Figure 3.
Japan and Switzerland are special cases, with high positive net positions of 60 percent of GDP and 90 percent of GDP as of 2015Q4, respectively. Therefore, we separated
Japan and Switzerland out of the non-EU advanced county group. Little change can be
observed in Japan in recent years, suggesting that a very expansionary monetary policy (which is conducted by the Bank of Japan) need not necessarily show up in foreign
assets and liabilities. Switzerland, on the other hand, experienced a fall in net portfolio and net FDI claims on the rest of the world, which was partially compensated for by
increased accumulated sizeable positive reserve asset stocks, stemming from intensified interventions in the foreign exchange rate market by the Swiss National Bank, especially
during the period when the Swiss Franc was not allowed to appreciate relative to the euro beyond the rate of 1.2 (September 2011-January 2015). Swiss reserve assets have
increased only marginally since January 2015, when the exchange rate floor was
abandoned. Another notable observation for Switzerland is the increased net liabilities on other investment by foreign investors in Switzerland, suggesting that Switzerland is
increasingly important as a safe haven. A similar, albeit small and steady, increase in net other investment liabilities can also be observed in Japan in 2013-15, suggesting
confidence in the Japanese financial system and economy.

Analysis of developments in EU capital flows in the global context
November 2016 [29]
Figure 7: Net international investment positions (in percent of GDP)
-60
-50
-40
-30
-20
-10
0
10
20
30
2000
Q1
2001
Q1
2002
Q1
2003
Q1
2004
Q1
2005
Q1
2006
Q1
2007
Q1
2008
Q1
2009
Q1
2010
Q1
2011
Q1
2012
Q1
2013
Q1
2014
Q1
2015
Q1
2016
Q1
Euro area (in % of GDP)
RESERVE ASSETS OTHER INVESTMENT
PORTFOLIO INVESTMENT DIRECT INVESTMENT
NIIP
-120
-100
-80
-60
-40
-20
0
20
40
20
04
Q1
20
05
Q1
20
06
Q1
20
07
Q1
20
08
Q1
20
09
Q1
20
10
Q1
20
11
Q1
20
12
Q1
20
13
Q1
20
14
Q1
20
15
Q1
20
16
Q1
CEE (in % of GDP)
DIRECT INVESTMENT PORTFOLIO INVESTMENT
OTHER INVESTMENT RESERVE ASSETS
NIIP
-60
-50
-40
-30
-20
-10
0
10
20
30
40
20
00
Q1
20
01
Q1
20
02
Q1
20
03
Q1
20
04
Q1
20
05
Q1
20
06
Q1
20
07
Q1
20
08
Q1
20
09
Q1
20
10
Q1
20
11
Q1
20
12
Q1
20
13
Q1
20
14
Q1
20
15
Q1
20
16
Q1
DK, SE, UK (in % of GDP)
DIRECT INVESTMENT PORTFOLIO INVESTMENT
OTHER INVESTMENT RESERVE ASSETS
NIIP
-50
-40
-30
-20
-10
0
10
20
20
06
Q1
20
07
Q1
20
08
Q1
20
09
Q1
20
10
Q1
20
11
Q1
20
12
Q1
20
13
Q1
20
14
Q1
20
15
Q1
20
16
Q1
Non EU advanced (in % of GDP)
DIRECT INVESTMENT PORTFOLIO INVESTMENT
OTHER INVESTMENT RESERVE ASSETS
NIIP
-80
-60
-40
-20
0
20
40
2004
Q1
2005
Q1
2006
Q1
2007
Q1
2008
Q1
2009
Q1
2010
Q1
2011
Q1
2012
Q1
2013
Q1
2014
Q1
2015
Q1
2016
Q1
CIS excl. Russia (in % of GDP)
DIRECT INVESTMENT PORTFOLIO INVESTMENT
OTHER INVESTMENT RESERVE ASSETS
NIIP
-40
-30
-20
-10
0
10
20
30
20
05
Q1
20
06
Q1
20
07
Q1
20
08
Q1
20
09
Q1
20
10
Q1
20
11
Q1
20
12
Q1
20
13
Q1
20
14
Q1
20
15
Q1
20
16
Q1
Latin America (in % of GDP)
DIRECT INVESTMENT PORTFOLIO INVESTMENT
OTHER INVESTMENT RESERVE ASSETS
NIIP

Analysis of developments in EU capital flows in the global context
November 2016 [30]
Source: IMF IFS (quarterly IIP) and WEO (annual GDP). Note: country groups are defined in the note to Figure 2, but due to data limitations, the following changes occur: non-EU advanced:
Hong Kong is included only since 2010; CEE7: Bulgaria is included only since 2007; Latin America: without Argentina, Ecuador, Mexico, Uruguay; CIS 8 (EXCL. RUSSIA): without Azerbaijan, Kyrgyz Republic, Tajikistan and Ukraine; No data availability for ASEAN-4, Middle East and North Africa and Sub-Saharan Africa.
2.2 Investment yields and valuation effects of foreign assets and
liabilities
When looking at foreign assets and liabilities, it is important to answer the question of whether the savings invested abroad actually deliver the expected returns (see also
European Commission, 2012). This can be done by looking first at external yields,
which are the difference between the income stream from foreign assets and the income stream to holders abroad. These income streams are measured as a share of the stock
of outstanding assets. Second, we look at valuation effects, or the change in the value of the net stocks of foreign assets through holding gains or losses. To get the full
evaluation of the investment abroad, we then consider total returns, which combine both the external yield and price (valuation) effects.
-60
-50
-40
-30
-20
-10
0
10
20
3020
06Q
1
2007
Q1
2008
Q1
2009
Q1
2010
Q1
2011
Q1
2012
Q1
2013
Q1
2014
Q1
2015
Q1
2016
Q1
Brazil and India (in % of GDP)
DIRECT INVESTMENT PORTFOLIO INVESTMENT
OTHER INVESTMENT RESERVE ASSETS
NIIP
-20
-10
0
10
20
30
40
50
60
70
80
20
10
Q2
20
11
Q2
20
12
Q2
20
13
Q2
20
14
Q2
20
15
Q2
20
16
Q2
Japan (in % of GDP)
DIRECT INVESTMENT PORTFOLIO INVESTMENTOTHER INVESTMENT RESERVE ASSETSNIIP
-100
0
100
200
300
20
08
Q1
20
09
Q1
20
10
Q1
20
11
Q1
20
12
Q1
20
13
Q1
20
14
Q1
20
15
Q1
20
16
Q1
Switzerland (in % of GDP)
DIRECT INVESTMENT PORTFOLIO INVESTMENT
OTHER INVESTMENT RESERVE ASSETS
NIIP
Analysis of developments in EU capital flows in the global context
November 2016 [31]
External annualised yield
We calculate the external annualised yield by dividing the income flows (interest or dividend) by the stock of outstanding assets or liabilities. For the United States, for
example, we find that the cost of servicing its liabilities (which to a great extent comprise fixed income assets, partly reflecting the dominant role of the US dollar in the
international monetary system) is much lower than the return on US investment abroad (which typically takes the form of various equity-type investments). This is expressed as
a positive spread between assets and liabilities. Thereby, some authors have named the US the ‘World Venture Capitalist’ (Gourinchas and Rey, 2005).
Table 1 allows us to assess if some European countries share similar privileges. There are significant differences between countries in spreads between total returns on foreign
assets and liabilities. Focusing on equity, we find that in the pre-crisis period (2005Q1-2006Q4), countries from CSEE like Poland, the Czech Republic and Romania,
experienced non-negligible negative spreads for equity. The reason for this is that foreign investors made unusually large returns on their investment in the CEE region,
around 10 percent per year in some cases. Investments abroad did not pay off as much. Positive spreads on equity could be found in France, Germany, Finland, Spain and the
United Kingdom before the crisis, suggesting that investment opportunities abroad paid
off more than at home. During the crisis and the recovery, the CSEE became less attractive as capital flowed out of the region, contributing to more moderate returns on
liabilities in different countries. From a global perspective, the positive equity spreads of the US are well above the positive spreads of EU countries during 2007-15. A similar
picture emerges for Japan. On the debt side, the US experienced zero spread during 2007-15. By contrast, most EU countries also received positive spreads in all three
periods, though these spreads are typically small except in central and eastern European countries.
Overall, larger EU countries such as Germany, France, Finland, the Netherlands, Sweden and the United Kingdom succeeded in replicating to some extent the privileges of the US
on equity returns throughout the periods taken into consideration. In contrast, the CEE region experienced large negative spreads on equity because of the very high returns on
their liabilities, but they had the remarkable privilege of large positive spreads on debt-type foreign assets. It is also worthwhile highlighting that the vulnerable euro-area
countries which received financial assistance programmes (with the exception of Greece) do not display largely negative tendencies in terms of returns on foreign assets and
liabilities relative to other EU countries, because of financial assistance programmes and
Eurosystem Central Bank (ESCB) flows. Continued membership of the euro helped financial-assistance countries to manage their external accounts during the crisis years.
Revaluation effects
The valuation of assets and liabilities changes because of changes in market value or exchange rate movements. The accumulated revaluation effects are calculated as
follows. At any point in time, the current stock can be decomposed into the initial stock
at some earlier period, 0, and the accumulated sum of flows and the accumulated sum of revaluations. A counterfactual series of the accumulated flows is created (starting from
the first actual observation of stocks), and the percentage difference between the actual series (which includes all revaluation effects) and counterfactual (which by construction
ignores revaluations) is taken to be the accumulated revaluation effect. We then calculate the average annualised percent revaluation effect. The components are
grouped into debt and equity; a further breakdown is unfortunately not feasible.
Table 2 presents the annualised revaluation effects in a similar structure to Table 1 on
investment performance, with breakdowns by instrument type – debt (sum of debt

Analysis of developments in EU capital flows in the global context
November 2016 [32]
instruments and other investment) and equity (sum of equity and FDI) – and by time
period (2006Q4-2010Q4 and 2011Q1-2015Q4).
Revaluation effects are significantly different for different countries, and over time. Table 2 shows that Germany, Spain and Sweden suffer from the worst revaluation spreads in
equity over the whole period. Over the two sub-periods, we see that these losses for Germany are largely a consequence of events in during 2007-10, while Spain and
Sweden suffered losses in the subsequent period (2011-15). In terms of debt revaluations, several EU countries report negative spreads. This could mainly be because
of the other investment component, which comprises inter- and intra-bank loans,
reflecting the period of financial disintegration starting with the crisis.
Total returns
Total returns are calculated as the simple addition of annualised revaluation effects and annualised yield on investments. Of the larger economies in the EU, Germany and
Poland suffered the most from negative total returns on their equity. Poland’s result is driven by extremely outsized returns on foreign investment in the country, while
Germany suffered from revaluation of its assets during the financial crisis.
Interestingly, Greece shows extremely large positive total equity returns (in spreads)
during the two periods taken into consideration. Greece has benefited from a collapse in value of its liabilities. From 2011-15, Greek liabilities fell in value by 16.6% per year,
while the yield on equality liabilities was minus 2.4%, leading to a minus 19.0% annualised total return on equity liabilities during 2011-15. This implies a substantial
loss in value of equity liabilities.
It is notable that the United States lost its overall positive total return on equity in 2011-
14, which is entirely a result of revaluation changes. The annualised yield on US equity assets abroad (5.5%) exceeded the yield foreign investors made in the US (2.8%), but
revaluations changed the results: the US gained only 0.7% per year, while foreign investors gained 7.3% per year. These revaluations most likely reflect a stronger US
dollar (which reduces the total return from the perspective of the US and increases the total return from the perspective of foreign investors investing in the US) and the
substantial increase in US equity prices from 2011-15.

Analysis of developments in EU capital flows in the global context
October 2016 [33]
Table 1: External annualised yields for 26 EU countries and United States, Japan and Switzerland, in %
Equity Debt
Countries 2005Q1-2006Q4 2007Q1-2010Q4 2011Q1-2015Q5 2005Q1-2006Q4 2007Q1-2010Q4 2011Q1-2015Q5
A L S A L S A L S A L S A L S A L S
Austria 5,3 5,2 0,1 4,4 3,6 0,8 4,6 4,6 0,0 3,4 3,5 -0,1 3,2 3,5 -0,3 2,0 2,4 -0,4
Belgium 4,6 5,4 -0,8 3,4 4,3 -0,9 2,4 3,0 -0,6 3,4 3,3 0,0 3,2 3,0 0,2 1,9 1,7 0,2
Czech Republic 7,8 11,8 -3,9 7,5 11,7 -4,2 3,9 10,3 -6,4 9,5 5,9 3,6 5,2 3,2 2,0 2,7 2,4 0,3
Denmark 7,4 6,9 0,5 5,7 4,5 1,1 4,5 3,7 0,8 4,0 3,3 0,7 3,5 2,8 0,7 2,6 1,6 1,0
Estonia 10,7 9,8 1,0 6,9 9,8 -3,0 4,8 8,1 -3,3 3,1 2,6 0,5 3,4 2,9 0,5 1,0 0,9 0,1
Finland 5,7 4,7 0,9 5,0 4,3 0,6 3,9 4,5 -0,6 3,4 3,5 -0,1 2,6 3,0 -0,4 1,2 1,5 -0,3
France 4,9 3,2 1,7 4,1 2,9 1,2 3,9 2,9 1,1 3,8 3,6 0,2 3,4 2,9 0,5 1,8 1,7 0,2
Germany 5,4 4,4 1,0 4,6 4,0 0,6 4,4 3,7 0,8 3,8 3,6 0,2 3,5 3,1 0,4 2,2 1,6 0,6
Greece 3,3 3,7 -0,5 2,0 2,2 -0,2 1,6 -2,4 4,0 2,4 3,5 -1,1 2,2 3,5 -1,3 1,3 1,7 -0,4
Hungary 8,6 8,3 0,3 5,8 6,7 -0,9 3,8 5,3 -1,5 5,4 3,9 1,5 3,3 3,9 -0,6 1,6 3,5 -1,9
Italy 2,4 4,5 -2,1 3,9 4,0 -0,1 3,3 3,4 -0,1 4,1 3,4 0,7 3,1 3,2 -0,2 2,0 2,3 -0,3
Luxembourg 3,3 3,4 -0,2 3,0 3,3 -0,3 3,1 3,2 -0,1 2,7 2,0 0,7 2,8 2,1 0,7 2,5 2,1 0,5
Netherlands 5,5 5,1 0,4 5,1 5,0 0,0 4,4 4,6 -0,1 3,1 3,5 -0,4 2,8 3,2 -0,4 1,8 2,0 -0,2
Poland 3,1 10,4 -7,3 1,0 8,7 -7,6 2,8 7,5 -4,7 4,6 3,5 1,1 2,9 3,6 -0,7 1,3 3,0 -1,7
Portugal 4,9 5,4 -0,5 5,1 5,7 -0,6 3,4 3,4 0,0 3,0 3,0 0,0 3,1 3,2 -0,1 1,7 2,0 -0,2
Romania -8,1 14,2 -22,4 1,1 5,4 -4,3 1,6 3,7 -2,1 7,6 5,4 2,2 1,2 3,7 -2,5 0,9 3,0 -2,0
Spain 5,2 4,1 1,1 5,2 4,2 1,0 4,7 3,1 1,5 2,8 3,6 -0,7 2,8 3,4 -0,6 1,9 2,0 -0,2
Japan - - - - - - 7,3 3,1 4,2 - - - - - - 2,6 0,7 1,9
United States - - - 6,1 3,1 3,0 5,5 2,8 2,7 - - - 3,2 3,3 -0,1 1,9 1,9 0,1
United Kingdom 7,1 4,9 2,2 5,9 5,0 0,9 4,5 4,3 0,2 3,5 3,6 -0,1 2,8 2,9 -0,1 1,1 1,5 -0,3
Source: Bruegel calculations using IMF BOP. Note: ‘Equity’ groups together ‘Direct Investment’ and ‘Portfolio investment – equity’, while ‘Debt’ consists of ‘Other
investments’ and ‘Portfolio investment – debt’; A = Assets, L = Liabilities, S = Spread between assets and liabilities; data up to 2015Q4; no data for Croatia, Cyprus,
Ireland, Lithuania, Malta, Slovakia, Slovenia and Sweden;

Analysis of developments in EU capital flows in the global context
October 2016 [34]
Table 2: Annualised revaluation effects for selected countries
Equity Debt
Countries 2006Q4-15Q4 2006Q4-10Q4 2011Q1-15Q4 2006Q4-15Q4 2006Q4-10Q4 2011Q1-15Q4
A L S A L S A L S A L S A L S A L S
Austria 0.2 0.1 0.1 -1.7 -1.9 0.2 1.8 1.7 0.0 0.1 0.6 -0.5 -1.0 0.2 -1.2 1.1 1.4 -0.3
Belgium 1.4 0.0 1.4 3.6 -0.5 4.0 0.6 0.4 0.2 -0.3 -0.4 0.2 0.4 -0.2 0.6 -0.9 -0.9 0.0
Czech Republic 0.8 -1.0 1.9 18.5 12.9 5.6 -11.0 -11.5 0.5 -2.3 -1.8 -0.5 5.7 6.9 -1.2 -9.5 -9.3 -0.2
Germany -0.1 0.9 -1.0 -4.0 -1.7 -2.3 3.0 3.5 -0.5 -0.3 0.0 -0.4 -1.5 -0.7 -0.8 0.4 0.7 -0.2
Estonia -1.4 -1.7 0.3 -7.6 -8.2 0.6 3.0 2.7 0.3 3.4 1.8 1.7 0.1 1.0 -0.9 8.4 3.4 4.9
Greece -0.9 -12.6 11.6 6.4 -16.1 22.4 -6.9 -16.6 9.7 -1.5 -0.9 -0.6 -2.1 -2.0 -0.2 -2.0 -0.6 -1.4
Spain -1.9 -1.0 -0.9 -3.1 -3.8 0.6 -1.9 0.7 -2.6 -1.3 -0.4 -0.9 -3.7 -1.7 -2.0 -0.1 0.3 -0.4
Finland 0.5 -1.5 2.0 -1.1 -6.8 5.7 2.2 2.0 0.1 -1.2 -1.0 -0.1 -1.5 -2.5 1.1 -1.6 -0.4 -1.2
France -0.3 -0.4 0.2 -3.9 -4.7 0.8 2.6 2.9 -0.3 0.8 1.1 -0.3 0.0 0.1 -0.1 1.9 2.7 -0.8
Croatia -3.4 -6.9 3.5 -0.3 -4.2 3.9 -7.7 -12.8 5.1 -3.9 -2.7 -1.2 -2.3 2.4 -4.8 -7.4 -8.2 0.8
Hungary -4.3 -4.7 0.4 -1.7 -1.5 -0.2 -8.8 -9.9 1.2 -7.5 -4.2 -3.2 -9.6 -1.5 -8.1 -10.0 -8.7 -1.3
Italy 0.3 -0.7 1.0 -2.0 -5.8 3.8 2.3 3.0 -0.7 -0.8 -0.3 -0.5 -3.1 -2.5 -0.6 0.6 1.2 -0.7
Lithuania 0.9 -0.9 1.8 0.3 -4.1 4.3 1.9 1.1 0.8 1.7 0.9 0.9 -2.5 -0.1 -2.4 6.4 2.2 4.2
Luxembourg 4.0 1.5 2.5 -1.0 -0.7 -0.3 10.8 4.3 6.4 -3.4 -0.9 -2.5 -3.6 -6.2 2.6 -5.3 2.9 -8.1
Latvia 2.2 0.7 1.5 6.9 -1.9 8.8 -0.2 3.1 -3.3 2.3 0.6 1.8 -0.6 -0.1 -0.5 6.2 1.5 4.8
Netherlands 0.4 0.0 0.4 -1.1 -1.7 0.6 1.9 1.5 0.4 0.3 1.0 -0.8 -1.6 0.7 -2.2 1.9 2.0 0.0
Poland -1.7 -3.1 1.4 6.2 4.9 1.3 -8.5 -10.7 2.2 -6.3 -2.9 -3.5 -5.1 1.7 -6.9 -10.9 -8.0 -2.9
Portugal -1.4 -1.5 0.0 -1.9 -1.9 -0.1 -1.9 -2.1 0.2 -0.7 -0.1 -0.6 -2.3 -1.7 -0.5 0.1 1.2 -1.0
Romania -4.5 -5.4 0.9 -7.5 -5.8 -1.8 -4.8 -8.3 3.5 -2.3 -3.7 1.4 -0.7 -0.5 -0.2 -5.0 -8.3 3.3
Sweden -2.2 -1.8 -0.4 3.6 3.0 0.6 -7.9 -6.4 -1.4 -4.1 -2.6 -1.4 -1.3 1.7 -2.9 -8.6 -7.4 -1.1 United Kingdom
-2.3 -3.5 1.2 -8.8 -10.9 2.2 1.7 0.6 1.0 -2.3 -3.0 0.7 -4.5 -5.5 0.9 -1.9 -2.8 0.9
Japan 1.2 -0.6 1.9 10.0 4.1 6.0 -4.6 -4.6 0.0 -1.4 0.1 -1.4 15.0 17.9 -3.0 -13.5 -12.3 -1.2
Switzerland 4.7 6.7 -2.0 14.3 13.4 0.9 0.4 5.7 -5.3 2.9 2.7 0.2 10.9 9.6 1.2 -1.3 -0.8 -0.4
United States -0.4 1.9 -2.2 -2.0 -3.2 1.2 0.7 7.3 -6.5 1.5 0.1 1.4 4.0 0.3 3.7 0.3 -0.1 0.4 Source: Bruegel calculations using IMF BOP. Note: ‘Equity’ groups together ‘Direct Investment’ and ‘Portfolio investment – equity’, while ‘Debt’ consists of ‘Other
investments’ and ‘Portfolio investment – debt’; A = Assets, L = Liabilities, S = Spread between assets and liabilities; data up to 2015Q4; no data for Bulgaria, Cyprus,
Denmark, Ireland, Slovenia, Slovakia and Latvia;

Analysis of developments in EU capital flows in the global context
October 2016 [35]
Table 3: Total return (yield plus revaluation) for selected countries
Equity Debt
Countries 2007Q1-2010Q4 2011Q1-2015Q4 2007Q1-2010Q4 2011Q1-2015Q4
A L S A L S A L S A L S
Austria 3,0 1,7 1,4 6,4 6,3 0,0 -0,6 2,2 3,7 -1,5 3,1 3,8
Belgium 6,7 3,9 2,9 3,0 3,4 -0,4 0,2 3,7 2,9 0,8 1,0 0,8
Czech Republic 26,0 24,6 1,4 -7,1 -1,1 -5,9 3,1 10,8 10,0 0,8 -6,9 -6,9
Germany 0,7 2,3 -1,7 7,4 7,2 0,2 -0,2 1,9 2,3 -0,4 2,6 2,2
Estonia 0,2 1,7 -1,5 7,8 10,8 -3,0 2,2 3,5 3,9 -0,4 9,4 4,3
Greece 8,4 -13,9 22,3 -5,3 -19,0 13,7 -1,7 0,0 1,5 -1,5 -0,7 1,2
Spain 2,1 0,4 1,7 2,7 3,8 -1,1 -1,6 -0,9 1,7 -2,6 1,8 2,3
Finland 3,8 -2,5 6,3 6,1 6,5 -0,4 -0,3 1,2 0,5 0,7 -0,4 1,1
France 0,2 -1,8 2,0 6,5 5,7 0,8 -0,2 3,3 3,0 0,4 3,8 4,4
Hungary 4,0 5,1 -1,1 -5,0 -4,7 -0,3 -1,7 -6,3 2,4 -8,7 -8,4 -5,2
Italy 1,9 -1,8 3,7 5,6 6,4 -0,8 0,3 0,0 0,7 -0,7 2,6 3,5
Luxembourg 2,0 2,6 -0,6 13,9 7,5 6,4 -1,7 -0,8 -4,1 3,3 -2,7 5,0
Netherlands 4,0 3,3 0,7 6,3 6,0 0,3 -1,1 1,3 3,9 -2,6 3,7 4,0
Poland 7,2 13,6 -6,4 -5,7 -3,2 -2,5 -2,3 -2,2 5,3 -7,5 -9,5 -5,0
Portugal 3,1 3,8 -0,7 1,5 1,4 0,1 -0,6 0,8 1,4 -0,6 1,9 3,1
Romania -6,4 -0,4 -6,0 -3,1 -4,6 1,5 3,6 0,5 3,2 -2,7 -4,1 -5,3
Sweden 3,6 3,0 0,6 -7,9 -6,4 -1,4 -1,4 -1,3 1,7 -2,9 -8,6 -7,4
Japan - - - 2,7 -1,5 4,1 - - - - - -
United States 4,1 -0,1 4,2 6,2 10,1 -3,9 7,3 3,6 3,6 3,6 2,3 1,8
United Kingdom -2,9 -6,0 3,1 6,2 4,9 1,3 0,5 -1,7 -2,5 0,8 -0,8 -1,4

Analysis of developments in EU capital flows in the global context
October 2016 [36]
2.3 Global trends in the banking sector
The banking system is of crucial importance in Europe, and so we look at capital flows from the perspective of the banking sector via international banking claims, as reported
by the BIS banking statistics. This allows us to analyse cross-border bank integration (or disintegration)6.
There is a striking difference between gross foreign claims of EU and non-EU advanced country banks: while claims of EU banks declined significantly since
2007/08 (even halved for euro area banks), claims of non-EU banks (after some volatility in 2007/09) continued to increase even after 2009.
Figure 8 shows the consolidated foreign claims on the rest of the world by country
grouping up to the first quarter of 2015. Euro area banks (Panel A in Figure 8) exhibit the largest claims on other Euro area banks (amounting to 12% of group GDP in
2016Q1), followed by claims on other non EU advanced countries (6% of group GDP).
The deleveraging of Euro area banks with respect to all other country groupings which could be observed since the financial crisis in 2008/09 seems to have reached a plateau
at a lower level in mid-2012, a trend which continued throughout 2013 and into the second half of 2014. However, from mid-2014 to end 2015, a further slowdown of claims
on the rest of the world can be observed, while claims on other non EU advanced as well as other EU have slightly increased in recent quarters, yet total gross foreign claims still
remain at a level of about half the 2008 peak.
Figure 8: Gross foreign claims of domestically owned banks on the rest of the world (percent of group GDP)
Panel A: Euro area 10
Source: BIS consolidated banking statistics (series: immediate borrowing basis, domestically
owned banks, Foreign claims) Eurostat and Bruegel calculations; Note: On the reporting country side, Euro area is made up of AT, BE, DE, ES, FR, IT, IE, NL, PT, FI. On the counterparty side, The Euro area is all 19 member states of the single currency.
6 One should note however, that not all countries are BIS reporting countries, even in Europe.
0
10
20
30
40
50
60
70
80
90
100
20
00
20
01
20
02
20
03
20
04
20
05
20
06
20
07
20
08
20
09
20
10
20
11
20
12
20
13
20
14
20
15
20
16
Euro area Other non EU advanced Other EU Rest of the world

Analysis of developments in EU capital flows in the global context
October 2016 [37]
Panel B: non-Euro EU 3: Denmark, Sweden, and United Kingdom
Source: as above; Note: among the non-euro area EU countries, only Denmark, the United Kingdom and Sweden are BIS reporting countries.
Panel C: Non-EU Advanced 6: Australia, Canada, Japan, South Korea, Switzerland, US
Source: as above.
The non-Euro area countries Denmark, Sweden and United Kingdom (Panel B in Figure 8) report most claims on other non EU advanced. A financial retrenchment
process is ongoing, and claims on the Euro area have fallen from highs of over 46% of
group GDP in 2012 to 26% of GDP currently.
Finally, in contrast to the European regions, the banks located in the six non-EU advanced economies of Australia, Canada, Japan, South Korea, Switzerland, and US
(Panel C in Figure 8) continued to increase their exposure to banks in the rest of the world until the end of 2015, while claims on both European groups have fallen slightly
over 2014 and 2015.
0
50
100
150
200
250
300
3502
000
20
01
20
02
20
03
20
04
20
05
20
06
20
07
20
08
20
09
20
10
20
11
20
12
20
13
20
14
20
15
Euro area Other non EU advanced Other EU Rest of the world
0.0
5.0
10.0
15.0
20.0
25.0
30.0
20
00
20
01
20
02
20
03
20
04
20
05
20
06
20
07
20
08
20
09
20
10
20
11
20
12
20
13
20
14
20
15
20
16
Euro area Other EU Other non EU advanced Rest of the world

Analysis of developments in EU capital flows in the global context
October 2016 [38]
3. A closer look at Europe The previous section assessed capital flows and stock from a global perspective, presenting data on the euro area as a whole and on some non-euro area country
aggregates. However, the euro area is rather heterogeneous and therefore it is important to analyse the different patterns within the euro area. In this section, we take
a closer look at the euro area and the European Union. Instead of reporting data for all 28 EU Member States, we define some country groups to facilitate drawing conclusions
on key tendencies across countries. We also show data separately for three large EU countries, which would be difficult to combine with other countries.
We group the first twelve euro-area countries based on their net international investment position (NIIP) in other investments, which primarily includes banking
claims. Countries with a positive NIIP in other investment are regarded as “creditors”, while countries with a large negative NIIP in other investments are called “debtors” (i.e.
lower than 25% of GDP). We note that the same groups perfectly coincides with a grouping based on pre-crisis (2000-2008) current account developments: “deficit
countries”, where the current account balance as a share of GDP was on average below -2 percent of GDP are the same as “debtor countries” as we define above, while “surplus
countries”, where the current account balance was on average was over 2 percent of
GDP are the same as “creditor countries”. Such correspondence between pre-crisis deficit/surplus countries and current debtor/creditor countries is quite straightforward,
given that current NIIP is to a large extent a legacy of pre-crisis capital flows.
Both possible classifications leave two countries in between: France and Italy. Since capital flow developments in France and Italy were rather different from each other, as
highlighted by for example Hobza and Zeugner (2014a, 2014b), and also different from both creditor and debtor countries, we show data on both of these large countries
separately.
Therefore, we consider the following country groups and countries:
Euro area (EA) Creditor countries: Austria, Belgium, Finland, Germany,
Luxemburg and the Netherlands; Euro area (EA) Debtor countries7: Greece, Portugal and Spain;
France is considered individually in light of its small negative NIIP and its difference from creditor and debtor countries and also from Italy;
Italy is considered individually in light of its small negative NIIP and its difference
from creditor and debtor countries and also from France; North: Denmark and Sweden;
The UK is considered individually in light of its special role for financial intermediation and capital flows;
Central and Eastern Europe8: Czech Republic, Croatia, Estonia, Hungary, Latvia, Lithuania, Poland, Romania, Slovakia and Slovenia.
While countries included in a particular group have major similarities, there is certainly a
large degree of heterogeneity within most of the groups. However, increasing the
number of groups further would risk losing the key tendencies in country-specific details
7 Ireland is excluded given its outstanding role as a financial sector. 8 Cyprus, Bulgaria and Malta are also excluded due to data availability reasons. We also note that five CEE countries and Cyprus and Malta joined the euro area: Slovenia in 2007, Cyprus and Malta in 2008, Slovakia in 2009, Estonia in 2011, Latvia in 2014 and Lithuania in 2015. We include these
countries in the CEE group, and not in the euro-area debtor or creditor groups, because the first twelve euro-area members were characterised by special developments since their early entry to the euro area.

Analysis of developments in EU capital flows in the global context
October 2016 [39]
The data sources for all the charts presented in this section is Eurostat balance of
payments and international investment statistics and the BIS locational banking statistic, unless stated otherwise. All aggregate group figures are obtained by dividing the group’s
totals for each of the instrument presented by the group’s GDP (in a manner to show ratios commensurate with annual GDP, that is quarterly flows are divided by quarterly
GDP, while stock are divided by annual GDP).
3.1 Gross financial flows
The euro area is a special case for the study of capital flows, and deserves major attention. For this reason, Figure 9 reports gross capital flows (both assets and liabilities)
for the euro-area groups, broken down by instruments, i.e. foreign direct investment, portfolio investments and other investments. The black line represents the net financial
account as percent of the group GDP. A problem with the analysis of gross flows is, however, that in the absence of bilateral statistics, the intra-group positions cannot be
netted out, thus inflating the numbers when countries are grouped.
The contraction in gross flows is most evident in the euro area debtor countries,
where gross flows contracted both during the financial crisis in 2008Q3, and after a short recovery phase, again in 2013Q1. By that time, these former debtor countries have
turned into a net exporter of capital, on the back of gross other investment and portfolio debt outflows. It is quite remarkable that gross flows increase substantially by early
2015 and contract again in the next few quarters. On the other hand, among the components of capital flows, the inflow of other investment (mostly banking flows)
increased substantially in 2016Q1.
In the euro area creditor countries, gross flows have also declined somewhat after
2008, but remained more stable after the financial crisis, albeit at a significantly lower level compared to pre-crisis times. Since 2015, the euro area creditor countries
increased their position as net exporter of capital again, on the back of better economic conditions. More recently, Gross flows decreased significantly over 2015Q4 – 2016Q1.
There was a really large contraction in gross flows in France, a country which had a
major role in intermediating capital flows from euro-area surplus and rest of the world
countries to euro-area debtor countries before the crisis, according to Hobza and Zeugner (2014a, 2014b). Italy, on the other hand, where gross flows to GDP were well
below values observed in France and many other countries, shows similar fluctuation in gross flows to debtor countries: there was a reduction after 2008, a temporary rebound
in 2012 followed by a contraction again, and a more recent recovery. It is also notable that other investment (i.e. mostly banking) liability flows returned in 2016Q1, despite
the worries about the Italian banking system as reflected in several media reports.

Analysis of developments in EU capital flows in the global context
October 2016 [40]
Figure 9: Gross financial flows in euro-area groups (percent of GDP)
-60
-45
-30
-15
0
15
30
45
60
20
07
Q1
20
08
Q1
20
09
Q1
20
10
Q1
20
11
Q1
20
12
Q1
20
13
Q1
20
14
Q1
20
15
Q1
20
16
Q1
EA Creditor - Gross financial account items4-quarter moving average
-80
-60
-40
-20
0
20
40
60
80
20
15
Q2
20
15
Q3
20
15
Q4
20
16
Q1
20
16
Q2
Latest quarterly developments
-30
-20
-10
0
10
20
30
20
07
Q1
20
08
Q1
20
09
Q1
20
10
Q1
20
11
Q1
20
12
Q1
20
13
Q1
20
14
Q1
20
15
Q1
20
16
Q1
EA Debtor - Gross financial account items4-quarter moving average
-30
-20
-10
0
10
20
30
20
15
Q2
20
15
Q3
20
15
Q4
20
16
Q1
20
16
Q2
Latest quarterly developments

Analysis of developments in EU capital flows in the global context
October 2016 [41]
Source: Eurostat and Bruegel calculations.
Similar patterns can be observed when looking at the stocks and flows of foreign claims (including both gross and net), as reported by the BIS locational banking statistics
-40
-30
-20
-10
0
10
20
30
40
-40
-30
-20
-10
0
10
20
30
402
00
7Q
1
20
08
Q1
20
09
Q1
20
10
Q1
20
11
Q1
20
12
Q1
20
13
Q1
20
14
Q1
20
15
Q1
20
16
Q1
France - Gross financial account items4-quarter moving average
-40
-30
-20
-10
0
10
20
30
40
20
15
Q2
20
15
Q3
20
15
Q4
20
16
Q1
20
16
Q2
Latest quarterly developments
-20
-15
-10
-5
0
5
10
15
20
20
07
Q1
20
08
Q1
20
09
Q1
20
10
Q1
20
11
Q1
20
12
Q1
20
13
Q1
20
14
Q1
20
15
Q1
20
16
Q1
Italy - Gross financial account items4-quarter moving average
-15
-10
-5
0
5
10
15
20
15
Q2
20
15
Q3
20
15
Q4
20
16
Q1
20
16
Q2
Latest quarterly developments

Analysis of developments in EU capital flows in the global context
October 2016 [42]
by nationality9. The left panel of Figure 10 shows the gross and net cross-border
positions of a euro area aggregate of banks, without consolidating intra-group positions. The right panel tracks quarter to quarter changes in the stocks (quarterly flows)
adjusted for exchange rate changes and breaks, as a share of GDP, a series estimated by the BIS. The net foreign claims of euro-area banks show a moderate
accumulation, developing positively from 2000 until levelling off in late 2008 and into 2009, reaching a peak of just over 15 percent of GDP, before falling to approximately 5
percent in 2011. The sudden upward shift in 2012Q2 is likely due to methodological changes, as this shift which coincides with changes in the reporting requirements for the
BIS international banking statistics and there is a sudden fall in early 2013. None of
these shifts are noticeable in the adjusted flows (right panel), highlighting the role of methodological breaks in the sudden changes in stocks. After these sudden changes, net
foreign claims increased slowly but steadily until our latest observation, 2016Q1. In the post-crisis period, gross foreign claims of euro-area banks declined steadily,
reflecting deleveraging by the euro-area surplus country banks, from a peak of almost 150% of euro area GDP in 2008 to below 100% in 2013-16.
Figure 10: Euro area banks foreign claims based on locational banking statistics
(percent of GDP)
Foreign claims and liabilities
Net flows
Sources: BIS locational banking statistics by nationality, Eurostat and Bruegel calculations; Note: On the reporting country side, Euro area is made up of AT, BE, DE, ES, FR, IT, IE, NL, PT, FI due to data limitations. Flows are presented as four-quarter moving-averages. Latest data available:
2016Q1. In the left panel, gross foreign claims and liabilities are plotted on the left axis, while net claims on the right axis.
9 The locational statistics provide information about the currency and geographical composition of banks' balance sheets. They capture outstanding claims and liabilities of banking offices located in the BIS reporting countries, including positions between related offices. The locational statistics are compiled using principles that are consistent with balance of payments. The availability of a
currency breakdown facilitates the calculation of exchange-rate adjusted changes in amounts outstanding, as an approximation for flows. For additional information, see http://www.bis.org/statistics/about_banking_stats.htm
-30
-20
-10
0
10
20
30
-150
-100
-50
0
50
100
150
20
00-Q
12
001
-Q1
20
02-Q
12
003
-Q1
20
04-Q
12
005
-Q1
20
06-Q
12
007
-Q1
20
08-Q
12
009
-Q1
20
10-Q
12
011
-Q1
20
12-Q
12
013
-Q1
20
14-Q
12
015
-Q1
20
16-Q
1
-2.0
-1.5
-1.0
-0.5
0.0
0.5
1.0
1.5
2.02
001
-Q1
20
02-Q
1
20
03-Q
1
20
04-Q
1
20
05-Q
1
20
06-Q
1
20
07-Q
1
20
08-Q
1
20
09-Q
1
20
10-Q
1
20
11-Q
1
20
12-Q
1
20
13-Q
1
20
14-Q
1
20
15-Q
1
20
16-Q
1

Analysis of developments in EU capital flows in the global context
October 2016 [43]
Figure 11 separates these developments for banks in euro area creditor countries, debtor countries, France and Italy, though we highlight that intra-group positions are not netted
out (similarly to such groupings based on Eurostat statistics), given the absence of bilateral data. Hence gross flows are overestimated when grouping countries together.
These figures clearly show that the main source of the sudden shifts in euro-area net
foreign claims in 2012-2014 is the developments in the creditor countries. A reduction in liabilities is documented simultaneously in 2012 of creditor, debtor countries and Italy,
while claims remained broadly unchanged. On the contrary, liabilities drop precipitously
in euro-area surplus countries and France in 2014. These acute changes are not borne by the adjusted flows series, pointing to the role of breaks.
Still, developments before and after the 2012-13 breaks in stock statistics, as well as the
break-adjusted flow statistics, offer several interesting conclusions. Starting in early 2008, banks in the euro-area creditor countries deleveraged significantly, reflected
by a very significant decline in both foreign claims and liabilities. Net claims also fell from about 30% of group GDP in early 2008 to about 10% by early 2012. However, both the
net stock position (if we disregard the breaks) and break-adjusted flows show that in the
post 2012 period net flows increased somewhat, suggesting that the deleveraging period has ended. The notable observation for 2015 is that net claims on banks have actually
increased, while overall net claims remained broadly unchanged. Therefore it seems cross-border lending to other banks of euro-area creditor country banks increased
around the time the ECB took over the role of bank supervisor in the euro area, despite the increased turbulence on European banking markets, which is also reflected in
increased credit default swap spreads of banks (Figure 12). However, since there were also net outflows from Italy and euro-area debtor country banks in most of 2015,
creditor country banks’ new loans were granted to other parts of the EU or the world.
It is notable that Italian banks received net inflows in the aftermath of the collapse of
Lehman Brothers in 20084-2011Q2. In 2008 Q3-Q4 Italian banks continued accumulating liabilities, but decreased claims (hence the net inflow), and eventually in
2009 they started both decreasing (i.e. there was a lag in liabilities). However, up to 2012, claims have de-cumulated faster than liabilities, yielding inflows on the net. On
the contrary, in 2012-2013 the change in the net flow is clearly driven by cross-border liabilities collapsing (the withdrawal of exposures on Italy).
Debtor country banks also experienced large outflows over 2012-13, the most acute period of the euro-area crisis. It is also interesting to note that net foreign claims of
French banks, Italian banks, and banks of euro-area debtor countries increased in 2014 and early 2015, suggesting increased cross-border activates.

Analysis of developments in EU capital flows in the global context
October 2016 [44]
Figure 11: Foreign claims of euro-area banks based on locational banking
statistics (percent of GDP)
A: Euro-area creditor country banks’ foreign claims
Foreign claims and liabilities Net flows
B: French banks’ foreign claims
Foreign claims and liabilities Net flows
-30
-20
-10
0
10
20
30
-200
-150
-100
-50
0
50
100
150
200
20
00-Q
12
001
-Q1
20
02-Q
12
003
-Q1
20
04-Q
12
005
-Q1
20
06-Q
12
007
-Q1
20
08-Q
12
009
-Q1
20
10-Q
12
011
-Q1
20
12-Q
12
013
-Q1
20
14-Q
12
015
-Q1
20
16-Q
1
-3.0
-2.0
-1.0
0.0
1.0
2.0
3.0
4.0
20
01-Q
1
20
02-Q
1
20
03-Q
1
20
04-Q
1
20
05-Q
1
20
06-Q
1
20
07-Q
1
20
08-Q
1
20
09-Q
1
20
10-Q
1
20
11-Q
1
20
12-Q
1
20
13-Q
1
20
14-Q
1
20
15-Q
1
20
16-Q
1
-20
-15
-10
-5
0
5
10
15
20
-200
-150
-100
-50
0
50
100
150
200
2000
-Q1
2001
-Q1
2002
-Q1
2003
-Q1
2004
-Q1
2005
-Q1
2006
-Q1
2007
-Q1
2008
-Q1
2009
-Q1
2010
-Q1
2011
-Q1
2012
-Q1
2013
-Q1
2014
-Q1
2015
-Q1
2016
-Q1
-2.5
-2.0
-1.5
-1.0
-0.5
0.0
0.5
1.0
1.5
2.0
2.5
2001
-Q1
2002
-Q1
2003
-Q1
2004
-Q1
2005
-Q1
2006
-Q1
2007
-Q1
2008
-Q1
2009
-Q1
2010
-Q1
2011
-Q1
2012
-Q1
2013
-Q1
2014
-Q1
2015
-Q1
2016
-Q1

Analysis of developments in EU capital flows in the global context
October 2016 [45]
C: Italian banks’ foreign claims
Foreign claims and liabilities Net flows
D: Euro-area debtor country banks’ foreign claims
Foreign claims and liabilities Net flows
Source: BIS locational banking statistics; Note: Gross and net stocks (top); net flows (bottom);
Net position (black line) on RHS scale. Creditor countries: AT, BE, DE, NL; Debtor countries: ES, PT; data available from 2000Q1 to 2015Q4, however frequently country level data is missing, so actual series may not extend this far. In the left panel, gross foreign claims and liabilities are
plotted on the left axis, while net claims on the right axis.
-20
-15
-10
-5
0
5
10
15
20
-60
-40
-20
0
20
40
60
2000
-Q1
2001
-Q1
2002
-Q1
2003
-Q1
2004
-Q1
2005
-Q1
2006
-Q1
2007
-Q1
2008
-Q1
2009
-Q1
2010
-Q1
2011
-Q1
2012
-Q1
2013
-Q1
2014
-Q1
2015
-Q1
2016
-Q1
-1.5
-1.0
-0.5
0.0
0.5
1.0
1.5
2001
-Q1
2002
-Q1
2003
-Q1
2004
-Q1
2005
-Q1
2006
-Q1
2007
-Q1
2008
-Q1
2009
-Q1
2010
-Q1
2011
-Q1
2012
-Q1
2013
-Q1
2014
-Q1
2015
-Q1
2016
-Q1
-20
-15
-10
-5
0
5
10
15
20
-80
-60
-40
-20
0
20
40
60
80
20
00-Q
12
001
-Q1
20
02-Q
12
003
-Q1
20
04-Q
12
005
-Q1
20
06-Q
12
007
-Q1
20
08-Q
12
009
-Q1
20
10-Q
12
011
-Q1
20
12-Q
12
013
-Q1
20
14-Q
12
015
-Q1
20
16-Q
1 -3.0
-2.0
-1.0
0.0
1.0
2.0
3.0
4.0
20
01-Q
1
20
02-Q
1
20
03-Q
1
20
04-Q
1
20
05-Q
1
20
06-Q
1
20
07-Q
1
20
08-Q
1
20
09-Q
1
20
10-Q
1
20
11-Q
1
20
12-Q
1
20
13-Q
1
20
14-Q
1
20
15-Q
1
20
16-Q
1

Analysis of developments in EU capital flows in the global context
October 2016 [46]
Figure 12: Credit default swap (CDS) spreads of top financial corporations
Source: Thomson Reuters Datastream Professional and Bruegel computations. Note: average of
the top 5 banks for each country. The following banks are included: Italy: Unicredit, Unione di Banche Italiane, Banco Popolare, Intensa Sanpaolo, Banca Monte dei Paschi di Siena; Spain: Banco Santander, BBVA, Banco Popular Espanol, CaixaBank, Caja de Ahorros y Monte de Piedad de Madrid; France: BNP Paribas, Credit Agricole, Credit Lyonnais, Societe Generale, Natixis;
Germany: Deutsche Bank, Commerzbank, Bayerische Landesbank, Nord LB, Unicredit Bank AG.
To overcome the problem of intra-group double-counting we present in Figure 13 the
consolidated foreign claims for each euro area subgroup, as these statistics are disaggregated by individual counterparty and thus allow us to net out for each country
group.
The right hand panel of Figure 13 with respect to the creditor countries allows us to observe the capital flow reversal experienced by the debtor countries from euro-area
surplus country banks: at its peak in the first quarter of 2008 the euro-area surplus
country bank exposure to the debtor countries reached 19.8 percent of GDP. At the end of 2013, this share stood at just 6.5 percent, and declined further in the last two
quarters of 2014.

Analysis of developments in EU capital flows in the global context
October 2016 [47]
Figure 13: Foreign claims on different regions and euro-area subgroups based
on consolidated banking statistics (percent of GDP)
Creditor countries
Debtor countries
Sources: BIS consolidated banking statistics, OECD and Bruegel calculations. Note: Due to data availability the subgroups are formed as follows: Creditor countries: Austria, Belgium, Finland,
Germany and the Netherlands; Debtor countries: Ireland, Portugal and Spain. Data is available from 1999Q1 to 2015Q4.
As discussed before, the debtor countries have been subject to increased capital outflows
since the beginning of the European debt crisis in 2010. A look at gross flows in single
countries in the post-crisis period shows that both Portugal and Greece turned into net capital exporters by the beginning of 2013 (see Figure 14). In Portugal, gross flows have
remained stable since then, while Greece has experienced another peak in gross flows over 2015.
0.0
20.0
40.0
60.0
80.0
100.0
120.0
140.0
20
00
20
01
20
02
20
03
20
04
20
05
20
06
20
07
20
08
20
09
20
10
20
11
20
12
20
13
20
14
20
15
20
16
Euro area Other non EU advanced Other EU Rest of the world
0.0
5.0
10.0
15.0
20.0
25.0
30.0
35.0
20
00
20
01
20
02
20
03
20
04
20
05
20
06
20
07
20
08
20
09
20
10
20
11
20
12
20
13
20
14
20
15
20
16
FR+IT Debtor Baltics Eastern Europe North
0.0
5.0
10.0
15.0
20.0
25.0
30.0
35.0
40.0
20
00
20
01
20
02
20
03
20
04
20
05
20
06
20
07
20
08
20
09
20
10
20
11
20
12
20
13
20
14
20
15
20
16
Euro area Other non EU advanced Other EU Rest of the world
0.0
2.0
4.0
6.0
8.0
10.0
12.0
14.0
16.0
20
00
20
01
20
02
20
03
20
04
20
05
20
06
20
07
20
08
20
09
20
10
20
11
20
12
20
13
20
14
20
15
20
16
Creditor FR+IT Baltics Eastern Europe North

Analysis of developments in EU capital flows in the global context
October 2016 [48]
Figure 14: Gross financial flows in selected euro-area debtor countries (%
GDP)

Analysis of developments in EU capital flows in the global context
October 2016 [49]
Source: Eurostat and Bruegel calculations. No data available for Ireland.
In terms of composition, Figure 14 shows that the flows in the three euro area groupings were overwhelmingly dominated by portfolio and other investments, two sources of
financing that tend to be relatively more volatile than FDI. Foreign direct investment played a very marginal role, even in the euro area debtor countries. From an economic
standpoint it is important to distinguish within the portfolio category between fixed income instrument such as bonds and equity, whose remuneration is far more sensitive
to the economic developments, through valuation effects. This is what we do in the
appendix at the level of the individual countries. Since the split between debt and equity is not always available, while the aggregate portfolio figure is, we prefer to represent
only the aggregate at the group level to avoid introducing any bias in the results. Within portfolio, debt instrument normally played the major role.
Figure 15, which reports the other three groups, allows a comparison with non-euro
European countries. The magnitude of gross flows in Northern Europe as well as in CEE tends to be smaller than in the euro area. As a share of GDP, the UK, which plays a
special role as financial centre, experienced gross flows of up to 80% of GDP during the
financial crisis. In terms of compositions, the three non-euro groups differ significantly from the euro area. For the UK, the other investment component massively
dominates capital flows, and portfolio investments (especially debt) play a certain role too. Flows to Northern Europe are characterized by portfolio equity and debt, as well as
other investment. In the CEE, FDI constitutes the bulk of inflows before the crisis together with other investments (which includes bank loans). In the post-crisis period,
the magnitudes help up well in Northern Europe, were volatile in the UK and declined dramatically in the CEE (and continue to stay at much lower levels compared to the pre-
crisis period).

Analysis of developments in EU capital flows in the global context
October 2016 [50]
In the case of banks’ foreign claims for Denmark, Sweden and the United Kingdom, the stock accumulation on the build-up to the crisis was much steeper than in
euro-area banks, but the deleveraging process has been less dramatic than for euro-area banks.
Figure 15: Gross financial flows in northern Europe, the UK and central and Eastern Europe (percent of GDP)

Analysis of developments in EU capital flows in the global context
October 2016 [51]
Source: Eurostat and Bruegel calculations.
Figure 16 shows the respective claims of banks for the three countries in question.

Analysis of developments in EU capital flows in the global context
October 2016 [52]
Figure 16: Northern and UK bank foreign claims based on locational banking
statistics (percent of GDP)
A: Danish and Swedish (North) banks
Foreign claims and liabilities Net flows
B: British banks
Foreign claims and liabilities Net flows
Sources: BIS locational banking statistics.
-40
-30
-20
-10
0
10
20
30
40
-200
-150
-100
-50
0
50
100
150
200
20
00-Q
12
001
-Q1
20
02-Q
12
003
-Q1
20
04-Q
12
005
-Q1
20
06-Q
12
007
-Q1
20
08-Q
12
009
-Q1
20
10-Q
12
011
-Q1
20
12-Q
12
013
-Q1
20
14-Q
12
015
-Q1
20
16-Q
1
-4.0
-3.0
-2.0
-1.0
0.0
1.0
2.0
20
01-Q
1
20
02-Q
1
20
03-Q
1
20
04-Q
1
20
05-Q
1
20
06-Q
1
20
07-Q
1
20
08-Q
1
20
09-Q
1
20
10-Q
1
20
11-Q
1
20
12-Q
1
20
13-Q
1
20
14-Q
1
20
15-Q
1
20
16-Q
1
-20
-15
-10
-5
0
5
10
15
20
-200
-150
-100
-50
0
50
100
150
200
2000
-Q1
2001
-Q1
2002
-Q1
2003
-Q1
2004
-Q1
2005
-Q1
2006
-Q1
2007
-Q1
2008
-Q1
2009
-Q1
2010
-Q1
2011
-Q1
2012
-Q1
2013
-Q1
2014
-Q1
2015
-Q1
2016
-Q1
-4.0
-3.0
-2.0
-1.0
0.0
1.0
2.0
3.0
4.0
2001
-Q1
2002
-Q1
2003
-Q1
2004
-Q1
2005
-Q1
2006
-Q1
2007
-Q1
2008
-Q1
2009
-Q1
2010
-Q1
2011
-Q1
2012
-Q1
2013
-Q1
2014
-Q1
2015
-Q1
2016
-Q1

Analysis of developments in EU capital flows in the global context
October 2016 [53]
3.2 Net financial flows
Figure 17 and Figure 19 show the net position of the groups’ financial account according to the underlying components, offering a simpler picture of the composition of
countries’ and groups’ net balances vis-à-vis the rest of the world. As recalled previously, the net financial account is an important variable to look at in order to
understand countries’ external borrowing requirements. The net flows for each of the
financial account components can give an indication of where potential financing problems could come from.
Figure 17 shows that the persistent net financial inflows experienced by the euro area
debtor countries before the crisis were largely accounted for by portfolio and other investment. From 2003 till 2008, portfolio net financial inflows were the most important
component of the financial surplus, but they massively contracted in 2008 and became largely negative between summer 2011 and summer 2012. This captures the
intensifying of the euro crisis, when foreign investors increasingly off-loaded debt issued
by countries in the euro-area debtor countries. Interestingly, the effect of the disappearing (or negative) portfolio flows on the total net financial account appears to be
neutralised by other investment flows of an opposite sign. This captures the flows related to financial assistance and to the ECB’s liquidity provision, which provided a cushion
against the withdrawal of private external funds. Over 2014, net outflows stabilized. The euro area creditor countries report persistent net financial outflows, mostly driven by
other investment and to a lesser extent by FDI outflows. Portfolio investment instead shows net inflows for the euro area creditor countries, most likely driven by the presence
of Germany and international appeal of the Bund during crisis times. The latest
developments show a stabilization of net outflows over 2014, as rising net portfolio outflows are substituting receding other investment outflows. The euro area centre has
been experiencing rising net outflows over 2014, which intensified by the end of the year on the back of increasing net portfolio investment outflows, and stayed at a higher level
thereafter.
This outflow of capital observed in the euro area may have impacted risk premia in the corporate bond markets. Figure 18 shows a compression of corporate bond spreads after
the ECB’s OMT announcement in July 2012. The downward trend continued throughout
2013 and 2014, before picking up in 2015, on the back of deteriorating economic outlooks (ECB, 2016). Lately, corporate bond spreads have narrowed as a result of
better macroeconomic data and the expansion of the ECB’s purchases to euro-denominated bonds issued by non-bank corporations in March 2016. In this context, the
impact of CMU on risk premia will materialize only in the long term. As Wolff and Véron (2015) highlight, CMU cannot be a short-term cyclical instrument to replace subdued
bank lending, because financial ecosystems change slowly. Shifting financial intermediation towards capital markets and increasing cross-border integration will
require action on multiple fronts, including increasing the transparency, reliability and
comparability of information and addressing financial stability concerns. Some quick wins might be available but CMU’s real potential can only be achieved with a long-term
structural policy agenda.

Analysis of developments in EU capital flows in the global context
October 2016 [54]
Figure 17: Net financial flows in the three euro-area groups (percent of GDP)

Analysis of developments in EU capital flows in the global context
October 2016 [55]
Source: Eurostat and Bruegel calculations

Analysis of developments in EU capital flows in the global context
October 2016 [56]
Figure 18: Risk premia in the euro area and the United States
Source: BofA Merrill Lynch, BofA Merrill Lynch US High Yield Option-Adjusted Spread, FRED. Note: The BofA High Yield option-adjusted spread is defined as percentage point difference in yields between high yields bonds and Treasury bonds. Bonds rated equivalent to BB+ and below by
Standard and Poor’s and Fitch, and Ba1 by Moody’s are classified as high-yield bonds, while bonds above this category are traded as investment grade bonds.
The north of Europe has been a net exporter of capital up until the end of 2007
(reflecting current account surpluses), a trend which reverted in 2008-2009 amid increasing inflows of capitals leaving the euro area in search of safety. This was
particularly pressing for Denmark that eventually adopted monetary policy measures such as the negative rate on central banks deposits to curb the inflows it was undergoing
(Hüttl, 2014). Over the latest period, net other investment outflows are decreasing in importance, while net portfolio investment turned from in- to outflows. The UK (Figure
19) experienced spiking inflows in 2007-2008, mostly in terms of portfolios, which were
then abruptly reversed in 2009. Portfolio (and other) flows then disappeared for more than one year, finally coming back with the opposite sign. In 2014, portfolio investment
inflows intensified; a trend which was reversed by 2015Q1.

Analysis of developments in EU capital flows in the global context
October 2016 [57]
Figure 19: Net financial flows in the three euro-area groups (percent of GDP)

Analysis of developments in EU capital flows in the global context
October 2016 [58]
Source: Eurostat and Bruegel calculations.
Central Eastern Europe countries stand out as a different world. They experienced prolonged inflows of mainly direct investment, with capital moving ‘downhill’, mostly
from rich EU15 countries to poorer CEE countries as highlighted by Becker et al. (2010).
Parallel to this development, credit to the private sector increased rapidly before the crisis in the region too, fuelling a credit boom in the three Baltic States, Bulgaria and
Romania (Darvas and Szapáry, 2008). By the end of 2011, other investment started outflowing, reflecting a massive withdrawal of banking funds from the region. CEE turned
into a net exporter by 2013Q1, a trend which continued throughout the latest period.
The comparison with what happened in the euro area debtor countries (Figure 20) is striking. The euro area debtor countries accumulated a significantly larger financial
account surplus before the crisis (almost 15 percent of the total group GDP), which then
dropped during the crisis, though remained positive until late 2012. This was made possible by the provision of financial assistance and especially by ECB liquidity, which
allowed a smoother adjustment on the external position than that which occurred in CEE countries, especially in the Baltics (Darvas, 2012a). Since 2013, the net financial account
in the CEE stabilized somewhat, as other investment outflows stabilized, while the debtor countries continued to experience massive capital outflows. By the end of 2014, both
regions saw falling net capital outflows, a trend which continued through 2015.

Analysis of developments in EU capital flows in the global context
October 2016 [59]
Figure 20: Net financial account of the euro-area debtor countries and Central
and Eastern Europe (percent of GDP)
Source: Eurostat and Bruegel calculations. Note: the EA debtor countries include GR, PT, ES; CEE includes CZ, LV, LT,
HU, PL, RO; SI and SK; Data is available from 1999Q1 to 2016Q2.
A major issue that arises is the composition of economic sectors in which debt-type
capital inflows were actually unutilised in the euro-area debtor countries and in the new member states of the EU. For a further discussion of this topic and a survey of the
literature, please refer to our last year’s report (Darvas et al, 2015).
3.3 Net international investment positions (NIIPs)
Turning to an analysis of the stock and valuation effects in the euro area and beyond, the following emerges:
The prolonged period of current (and financial) account imbalances in the pre-crisis
period resulted in the accumulation of large stock of external assets and liabilities for all
the euro area groups as well as the CEE countries. The UK had a negative NIIP position of around 36 percent of GDP until 2010, but this has been considerably reduced
over the last three years. Northern Europe moved closer to a balanced position by 2013. Central Eastern European countries stand out for the large negative NIIP,
which has surpassed 80 percent of GDP in 2009 and has remained constant at that level since then.
In terms of composition, the euro area creditor countries surplus is mostly
accounted for by other investment (the most important part of it is cross-border bank
loans) and direct investment. Portfolio equity and debt instead contributed negatively, reflecting the attractiveness of the euro area capital markets for foreign investors, which
however have been declining since 2013. In the euro area debtor countries, accumulated portfolio investment liabilities have been declining since the start of the European debt
crisis, and turned into assets by the end of 2012, while other investment liabilities grew in importance, and make up nearly all of the euro area debtor countries’ negative NIIP

Analysis of developments in EU capital flows in the global context
October 2016 [60]
now. France and Italy also have a negative position but here the most important
component is portfolio debt liabilities outstanding, followed by other investment liabilities, which have decreased their importance over the last 4 years, reflecting a
deleveraging process.
Figure 21: Net international investment position the three euro-area groups
(percent of GDP)

Analysis of developments in EU capital flows in the global context
October 2016 [61]

Analysis of developments in EU capital flows in the global context
October 2016 [62]
Source: Eurostat and Bruegel calculations.

Analysis of developments in EU capital flows in the global context
October 2016 [63]
Concerning the other groups of countries (Figure 22), the North of Europe’s external negative NIIP is driven by portfolio debt, whereas the contribution of other investment
stocks has been shrinking over time, and direct investments and portfolio equity investments are positive. The UK was in deficit in terms of all NIIP components apart
from direct investment, which has recently almost rebalanced through a reduction of both assets and liabilities, suggesting a sizeable cross-border deleveraging. CEE exhibits
net liabilities in all instruments and more than one-half of their NIIP liabilities are direct investment, while portfolio debt and other investment (including bank loans) share the
remaining part. It is noteworthy that their net other investment liabilities decreased from
about 23 percent of GDP in 2009Q4 to about 14 percent of GDP by 2015Q1, suggesting that foreign banks decreased significantly their exposure to the region.
Figure 22: Net international investment position of EU north, the UK and central
and eastern Europe (percent of GDP)

Analysis of developments in EU capital flows in the global context
October 2016 [64]
Source: Eurostat and Bruegel calculations.

Analysis of developments in EU capital flows in the global context
October 2016 [65]
3.4 Cyprus, Greece and Iceland – capital flows and economic
performances in times of capital controls
The imposition of capital controls, which is possible only in exceptional circumstances
under EU law10, makes Cyprus and Greece highly interesting cases for a bilateral analysis of their capital flows. Last year’s report (Darvas et al, 2015) gave already a detailed
description of the factors leading to the imposition of capital flows in those countries. This year, first we focus on bilateral capital flows to and from the respective countries,
extending our analysis to Iceland. Second, we introduce a novel analysis of the impact of
capital controls on the economic performance of Cyprus, Greece and Iceland.
3.4.1 Analysis of capital flows in times of capital controls
We focus on the three EEA countries that introduced capital controls: Cyprus (in 2013),
Greece (in 2015) and Iceland (in 2008). In the cases of Cyprus and Iceland, quite some time has passed since the introduction of controls and both countries have left their
assistance programmes, which allow a proper analysis. On the other hand, Greece has
introduced capital controls only in summer 2015, a few months before its third financial assistance programme. This programme is still in place and a rather short time has
passed since then. Moreover, Greek economic developments are influenced by the various impacts resulting from its two earlier and unsuccessful financial assistance
programmes, which were agreed in 2010 and 2012, respectively, and therefore the experience with the Greek capital controls are rather limited. Still, for completeness we
include Greece in the analysis.
A bilateral analysis of portfolio and other investment (banking) flows allows drawing an
even more nuanced picture in term of exposure.
The net bilateral composition of portfolio investment of the three countries ( Figure 23) reveals that Greece and Iceland experienced major inflows, while Cyprus
experienced major outflows in the period before the outbreak of their respective crises. During that period, the euro area, and especially France and Germany increased their
portfolio holdings vis-a-vis Greece. These flows contracted significantly with the outbreak of the Greek sovereign debt crisis in 2012, and stayed low thereafter. Indeed,
net portfolio investment turned from liabilities to assets by end 2012, as non-residents
moved out of Greek portfolio holdings. With the imposition of capital controls in 2015, total net portfolio investment contracted somewhat in June 2015, but returned to Dec
2014 levels by end 2015. Iceland’s net bilateral portfolio investment position reveals a similar picture. While the Euro area, as well as the United Kingdom invested heavily in
Icelandic securities in the run-up of the crisis, these flows subsided with the beginning of the financial turmoil in 2008. Capital controls were imposed in November of the same
year. Inflows decreased thereafter, and stabilized at very low levels since Dec 2011. By Dec 2015, non-residents started increasing again their exposures vis-a-vis Iceland, on
the back of a strong economic recovery. Cyprus recorded an accumulation of portfolio
10 Article 63 of the Treaty on the Functioning of the European Union (TFEU), which is the main article on the freedom of capital movements, states that “Within the framework of the provisions
set out in this Chapter, all restrictions on the movement of capital [all restrictions on payments] between Member States and between Member States and third countries shall be prohibited.” However, there are certain exceptions in the TFEU, which are summaries at this webpage:
http://ec.europa.eu/finance/capital/framework/treaty/index_en.htm Moreover, there are also exceptions established by the case law of the Court of Justice of the European Union, based on exceptions stipulated in the Treaty, related to “overriding requirements of the general interest”. In the case of Cyprus, the European Commission concluded that “In current circumstances, the
stability of financial markets and the banking system in Cyprus constitutes a matter of overriding public interest and public policy justifying the imposition of temporary restrictions on capital movements.”, see at http://europa.eu/rapid/press-release_IP-13-298_en.htm .

Analysis of developments in EU capital flows in the global context
October 2016 [66]
assets vis-à-vis Russia, United Kingdom and others in the run-up of the crisis. But
especially during 2008-2011 resident investors purchased significant amounts of British and Greek securities. Flows to Greece started to diminish when the Greek crisis hit in
2010. In June 2012, a haircut of 53.5% was applied to the nominal value of Greek government bond holdings, which was even larger in net present value terms. This,
together with the disposal of Cypriot banks’ branches in Greece in 2013 reduced the financial links with Greece significantly. With the imposition of capital controls in March
2013, total net outflows somewhat diminished. Capital controls were abolished in April 2015, which coincided with a reverse of net portfolio flows, from liabilities to assets –
over 2015, non-residents mainly from Luxembourg seem to be investing again in Cypriot
securities.
Figure 23: Net portfolio investment positions of Greece, Cyprus and Iceland
Panel A: Greece
(Billion USD)
Panel B: Cyprus (Billion USD)
-250,00
-200,00
-150,00
-100,00
-50,00
0,00
50,00
100,00
150,00
DEC. 2001
DEC. 2002
DEC. 2003
DEC. 2004
DEC. 2005
DEC. 2006
DEC. 2007
DEC. 2008
DEC. 2009
DEC. 2010
DEC. 2011
DEC. 2012
JUN. 2013
DEC. 2013
JUN. 2014
DEC. 2014
JUN. 2015
DEC. 2015
Euro Area (excl. DE FR CY LU) United Kingdom Germany
France Cyprus Luxembourg
Other Total

Analysis of developments in EU capital flows in the global context
October 2016 [67]
Panel C: Iceland
(Billion USD)
Source: IMF Coordinated Portfolio Investment Survey (CPIS); Note: Latest data available:
December 2015. Red area indicates the duration of capital controls.
-20,0
-10,0
0,0
10,0
20,0
30,0
40,0
50,0
DEC. 2001
DEC. 2002
DEC. 2003
DEC. 2004
DEC. 2005
DEC. 2006
DEC. 2007
DEC. 2008
DEC. 2009
DEC. 2010
DEC. 2011
DEC. 2012
JUN. 2013
DEC. 2013
JUN. 2014
DEC. 2014
JUN. 2015
DEC. 2015
Euro Area (excl. Lux) Russian Federation United StatesLuxembourg Greece United KingdomOther Total
-30,00
-25,00
-20,00
-15,00
-10,00
-5,00
0,00
5,00
10,00
DEC. 2001
DEC. 2002
DEC. 2003
DEC. 2004
DEC. 2005
DEC. 2006
DEC. 2007
DEC. 2008
DEC. 2009
DEC. 2010
DEC. 2011
DEC. 2012
JUN. 2013
DEC. 2013
JUN. 2014
DEC. 2014
JUN. 2015
DEC. 2015
United Kingdom Euro Area (excl. IE LU) Ireland Luxembourg Other Total

Analysis of developments in EU capital flows in the global context
October 2016 [68]
Other investment banking flows are captured by the BIS consolidated banking
statistics exhibit a significant exposure of Euro area banks to Greece before the start of the crisis (Figure 24 Panel A). With the start of the financial crisis, and the sub-
sequent Greek crisis in 2010, Greece was subject to substantial cross-border deleveraging from Euro area, as well as from other reporting countries. The decline
stabilized turned to a moderate increases in 2013, before a new deleveraging started in early 2015, on the back of renewed tensions in the Greek negotiations process between
the new Syriza-led government and Greece’s official creditors. However, after the third financial assistance programme agreed in summer 2015, Syriza was re-elected to power
in autumn 2015 and the third financial assistance programme started to being
implemented, a recovery in banking claims on Greece started in late 2015, which continued in early 2016. This development suggests improvements in the confidence in
the Greek economy. In terms of banking exposure to Cyprus, Panel B in Figure 24 reports that Greece, the rest of the euro are and other reporting countries increased
their exposure until the start of the financial crisis in 2008, contrary to Greece no major drop in exposure can be observed with the start of the crisis. Greek banks continued to
increase their exposure slowly over the whole period, while the rest of the euro area steadily decreased it. The events unfolding during winter/spring 2013 accelerated this
trend, and led to a major drop of banking claims on Cyprus. Relative stabilization of
cross-border deleveraging that can be observed throughout 2014. Interestingly, when the capital controls were lifted in April 2015, banking claims on Cyprus increased again
and stabilize over the rest of 2015 on significantly higher levels. Panel C in Figure 24 shows banking exposure to Iceland, which was reduced quite significantly since the
financial crisis in 2008 and the imposition of capital controls, and stayed low thereafter.
Figure 24: Net Foreign Banking exposures to Greece, Cyprus and Iceland
Panel A: claims on Greece (in percent of GDP)
Panel B: claims on Cyprus (in percent of GDP)

Analysis of developments in EU capital flows in the global context
October 2016 [69]
Panel B: claims on Iceland
(in percent of GDP)
Source: BIS, Consolidated Banking Statistics, ultimate risk basis. GDP: Eurostat.
Overall, the imposition of capital controls in both Cyprus and Iceland led to a moderation of both portfolio and banking flows. Interestingly, as capital controls were lifted in April
2015 in Cyprus, a major increase in foreign bank claims could be observed, as investment could flow again into the country without restrictions. As highlighted in DG
ECFIN (2016), Cyprus has exited successfully the financial assistance programme, stabilizing its banking sector. However, investment is still depressed, as high corporate
debt is weighting on it, and the share of NPLs needs still to be addressed.
Figure 25 shows that the share of NPLs increased from 18% at the end of 2012 to 38%
by the end of 2013 and even further to 49% by the end of 2015. Unfortunately, documents of the financial assistance programme issue at the inception of the
programme did not include NPL projections and therefore we do not know whether such

Analysis of developments in EU capital flows in the global context
October 2016 [70]
a large increase was foreseen or not. In any case, the large increase in NPLs may be
assessed two ways: if there are debtors who would be able to pay for their loans, but deliberately do
not pay, then the increase in NPLs may have boosted consumption and thereby
economic recovery;
but if the increase in NPLs was not deliberate from the side of debtors, but reflect
their difficult financial situation, then the increasing NPLs may in fact be
associated with weaker economic developments.
Regarding Iceland, the share NPLs suddenly increased to 41% by 2010, after which the
ratio has been steadily falling (Figure 25), suggesting that the balance sheets of both
banks and private borrowers are improving. IMF (2015) points out that re-integrating the Icelandic financial sector with global financial markets remains a challenge, linked to
the lifting of capital controls. In April 2016, Iceland took a large step toward that direction, by substantially loosening restrictions on in- and outflows. For Greece, no real
conclusions can be drawn on the impacts of capital controls on financial flows and NPLs, as the period in consideration is too short. We only note that NPLs were already very
high by the inception of the third financial assistance programme in 2015.
Figure 25: The share of non-performing loans in some financial assistance
countries
Source: IMF Financial Soundness Indicators, available at: http://data.imf.org/?sk=9F855EAE-
C765-405E-9C9A-A9DC2C1FEE47&sId=1390030341854 and Central Bank of Iceland Financial Stability report http://www.cb.is/publications/publications/publication/2016/04/20/Financial-Stability-2016-1-published/ . Note: quarterly data is not available for Ireland, Portugal and Romania in 2008 and 2009; Latvia in
2008, 2009, 2010; Hungary in 2008; and Iceland for all years: for these years, the corresponding annual data is indicated in each quarter.
0
10
20
30
40
50
Q1
20
08
Q1
20
09
Q1
20
10
Q1
20
11
Q1
20
12
Q1
20
13
Q1
20
14
Q1
20
15
Q1
20
16
Greece Ireland
Cyprus Iceland
0
10
20
30
40
50
Q1
20
08
Q1
20
09
Q1
20
10
Q1
20
11
Q1
20
12
Q1
20
13
Q1
20
14
Q1
20
15
Q1
20
16
Portugal Hungary
Latvia Romania

Analysis of developments in EU capital flows in the global context
October 2016 [71]
3.4.2 The impact of capital controls on economic performance in Cyprus, Greece
and Iceland
It is difficult to assess the impact of capital controls on macroeconomic developments, because such a task would require a sufficiently comprehensive macro-financial model in
which a counterfactual ‘no capital control’ scenario could be simulated. However, it is worthwhile to compare economic developments in countries that introduced capital
controls with those which have not, even if such a comparison has limitations.
We compare the Iceland (where capital controls were introduced in 2008), Cyprus
(2013) and Greece (2015) to the following group of countries which also received financial assistance in 2008-2011 (in brackets we indicated the year of the financial
assistance programme)11: EU6. Six European Union countries, which have not introduced capital controls:
Greece (2010), Hungary (2008), Ireland (2010), Latvia (2009), Portugal (2011)
and Romania (2009).
NEU10. Ten non-EU countries, in which there remained a high level of capital
account openness as measured by the Chinn-Ito index12: Armenia (2009),
Dominican Republic (2010), El Salvador (2009), Georgia (2008), Guatemala
(2009), Jamaica (2010), Mongolia (2009), Serbia (2009), Seychelles (2008) and
Sri Lanka (2009).
NEU6. Six non-EU countries, in which there is a low level of capital account
openness and/or tight new controls were introduced: Belarus (2009), Bosnia and
Herzegovina (2009), Honduras (2008), Moldova (2010), Pakistan (2008) and
Ukraine (2008).
Since there are problems with all possible ways to compare the actual outcomes of
countries that had different starting positions, faced different shocks and agreed to their financial assistance programmes at different points in time, we report three indicators.
Indicator 1: Actual developments
We start with comparing actual GDP and unemployment developments.
However, comparison of actual developments is distorted by various factors, such
as different initial conditions within the country itself and different global
economic environment. The different type and size of the economic/financial
shocks that hit the countries at inception of the financial assistance programme
should also have had differentiated impacts on the economy. For example, one
may argue that shock in Cyprus in 2013 was huge, given that the size of the
financial system relative to GDP was extremely large. But at the same time
11 Our data source for actual GDP and unemployment rate data is from the April 2016 dataset of the IMF’s World Economic Outlook. For Greece, where capital controls were introduced in 2015, we
use the June 2016 OECD forecasts in order to be able to report the expected developments in 2016. The sources of programme assumptions are the IMF country reports issued at the inception of the financial assistance programme. The IMF does not participate in the third financial
assistance programme for Greece and thereby we use the European Commission’s brief debt sustainability analysis, which includes information on planned GDP developments (but no information is available on planned unemployment developments), which is available here: http://ec.europa.eu/economy_finance/assistance_eu_ms/greek_loan_facility/pdf/debt_sustainabili
ty_analysis_en.pdf . 12 We used the updated dataset of Chinn and Ito (2006) to separate ’no capital control’ and ’capital control’ countries. The dataset is available at: http://web.pdx.edu/~ito/Chinn-Ito_website.htm

Analysis of developments in EU capital flows in the global context
October 2016 [72]
European and global economic developments improved compared to earlier
financial assistance episodes in 2008-09.
Keeping these problems in mind, Figure 5 shows that GDP developments in Cyprus were broadly similar to developments in EU6, while Iceland and Greece (under its third
assistance programme) did much better. However, GDP developments of non-EU countries were extraordinary (at least on average) compared to EU financial assistance
countries: there was no recession in capital control countries and only a minor recession in non-control countries, while both groups had a GDP level of about 10% above the pre-
assistance level by three years after the inception of the assistance programme. Clearly, crises outcomes in the EU/EEA were much worse. Changes in the unemployment rate
reveal a broadly similar picture.
Figure 26: Actual real GDP and unemployment rate developments in financial
assistance countries
Real GDP level (year before the programme = 100)
Unemployment rate (percent)
Source: Bruegel calculation based on the April 2016 World Economic Outlook of the IMF. Note: t in the horizontal axis indicates the starting year of the financial assistance programme. See information about the country groups in the main text.
Indicator 2: Home GDP developments relative to GDP developments of the rest of the world
For this indicator we calculate the weighted-average GDP of 67 main trading
partners, deriving separate weights for each country depending on the
geographical distribution of their foreign trade.
This indicator considers the external environment, which is especially important
for small open economies.
A key weakness of this comparison is that the size of the banking system relative
to GDP was much higher in Cyprus and Iceland than in other financial assistance
90
95
100
105
110
115
t-1 t t+1 t+2 t+3 t+4
Cyprus (capital controls)
Iceland (capital controls)
Greece 3 (capital controls)
6 EU countries (no capital controls)
10 Non-EU countries (no capital controls)
6 Non-EU countries (capital controls)
0
5
10
15
20
25
30
t-1 t t+1 t+2 t+3 t+4
Cyprus (capital controls)
Iceland (capital controls)
Greece 3 (capital controls)
6 EU countries (no capital controls)
9 Non-EU countries (no capital controls)
6 Non-EU countries (capital controls)

Analysis of developments in EU capital flows in the global context
October 2016 [73]
countries, and both countries suffered from a systemic banking crisis. Thereby,
the negative impact of the banking crisis on the economy may have been larger
than in other countries that have not suffered from a systemic crisis of an
oversized financial system.
Figure 27 shows that GDP of Cyprus developed slightly worse than the GDP of EU6
countries relative to trading partners’ GDP, yet as we argued above, the shock in Cyprus
may have been larger than in other countries. On the other hand, Iceland, and so far the third financial assistance programme of Greece, outperforms EU6 countries. This
indicator also shows that non-EU countries did particularly well in comparison to EEA countries.
Figure 27: Real GDP level: gap relative to GDP of trading partners in financial
assistance countries (year before the programme = 100)
Source: Bruegel calculation based on the April 2016 version of the IMF’s World Economic Outlook (GDP), while we derived the weighted based on Bayoumi, Lee and Jaewoo (2006). Note: t in the
horizontal axis indicates the starting year of the financial assistance programme. See information about the country groups in the main text. For each country, we calculated the weighted-average GDP of 67 main trading partners, deriving weights from the geographical distribution of their
foreign trade on the basis of the matrix derived by Bayoumi, Lee and Jaewoo (2006).
Indicator 3: GDP and unemployment developments relative to the assumptions
made at the inception of the financial assistance programme13
13 Programme assumptions were collected from the IMF country reports which accompanied the decisions to grant financial assistance. The third Greek programme is not financed by the IMF and therefore there was no IMF country report: for this programme, the European documents were
highly non-transparent as regards the assumptions. The published brief debt sustainability analysis (http://ec.europa.eu/economy_finance/assistance_eu_ms/greek_loan_facility/pdf/debt_sustainability_analysis_en.pdf ) included GDP growth assumptions from 2015 to 2018.
85
90
95
100
105
110
t-1 t t+1 t+2 t+3 t+4
Cyprus (capital controls)
Iceland (capital controls)
Greece 3 (capital controls)
6 EU countries (no capital controls)
10 Non-EU countries (no capital controls)
6 Non-EU countries (capital controls)

Analysis of developments in EU capital flows in the global context
October 2016 [74]
This indicator considers country-specific circumstances and therefore should be
superior to the two simpler indicators discussed above.
However, a key problem with this indicator is that it must have been difficult to
assess the impact of capital controls at the inception of financial assistance
programmes, which may have led to more pessimistic projections for countries in
which capital controls were introduced than for countries in which capital controls
were not introduced. Moreover, by realising that most assumptions made in the
2008-10 financial assistance programmes were too-optimistic, the 2013 Cypriot
programme may have been calibrated on the basis of more pessimistic
assumptions. Yet this latter problem does not arise for Iceland, which was among
the first countries in 2008 to apply for financial assistance.
It is notable on Figure 28 that as regards GDP, all three EEA capital control countries
outperformed their programme assumptions (in the case of Iceland, only up to 3 years after the programme), while other countries, including non-EU countries,
underperformed on average. As regards unemployment, in Cyprus the actual unemployment rate became smaller than what was assumed in the programme (thereby
the values are negative). For Iceland, there seems to be an upward revision in the unemployment rate, because even in year t-1 (i.e. 2007), the unemployment rate was
more than 1 percentage point higher than in the programme assumption. Yet even with this upward revision, Iceland performed better than the EU6 (excluding Hungary)
relative to programme assumptions14.
14 Unfortunately, unemployment projections are not available for the third Greek financial assistance programme, nor for most non-EU countries.

Analysis of developments in EU capital flows in the global context
October 2016 [75]
Figure 28: Real GDP and unemployment rate in financial assistance countries:
gap between actual developments and programme assumptions
Real GDP level (year before the
programme = 100)
Unemployment rate (percentage
points)
Source: Bruegel calculation based on the April 2016 version of the IMF’s World Economic Outlook
and IMF programme documents published at the inception of the financial assistance programmes. Note: t in the horizontal axis indicates the starting year of the financial assistance programme. See information about the country groups in the main text. The group of 5 EU countries on the right panel does include Hungary, because unemployment rate projection was available only up to 2009.
The third Greek programme is not included in the right panel, because no public document included information on the expected unemployment rate developments.
Overall, while we do not have a sufficiently comprehensive macro-financial model to assess the impacts of capital controls and all three comparisons we conducted have
certain drawbacks, our results suggest that the introduction of capital controls in Iceland
(2008), Cyprus (2013) and Greece (2015) was not associated with unfavourable economic performance relative to the other EU countries. And in the case of our most
preferred indicator, developments relative to programme assumptions, all three capital control EEA countries outperformed, while other financial assistance countries (both
inside and outside the EU) significantly underperformed.
90
95
100
105
t-1 t t+1 t+2 t+3 t+4Cyprus (capital controls)
Iceland (capital controls)
Greece 3 (capital controls)
6 EU countries (no capital controls)
10 Non-EU countries (no capital controls)
6 Non-EU countries (capital controls)
-4
-3
-2
-1
0
1
2
3
4
5
t-1 t t+1 t+2 t+3 t+4
Cyprus (capital controls)
Iceland (capital controls)
5 EU countries (no capital controls)

Analysis of developments in EU capital flows in the global context
October 2016 [76]
3.5 Annex to Chapter 3: country-specific data
Figure 29: Financial account and net international investment position of EU countries
-30
-20
-10
0
10
20
30
40
20
06Q
1
20
07Q
1
20
08Q
1
20
09Q
1
20
10Q
1
20
11Q
1
20
12Q
1
20
13Q
1
20
14Q
1
20
15Q
1
20
16Q
1
Austria - Financial Account - net components (% of GDP)
Direct Investment Other Investment
Portfolio - debt Portfolio - equity
Financial account
-50
-40
-30
-20
-10
0
10
20
30
40
50
20
08Q
1
20
09Q
1
20
10Q
1
20
11Q
1
20
12Q
1
20
13Q
1
20
14Q
1
20
15Q
1
20
16Q
1
Austria - Net International Investment Position net components (% of GDP)
Direct Investment Other Investment
Portfolio - debt Portfolio - equity
NIIP
-50
-40
-30
-20
-10
0
10
20
30
40
20
06Q
1
20
07Q
1
20
08Q
1
20
09Q
1
20
10Q
1
20
11Q
1
20
12Q
1
20
13Q
1
20
14Q
1
20
15Q
1
20
16Q
1
Belgium - Financial Account - net components (% of GDP)
Direct Investment Other Investment
Portfolio - debt Portfolio - equity
Financial account
-30
-20
-10
0
10
20
30
40
50
60
70
20
08Q
1
20
09Q
1
20
10Q
1
20
11Q
1
20
12Q
1
20
13Q
1
20
14Q
1
20
15Q
1
20
16Q
1
Belgium - Net International Investment Position net components (% of GDP)
Direct Investment Other Investment
Portfolio - debt Portfolio - equity
NIIP

Analysis of developments in EU capital flows in the global context
October 2016 [77]
-70
-60
-50
-40
-30
-20
-10
0
10
20
20
06Q
1
20
07Q
1
20
08Q
1
20
09Q
1
20
10Q
1
20
11Q
1
20
12Q
1
20
13Q
1
20
14Q
1
20
15Q
1
20
16Q
1
Bulgaria - Financial Account - net components (% of GDP)
Direct Investment Other Investment
Portfolio - debt Portfolio - equity
Financial account
-120
-100
-80
-60
-40
-20
0
20
20
08Q
1
20
09Q
1
20
10Q
1
20
11Q
1
20
12Q
1
20
13Q
1
20
14Q
1
20
15Q
1
20
16Q
1
Bulgaria - Net International Investment Position net components (% of GDP)
Direct Investment Other Investment
Portfolio - debt Portfolio - equity
NIIP
-300
-200
-100
0
100
200
300
20
06Q
1
20
07Q
1
20
08Q
1
20
09Q
1
20
10Q
1
20
11Q
1
20
12Q
1
20
13Q
1
20
14Q
1
20
15Q
1
20
16Q
1
Cyprus - Financial Account - net components (% of GDP)
Direct Investment Other Investment
Portfolio - debt Portfolio - equity
Financial account
-400
-300
-200
-100
0
100
200
300
20
08Q
1
20
09Q
1
20
10Q
1
20
11Q
1
20
12Q
1
20
13Q
1
20
14Q
1
20
15Q
1
20
16Q
1
Cyprus - Net International Investment Position net components (% of GDP)
Direct Investment Other Investment
Portfolio - debt Portfolio - equity
NIIP

Analysis of developments in EU capital flows in the global context
October 2016 [78]
-20
-15
-10
-5
0
5
10
15
20
06Q
1
20
07Q
1
20
08Q
1
20
09Q
1
20
10Q
1
20
11Q
1
20
12Q
1
20
13Q
1
20
14Q
1
20
15Q
1
20
16Q
1
Czech Republic - Financial Account - net components (% of GDP)
Direct Investment Other Investment
Portfolio - debt Portfolio - equity
Financial account
-70
-60
-50
-40
-30
-20
-10
0
10
20
08Q
1
20
09Q
1
20
10Q
1
20
11Q
1
20
12Q
1
20
13Q
1
20
14Q
1
20
15Q
1
20
16Q
1
Czech Republic - Net International Investment Position net components (%
of GDP)
Direct Investment Other Investment
Portfolio - debt Portfolio - equity
NIIP
-80
-60
-40
-20
0
20
40
60
20
06Q
1
20
07Q
1
20
08Q
1
20
09Q
1
20
10Q
1
20
11Q
1
20
12Q
1
20
13Q
1
20
14Q
1
20
15Q
1
20
16Q
1
Denmark - Financial Account - net components (% of GDP)
Direct Investment Other Investment
Portfolio - debt Portfolio - equity
Financial account
-60
-50
-40
-30
-20
-10
0
10
20
30
40
50
20
08Q
1
20
09Q
1
20
10Q
1
20
11Q
1
20
12Q
1
20
13Q
1
20
14Q
1
20
15Q
1
20
16Q
1
Denmark - Net International Investment Position net components (% of GDP)
Direct Investment Other Investment
Portfolio - debt Portfolio - equity
NIIP

Analysis of developments in EU capital flows in the global context
October 2016 [79]
-60
-40
-20
0
20
40
60
20
06Q
1
20
07Q
1
20
08Q
1
20
09Q
1
20
10Q
1
20
11Q
1
20
12Q
1
20
13Q
1
20
14Q
1
20
15Q
1
20
16Q
1
Estonia - Financial Account - net components (% of GDP)
Direct Investment Other Investment
Portfolio - debt Portfolio - equity
Financial account
-120
-100
-80
-60
-40
-20
0
20
40
20
08Q
1
20
09Q
1
20
10Q
1
20
11Q
1
20
12Q
1
20
13Q
1
20
14Q
1
20
15Q
1
20
16Q
1
Estonia - Net International Investment Position net components (% of GDP)
Direct Investment Other Investment
Portfolio - debt Portfolio - equity
NIIP
-50
-40
-30
-20
-10
0
10
20
30
40
20
06Q
1
20
07Q
1
20
08Q
1
20
09Q
1
20
10Q
1
20
11Q
1
20
12Q
1
20
13Q
1
20
14Q
1
20
15Q
1
20
16Q
1
Finland - Financial Account - net components (% of GDP)
Direct Investment Other Investment
Portfolio - debt Portfolio - equity
Financial account
-40
-30
-20
-10
0
10
20
30
40
20
08Q
1
20
09Q
1
20
10Q
1
20
11Q
1
20
12Q
1
20
13Q
1
20
14Q
1
20
15Q
1
20
16Q
1
Finland - Net International Investment Position net components (% of GDP)
Direct Investment Other Investment
Portfolio - debt Portfolio - equity
NIIP

Analysis of developments in EU capital flows in the global context
October 2016 [80]
-25
-20
-15
-10
-5
0
5
10
15
20
25
30
20
06Q
1
20
07Q
1
20
08Q
1
20
09Q
1
20
10Q
1
20
11Q
1
20
12Q
1
20
13Q
1
20
14Q
1
20
15Q
1
20
16Q
1
France - Financial Account - net components (% of GDP)
Direct Investment Other Investment
Portfolio - debt Portfolio - equity
Financial account
-50
-40
-30
-20
-10
0
10
20
30
20
08Q
1
20
09Q
1
20
10Q
1
20
11Q
1
20
12Q
1
20
13Q
1
20
14Q
1
20
15Q
1
20
16Q
1
France - Net International Investment Position net components (% of GDP)
Direct Investment Other Investment
Portfolio - debt Portfolio - equity
NIIP
-15
-10
-5
0
5
10
15
20
20
06Q
1
20
07Q
1
20
08Q
1
20
09Q
1
20
10Q
1
20
11Q
1
20
12Q
1
20
13Q
1
20
14Q
1
20
15Q
1
20
16Q
1
Germany - Financial Account - net components (% of GDP)
Direct Investment Other Investment
Portfolio - debt Portfolio - equity
Financial account
-30
-20
-10
0
10
20
30
40
50
20
08Q
1
20
09Q
1
20
10Q
1
20
11Q
1
20
12Q
1
20
13Q
1
20
14Q
1
20
15Q
1
20
16Q
1
Germany - Net International Investment Position net components (% of GDP)
Direct Investment Other Investment
Portfolio - debt Portfolio - equity
NIIP

Analysis of developments in EU capital flows in the global context
October 2016 [81]
-100
-80
-60
-40
-20
0
20
40
60
80
20
06Q
1
20
07Q
1
20
08Q
1
20
09Q
1
20
10Q
1
20
11Q
1
20
12Q
1
20
13Q
1
20
14Q
1
20
15Q
1
20
16Q
1
Greece - Financial Account - net components (% of GDP)
Direct Investment Other Investment
Portfolio - debt Portfolio - equity
Financial account
-160
-140
-120
-100
-80
-60
-40
-20
0
20
40
60
20
08Q
1
20
09Q
1
20
10Q
1
20
11Q
1
20
12Q
1
20
13Q
1
20
14Q
1
20
15Q
1
20
16Q
1
Greece - Net International Investment Position net components (% of GDP)
Direct Investment Other Investment
Portfolio - debt Portfolio - equity
NIIP
-70
-60
-50
-40
-30
-20
-10
0
10
20
30
40
20
06Q
1
20
07Q
1
20
08Q
1
20
09Q
1
20
10Q
1
20
11Q
1
20
12Q
1
20
13Q
1
20
14Q
1
20
15Q
1
20
16Q
1
Hungary - Financial Account - net components (% of GDP)
Direct Investment Other Investment
Portfolio - debt Portfolio - equity
Financial account
-140
-120
-100
-80
-60
-40
-20
0
20
08Q
1
20
09Q
1
20
10Q
1
20
11Q
1
20
12Q
1
20
13Q
1
20
14Q
1
20
15Q
1
20
16Q
1
Hungary - Net International Investment Position net components (% of GDP)
Direct Investment Other Investment
Portfolio - debt Portfolio - equity
NIIP

Analysis of developments in EU capital flows in the global context
October 2016 [82]
-300
-200
-100
0
100
200
300
20
06Q
1
20
07Q
1
20
08Q
1
20
09Q
1
20
10Q
1
20
11Q
1
20
12Q
1
20
13Q
1
20
14Q
1
20
15Q
1
20
16Q
1
Ireland - Financial Account - net components (% of GDP)
Direct Investment Other Investment
Portfolio - debt Portfolio - equity
Financial account
-800
-600
-400
-200
0
200
400
600
20
08Q
1
20
09Q
1
20
10Q
1
20
11Q
1
20
12Q
1
20
13Q
1
20
14Q
1
20
15Q
1
20
16Q
1
Ireland - Net International Investment Position net components (% of GDP)
Direct Investment Other Investment
Portfolio - debt Portfolio - equity
NIIP
-20
-15
-10
-5
0
5
10
15
20
20
06Q
1
20
07Q
1
20
08Q
1
20
09Q
1
20
10Q
1
20
11Q
1
20
12Q
1
20
13Q
1
20
14Q
1
20
15Q
1
20
16Q
1
Italy - Financial Account - net components (% of GDP)
Direct Investment Other Investment
Portfolio - debt Portfolio - equity
Financial account
-60
-50
-40
-30
-20
-10
0
10
20
30
40
20
08Q
1
20
09Q
1
20
10Q
1
20
11Q
1
20
12Q
1
20
13Q
1
20
14Q
1
20
15Q
1
20
16Q
1
Italy - Net International Investment Position net components (% of GDP)
Direct Investment Other Investment
Portfolio - debt Portfolio - equity
NIIP

Analysis of developments in EU capital flows in the global context
October 2016 [83]
-50
-40
-30
-20
-10
0
10
20
30
20
06Q
1
20
07Q
1
20
08Q
1
20
09Q
1
20
10Q
1
20
11Q
1
20
12Q
1
20
13Q
1
20
14Q
1
20
15Q
1
20
16Q
1
Latvia - Financial Account - net components (% of GDP)
Direct Investment Other Investment
Portfolio - debt Portfolio - equity
Financial account
-120
-100
-80
-60
-40
-20
0
20
40
20
08Q
1
20
09Q
1
20
10Q
1
20
11Q
1
20
12Q
1
20
13Q
1
20
14Q
1
20
15Q
1
20
16Q
1
Latvia - Net International Investment Position net components (% of GDP)
Direct Investment Other Investment
Portfolio - debt Portfolio - equity
NIIP
-50
-40
-30
-20
-10
0
10
20
30
20
06Q
1
20
07Q
1
20
08Q
1
20
09Q
1
20
10Q
1
20
11Q
1
20
12Q
1
20
13Q
1
20
14Q
1
20
15Q
1
20
16Q
1
Lithuania - Financial Account - net components (% of GDP)
Direct Investment Other Investment
Portfolio - debt Portfolio - equity
Financial account
-70
-60
-50
-40
-30
-20
-10
0
10
20
08Q
1
20
09Q
1
20
10Q
1
20
11Q
1
20
12Q
1
20
13Q
1
20
14Q
1
20
15Q
1
20
16Q
1
Lithuania - Net International Investment Position net components (% of GDP)
Direct Investment Other Investment
Portfolio - debt Portfolio - equity
NIIP

Analysis of developments in EU capital flows in the global context
October 2016 [84]
-1500
-1000
-500
0
500
1000
15002
006
Q1
20
07Q
1
20
08Q
1
20
09Q
1
20
10Q
1
20
11Q
1
20
12Q
1
20
13Q
1
20
14Q
1
20
15Q
1
20
16Q
1
Luxembourg - Financial Account - net components (% of GDP)
Direct Investment Other Investment
Portfolio - debt Portfolio - equity
Financial account
-4000
-3000
-2000
-1000
0
1000
2000
3000
4000
20
08Q
1
20
09Q
1
20
10Q
1
20
11Q
1
20
12Q
1
20
13Q
1
20
14Q
1
20
15Q
1
20
16Q
1
Luxembourg - Net International Investment Position net components (%
of GDP)
Direct Investment Other Investment
Portfolio - debt Portfolio - equity
NIIP
-400
-300
-200
-100
0
100
200
300
400
20
06Q
1
20
07Q
1
20
08Q
1
20
09Q
1
20
10Q
1
20
11Q
1
20
12Q
1
20
13Q
1
20
14Q
1
20
15Q
1
20
16Q
1
Malta - Financial Account - net components (% of GDP)
Direct Investment Other Investment
Portfolio - debt Portfolio - equity
Financial account
-1500
-1000
-500
0
500
1000
1500
20
08Q
1
20
09Q
1
20
10Q
1
20
11Q
1
20
12Q
1
20
13Q
1
20
14Q
1
20
15Q
1
20
16Q
1
Malta - Net International Investment Position net components (% of GDP)
Direct Investment Other Investment
Portfolio - debt Portfolio - equity
NIIP

Analysis of developments in EU capital flows in the global context
October 2016 [85]
-80
-60
-40
-20
0
20
40
60
80
20
06Q
1
20
07Q
1
20
08Q
1
20
09Q
1
20
10Q
1
20
11Q
1
20
12Q
1
20
13Q
1
20
14Q
1
20
15Q
1
20
16Q
1
Netherlands - Financial Account - net components (% of GDP)
Direct Investment Other Investment
Portfolio - debt Portfolio - equity
Financial account
-150
-100
-50
0
50
100
150
20
08Q
1
20
09Q
1
20
10Q
1
20
11Q
1
20
12Q
1
20
13Q
1
20
14Q
1
20
15Q
1
20
16Q
1
Netherlands - Net International Investment Position net components (%
of GDP)
Direct Investment Other Investment
Portfolio - debt Portfolio - equity
NIIP
-20
-15
-10
-5
0
5
10
20
06Q
1
20
07Q
1
20
08Q
1
20
09Q
1
20
10Q
1
20
11Q
1
20
12Q
1
20
13Q
1
20
14Q
1
20
15Q
1
20
16Q
1
Poland - Financial Account - net components (% of GDP)
Direct Investment Other Investment
Portfolio - debt Portfolio - equity
Financial account
-80
-70
-60
-50
-40
-30
-20
-10
0
20
08Q
1
20
09Q
1
20
10Q
1
20
11Q
1
20
12Q
1
20
13Q
1
20
14Q
1
20
15Q
1
20
16Q
1
Poland - Net International Investment Position net components (% of GDP)
Direct Investment Other Investment
Portfolio - debt Portfolio - equity
NIIP

Analysis of developments in EU capital flows in the global context
October 2016 [86]
-50
-40
-30
-20
-10
0
10
20
30
40
20
06Q
1
20
07Q
1
20
08Q
1
20
09Q
1
20
10Q
1
20
11Q
1
20
12Q
1
20
13Q
1
20
14Q
1
20
15Q
1
20
16Q
1
Portugal - Financial Account - net components (% of GDP)
Direct Investment Other Investment
Portfolio - debt Portfolio - equity
Financial account
-120
-100
-80
-60
-40
-20
0
20
20
08Q
1
20
09Q
1
20
10Q
1
20
11Q
1
20
12Q
1
20
13Q
1
20
14Q
1
20
15Q
1
20
16Q
1
Portugal - Net International Investment Position net components (% of GDP)
Direct Investment Other Investment
Portfolio - debt Portfolio - equity
NIIP
-35
-30
-25
-20
-15
-10
-5
0
5
10
15
20
20
06Q
1
20
07Q
1
20
08Q
1
20
09Q
1
20
10Q
1
20
11Q
1
20
12Q
1
20
13Q
1
20
14Q
1
20
15Q
1
20
16Q
1
Romania - Financial Account - net components (% of GDP)
Direct Investment Other Investment
Portfolio - debt Portfolio - equity
Financial account
-90
-80
-70
-60
-50
-40
-30
-20
-10
0
20
08Q
1
20
09Q
1
20
10Q
1
20
11Q
1
20
12Q
1
20
13Q
1
20
14Q
1
20
15Q
1
20
16Q
1
Romania - Net International Investment Position net components (% of GDP)
Direct Investment Other Investment
Portfolio - debt Portfolio - equity
NIIP

Analysis of developments in EU capital flows in the global context
October 2016 [87]
-60
-50
-40
-30
-20
-10
0
10
20
30
40
50
20
06Q
1
20
07Q
1
20
08Q
1
20
09Q
1
20
10Q
1
20
11Q
1
20
12Q
1
20
13Q
1
20
14Q
1
20
15Q
1
20
16Q
1
Slovakia - Financial Account - net components (% of GDP)
Direct Investment Other Investment
Portfolio - debt Portfolio - equity
Financial account
-80
-70
-60
-50
-40
-30
-20
-10
0
10
20
30
20
08Q
1
20
09Q
1
20
10Q
1
20
11Q
1
20
12Q
1
20
13Q
1
20
14Q
1
20
15Q
1
20
16Q
1
Slovakia - Net International Investment Position net components (% of GDP)
Direct Investment Other Investment
Portfolio - debt Portfolio - equity
NIIP
-40
-30
-20
-10
0
10
20
30
40
50
20
06Q
1
20
07Q
1
20
08Q
1
20
09Q
1
20
10Q
1
20
11Q
1
20
12Q
1
20
13Q
1
20
14Q
1
20
15Q
1
20
16Q
1
Slovenia - Financial Account - net components (% of GDP)
Direct Investment Other Investment
Portfolio - debt Portfolio - equity
Financial account
-60
-50
-40
-30
-20
-10
0
10
20
30
20
08Q
1
20
09Q
1
20
10Q
1
20
11Q
1
20
12Q
1
20
13Q
1
20
14Q
1
20
15Q
1
20
16Q
1
Slovenia - Net International Investment Position net components (% of GDP)
Direct Investment Other Investment
Portfolio - debt Portfolio - equity
NIIP

Analysis of developments in EU capital flows in the global context
October 2016 [88]
-30
-20
-10
0
10
20
30
20
06Q
1
20
07Q
1
20
08Q
1
20
09Q
1
20
10Q
1
20
11Q
1
20
12Q
1
20
13Q
1
20
14Q
1
20
15Q
1
20
16Q
1
Spain - Financial Account - net components (% of GDP)
Direct Investment Other Investment
Portfolio - debt Portfolio - equity
Financial account
-90
-80
-70
-60
-50
-40
-30
-20
-10
0
20
08Q
1
20
09Q
1
20
10Q
1
20
11Q
1
20
12Q
1
20
13Q
1
20
14Q
1
20
15Q
1
20
16Q
1
Spain - Net International Investment Position net components (% of GDP)
Direct Investment Other Investment
Portfolio - debt Portfolio - equity
NIIP
-30
-20
-10
0
10
20
30
40
50
20
06Q
1
20
07Q
1
20
08Q
1
20
09Q
1
20
10Q
1
20
11Q
1
20
12Q
1
20
13Q
1
20
14Q
1
20
15Q
1
20
16Q
1
Sweden - Financial Account - net components (% of GDP)
Direct Investment Other Investment
Portfolio - debt Portfolio - equity
Financial account
-80
-60
-40
-20
0
20
40
60
20
08Q
1
20
09Q
1
20
10Q
1
20
11Q
1
20
12Q
1
20
13Q
1
20
14Q
1
20
15Q
1
20
16Q
1
Sweden - Net International Investment Position net components (% of GDP)
Direct Investment Other Investment
Portfolio - debt Portfolio - equity
NIIP

Analysis of developments in EU capital flows in the global context
October 2016 [89]

Analysis of developments in EU capital flows in the global context
October 2016 [90]
4. Institutional investors and risk sharing in Europe’s
Capital Markets Union
4.1 Rationale
Integrated capital markets facilitate risk sharing across sectors and countries, which in
turn helps smoothing the impact of economic shocks on consumption and investment (Véron and Wolff, 2015). However, empirical evidence points to varying degrees in which
risk sharing via capital markets actually helps smooth shocks in different jurisdictions. Valiante (2016) summarizes the evidence that points to the limited contribution of risk
sharing to consumption smoothing in the euro area and the EU.
Compared to the findings of Asdrubali et al. (1996), who estimate that 48 percent of
shocks to gross state product in the US between 1981-1990 were smoothed by risk sharing (39 percent for 1964-1990), the seminal paper of Sørensen and Yosha (1998)
found that the contribution of capital markets in smoothing shocks for 6 large Member States of the (then) European Community was a mere 8 percent of shocks (and
statistically not significant) during the period 1981-90. They suggest that the reduction of informational barriers to cross country ownership would likely increase the volume of
international capital flows and therefore foster integration15.
More recent work by Afonso and Furceri (2007) estimated a close to 10 percent risk
sharing in the EMU between 1998 and 2005, while the estimate of Furceri and Zdienicka (2013) is near to zero.
Demyanyk, Ostergaard and Sørensen (2008) found that the monetary union has
facilitated risk sharing, although the level of risk sharing is still much below the level found among U.S. states. They argue that removal of formal barriers to diversification of
assets and obstacles to cross border banking could help to improve integration.
Schoenmaker and Bosch (2008) also found that the home bias has declined in Europe
after the introduction of the euro, which decline was stronger in euro area countries than in the non-euro-area countries. They also conclude that euro-area-based investors have
switched from home to euro-area securities.
Therefore, while cross-border integration of European capital markets has increased in the 2000s, risk sharing continues to remain below values observed within the United
States and other large federations. This suggests that there is major scope for further cross-border capital markets integration which could bring many benefits, including
increased cross-border risk sharing. The EU’s Capital Markets Union initiative rightly
recognises the benefits of further integration (European Commission, 2015).
15 Sørensen and Yosha (1998) test empirically whether consumption smoothing is achieved by
means of risk sharing. Their method requires decomposing GDP growth rates into five component growth rates using national account identities and, thus, use data from OECD National Accounts. They estimate a system of five linear regressions by a two-step Generalized Least Squares
procedure, using a panel estimation with time fixed effects for OECD and (then) European Community countries; in each regression, the growth rates of the components are regressed on the GDP growth rates. Specifically, they identify the share of variation in output smoothed through
income risk sharing with the slope coefficient of growth rates of net factor income from abroad on GDP rates. They obtained coefficients are statistically no different than zero for both the OECD and the EC, leading them to the conclusion that the bulk of consumption smoothing is not achieved by virtue of income risk-sharing but, instead, saving in credit markets. They compare and contrast
their results to Asdrubali et al. (1996), who carry out a similar exercise for US states and find that the majority of soothing occurs through “capital markets”, which encompasses net factor income from abroad together with capital depreciation and corporate savings.

Analysis of developments in EU capital flows in the global context
October 2016 [91]
In this study we aim to focus on a particular aspect of financial integration and risk sharing in capital markets: institutional investment. The contribution of institutional
investment to risk sharing depends on:
the size of institutional investment; the degree of geographical diversification of portfolios, and
the composition of assets held.
The aim of the research study is to investigate these three aspects of financial
integration in the EU’s Capital Markets Union and to assess the prospects for increased risk sharing in the EU.
Our main hypothesis is that the larger the assets managed by institutional investors, the smaller the home bias and thereby the larger the scope for risk sharing, ceteris paribus.
Our focus will be on portfolio equity home bias, and less so on portfolio bond home bias, because the former is more important from the perspective of risk sharing.
4.2 Literature
The concept of ‘home bias’ refers to a preference for greater investment in home country assets. There is no uniform definition of home bias, but different authors define it
differently (we will detail our definition in Section 4.4). A huge literature explores the complex determinants of equity home bias and the asset-allocation strategies of mutual
funds, as we review below. However, surprisingly limited research papers have been published on home bias of two major types of institutional investors, namely pension
funds and insurance companies.
Strong and Xu (2003) try to explain the existence of a home bias in equity investment in
developed economies by developing a measure of investors’ optimism (relative and absolute) that is used to explain the behavioural component of investment decisions.
They find that fund managers from the United States, the United Kingdom, continental Europe and Japan show a significant relative optimism towards their home equity
market. Institutional factors have largely failed to explain the home bias. Their data comes from the Merrill Lynch Fund Manager Survey: a survey of 250 large fund
managers from USA, UK, continental EU and Japan, constituted by questions concerning
mainly prospects for international equity markets. The survey has a monthly frequency and covers the period October 1995-October 2001.
Edison and Warnock (2004) report empirical evidence that US portfolio holdings of
emerging markets securities tend to be biased towards firms that are larger, with less restrictions on foreign ownership or cross-listed on a US exchange. In particular, they
show that the effect of the cross listing is very strong. The authors therefore conclude that information asymmetries play an important role in equity home bias. They use
confidential security-level data on U.S. holdings of emerging market stocks from
comprehensive benchmark surveys conducted by the U.S. Treasury Department and the Federal Reserve Board as of March 1994 and December 1997, for 9 emerging economies
(Argentina, Brazil, Chile, Mexico, Indonesia, Korea, Malaysia, Philippines, Thailand).
Suh (2005) assesses the role of information asymmetries in investment decisions. He looks at the portfolio holdings of different countries as well as portfolio adjustments: in
the latter case he assumes that the more frequently a country adjusts its portfolio, the better it is informed. His results suggest that home bias can arise from unobservable
factors such as information asymmetry and investor optimism. Data for portfolio
holdings are from the Economist magazine’s “Our Quarterly Portfolio Poll” for the period

Analysis of developments in EU capital flows in the global context
October 2016 [92]
Q1/89 to Q2/99, while data for portfolio performance are from Datastream. Countries
classified as: US, rest of America, UK, Germany, France, rest of Europe, Japan, and rest of Asia.
Aggarwal, Klapper and Wysocki (2005) examine the investment allocation choices of
actively-managed US mutual funds in emerging market equities after the market crises of the 1990s. They find that at the country level, US funds invest more in open emerging
markets with stronger accounting standards, shareholder rights, and legal frameworks. At the firm level, US funds are found to invest more in firms that adopt discretionary
policies such as greater accounting transparency and the issuance of an American
Depositary Receipt (ADR). Their data comes from the February 2002 release of the Morningstar database for US mutual funds.
Chan, Covrig and Ng (2005) analyse six possible determinants of home bias in the equity
market allocation of mutual funds in 26 countries. The authors check for: (i) economic development, (ii) capital controls, (iii) stock market development, (iv) familiarity16, (v)
investor protection and (vi) other factors. There is evidence for a significant impact of stock market development and familiarity variables on both domestic and foreign bias,
whereas economic development and capital controls influence only the foreign bias. Their
data on mutual fund holdings from 26 countries in 1999 and 2000 are from the TFS Database, created by The Investex Group, Securities Data Company and CDA/Spectrum.
Data are at the fund level.
Hau and Rey (2008) analyse firm level data of mutual funds to draw some stylized facts on the distribution of home bias at the fund level in different countries. Empirical
evidence shows that there is a high level of heterogeneity across mutual funds. They also find that (i) large countries tend to be more closed than small ones, implying a
higher level of home bias; (ii) bigger funds tend to be more home-biased than smaller
ones, perhaps because smaller funds are usually able to offer more customised investments and are able to circumvent some barriers to foreign investments; (iii) the
more a fund has a diversified portfolio in geographical terms, the broader the portfolio will be in terms of sectors. The main data source is TFS (Thomson Reuters Financial
Securities). It provides disaggregated firm level data for mutual funds in 16 countries for the years from 1997 to 2002.
Anderson, Fedenia, Hirschey, Skilba (2011) focus on the role of cultural variables on
international diversification of institutionally managed portfolios. They find that countries
with a high level of uncertainty avoidance17 show a higher home bias, countries characterized by a high level of masculinity18 and long term orientation tend to have
more internationally diversified portfolios, and countries with higher cultural distance19 tend to diversify less. Therefore, according to this study, culture impacts investor
behaviour directly and not merely though indirect channels such as the legal and
16 Familiarity is specified as common language, geographic distance and bilateral trade (the sum of bilateral exports and imports as a share of the total sum of exports/imports). 17 One of the dimensions of national culture based on research on values by Geert Hofstede, Gert Hofstede and Michael Minkov; defined as “the degree to which the members of a society feel uncomfortable with uncertainty and ambiguity” (https://geert-hofstede.com/national-
culture.html). 18 “Masculinity…represents a preference in society for achievement, heroism, assertiveness and material rewards for success. Society at large is more competitive. Its opposite, femininity, stands
for a preference for cooperation, modesty, caring for the weak and quality of life. Society at large is more consensus-oriented.” 19 Cultural distance indices are computed by taking a simple average of the difference of scores in “values” between the investor and the target country, normalized by the total variance of the
scores. These values are: future orientation, assertiveness, collectivism and uncertainty avoidance as per GLOBE; individualism, masculinity, uncertainty avoidance and long-term orientation as per Hofstede.

Analysis of developments in EU capital flows in the global context
October 2016 [93]
regulatory framework. The data include information at the fund level for over 60
countries and securities held in more than 80 countries. Sources are different public filings plus CRSP, Datastream and WorldScope. Data are for year 2006 and the
methodology follows a cross section approach.
Rubbaniy, Van Lelyveld and Verschoor (2014) study the home bias of Dutch pension fund investment behaviour. A decline in the level of home bias has been observed
among Dutch pension funds from 1997 to 2006, which might be due to a relaxation of the strict regulation and a continued increase in the size of pension funds’ assets relative
to Dutch GDP, as we report later on Figure 31 on page 95. A large increase in managed
assets may imply lower home bias – the key hypothesis we test in our paper –, partly because managers of large funds tend to be more professional and thereby recognise
more the benefits of risk diversification, and partly because the supply of the desired securities at home becomes relative small compared to the assets managed by
institutional investors.
The empirical evidence of Rubbaniy, Van Lelyveld and Verschoor (2014) also shows that the preference for domestic portfolio holdings (home bias) seems to be determined also
by some fund characteristics, like liability-structure and size. They use a panel dataset of
more than 600 Dutch Pension Funds between 1992 and 2006. The data source is the supervisory dataset of the Dutch National Bank (DNB): this is an entity-level dataset
with detailed information on portfolios and balance sheets with an exceptionally high coverage (95%).
4.3 Evolution of institutional investment and the supply of securities
Assets managed by institutional investors (defined as pension funds, insurance companies and investment funds) have increased in the past fifteen years in the EU, but
in absolute value and as a share of EU GDP (Figure 30)20. Pension fund assets increased from 18 percent of GDP to 29 percent from 2001-14, while insurance funds assets
expanded from 57 percent of GDP to 68 percent from 2001-15. The fastest growth is observed for investment funds, where unfortunately a much shorter period is available:
their assets increased from 99 percent of GDP to 151 percent from 2008-15.
Figure 30: Assets managed by institutional investors in the EU (% of EU
GDP), 2001-2015
20 We note that assets of the three types of investors are not additive, because of cross-sectoral holdings, for example pension funds holding of investment fund shares.
0%
50%
100%
150%
20
01
20
02
20
03
20
04
20
05
20
06
20
07
20
08
20
09
20
10
20
11
20
12
20
13
20
14
20
15
Pension funds (EU28 minus CY)
Insurance Companies (EU28 minusBG,HR,CY,MT,RO)Investment funds (EU28 minusBG,HR,CY,MT,PL,RO)

Analysis of developments in EU capital flows in the global context
October 2016 [94]
Source: Bruegel calculations based on data listed in the data annex. Note: we use constant country-composition EU aggregates and thereby approximate the missing data points. For
example, for pension funds, there are 22 countries for which data is available in the full period of 2001-2014. We first calculate the sum of these 22 countries. Data for Luxembourg is available for 2004-2014: we calculated the share of Luxembourg in the sum of assets of the 22 countries and approximate the missing data for 2001-2003 by assuming that Luxembourg’s share in the sum of
22 countries 2001-2003 is the same as in 2004. We then calculate the sum of assets of 23 countries: the initial 22 plus Luxembourg. Data for Lithuania is available for 2008-14 and we approximate the missing data for 2001-2007 by assuming that Lithuania’s share in the combined
assets of the 23 countries was the same in this period as in 2008. Finally, we add Malta similarly, for the 2010-2014 period. We follow the same approach for aggregating insurance corporations and investment fund assets. Note that we calculate these EU aggregates to be able to show
constant-country composition values on the chart, but we will not use such approximated data in our regression analysis.
Beyond the general increasing trend in the EU, the size of the three types of institutional investors and their increase through time vary a lot across EU Member States.
Pension funds’ assets to GDP ratios range from 160%, the highest, in the Netherlands to
virtually 0% for France and Greece in 2015 (Figure 31). The Netherlands together with
the UK are the two EU Member States that joined by Anglo-Saxon countries (Australia, Canada, the US), Iceland and Switzerland are home to the largest pension fund
industries, as compared to the size of the economy (Panel 1). Most EU Member States have moderately-sized or even small pension fund industries in the context of a global
comparison. Note the large number of countries where pension funds’ assets to GDP are below 10% and that the vast majority of them are EU countries. In France and Greece,
pension funds are essentially non-existent (Panel 6). That was also the case for most of the Member States that joined the EU in the in the accession waves from 2004 onwards
at the start of the 2000s. Nevertheless, in many of these Member States, Croatia,
Estonia, Malta and Slovakia to mention a few, there has been a rapid expansion of the industry in the last 14 years. On the other hand, pension funds in large continental
Member States such as Germany, Italy and Spain have remained relatively small over this period. Regardless of the value of the ratio in 2001, the size of the pension fund
industry relative to the size of the economy has tended to increase. However, growth has not be uniform over the years, as the 2008-2009 financial crisis caused a contraction
in the value of assets relative to GDP, especially in those countries that are home to large pension fund sectors. Finally, it is worth noting the sharp drop in the assets to GDP
ratio of pension funds in Hungary from 15 percent of GDP to 4 percent in 2011, which
was the result of a reversal of the mandatory private pension funds system which was introduced in the late 1990s. There was also a very significant drop in Finland from 79
percent of GDP in 2010 to 42 percent a year later.

Analysis of developments in EU capital flows in the global context
October 2016 [95]
Figure 31: Pension fund assets (% of GDP), selected countries, 2001-
2014
40%
60%
80%
100%
120%
140%
160%
20
01
20
03
20
05
20
07
20
09
20
11
20
13
Pension funds (1)
Australia
Canada
Switzerland
UnitedKingdom
Iceland
Netherlands
United States10%
20%
30%
40%
50%
60%
70%
80%
20
01
20
03
20
05
20
07
20
09
20
11
20
13
Pension funds (2)
Denmark
Finland
Hong Kong,China
Ireland
Israel
Namibia
South Africa
0%
5%
10%
15%
20%
25%
30%
20
01
20
03
20
05
20
07
20
09
20
11
20
13
Pension funds (3)
Brazil
Croatia
Japan
Malta
Mexico
New Zealand
Poland0%
2%
4%
6%
8%
10%
12%
14%
16%
18%
20%
20
01
20
03
20
05
20
07
20
09
20
11
20
13
Pension funds (4)
Austria
Brazil
Germany
Spain
Hungary
Norway
Portugal
Sweden

Analysis of developments in EU capital flows in the global context
October 2016 [96]
Source: see data annex.
Data in the asset to GDP ratios of insurance corporations is available for a more
restrictive set of countries. Figure 32 reports values for selected economies. A
comparison with the equivalent charts for pension funds reveals that insurance companies are more mature in the beginning of the 2000s and the size of their balance
sheet relative to the size of the economy is more stable over the period 2001-2015. The second observation is less true for large insurance industries, such as the Luxembourgish
and the French in (Panel 1), but also the Danish in (Panel 2), where the asset ratio has more than doubled in the last 15 years. Another general pattern is the drop in the value
of total assets relative to GDP in 2008, and less so in 2011, once again more so where insurance corporations tend to be larger (Luxembourg, France, Sweden). The fourth
panel also captures the financial collapse of Iceland, as it impacted the insurance sector.
In terms of cross-country comparison, Luxembourg has by far the largest industry relative to its size, and so do many large Member States, i.e. France and the UK, joined
by Ireland and the Nordic Member States. On the contrary, insurance corporations in Greece, the Baltics and the countries of Central Europe are rather small. The rest of the
Member States are home to an insurance sector whose size is closer to the average of the distribution and comparable to that of other advanced economies, such as the US,
Canada and South Korea. It should be noted that Figure 32 and Figure 33 are to some extent complementary. The large share of insurance assets and low share of pension
fund assets in France, for example, can be explained by the fact that life insurance
policies are the main vehicle for pension savings in France.
0%
2%
4%
6%
8%
10%
12%
20
01
20
03
20
05
20
07
20
09
20
11
20
13
Pension funds (5)
Bulgaria
CzechRepublic
Estonia
Italy
Korea
Lithuania
Russia 0%
1%
2%
3%
4%
5%
6%
20
01
20
03
20
05
20
07
20
09
20
11
20
13
Pension funds (6)
Belgium
China
France
Greece
Luxembourg
Latvia
Romania
Slovenia

Analysis of developments in EU capital flows in the global context
October 2016 [97]
Figure 32: Insurance corporation assets (% of GDP), 2001-2015
Source: see data annex.
Unfortunately, data for investment funds are much shorter and, crucially, begin in the year 2008 for most countries (Figure 33). However, for some countries the data goes
back before 2008 and help to show the extent to which the value of investment funds’
assets suffered during the financial crisis. The range and the dispersion of countries’ ratios are larger than for the other two types of institutional investors. Specifically,
Luxembourg, whose investment funds industry size is a staggering 70 times its GDP size, Ireland and the UK are the clear outliers in the distribution. The UK, US, Netherlands,
Denmark and Sweden also have relatively large investment funds, with a ratio closer to 100%. Again, investment funds are developed the least in the Baltics, Central Europe
and Greece. Most of the continental EU states (including France and Germany) fall in between and closer to the median. Finally, one can notice that, at least since 2008,
0
0,5
1
1,5
2
2,5
3
3,5
50%
60%
70%
80%
90%
100%
110%
120%
130%
140%
20
01
20
04
20
07
20
10
20
13
Insurance corporations (1) Switzerland
France
UnitedKingdom
Ireland
Japan
Netherlands
Sweden
Luxembourg(rhs)
20%
30%
40%
50%
60%
70%
80%
90%
100%
110%
120%
20
01
20
03
20
05
20
07
20
09
20
11
20
13
20
15
Insurance corporations (2)
Austria
Belgium
Canada
Germany
Denmark
Korea
Norway
UnitedStates
0%
5%
10%
15%
20%
25%
30%
35%
40%
45%
20
01
20
03
20
05
20
07
20
09
20
11
20
13
20
15
Insurance corporations (3)
CzechRepublic
Spain
Finland
Israel
Italy
Poland
Portugal
Slovenia
0%
2%
4%
6%
8%
10%
12%
14%
20
01
20
03
20
05
20
07
20
09
20
11
20
13
20
15
Insurance corporations (4) Estonia
Greece
Hungary
Iceland
Lithuania
Latvia
Russia
Slovakia
Turkey

Analysis of developments in EU capital flows in the global context
October 2016 [98]
assets of investment funds have grown faster than GDP especially in those countries
where they were already relatively developed (those in panel 1, Sweden in panel 2).
Figure 33: Investment fund assets (% of GDP), 2000 and 2014
Source: see data annex.
Institutional investment is expected to increase further, in particular pension funds. While some countries have well developed pension fund schemes, others have very small
or no private pension funds. The main drivers of pension fund development are ageing and safeguarding pension entitlements (by separating pension liabilities from corporate
balance sheets into independent pension funds).
The increasing demand for marketable securities (equities and bonds) by institutional investors should be satisfied by the increasing issuing of equity and bonds by corporates,
as well as government bonds. Figure 34 shows that the outstanding stock of debt
0%
1000%
2000%
3000%
4000%
5000%
6000%
7000%
20%
40%
60%
80%
100%
120%
20
01
20
04
20
07
20
10
20
13
Investment funds (1)
Canada
Switzerland
Denmark
Netherlands
United States
UnitedKingdom (rhs)
Ireland (rhs)
Luxembourg(rhs)
10%
20%
30%
40%
50%
60%
70%
80%
20
01
20
03
20
05
20
07
20
09
20
11
20
13
20
15
Investment funds (2)
Austria
Belgium
Germany
Finland
France
Iceland
New Zealand
Portugal
Sweden
0%
5%
10%
15%
20%
25%
30%
35%
20
01
20
03
20
05
20
07
20
09
20
11
20
13
20
15
Investment funds (3)
Chile
Spain
Hungary
Israel
Italy
Japan
Korea
Slovenia
0%
1%
2%
3%
4%
5%
6%
7%
8%
9%
10%
20
01
20
03
20
05
20
07
20
09
20
11
20
13
20
15
Investment funds (4)
CzechRepublic
Estonia
Greece
Lithuania
Latvia
Russia
Slovakia

Analysis of developments in EU capital flows in the global context
October 2016 [99]
securities increased from 2004 to 2015 by all three major issuers, the general
government, non-financial corporations (NFCs) and financial corporations (FCs). In the EU as a whole (excluding Bulgaria and Romania due to data availability issues) debt
securities issued by general governments and financial corporations are broadly similar in size, while non-financial corporations have relatively small, but increasing share. The
EU aggregate excluding the UK (see the centre of Figure 34) is somewhat smaller.
In most countries debt securities relative to GDP has increased from 2004 to 2015, the exceptions are Austria, Argentina, Cyprus, Germany, Greece, Turkey and Saudi Arabia.
In the cases of Cyprus and Greece the deep economic crisis of the past years reduced
private sector issuances, while official loans replaced debt securities in general government financing.
We plot Luxembourgish data on a separate panel, given the extraordinary large stock of
debt securities issued by financial institutions (about 15-times annual GDP in 2015).
Figure 34: Debt securities by issuer, selected countries (% of GDP),
2004 and 2015
0
20
40
60
80
100
120
140
160
180
2004 2015 2004 2015 2004 2015
EU26 (EU28 minus BGand RO)
EU25 (EU28 minus BG,RO, UK)
EA19
General Government NFCs FCs
0
100
200
300
400
2004 2015 2004 2015 2004 2015 2004 2015 2004 2015 2004 2015 2004 2015 2004 2015 2004 2015 2004 2015 2004 2015 2004 2015 2004 2015
Ireland Netherlands Japan Denmark UnitedKingdom
UnitedStates
Italy France Spain Sweden Portugal Belgium Australia
General Government NFCs FCs

Analysis of developments in EU capital flows in the global context
October 2016 [100]
Source: see data annex.
Stock market capitalisation as a share of GDP (Figure 35) varies significantly across countries. In smaller and in emerging countries its share in GDP is rather low at a few
dozen percent. In Germany stock market capitalisation is about 50 percent and in the
Netherlands, France and Belgium it is about 90-100 percent, still below the US value of about 140 percent of GDP.
0
50
100
150
2004 2015 2004 2015 2004 2015 2004 2015 2004 2015 2004 2015 2004 2015 2004 2015 2004 2015 2004 2015 2004 2015 2004 2015 2004 2015
Austria Canada Hong KongSAR
Finland Norway Singapore Germany Malaysia Malta Hungary Cyprus Slovenia Greece
General Government NFCs FCs
01020304050607080
2004201520042015200420152004201520042015200420152004201520042015200420152004201520042015200420152004201520042014
Israel CzechRepublic
Thailand China Croatia Slovakia Poland Turkey Latvia Lithuania Russia Estonia SaudiArabia
Argentina
General Government NFCs FCs
0
200
400
600
800
1000
1200
1400
1600
1800
2008 2015
Luxembourg
General Government NFCs FCs

Analysis of developments in EU capital flows in the global context
October 2016 [101]
Figure 35: Stock market capitalisation of listed companies in 2015,
selected countries, % of GDP
Source: World Bank, Market capitalisation of listed companies
However, stock market capitalisation does not include all domestic equity investment
opportunities. The financial balance sheet data of the national accounts dataset also includes, beyond listed shares, unlisted shares, other equity and investment fund
shares/units. Figure 36 shows huge variation across countries from value less than 50 percent of GDP to 105-times GDP in Luxembourg (therefore, we plotted Luxembourg,
along with Malta and Ireland, on a second panel). There is also a great diversity in the share of non-resident holdings of total domestic equity: non-residents have dominant
roles in Luxembourg, Malta, Ireland, Cyprus and the Netherlands, while their share is
only around 20 percent for example in Italy, Greece, Sweden, Canada, Japan and the United States.
Figure 36: Total domestic equity market capitalisation held by residents
and non-resident (from the national accounts dataset), selected
countries, 2014, % of GDP
0
50
100
150
200
250Si
nga
po
reU
nit
ed S
tate
sM
alay
sia
Un
ited
Kin
gdo
mC
anad
aTh
aila
nd
Luxe
mb
ou
rgJa
pan
Au
stra
liaN
eth
erla
nd
sFr
ance
Spai
nB
elgi
um
Isra
elSa
ud
i Ara
bia
Ch
ina
Irel
and
Ger
man
yN
orw
ayM
alta
Po
lan
dTu
rkey
Po
rtu
gal
Gre
ece
Au
stri
aC
ypru
sSl
ove
nia
Arg
enti
na
Hu
nga
ry
0100200300400500600700800
Cyp
rus
Net
her
lan
ds
Swit
zerl
and
Swed
enD
enm
ark
Bel
giu
mU
nit
ed S
tate
sC
anad
aFr
ance
Un
ited
Kin
gdo
mH
un
gary
Jap
anSp
ain
Au
stri
aIc
elan
dFi
nla
nd
Isra
elN
orw
ayP
ort
uga
lEs
ton
iaEs
ton
iaK
ore
aB
ulg
aria
Ger
man
yC
roat
iaA
ust
ralia
Slo
ven
iaIt
aly
Cze
ch R
epu
blic
Turk
eyP
ola
nd
Lith
uan
iaLa
tvia
Ru
ssia
Slo
vak
Rep
ub
licR
om
ania
Gre
ece
Mex
ico
Held by residents Held by non-residents

Analysis of developments in EU capital flows in the global context
October 2016 [102]
Source: see data annex. Note: Financial balance sheet data of the national accounts dataset includes four categories: (1) listed shares, (2) unlisted shares, (3) other equity and (4) investment
fund shares/units. Data for Switzerland is for 2013.
4.4 A new pension fund foreign investment restrictions index
An important factor is whether prudential regulations allow institutional investors to
diversify geographically across borders. Some countries still have investment limits, while others apply the prudent person principle (appropriate diversification).
Unfortunately, no numerical indicators have been published to summarise regulatory
restrictions. Since we would like to include such restrictions as an explanatory variable in our regressions, we create a new index that we call ‘Pension fund foreign investment
restrictions index’.
4.4.1 Description of the new index
We construct the index using data from the Annual Survey of Investment Regulation of Pension Funds of the OECD:
http://www.oecd.org/finance/private-pensions/annualsurveyofinvestmentregulationofpensionfunds.htm
The survey covers years 2001 and 2005 to 2014 for most countries in our regression
sample; however, for some countries coverage is not complete. The exact series we used is the “Restriction on foreign investment (code R2), All asset classes (code A8)”.
We calculate the index for 42 countries: 24 EU countries and 18 non-EU countries. The index cannot be calculated for 4 EU countries: Latvia, Cyprus and Croatia are not
included at all in the OECD dataset, while for France there is no data on restrictions on
foreign investment21. The availability of the index is reported in Table 4.
We define an index of regulatory restrictions on foreign investment of pension funds in country i for year t as 𝑞𝑖𝑡 where:
𝑞𝑖𝑡 = 1 − 𝑠𝑖𝑡
21 We note that some further non-EU countries could be added.
0
2000
4000
6000
8000
10000
12000
Luxembourg Malta Ireland
Held by non-residents
Held by residents

Analysis of developments in EU capital flows in the global context
October 2016 [103]
and 𝑠𝑖𝑡 is the maximum allowed share of foreign assets in the pension fund portfolio of
country i for year t. The index can be understood as measuring the extent to which limits on foreign investment constrain diversification. It ranges from 0 to 1 and higher values
correspond to more stringent regulatory restrictions.
The series provides a qualitative description of restrictions on the assets pension funds are permitted to hold, which includes quantitative limits. These limits correspond to the
maximum share of foreign assets pension funds in each country are permitted to hold in their portfolio, but more often than not they do not apply uniformly across all world
assets. This makes the task less straightforward and calls for some simplifying
assumptions, which are presented below.
The most common way limits are defined is on the basis of location. In certain cases, different restrictions apply to OECD and non-OECD countries. Since the bulk of global
securities were issued in OECD countries, we only consider restrictions (or the lack thereof) on securities issued in OECD countries and ignore restrictions applying to non-
OECD countries. Therefore, ‘no restrictions on assets holdings within the OECD’ is equivalent to allowing 100% of assets to be “foreign”, thus implying potential for “full
diversification”. When there is no discrimination among OECD countries, we define
maximum allowed share of foreign assets simply as:
𝑠𝑖𝑡 = 𝑠𝑖𝑡𝑂𝐸𝐶𝐷
However, in some countries separate limits are placed on holdings of assets within the EU/EEA and in those OECD members that are not in the EU/EEA. In those cases, we opt
for a weighted average of the two limits, applying equal weights. In these cases we
define the maximum allowed share of foreign assets as:
𝑠𝑖𝑡 = 0.5𝑠𝑖𝑡𝐸𝐸𝐴/𝐸𝑈
+ 0.5𝑠𝑖𝑡𝑂𝐸𝐶𝐷 𝑁𝑂𝑁 𝐸𝐸𝐴/𝐸𝑈
Thus, if a country’s regulations allow investment without limit within the EU but forbid
the holding of assets of other OECD countries, it is assumed that the pension fund can achieve only half the diversification it could potentially achieve without any limit imposed
on the OECD as a whole. Likewise, when the quantitative limit is expressed in terms of the currency in which
assets are denominated, it is weighted by a proxy of the currency’s importance. Specifically, if the limits refer to the US dollar or the euro, then the weight is 0.5, if it is
foreign currency in general then the weight is 1:
𝑠𝑖𝑡 = 0.5𝑠𝑖𝑡
𝐸𝑈𝑅 + 0.5𝑠𝑖𝑡𝑈𝑆𝐷
For one country (Israel) in our sample restrictions take the form of minimum credit
ratings. A relatively high credit rating restriction limits the share of eligible foreign assets. We make the following assumptions:
- Credit rating of BB-, i.e. below investment grade: we assume there is no restriction, i.e. 𝑠𝑖𝑡 = 1.
- Credit rating of BBB-, i.e. investment grade: we assume there is no restriction, i.e. 𝑠𝑖𝑡 = 1.
- Credit rating of A-: we assume that 𝑠𝑖𝑡 = 0.7.
- Credit rating of A: we assume that 𝑠𝑖𝑡 = 0.6.
If there is a quantitative limit expressed as a percentage of the pension fund assets on top of a minimum credit rating requirement, we simply multiply that limit by the
assumed share of eligible assets implied by the rating. For example, in 2007 the restriction in Israel required that at most 70% of assets can be invested in any country

Analysis of developments in EU capital flows in the global context
October 2016 [104]
which is BB- rated at least: in this case 𝑠𝑖𝑡 = 0.7, because (as we list above) we treat the
BB- credit rating as not constraining foreign investments.
Finally, when the description lists different restrictions for different pension funds/options in a country (see Table 2 for these cases), the index is calculated for each one and a
simple average over the funds/options is calculated:
𝑠𝑖𝑡 =1
𝑁∑ 𝑠𝑗𝑖𝑡
𝑁
𝑗=1
where 𝑠𝑗𝑖𝑡 is the limit for the jth pension fund/option in country i out of a total of N
pension funds/options. Note that if there are more than one pension funds/options, calculating the average is the last step in obtaining 𝑠𝑖𝑡. We first construct each of the 𝑠𝑗𝑖𝑡
according to the same guidelines as above. In some cases, where for each option or plan
the limits are the same, the single limit is used. Table 5 below summarizes for which
countries there were more than one limits, the funds’/options’ names and the way the limit is calculated.

Analysis of developments in EU capital flows in the global context
October 2016 [105]
Table 4: Our new pension fund foreign investment restrictions index
Note: not available data are highlighted with yellow.
Country code 2001 2002 2003 2004 2005 2006 2007 2008 2009 2010 2011 2012 2013 2014
Australia AU 0 0 0 0 0 0 0 0 0 0 0
Austria AT 0.25 0.5 0.7 0.7 0.7 0.7 0.7 0.7 0.7 0.7 0.7
Belgium BE 0.35 0 0 0 0 0 0 0 0 0 0
Bulgaria BG 0 0 0 0
Canada CA 0.7 0 0 0 0 0 0 0 0 0 0
Chile CL 0.7 0.6 0.4 0.4 0.35 0.2 0.2 0.2 0.2
Colombia CO 0.8 0.8 0.6 0.6 0.6 0.475 0.475 0.475 0.475
Czech Republic CZ 0 0 0 0 0 0 0 0 0
Denmark DK 0.8 0 0 0 0 0 0 0 0 0 0
Estonia EE 0 0 0 0 0 0 0 0 0
Finland FI 0.475 0.45 0.45 0.225 0.225 0.225 0.225 0 0 0 0
Germany DE 0.835 0.35 0.35 0.35 0 0 0 0 0 0 0
Greece GR 0 0.5 0.5 0.5 0.5 0.5 0.5 0.5 0.5 0.5 0.5
Hong Kong (China) HK 0.3 0.3 0.3 0.3
Hungary HU 0.75 0 0 0 0 0 0 0 0 0 0
Iceland IS 0.5 0 0 0 0 0 0 0.5 0.5 0.5 0
India IN 1 1 1
Ireland IE 0 0 0 0 0 0 0 0 0 0 0
Israel IL 0.5 0.3 0.3 0.3 0.4 0.3 0 0 0
Italy IT 0 0 0 0 0 0 0 0 0 0 0
Japan JP 0 0 0 0 0 0 0 0 0 0 0
Korea KR 0.9 0.575 0.575 0.575 0.575 0.575 0.575 0.575 0.65 0.25 0.25
Lithuania LT 0 0
Luxembourg LU 0.9 0 0 0 0 0 0 0 0 0 0
Malta MT 0 0 0 0
Mexico MX 1 0.8 0.8 0.8 0.8 0.8 0.8 0.8 0.8 0.8 0.8
Netherlands NL 0 0 0 0 0 0 0 0 0 0 0
New Zealand NZ 0 0 0 0 0 0 0 0 0 0 0
Norway NO 0 0 0 0 0 0 0 0 0 0 0
Poland PL 0.95 0.95 0.95 0.825 0.825 0.825 0.825 0.825 0.825 0.475 0.8
Portugal PT 0.8 0 0 0 0 0 0 0 0 0 0
Romania RO 0 0 0 0
Russia RU 0.9 0.9 0.9 0.8 0.8 0.8 0.8 0.8
Slovak Republic SK 0 0.3 0.3 0.3 0.3 0 0 0 0 0 0
Slovenia SI 0 0 0 0
South Africa ZA 0.85 0.8 0.8 0.8 0.8 0.8 0.75 0.75 0.75
Spain ES 0 0 0 0 0 0 0 0 0 0 0
Sweden SE 0.9 0 0 0 0 0 0 0 0 0 0
Switzerland CH 0.7 0.7 0.7 0.7 0.7 0.7 0 0
Turkey TR 0 0 0 0 0 0 0 0 0 0 0
United Kingdom GB 0 0 0 0 0 0 0 0 0 0 0
United States US 0 0 0 0 0 0 0 0 0 0 0

Analysis of developments in EU capital flows in the global context
October 2016 [106]
Table 5: Countries where different restrictions apply for different pension funds/options
Years Method N (for average)
AT Austria 2013-2014 Same limits -
CL Chile 2006-2014 Joint limit -
CO Colombia 2011-2014 Average 4
DE Germany 2005*-2014 Average 2
FI Finland 2007-2014** Average 2
HU Hungary 2001 Average 2
JP Japan 2001 Same limits -
KR Korea 2005-2014 Average 2
LT Lithuania 2013-2014 Same limits -
LU Luxembourg 2007-2014 Same limits -
MT Malta 2013-2014 Same limits -
PL Poland 2001-2014 Average 2
RO Romania 2013-2014 Same limits -
** The names are somewhat different for years 2013 and 2014, but essentially refer to the same funds
-
* Pensionskassen are not mentioned at all in 2005, but is included anyway with the same limit as 2006
Same limitsBulgaria
Pensionskassen; Support funds
Country Funds/options
4
-
-
-PT Portugal 2013-2014 Same limits
MX Mexico Same limits2013-2014
Slovak
RepublicSK 2013-2014 Same limits
BG 2013-2014
RU Russia 2010-2014 Average
All Afores, (Siefore) Basic Fund 1; All Afores, (Siefore) Basic Fund 2; All Afores,
(Siefore) Basic Fund 3; All Afores, (Siefore) Basic Fund 4
Open Pension Funds; Employee Pension Funds
Closed pension funds; Open pension funds; Personal retirement saving schemes
(PPR)
Private pension fund - second pillar; Private pension fund - third pillar
Mandatory funded pillar, default option; Mandatory funded pillar, conservative
option; Mandatory funded pillar, Non-state pension funds and Investment
Privately managed mandatory pension system - Bonds Guaranteed Fund; Privately
managed mandatory pension system - Equity Non-Guaranteed Fund; Privately
managed mandatory pension system - Other types of funds; Voluntary personal
Voluntary pension funds (VPF); Mandatory pension funds (MPF)
EPF; TQP
Personal pension; corporate pension (average of limits for DB and DC)
Conservative funds; Other funds; Supplementary accumulation for pension
SEPCAV and ASSEP; CAA supervised pension funds
Occupational Retirement Schemes; Personal Retirement Schemes
Mandatory universal pension funds (UPF); Mandatory professional pension funds
(PPF); Voluntary pension funds with occupational schemes (VPFOS); Voluntary
pension funds (VPF)
Voluntary pension plans; Statutory pension plans
Five anonymized funds; joint limit reported and used
Four anonymized funds
Pensionskassen; Pensionsfonds

Analysis of developments in EU capital flows in the global context
October 2016 [107]
4.4.2 Developments in pension fund restrictions
Our index suggests that many countries apply very limited if any, restrictions on foreign investment (Table 4). Many of them, including but not limited to the Italy,
Japan, Netherlands, Spain, the United Kingdom and the United States, did not apply any specific limits as early as 2001, the first year the survey is conducted.
However, some other countries imposed substantial limits in 2001 and gradually
relaxed these barriers in recent years. This set of countries includes Denmark,
Finland, Germany, Hungary, Romania and Sweden in the EU, but also Canada, Chile and Switzerland outside the EU.
Yet there is also a group of countries where considerable constraints have
persisted over time. This is the case for Austria and Poland, which keep currency restrictions for pension fund assets, Greece, which limits pension fund foreign
investment within the EEA. Outside the EU Mexico, Russia and South Africa apply rather restrictive limits that have proved persistent, while India outright forbids
foreign investment.
4.5 Home bias and euro-area bias
Institutional investors, as professional parties, typically hold geographically
diversified portfolios of marketable securities. In that way, institutional investors contribute to financial integration and risk sharing across Europe’s Capital
Markets Union and beyond. As institutional investors increase in size, they become more professional and may reduce the home bias in their investments.
This is the key hypothesis we test using our dataset.
4.5.1 Data issues
We describe our data in detail in the data annex, but we highlight a few key
issues related to the comparability of data.
Unfortunately, it is rather difficult to obtain time series on assets held by institutional investors separated as domestically and non-domestically issued.
While the OECD's Institutional Investors' Assets and Liabilities dataset may
seem to be a straightforward data source, unfortunately it is not suitable for our purposes. This dataset includes country-wide data for three types
of institutional investors (pension funds, insurance corporations,
investment funds) and various asset types22, separated whether issued by residents or not. However, we realised that a major double-counting
problem raises serious questions about the usefulness of this dataset. Specifically, some pension funds and insurance companies moved away
from the direct purchase of securities and instead purchased investment fund shares. After such a change, all holdings of investment fund shares
are regarded as ‘domestic’ if the investment fund is registered in the home country. However, since these investment funds hold a diversified portfolio
including foreign assets, such a change from direct investment to
22 The dataset also includes data on liabilities of institutional investors.

Analysis of developments in EU capital flows in the global context
October 2016 [108]
investment fund share holdings seemingly increases the home bias, even
if there was no effective change in home bias.
Unfortunately, it is not possible to approximate the investment fund’s home/foreign holding division (which can be calculated from the OECD
dataset) to allocate the pension fund holdings of investment fund shares, because pension fund investment fund shares are not broken down by the
residency of the issuer. Only the aggregate of ‘equity and investment fund shares’ holdings of pension funds is available according to the residency of
the issuer, but since pension funds likely hold domestic equities too, it is
not possible to obtain information from the OECD dataset on the pension funds’ holding of resident investment fund shares.
We therefore use the IMF's Coordinated Portfolio Investment Survey
(CPIS) for cross-border positions and we consider the total economy asset and liability positions. Unfortunately, the sectoral data of this dataset
(which include data for “insurance corporations and pension funds”) includes too many missing data and we are also unsure whether this
sectoral data suffers or not from the same double-counting problem as the
OECD’s dataset.
Therefore, we use the IMF's CPIS dataset on foreign assets and liabilities of the
total economy. Clearly, we use indicators of home bias that represent the total
economy, while we wish to assess the impact of institutional investors on home bias. Consequently, there is a discrepancy between the sectoral composition of
our dependent variable (total economy home bias) and explanatory variable (assets managed by institutional investors). This discrepancy will likely disturb
our regression results. We note, however, that in countries in which institutional investors manage relatively large assets, the home bias of institutional investors
have a significant influence on the home bias of the total economy. A reasonable strategy for our estimations would therefore be to consider only those countries
in which institutional investors manage assets which are relatively large
compared to the country’s GDP.
In order to calculate home and euro-area biases, we also need data on the total volume of outstanding debt and stock or equity market capitalisation.
For equities, a possible indicator is stock market capitalisation. Many related
studies rely on this indicator. A key advantage of this indicator is the consistent definition across countries and availability for most countries of the world.
However, stock market capitalisation may include foreign direct investment
holdings of non-residents, if the total value of the listed companies are considered, not just the shares traded publicly.
Another problem with the use of stock market capitalisation data is its possible
incompatibility with the CPIS portfolio holdings data. Mutual funds are classified as equity in the CPIS, but some of them are bond funds. For this reason, world
stock market capitalization is an insufficient match for CPIS equity data.
An alternative to the use of stock market capitalisation data is the use of the
equity data from the financial balance sheet statistics of the national accounts dataset. Financial balance sheet data includes four categories: (1) listed shares,
(2) unlisted shares, (3) other equity, and (4) investment fund shares/units. A problem with this data is the possibility of double counting: investment funds may
hold listed and unlisted shares and other equity and thereby the sum of the four categories may overstate the actual equity supply.

Analysis of developments in EU capital flows in the global context
October 2016 [109]
A further issue with the use of equity data from the national accounts dataset
(that we believe we are able to address properly) is that we are interested in portfolio equity holdings of institutional investors, while national accounts data
include all kinds of equity, including foreign direct investment claims on the home country. To address this issue, we subtracted all foreign equity claims (i.e. both
portfolio and foreign direct investment claims) on the country in question to arrive at an indicator of domestic equity holdings of residents. Then, using the
CPIS dataset, one can identify the domestic equity portfolio holdings of non-residents and add it up to domestic equity holdings of residents to obtain the total
stock of domestic (portfolio) equity.
Since neither stock market capitalisation, not equity data from the national
accounts dataset is perfect, we derive our home bias indicator using both of these versions and study both of them in our regressions analysis.
Finally, debt securities data is from BIS, ECB and for two countries (Switzerland
and Iceland) from national accounts data. Comparing the three data sources, it appears that the data is practically identical for those countries that are included
in all three datasets. We use debt securities (i.e. bonds, bills and other
commercial papers) issued by all sectors of the economy (i.e. the general government, financial corporations and non-financial corporations).
4.5.2 Our home bias and euro-area bias indicators
Following Ahearne et al (2004), we use a simple indicator of home bias in portfolio investments (i.e. we do not consider foreign direct investments). The
International Capital Asset Pricing Model (ICAPM) suggests that when asset
markets are integrated, implying that investors can buy and sell foreign securities without any restriction and without extra transaction costs, all investors should
hold the world market portfolio in which each country portfolio is weighted by its market capitalisation. A simple indicator of home bias measures the deviation
from the ICAPM benchmark, that is, one minus the ratio of the share of foreign equities in the home and world portfolios:
𝐸𝐻𝐵𝑖 = 1 −𝑆(𝐹𝐸)𝑖
𝑆(𝐹𝐸)𝑊−𝑖
𝐸𝐻𝐵𝑖: Equity home bias of country i (i.e. the indicator calculated by us) 23,
𝑆(𝐹𝐸)𝑖: Share of foreign equity securities in country i’s total equity portfolio
(which is in turn 1 minus the share of domestic portfolio equity), 𝑆(𝐹𝐸)𝑊−𝑖: Share of foreign equity in world portfolio available to country i (which is
1 minus the share of country i in total world stock/equity market capitalisation).
Since we are using two sources for domestic portfolio equity, the alternative definitions of country i’s total portfolio equity portfolio are the following:
1. When using stock market capitalisation: sum of portfolio equity assets
held abroad (CPIS data) and domestic stock market capitalisation (see sources in the annex) minus the domestic portfolio equity held by
foreigners (CPIS data); 2. When using national accounts data: sum of portfolio equity assets held
abroad (CPIS data) and domestic portfolio equity holdings of residents
23 We note again that we consider only portfolio equity holdings and do not consider foreign direct investment holdings.

Analysis of developments in EU capital flows in the global context
October 2016 [110]
(national account’s equity data minus all foreign equity claims on the
country).
𝐸𝐻𝐵𝑖 is not larger than 1. Its values can be interpreted as follows:
𝐸𝐻𝐵𝑖 = 1: Domestic investors invest 100% in domestic equity, which is the
case of complete home bias;
0 < 𝐸𝐻𝐵𝑖 < 1: Domestic investors have some home bias for domestic
equities, but they invest part of their portfolio in foreign equities (the
closer to 1, the higher the home bias);
𝐸𝐻𝐵𝑖 = 0: A neutral portfolio, in which there is no home bias: domestic
investors invest in foreign equity securities proportionally to the share of
foreign equity in world portfolio, in line with the ICAPM prediction;
𝐸𝐻𝐵𝑖 < 0: In theory, domestic investors may have a bias for holding foreign
debt securities. E.g., hypothetically, if a country which issues 10% of global equities (implying that 𝑆(𝐹𝐸)𝑊−𝑖 = 0.9) keeps 95% of its assets in
foreign equities, then 𝐸𝐻𝐵𝑖 = 1 −0.95
0.9= −0.056.
We also define an indicator measuring the euro-area bias in portfolio equity
investments (again, we do not consider foreign direct investment). This indicator
aims to measure whether the share of investments in the euro area (for non-euro area countries) or the share of investments in the rest of the euro area (for euro
area countries) in the foreign portfolio is larger than the share of euro-area assets (except home-issued securities in the case of euro countries) in total foreign
equity portfolio which is available for the country in question. The total foreign equity portfolio which is available for the country in question is the sum of equity
securities of all countries of the world excluding the country in question.
Formally,
𝐸𝐸𝐴𝐵𝑖 = 1 −𝑆(𝑁𝑜𝑛 − 𝐸𝐴𝐹𝐸)𝑖
𝑆(𝑁𝑜𝑛 − 𝐸𝐴𝐸)𝑊−𝑖
𝐸𝐸𝐴𝐵𝑖: indicator of equity euro-area bias of country i (i.e. the indicator calculated
by us);
𝑆(𝑁𝑜𝑛 − 𝐸𝐴𝐹𝐸)𝑖: share of non-euro area equity holdings in the total foreign
portfolio equity holdings of country i;
𝑆(𝑁𝑜𝑛 − 𝐸𝐴𝐸)𝑊−𝑖: share of non-euro area equity (and non-home equity in the
cases of non-euro area countries) in the total foreign equity holdings of all
countries of the world excluding country i.
That is, while the home bias indicator above considers the total portfolio of the
country, the euro area bias indicator considers only the foreign equity holdings.
𝐸𝐸𝐴𝐵𝑖 can take the following values:
𝐸𝐸𝐴𝐵𝑖=1: This is the case of complete euro-area bias, that is, the country
does not hold any non-euro area equity in its foreign portfolio, but only
euro-area portfolio equity;
0 < 𝐸𝐸𝐴𝐵𝑖 < 1: There is some bias for euro-area equities, i.e. when such
securities are held in a larger proportion than their relative supply;
𝐸𝐸𝐴𝐵𝑖=0: A neutral portfolio, in which there is no euro-area bias: the two
shares are equal, that is, the holdings of non-euro area portfolio equity in

Analysis of developments in EU capital flows in the global context
October 2016 [111]
the foreign equity portfolio of country i is proportional to the supply of
non-euro area portfolio equities;
𝐸𝐸𝐴𝐵𝑖 < 0: A bias for non-euro area securities, which is the case when a
country holds more non-euro area securities than their relative supply.
Portfolio debt securities home and euro-area biases can be defined similarly, for
which we consider debt securities (i.e. bonds, bills and other commercial papers) issued by all sectors of the economy (i.e. the general government, financial
corporations and non-financial corporations; see detailed data sources in the Annex).
The country-composition of the euro area is not constant in our sample period
due to new members joining between 2006-15. However, a constant-composition euro area aggregate is preferable. We therefore consider the only the first 12
members of the euro area (EA12)24, which countries anyway strongly dominate
equity and debt securities issued in the euro area. Furthermore, there are many missing values in the assets held in the newer euro members and therefore their
inclusion would limit our sample period.
Finally, we note that the countries considered for the definition of world supply differ for the two portfolio equity home bias indicators and for the portfolio debt
securities home bias indicator: Equity based on stock market capitalisation: we use ‘world total’ as
published by the World Federation of Exchanges;
Equity based on national accounts data: sum of 38 countries; Debt securities: sum of 42 countries.
4.5.3 Home bias and euro-area bias developments
Table 6 summarises the average level of home and euro area bias indicators in
four main country groups in 2014. The equity home bias in the euro area and in the other three older EU member states is lower than in the newer EU member
states and in non-EU advanced countries, while the euro-area bias is comparably
high in the euro-area and newer EU member states, but low in the other three older EU member states and in advanced countries. The euro area is most special
concerning debt securities: home bias is the lowest and euro-area bias is the highest among the country groups.
Therefore, it seems that euro-area membership may have promoted a lower
home bias and higher a euro-are bias in debt securities, while EU membership may have been a driving force for equities. This latter observation is in line with
the findings of Beakert et al (2013), who concluded, using industry valuation
differentials across European countries, that membership in the EU significantly lowers discount rate and expected earnings growth differentials across countries
(which are indicators of financial integration), but the adoption of the euro is not associated with increased integration.
24 The first twelve members of the euro area are: Austria, Belgium, Finland, France, Germany, Greece, Italy, Ireland, Luxembourg, the Netherlands, Portugal and Spain.
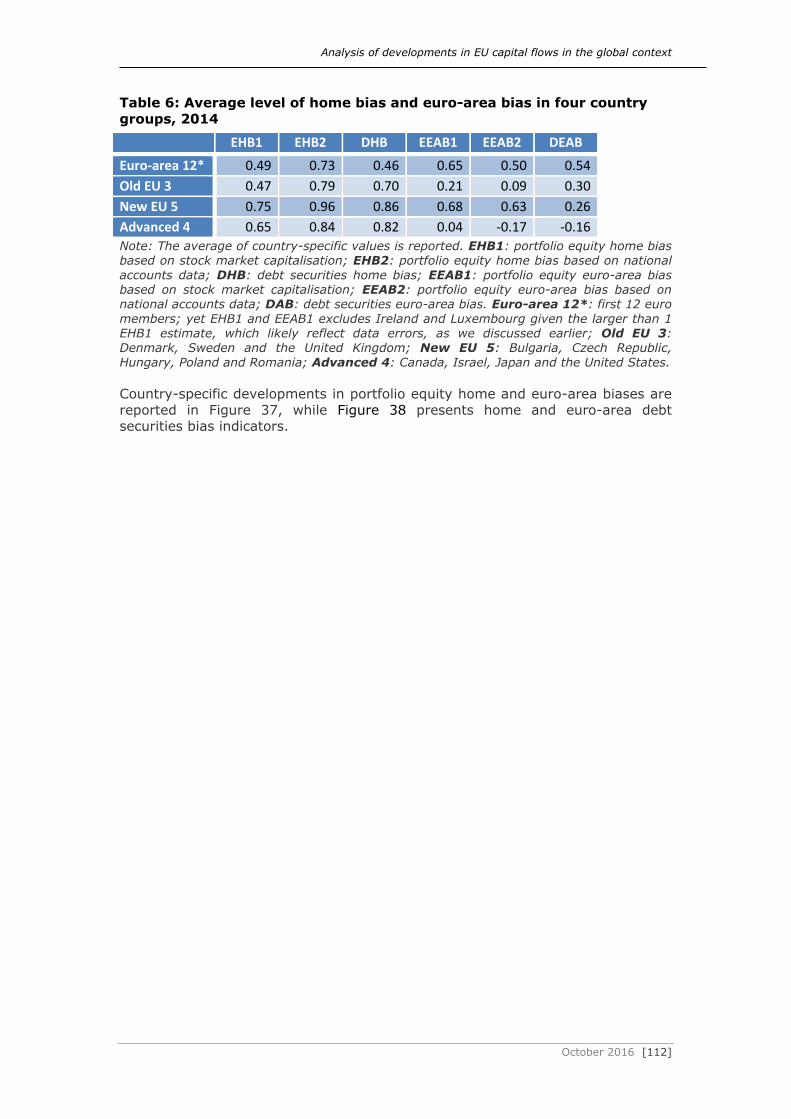
Analysis of developments in EU capital flows in the global context
October 2016 [112]
Table 6: Average level of home bias and euro-area bias in four country
groups, 2014
EHB1 EHB2 DHB EEAB1 EEAB2 DEAB
Euro-area 12* 0.49 0.73 0.46 0.65 0.50 0.54
Old EU 3 0.47 0.79 0.70 0.21 0.09 0.30
New EU 5 0.75 0.96 0.86 0.68 0.63 0.26
Advanced 4 0.65 0.84 0.82 0.04 -0.17 -0.16
Note: The average of country-specific values is reported. EHB1: portfolio equity home bias based on stock market capitalisation; EHB2: portfolio equity home bias based on national
accounts data; DHB: debt securities home bias; EEAB1: portfolio equity euro-area bias based on stock market capitalisation; EEAB2: portfolio equity euro-area bias based on national accounts data; DAB: debt securities euro-area bias. Euro-area 12*: first 12 euro
members; yet EHB1 and EEAB1 excludes Ireland and Luxembourg given the larger than 1 EHB1 estimate, which likely reflect data errors, as we discussed earlier; Old EU 3: Denmark, Sweden and the United Kingdom; New EU 5: Bulgaria, Czech Republic,
Hungary, Poland and Romania; Advanced 4: Canada, Israel, Japan and the United States.
Country-specific developments in portfolio equity home and euro-area biases are
reported in Figure 37, while Figure 38 presents home and euro-area debt securities bias indicators.

Analysis of developments in EU capital flows in the global context
October 2016 [113]
Figure 37: Portfolio equity: home and euro-area biases
-0.4
-0.2
0.0
0.2
0.4
0.6
0.8
1.0
-0.4
-0.2
0.0
0.2
0.4
0.6
0.8
1.0
02 04 06 08 10 12 14
Australia
0.3
0.4
0.5
0.6
0.7
0.8
0.9
1.0
0.3
0.4
0.5
0.6
0.7
0.8
0.9
1.0
02 04 06 08 10 12 14
Equity home bias (based on stock market capitalisation data)
Equity home bias (based on national accounts data)
Equity euro-area bias (based on stock market capitalisation data)
Equity euro-area bias (based on national accounts data)
Austria
.3
.4
.5
.6
.7
.8
.9
.3
.4
.5
.6
.7
.8
.9
02 04 06 08 10 12 14
Belgium
0.4
0.5
0.6
0.7
0.8
0.9
1.0
1.1
0.4
0.5
0.6
0.7
0.8
0.9
1.0
1.1
02 04 06 08 10 12 14
Bulgaria
-0.4
-0.2
0.0
0.2
0.4
0.6
0.8
1.0
-0.4
-0.2
0.0
0.2
0.4
0.6
0.8
1.0
02 04 06 08 10 12 14
Equity home bias (based on stock market capitalisation data)
Equity home bias (based on national accounts data)
Equity euro-area bias (based on stock market capitalisation data)
Equity euro-area bias (based on national accounts data)
Canada
-1
0
1
2
3
4
5
6
-1
0
1
2
3
4
5
6
02 04 06 08 10 12 14
Cyprus
0.0
0.2
0.4
0.6
0.8
1.0
0.0
0.2
0.4
0.6
0.8
1.0
02 04 06 08 10 12 14
Czech Republic
-0.2
0.0
0.2
0.4
0.6
0.8
1.0
-0.2
0.0
0.2
0.4
0.6
0.8
1.0
02 04 06 08 10 12 14
Equity home bias (based on stock market capitalisation data)
Equity home bias (based on national accounts data)
Equity euro-area bias (based on stock market capitalisation data)
Equity euro-area bias (based on national accounts data)
Denmark
0.2
0.3
0.4
0.5
0.6
0.7
0.8
0.9
1.0
0.2
0.3
0.4
0.5
0.6
0.7
0.8
0.9
1.0
02 04 06 08 10 12 14
Denmark
-0.2
0.0
0.2
0.4
0.6
0.8
1.0
-0.2
0.0
0.2
0.4
0.6
0.8
1.0
02 04 06 08 10 12 14
Finland
0.3
0.4
0.5
0.6
0.7
0.8
0.9
1.0
0.3
0.4
0.5
0.6
0.7
0.8
0.9
1.0
02 04 06 08 10 12 14
Equity home bias (based on stock market capitalisation data)
Equity home bias (based on national accounts data)
Equity euro-area bias (based on stock market capitalisation data)
Equity euro-area bias (based on national accounts data)
France
.4
.5
.6
.7
.8
.9
.4
.5
.6
.7
.8
.9
02 04 06 08 10 12 14
Germany
0.0
0.2
0.4
0.6
0.8
1.0
0.0
0.2
0.4
0.6
0.8
1.0
02 04 06 08 10 12 14
Greece
0.2
0.3
0.4
0.5
0.6
0.7
0.8
0.9
1.0
0.2
0.3
0.4
0.5
0.6
0.7
0.8
0.9
1.0
02 04 06 08 10 12 14
Equity home bias (based on stock market capitalisation data)
Equity home bias (based on national accounts data)
Equity euro-area bias (based on stock market capitalisation data)
Equity euro-area bias (based on national accounts data)
Hungary
-0.8
-0.4
0.0
0.4
0.8
1.2
-0.8
-0.4
0.0
0.4
0.8
1.2
02 04 06 08 10 12 14
Iceland

Analysis of developments in EU capital flows in the global context
October 2016 [114]
Figure 37 continued, Portfolio equity and debt: home and euro-area
biases
-.1
.0
.1
.2
.3
.4
.5
-20
-10
0
10
20
02 04 06 08 10 12 14
Ireland
Equity home bias based onstock market capitalisation data
is plotted on the right axis
-0.2
0.0
0.2
0.4
0.6
0.8
1.0
-0.2
0.0
0.2
0.4
0.6
0.8
1.0
02 04 06 08 10 12 14
Equity home bias (based on stock market capitalisation data)
Equity home bias (based on national accounts data)
Equity euro-area bias (based on stock market capitalisation data)
Equity euro-area bias (based on national accounts data)
Israel
.3
.4
.5
.6
.7
.8
.9
.3
.4
.5
.6
.7
.8
.9
02 04 06 08 10 12 14
Italy
-0.4
-0.2
0.0
0.2
0.4
0.6
0.8
1.0
-0.4
-0.2
0.0
0.2
0.4
0.6
0.8
1.0
02 04 06 08 10 12 14
Japan
-0.4
-0.2
0.0
0.2
0.4
0.6
0.8
1.0
1.2
-0.4
-0.2
0.0
0.2
0.4
0.6
0.8
1.0
1.2
02 04 06 08 10 12 14
Equity home bias (based on stock market capitalisation data)
Equity home bias (based on national accounts data)
Equity euro-area bias (based on stock market capitalisation data)
Equity euro-area bias (based on national accounts data)
Japan
0.1
0.2
0.3
0.4
0.5
0.6
0.7
0.8
0.9
1.0
0.1
0.2
0.3
0.4
0.5
0.6
0.7
0.8
0.9
1.0
02 04 06 08 10 12 14
Latvia
0.60
0.65
0.70
0.75
0.80
0.85
0.90
0.95
1.00
0.60
0.65
0.70
0.75
0.80
0.85
0.90
0.95
1.00
02 04 06 08 10 12 14
Lithuania
.0
.1
.2
.3
.42
6
10
14
02 04 06 08 10 12 14
Equity home bias (based on stock market capitalisation data)
Equity home bias (based on national accounts data)
Equity euro-area bias (based on stock market capitalisation data)
Equity euro-area bias (based on national accounts data)
Luxembourg
Equity home bias based onstock market capitalisation data
is plotted on the right axis
-0.4
0.0
0.4
0.8
1.2
1.6
2.0
2.4
-0.4
0.0
0.4
0.8
1.2
1.6
2.0
2.4
02 04 06 08 10 12 14
Malta
0.976
0.980
0.984
0.988
0.992
0.996
1.000
0.976
0.980
0.984
0.988
0.992
0.996
1.000
02 04 06 08 10 12 14
Malta
-.1
.0
.1
.2
.3
.4
.5
.6
.7
.8
-.1
.0
.1
.2
.3
.4
.5
.6
.7
.8
02 04 06 08 10 12 14
Equity home bias (based on stock market capitalisation data)
Equity home bias (based on national accounts data)
Equity euro-area bias (based on stock market capitalisation data)
Equity euro-area bias (based on national accounts data)
Netherlands
-0.2
0.0
0.2
0.4
0.6
0.8
1.0
-0.2
0.0
0.2
0.4
0.6
0.8
1.0
02 04 06 08 10 12 14
Norway
0.5
0.6
0.7
0.8
0.9
1.0
0.5
0.6
0.7
0.8
0.9
1.0
02 04 06 08 10 12 14
Poland
0.0
0.2
0.4
0.6
0.8
1.0
0.0
0.2
0.4
0.6
0.8
1.0
02 04 06 08 10 12 14
Equity home bias (based on stock market capitalisation data)
Equity home bias (based on national accounts data)
Equity euro-area bias (based on stock market capitalisation data)
Equity euro-area bias (based on national accounts data)
Portugal
0.91
0.92
0.93
0.94
0.95
0.96
0.97
0.98
0.99
1.00
0.91
0.92
0.93
0.94
0.95
0.96
0.97
0.98
0.99
1.00
02 04 06 08 10 12 14
Romania

Analysis of developments in EU capital flows in the global context
October 2016 [115]
Figure 37 continued, Portfolio equity: home and euro-area biases
-0.2
0.0
0.2
0.4
0.6
0.8
1.0
1.2
-0.2
0.0
0.2
0.4
0.6
0.8
1.0
1.2
02 04 06 08 10 12 14
Russia
0.4
0.5
0.6
0.7
0.8
0.9
1.0
0.4
0.5
0.6
0.7
0.8
0.9
1.0
02 04 06 08 10 12 14
Equity home bias (based on stock market capitalisation data)
Equity home bias (based on national accounts data)
Equity euro-area bias (based on stock market capitalisation data)
Equity euro-area bias (based on national accounts data)
Slovakia
0.2
0.3
0.4
0.5
0.6
0.7
0.8
0.9
1.0
0.2
0.3
0.4
0.5
0.6
0.7
0.8
0.9
1.0
02 04 06 08 10 12 14
Slovenia
0.4
0.5
0.6
0.7
0.8
0.9
1.0
0.4
0.5
0.6
0.7
0.8
0.9
1.0
02 04 06 08 10 12 14
Spain
.1
.2
.3
.4
.5
.6
.7
.8
.9
.1
.2
.3
.4
.5
.6
.7
.8
.9
02 04 06 08 10 12 14
Equity home bias (based on stock market capitalisation data)
Equity home bias (based on national accounts data)
Equity euro-area bias (based on stock market capitalisation data)
Equity euro-area bias (based on national accounts data)
Sweden
.2
.3
.4
.5
.6
.7
.8
.2
.3
.4
.5
.6
.7
.8
02 04 06 08 10 12 14
Switzerland
-0.2
0.0
0.2
0.4
0.6
0.8
1.0
-0.2
0.0
0.2
0.4
0.6
0.8
1.0
02 04 06 08 10 12 14
United Kingdom
-0.6
-0.4
-0.2
0.0
0.2
0.4
0.6
0.8
1.0
-0.6
-0.4
-0.2
0.0
0.2
0.4
0.6
0.8
1.0
02 04 06 08 10 12 14
Equity home bias (based on stock market capitalisation data)
Equity home bias (based on national accounts data)
Equity euro-area bias (based on stock market capitalisation data)
Equity euro-area bias (based on national accounts data)
United States
Source: Authors’ calculations as discussed in the main text.

Analysis of developments in EU capital flows in the global context
October 2016 [116]
Figure 38: Portfolio debt securities: home and euro-area biases
-0.2
0.0
0.2
0.4
0.6
0.8
1.0
-0.2
0.0
0.2
0.4
0.6
0.8
1.0
02 04 06 08 10 12 14
Debt securities home bias
Debt securities euro-area bias
Australia
.40
.44
.48
.52
.56
.60
.40
.44
.48
.52
.56
.60
02 04 06 08 10 12 14
Debt securities home bias
Debt securities euro-area bias
Austria
.3
.4
.5
.6
.7
.8
.3
.4
.5
.6
.7
.8
02 04 06 08 10 12 14
Debt securities home bias
Debt securities euro-area bias
Belgium
.0
.1
.2
.3
.4
.5
.6
.7
.8
.9
.0
.1
.2
.3
.4
.5
.6
.7
.8
.9
02 04 06 08 10 12 14
Debt securities home bias
Debt securities euro-area bias
Bulgaria
-0.4
-0.2
0.0
0.2
0.4
0.6
0.8
1.0
-0.4
-0.2
0.0
0.2
0.4
0.6
0.8
1.0
02 04 06 08 10 12 14
Debt securities home bias
Debt securities euro-area bias
Canada
-.1
.0
.1
.2
.3
.4
.5
.6
.7
-.1
.0
.1
.2
.3
.4
.5
.6
.7
02 04 06 08 10 12 14
Debt securities home bias
Debt securities euro-area bias
Cyprus
.2
.3
.4
.5
.6
.7
.8
.9
.2
.3
.4
.5
.6
.7
.8
.9
02 04 06 08 10 12 14
Debt securities home bias
Debt securities euro-area bias
Czech Republic
.2
.3
.4
.5
.6
.7
.8
.9
.2
.3
.4
.5
.6
.7
.8
.9
02 04 06 08 10 12 14
Debt securities home bias
Debt securities euro-area bias
Denmark
-2.0
-1.5
-1.0
-0.5
0.0
0.5
1.0
-2.0
-1.5
-1.0
-0.5
0.0
0.5
1.0
02 04 06 08 10 12 14
Debt securities home bias
Debt securities euro-area bias
Denmark
.2
.3
.4
.5
.6
.7
.2
.3
.4
.5
.6
.7
02 04 06 08 10 12 14
Debt securities home bias
Debt securities euro-area bias
Finland
.44
.48
.52
.56
.60
.64
.68
.44
.48
.52
.56
.60
.64
.68
02 04 06 08 10 12 14
Debt securities home bias
Debt securities euro-area bias
France
.40
.45
.50
.55
.60
.65
.70
.75
.40
.45
.50
.55
.60
.65
.70
.75
02 04 06 08 10 12 14
Debt securities home bias
Debt securities euro-area bias
Germany
-0.4
-0.2
0.0
0.2
0.4
0.6
0.8
1.0
-0.4
-0.2
0.0
0.2
0.4
0.6
0.8
1.0
02 04 06 08 10 12 14
Debt securities home bias
Debt securities euro-area bias
Greece
0.0
0.2
0.4
0.6
0.8
1.0
0.0
0.2
0.4
0.6
0.8
1.0
02 04 06 08 10 12 14
Debt securities home bias
Debt securities euro-area bias
Hungary
0.0
0.2
0.4
0.6
0.8
1.0
0.0
0.2
0.4
0.6
0.8
1.0
02 04 06 08 10 12 14
Debt securities home bias
Debt securities euro-area bias
Iceland

Analysis of developments in EU capital flows in the global context
October 2016 [117]
Figure 38 continued, Portfolio debt securities: home and euro-area biases
.08
.12
.16
.20
.24
.28
.32
.36
.08
.12
.16
.20
.24
.28
.32
.36
02 04 06 08 10 12 14
Debt securities home bias
Debt securities euro-area bias
Ireland
-0.4
-0.2
0.0
0.2
0.4
0.6
0.8
1.0
-0.4
-0.2
0.0
0.2
0.4
0.6
0.8
1.0
02 04 06 08 10 12 14
Debt securities home bias
Debt securities euro-area bias
Israel
.2
.3
.4
.5
.6
.7
.8
.9
.2
.3
.4
.5
.6
.7
.8
.9
02 04 06 08 10 12 14
Debt securities home bias
Debt securities euro-area bias
Italy
-0.2
0.0
0.2
0.4
0.6
0.8
1.0
-0.2
0.0
0.2
0.4
0.6
0.8
1.0
02 04 06 08 10 12 14
Debt securities home bias
Debt securities euro-area bias
Japan
-.4
-.2
.0
.2
.4
.6
-.4
-.2
.0
.2
.4
.6
02 04 06 08 10 12 14
Debt securities home bias
Debt securities euro-area bias
Latvia
.1
.2
.3
.4
.5
.6
.7
.8
.1
.2
.3
.4
.5
.6
.7
.8
02 04 06 08 10 12 14
Debt securities home bias
Debt securities euro-area bias
Lithuania
-.3
-.2
-.1
.0
.1
.2
.3
.4
.5
-.3
-.2
-.1
.0
.1
.2
.3
.4
.5
02 04 06 08 10 12 14
Debt securities home bias
Debt securities euro-area bias
Luxembourg
-.05
.00
.05
.10
.15
.20
.25
.30
.35
-.05
.00
.05
.10
.15
.20
.25
.30
.35
02 04 06 08 10 12 14
Debt securities home bias
Debt securities euro-area bias
Malta
.30
.35
.40
.45
.50
.55
.60
.65
.30
.35
.40
.45
.50
.55
.60
.65
02 04 06 08 10 12 14
Debt securities home bias
Debt securities euro-area bias
Netherlands
.0
.1
.2
.3
.4
.5
.6
.0
.1
.2
.3
.4
.5
.6
02 04 06 08 10 12 14
Debt securities home bias
Debt securities euro-area bias
Norway
0.1
0.2
0.3
0.4
0.5
0.6
0.7
0.8
0.9
1.0
0.1
0.2
0.3
0.4
0.5
0.6
0.7
0.8
0.9
1.0
02 04 06 08 10 12 14
Debt securities home bias
Debt securities euro-area bias
Poland
.2
.3
.4
.5
.6
.7
.8
.2
.3
.4
.5
.6
.7
.8
02 04 06 08 10 12 14
Debt securities home bias
Debt securities euro-area bias
Portugal
0.1
0.2
0.3
0.4
0.5
0.6
0.7
0.8
0.9
1.0
0.1
0.2
0.3
0.4
0.5
0.6
0.7
0.8
0.9
1.0
02 04 06 08 10 12 14
Debt securities home bias
Debt securities euro-area bias
Romania

Analysis of developments in EU capital flows in the global context
October 2016 [118]
Figure 38 continued, Portfolio debt securities: home and euro-area biases
0.0
0.2
0.4
0.6
0.8
1.0
0.0
0.2
0.4
0.6
0.8
1.0
02 04 06 08 10 12 14
Debt securities home bias
Debt securities euro-area bias
Russia
0.3
0.4
0.5
0.6
0.7
0.8
0.9
1.0
0.3
0.4
0.5
0.6
0.7
0.8
0.9
1.0
02 04 06 08 10 12 14
Debt securities home bias
Debt securities euro-area bias
Slovakia
.40
.45
.50
.55
.60
.65
.70
.75
.40
.45
.50
.55
.60
.65
.70
.75
02 04 06 08 10 12 14
Debt securities home bias
Debt securities euro-area bias
Slovenia
.4
.5
.6
.7
.8
.9
.4
.5
.6
.7
.8
.9
02 04 06 08 10 12 14
Debt securities home bias
Debt securities euro-area bias
Spain
.1
.2
.3
.4
.5
.6
.7
.8
.1
.2
.3
.4
.5
.6
.7
.8
02 04 06 08 10 12 14
Debt securities home bias
Debt securities euro-area bias
Sweden
.10
.15
.20
.25
.30
.35
.40
.45
.10
.15
.20
.25
.30
.35
.40
.45
02 04 06 08 10 12 14
Debt securities home bias
Debt securities euro-area bias
Switzerland
.1
.2
.3
.4
.5
.6
.7
.1
.2
.3
.4
.5
.6
.7
02 04 06 08 10 12 14
Debt securities home bias
Debt securities euro-area bias
United Kingdom
-0.6
-0.4
-0.2
0.0
0.2
0.4
0.6
0.8
1.0
-0.6
-0.4
-0.2
0.0
0.2
0.4
0.6
0.8
1.0
02 04 06 08 10 12 14
Debt securities home bias
Debt securities euro-area bias
United States
Source: Authors’ calculations as discussed in the main text.
Figure 37 and Figure 38 show rather diverse levels and developments of both
home and euro-area biases.
In some euro members the equity euro-area bias has increased throughout the sample period of 2001-14 (Austria, Greece, Italy), while in others this bias is
already high at the beginning of our sample period (Belgium, Germany, Portugal) and changes little. Yet in Finland and the Netherlands equity euro-area bias
remains relatively low and therefore there is no uniform development within the euro area in terms of portfolio equity euro-area bias.
While the home bias is much higher in the central and eastern European non-euro members of the European Union, there is a high level of euro-bias in these
countries (Bulgaria, Czech Republic and Hungary; unfortunately many data is missing for Poland and Romania). This probably reflects that political, economic
and financial links also boost the share of euro area in foreign asset holdings.
In the three other EU countries, Denmark, Sweden and the United Kingdom, there is a low level of euro-area bias, while home bias in terms of portfolio equity

Analysis of developments in EU capital flows in the global context
October 2016 [119]
is broadly similar to most euro-members, while debt home bias is much higher
than in the euro-area.
Non-EU countries are generally characterised by a higher level of home bias than EU countries. This suggests that EU membership fosters financial integration and
perhaps reduces information barriers which sometimes limit cross-country diversification, which is in line with the findings of Beakert et al (2013) as we
highlighted before. It is also notable that the euro-area bias of non-EU countries is relatively close to zero. Key exceptions are Russia’s meaningful debt euro-area
bias, Turkey’s fluctuating but generally positive equity and debt euro-are bias,
and Argentina’s and the US negative debt euro area bias. These differences likely indicate the regional proximity is a factor in allocating the foreign securities
portfolio.
We highlight that so far we reported indicators on the home bias of each country as a whole, but not risk sharing within a country. For example, in the introduction
to this chapter we summarised a number of articles concluding that there is considerable risk-sharing within the United States, while our indices are
informative on the domestic/foreign division of assets holdings of the United
States (and all other countries). In order to compare better the home bias vis-à-vis the rest of the world of the United States and the euro area, we calculate the
home bias of the euro area as if the euro area was a single country. That is, we consolidate intra-euro area claims and regard those claims as ‘domestic claims’
from the perspective of the euro-area 12 aggregate and consider only non-euro foreign claims as ‘foreign’ claims from the perspective of the euro area 12
aggregate. We do the same consolidation for intra-euro area liabilities. The total market capitalisation of the euro area 12 aggregate is simply the sum of market
capitalisations of the 12 countries. By calculating these “consolidated” euro area
12 aggregates, we can calculate the home bias of the euro area 12 group using our expressions, as if the euro area 12 was a single country.
Figure 39 reports remarkable similarity of the euro area 12 as a whole and the
United States in terms of equity home bias, while there is a higher level of debt home bias in the United States than in the euro area 12 group. As expected, the
home bias of the euro area 12 as a whole is higher than the average of country-specific home biases of the 12 countries (see the latter in Table 6).
Figure 39: Home bias in the euro area as a whole and in the United States
0.4
0.5
0.6
0.7
0.8
0.9
1.0
0.4
0.5
0.6
0.7
0.8
0.9
1.0
02 04 06 08 10 12 14
Euro area 12
United States
Equity home bias(based on stock market capitalisation data)
0.4
0.5
0.6
0.7
0.8
0.9
1.0
0.4
0.5
0.6
0.7
0.8
0.9
1.0
02 04 06 08 10 12 14
Euro area 12
United States
Equity home bias(based on national accounts data)
0.4
0.5
0.6
0.7
0.8
0.9
1.0
0.4
0.5
0.6
0.7
0.8
0.9
1.0
02 04 06 08 10 12 14
Euro area 12
United States
Debt home bias

Analysis of developments in EU capital flows in the global context
October 2016 [120]
4.6 Panel regression analysis: the determinants of home bias
Our regression estimates explore if the size of the assets managed by
institutional investors contributes to the home bias. Our main hypothesis is that the larger the assets managed by institutional investors, the smaller the home
bias and thereby the larger the scope for risk sharing, ceteris paribus.
We estimate variants of the following regression:
𝑓(𝐸𝐻𝐵𝑖,𝑡) = 𝛼 + 𝛾𝑖 + 𝛿𝑡 + 𝛽𝐴𝑆𝑆𝐸𝑇𝑆𝑖,𝑡 + 𝜽𝑿𝒊,𝒕 + 휀𝑖,𝑡,
where: 𝐸𝐻𝐵𝑖,𝑡 is one of the two indicators of the equity home bias of country i in
time t, 𝐴𝑆𝑆𝐸𝑇𝑆𝑖,𝑡 is the share of institutional investors’ assets in the GDP of
country i in time t, 𝑿𝒊,𝒕 denotes control variables, and 휀𝑖,𝑡 is the residual. 𝛼 is the
general constant, 𝛾𝑖 is the country-specific fixed effect, 𝛿𝑡 is the time-specific fixed
effect, 𝛽 and the vector 𝜽 are parameters to be estimated.
𝑓(. ) indicates a function to transform the home bias indicator. We note that 𝐸𝐻𝐵𝑖,𝑡
typically takes values between zero and one, while the bulk of the explanatory
variables are in principle unbounded from above, which may render a standard
specification invalid. However, in our assessment the consequences of the limited range of the dependent variable is not so important and we note that many
published articles did not address this problem. We therefore estimate two versions, one which does not consider this problem and one which addresses it,
and we will compare the results between these two options: In one version the (untransformed) home bias indicator is the dependent
variable, i.e. 𝑓(𝑥) = 𝑥;
In a second version we use a logistic transformation, 𝑓(𝑥) = 𝑙𝑜𝑔 (𝑥
1−𝑥). By
definition, the logistic transformation disregards cases when 𝐸𝐻𝐵𝑖,𝑡 ≤ 0
(which cases are rare in our dataset) and 𝐸𝐻𝐵𝑖,𝑡 ≥ 1. We note that
𝐸𝐻𝐵𝑖,𝑡 = 1 is a theoretical possibility, but it does not appear in our dataset,
while in a few cases 𝐸𝐻𝐵𝑖,𝑡 > 1 (Cyprus, Ireland and Luxembourg equity
home bias based on stock market capitalisation), which probably reflects
data problems.
We estimate the same model for debt securities home bias.
We use the total assets managed by all three types of institutional investors, that is, the sum of assets managed by pension funds, insurance corporations and
investment funds. The relative importance of these funds varies across countries. For example, as demonstrated Figure 31, the share of pension fund assets in GDP
is very close to zero in France, while France has the third highest insurance
corporations’ assets relative to GDP after Luxembourg and Ireland (Figure 32). The sum of the assets of the three types of investors represents the total volume
of assets which may influence the country-wide home bias, which is our dependent variable in the regressions.
We consider the following control variables: GDP per capita relative to the US: it measures the level of development,
which may proxy several factors influencing the ability of a country to
diversify its asset holding, such as economic development, institutional quality, investor protection or average education level in the country. The
expected sign of the estimated parameter is negative.

Analysis of developments in EU capital flows in the global context
October 2016 [121]
Financial Development Index, which is a sub-component of the World
Economic Forum’s Global Competitiveness Index: it may proxy the many factors that influence the size of capital markets. A higher financial
development may encourage investors to invest nationally rather than abroad, thereby the expected sign of the parameter estimate is positive.
The share of exports of goods and services to GDP: it measures the openness of the country to trade. More trade openness may influence
cross-border asset diversification and hence the expected sign of the estimated parameter is negative.
Domestic market capitalisation relative to home GDP: the availability of
domestically issued securities may also influence home bias: a country with larger home stock of securities may diversify less, and therefore the
expected sign of the estimated parameter is positive. For the three home bias indicators we use the corresponding domestic market capitalisation
data: o Equity based on stock market: stock market capitalisation;
o Equity based on national accounts: equity data from national accounts;
o Debt securities: total outstanding stock of domestic debt securities
by all sectors (government, financial corporations, and non-financial corporations).
Foreign market capitalisation relative to home GDP: the availability of foreign issued securities may also influence home bias, e.g. foreign supply
of securities is smaller from the perspective of United States than from the perspective of Estonia. The expected sign of the estimated parameter is
negative. For the three home bias indicators we use the corresponding foreign market capitalisation data:
o Equity based on stock market: stock market capitalisation;
o Equity based on national accounts: equity data from national accounts;
o Debt securities: total outstanding stock of domestic debt securities by all sectors (government, financial corporations, and non-
financial corporations). Pension fund foreign investment restrictions index: more restrictive
financial regulation should lead to home bias, and thereby the expected sign of the estimated parameter is positive. While this index refers to
pension funds only, it may be indicative on possible restrictions for
insurance corporations and investment funds too. Euro-area bias: since Figure 37 suggested that euro-area bias is important
for euro-area countries and its increase went hand-in-hand with the decline of home bias, we include the euro-area bias only for euro-area
countries. A negative estimated parameter would indicate that euro-area bias reduces home bias.
In order to test the marginal contribution of the euro-area bias to the regression
result, we estimate a version of the regression without this variable and another
version with this variable.
An important consideration relates to the use of fixed effects. Without fixed effects, the explanatory variables are bound to explain all cross-country and
cross-time variation. However, there could be important country-specific factors not included in the model, and there could be general trends through time across
all countries, which can be controlled by the addition of country and period fixed effects. We therefore estimate model variants both with and without fixed effects.
We include in the regression 25 countries:

Analysis of developments in EU capital flows in the global context
October 2016 [122]
18 European Union countries: Austria, Belgium, Czech Republic, Denmark,
Estonia, Finland, Germany, Greece, Hungary, Italy, Lithuania, Netherlands, Portugal, Slovakia, Slovenia, Spain, Sweden, United
Kingdom; 7 non-EU countries: Canada, Iceland, Israel, Japan, Russia, Switzerland,
United States.
Among the EU countries, we do not include in the regression: Four countries for which the pension fund restriction index cannot be
calculated: Croatia, Cyprus, France and Latvia;
Four additional countries for which assets of insurance corporations and/or investment funds are not available: Bulgaria, Malta, Poland and
Romania (we note that data on assets is not available for Cyprus either); Ireland and Luxembourg, given that these countries are financial centres
and have asset ratios to GDP which are several factors higher than in other countries and therefore these countries are special cases.
For three types of home bias indicators and two types of functional form, the
following six tables include the result, starting with the portfolio equity home
bias, our main focus. For each of these six options we report eight versions of the regression (depending on whether euro area-bias, financial development index
and fixed effects are included or not). Thereby, we report the results of 48 regression estimates.
Table 7: Panel regression results: untransformed portfolio equity home bias based on stock market capitalisation data
(1) (2) (3) (4) (5) (6) (7) (8)
Assets -0.07 -0.08 -0.06 -0.015 -0.08 -0.09 -0.08 -0.04
[t-ratio] [-9.7] [-9.4] [-1.6] [-0.4] [-11] [-10.3] [-2.4] [-1.3]
(p-value) (0.000) (0.000) (0.117) (0.673) (0.000) (0.000) (0.016) (0.180)
GDP per capita -0.76 -0.51 -0.28 -0.09 -0.72 -0.52 -0.58 -0.44
[t-ratio] [-11.6] [-6.3] [-1.2] [-0.3] [-11] [-6.7] [-3.2] [-1.9]
(p-value) (0.000) (0.000) (0.220) (0.759) (0.000) (0.000) (0.001) (0.065)
Financial market dev. 0.02 0.01 -0.02 -0.001
[t-ratio] [1.2] [0.7] [-0.6] [0]
(p-value) (0.233) (0.493) (0.526) (0.983)
Exports -0.19 -0.22 -0.38 -0.37 -0.27 -0.28 -0.48 -0.50
[t-ratio] [-4.1] [-5.7] [-2.5] [-2.5] [-6] [-7.6] [-4.9] [-5.1]
(p-value) (0.000) (0.000) (0.013) (0.013) (0.000) (0.000) (0.000) (0.000)
Home market cap. 0.24 0.15 0.21 0.15 0.25 0.17 0.22 0.16
[t-ratio] [8.5] [5.3] [4.2] [3.9] [10.9] [8] [5.1] [5]
(p-value) (0.000) (0.000) (0.000) (0.000) (0.000) (0.000) (0.000) (0.000)
World market cap. -0.56 -0.81 -0.43 -0.62 -0.36 -0.60 -0.33 -0.60
[t-ratio] [-5.2] [-6] [-0.7] [-1] [-3.3] [-5.1] [-0.7] [-1.3]
(p-value) (0.000) (0.000) (0.476) (0.315) (0.001) (0.000) (0.493) (0.210)
Pension fund restriction 0.13 0.14 -0.03 -0.02 0.09 0.10 -0.02 -0.04
[t-ratio] [3.6] [5] [-0.6] [-0.4] [3.3] [3.7] [-0.6] [-1.4]
(p-value) (0.000) (0.000) (0.558) (0.716) (0.001) (0.000) (0.524) (0.154)
-0.24 0.19 -0.21 0.10
[-6] [1.6] [-6] [1.1]
(p-value) (0.000) (0.105) (0.000) (0.252)
fixed effects no no yes yes no no yes yes
R2 0.66 0.66 0.90 0.90 0.64 0.64 0.91 0.91
N.o. time periods 9 9 9 9 14 14 14 14
N.o. countries 25 25 25 25 25 25 25 25
N.o. total observations 178 168 178 168 225 215 225 215
Euro-area bias (for euro
area countries only)

Analysis of developments in EU capital flows in the global context
October 2016 [123]
Note: OLS with robust standard errors. The dependent variable is portfolio equity home bias based on stock market capitalisation data. Four explanatory variables are included
relative to (home) GDP: (1) assets of institutional investors; (2) exports of goods and services; (3) home stock market capitalisation; (4) world stock market capitalisation excluding the home stock market. World stock market capitalisation excluding the home stock market relative to home GDP is divided by 10000. GDP per capita at purchasing
power parity is relative to the United States. Where indicated, both cross-section and period fixed effects are included. The values in squared brackets below the parameter estimates are the t-ratios (rounded to one digit after the decimal), and in round brackets
are the p-values (rounded to three digits after the decimal).
Table 8: Panel regression results: logistic transformation of portfolio
equity home bias based on stock market capitalisation data
Note: The dependent variable is the logistic transformation of portfolio equity home bias based on stock market capitalisation data. A logistic transformation is applied to the euro-area bias indicator too. See other notes to Table 7.
(9) (10) (11) (12) (13) (14) (15) (16)
Assets -0.35 -0.37 -0.33 -0.09 -0.38 -0.39 -0.41 -0.18
[t-ratio] [-8.9] [-8.4] [-1.7] [-0.5] [-10.3] [-10.2] [-2.4] [-1.2]
(p-value) (0.000) (0.000) (0.093) (0.597) (0.000) (0.000) (0.019) (0.213)
GDP per capita -4.49 -4.24 -2.36 -1.21 -4.61 -4.40 -3.68 -2.66
[t-ratio] [-9.8] [-10] [-2] [-0.9] [-9.3] [-8.9] [-3.5] [-2.1]
(p-value) (0.000) (0.000) (0.053) (0.386) (0.000) (0.000) (0.001) (0.035)
Financial market dev. 0.00 0.00 -0.01 0.09
[t-ratio] [0] [0] [0] [0.5]
(p-value) (0.974) (0.977) (0.970) (0.623)
Exports -1.17 -1.24 -1.15 -1.10 -1.52 -1.55 -2.89 -2.95
[t-ratio] [-4.2] [-4.2] [-1.5] [-1.5] [-5.9] [-6] [-4] [-4.1]
(p-value) (0.000) (0.000) (0.125) (0.131) (0.000) (0.000) (0.000) (0.000)
Home market cap. 1.26 1.15 1.12 0.81 1.26 1.16 1.18 0.87
[t-ratio] [6.3] [6] [4.2] [3.9] [8.9] [8.9] [5] [4.9]
(p-value) (0.000) (0.000) (0.000) (0.000) (0.000) (0.000) (0.000) (0.000)
World market cap. -3.27 -3.41 -1.04 -2.25 -2.45 -2.60 -0.24 -1.65
[t-ratio] [-5.5] [-5.4] [-0.4] [-0.8] [-4.7] [-4.8] [-0.1] [-0.8]
(p-value) (0.000) (0.000) (0.707) (0.416) (0.000) (0.000) (0.909) (0.416)
Pension fund restriction 1.51 1.52 -0.06 0.03 1.15 1.12 0.03 -0.06
[t-ratio] [4.5] [4.8] [-0.2] [0.1] [4.2] [4.2] [0.2] [-0.3]
(p-value) (0.000) (0.000) (0.824) (0.899) (0.000) (0.000) (0.877) (0.746)
-0.25 0.26 -0.19 0.20
[-3.2] [2.1] [-2.8] [2]
(p-value) (0.002) (0.040) (0.006) (0.045)
fixed effects no no yes yes no no yes yes
R2 0.59 0.59 0.93 0.93 0.57 0.57 0.92 0.92
N.o. time periods 9 9 9 9 14 14 14 14
N.o. countries 25 25 25 25 25 25 25 25
N.o. total observations 178 168 178 168 225 215 225 215
Euro-area bias (for euro
area countries only)

Analysis of developments in EU capital flows in the global context
October 2016 [124]
Table 9: Panel regression results: untransformed portfolio equity home
bias based on national accounts equity data
Note: The dependent variable is portfolio equity home bias based on national accounts equity data. World market capitalisation is also based on national accounts data. See other notes to Table 7.
(17) (18) (19) (20) (21) (22) (23) (24)
Assets -0.04 -0.04 -0.02 -0.004 -0.04 -0.05 -0.03 -0.02
[t-ratio] [-12.9] [-13.2] [-1.6] [-0.4] [-14.6] [-14.1] [-2.4] [-1.5]
(p-value) (0.000) (0.000) (0.105) (0.681) (0.000) (0.000) (0.017) (0.137)
GDP per capita -0.33 -0.30 0.02 0.19 -0.31 -0.28 -0.10 0.03
[t-ratio] [-12] [-10.6] [0.1] [1.4] [-12.4] [-11] [-1] [0.4]
(p-value) (0.000) (0.000) (0.895) (0.154) (0.000) (0.000) (0.318) (0.724)
Financial market dev. 0.001 0.0004 -0.01 -0.0004
[t-ratio] [0.2] [0.1] [-0.6] [0]
(p-value) (0.864) (0.955) (0.570) (0.981)
Exports -0.05 -0.05 0.07 0.07 -0.08 -0.08 0.06 0.03
[t-ratio] [-3.1] [-3.5] [1.6] [1.5] [-5.5] [-6] [1.5] [0.8]
(p-value) (0.003) (0.001) (0.102) (0.136) (0.000) (0.000) (0.143) (0.400)
Home market cap. 0.02 0.02 0.04 0.03 0.02 0.02 0.05 0.05
[t-ratio] [4.8] [4.1] [6.3] [5.9] [4.6] [3.8] [6.4] [5.7]
(p-value) (0.000) (0.000) (0.000) (0.000) (0.000) (0.000) (0.000) (0.000)
World market cap. -0.01 -0.03 0.15 0.19 -0.01 -0.03 0.20 0.23
[t-ratio] [-0.7] [-1.6] [2.3] [2.6] [-0.7] [-1.7] [2.9] [3.2]
(p-value) (0.500) (0.117) (0.025) (0.012) (0.469) (0.083) (0.004) (0.002)
Pension fund restriction 0.03 0.03 0.03 0.04 0.01 0.01 0.01 0.00
[t-ratio] [2] [1.8] [1.2] [1.2] [0.9] [0.6] [0.6] [0]
(p-value) (0.047) (0.073) (0.252) (0.234) (0.354) (0.577) (0.541) (0.982)
-0.04 0.16 -0.04 0.12
[-3.8] [5.3] [-4.3] [3.8]
(p-value) (0.000) (0.000) (0.000) (0.000)
fixed effects no no yes yes no no yes yes
R2 0.79 0.79 0.96 0.96 0.77 0.77 0.95 0.95
N.o. time periods 9 9 9 9 14 14 14 14
N.o. countries 25 25 25 25 25 25 25 25
N.o. total observations 176 166 176 166 221 211 221 211
Euro-area bias (for euro
area countries only)

Analysis of developments in EU capital flows in the global context
October 2016 [125]
Table 10: Panel regression results: logistic transformation of portfolio
equity home bias based on national accounts equity data
Note: The dependent variable is the logistic transformation of portfolio equity home bias based on national accounts equity data. World market capitalisation is also based on national accounts data. A logistic transformation is applied to the euro-area bias indicator
too. See other notes to Table 7.
(25) (26) (27) (28) (29) (30) (31) (32)
Assets -0.26 -0.25 -0.13 -0.08 -0.26 -0.26 -0.18 -0.12
[t-ratio] [-13.7] [-10.6] [-1.2] [-0.8] [-13.7] [-11.4] [-1.6] [-1]
(p-value) (0.000) (0.000) (0.218) (0.419) (0.000) (0.000) (0.115) (0.306)
GDP per capita -4.08 -4.11 -1.72 -0.17 -4.32 -4.29 -2.66 -1.22
[t-ratio] [-8.8] [-8.7] [-1.3] [-0.1] [-9.1] [-8.9] [-2.2] [-1.2]
(p-value) (0.000) (0.000) (0.196) (0.882) (0.000) (0.000) (0.030) (0.238)
Financial market dev. -0.02 0.02 -0.11 -0.09
[t-ratio] [-0.2] [0.3] [-1.1] [-0.8]
(p-value) (0.833) (0.764) (0.275) (0.427)
Exports -0.39 -0.35 -0.27 -0.33 -0.63 -0.62 -2.00 -2.17
[t-ratio] [-2] [-1.6] [-0.6] [-0.7] [-3.4] [-3.1] [-2.9] [-3.1]
(p-value) (0.043) (0.108) (0.558) (0.511) (0.001) (0.002) (0.004) (0.003)
Home market cap. 0.21 0.20 0.31 0.29 0.19 0.19 0.38 0.36
[t-ratio] [3.8] [3.4] [5.1] [4.8] [3.7] [3.6] [5] [4.5]
(p-value) (0.000) (0.001) (0.000) (0.000) (0.000) (0.000) (0.000) (0.000)
World market cap. -0.52 -0.47 0.75 0.91 -0.49 -0.49 2.45 2.68
[t-ratio] [-3] [-2.6] [1] [1.1] [-3.4] [-3.4] [3] [3.1]
(p-value) (0.003) (0.010) (0.333) (0.261) (0.001) (0.001) (0.004) (0.002)
Pension fund restriction 1.18 1.22 0.37 0.42 0.86 0.86 0.33 0.28
[t-ratio] [3.5] [3.7] [1.5] [1.6] [3.3] [3.3] [1.6] [1.3]
(p-value) (0.001) (0.000) (0.131) (0.115) (0.001) (0.001) (0.105) (0.185)
-0.01 0.24 -0.01 0.25
[-0.2] [4.6] [-0.3] [4.5]
(p-value) (0.848) (0.000) (0.771) (0.000)
fixed effects no no yes yes no no yes yes
R2 0.69 0.69 0.97 0.97 0.67 0.67 0.94 0.94
N.o. time periods 9 9 9 9 14 14 14 14
N.o. countries 25 25 25 25 25 25 25 25
N.o. total observations 176 166 176 166 221 211 221 211
Euro-area bias (for euro
area countries only)

Analysis of developments in EU capital flows in the global context
October 2016 [126]
Table 11: Panel regression results: untransformed portfolio debt
securities home bias
Note: The dependent variable is portfolio debt securities home bias based. World market capitalisation is based on debt securities data. See other notes to Table 7.
(33) (34) (35) (36) (37) (38) (39) (40)
Assets -0.06 -0.10 -0.06 -0.063 -0.05 -0.10 -0.07 -0.06
[t-ratio] [-5.8] [-9] [-2.5] [-2.4] [-5.2] [-9.3] [-2.7] [-2.3]
(p-value) (0.000) (0.000) (0.014) (0.017) (0.000) (0.000) (0.008) (0.023)
GDP per capita -0.67 -0.43 -0.38 -0.55 -0.54 -0.38 -0.76 -0.76
[t-ratio] [-5.8] [-5.9] [-1.6] [-1.8] [-5.7] [-6.5] [-3.1] [-2.6]
(p-value) (0.000) (0.000) (0.118) (0.067) (0.000) (0.000) (0.002) (0.010)
Financial market dev. 0.03 -0.01 -0.03 -0.030
[t-ratio] [1.5] [-0.4] [-1.3] [-1.3]
(p-value) (0.141) (0.691) (0.203) (0.204)
Exports -0.21 -0.10 0.06 0.04 -0.29 -0.16 0.06 0.04
[t-ratio] [-2.7] [-1.8] [0.5] [0.3] [-4.1] [-3.1] [0.8] [0.6]
(p-value) (0.008) (0.069) (0.651) (0.752) (0.000) (0.002) (0.435) (0.559)
Home market cap. 0.16 0.20 0.18 0.17 0.14 0.19 0.11 0.10
[t-ratio] [8] [11.3] [4.9] [5] [7.6] [10.8] [3.6] [3.2]
(p-value) (0.000) (0.000) (0.000) (0.000) (0.000) (0.000) (0.001) (0.001)
World market cap. -0.86 -1.42 -0.96 -0.90 -0.66 -1.25 -0.98 -0.82
[t-ratio] [-5.1] [-9.6] [-3.1] [-3] [-3.8] [-7.4] [-2.9] [-2.4]
(p-value) (0.000) (0.000) (0.002) (0.004) (0.000) (0.000) (0.005) (0.015)
Pension fund restriction 0.03 -0.02 0.15 0.13 0.04 0.03 0.09 0.07
[t-ratio] [0.6] [-0.8] [2.1] [1.9] [0.9] [0.9] [2.3] [1.7]
(p-value) (0.567) (0.445) (0.039) (0.060) (0.351) (0.367) (0.022) (0.086)
-0.51 -0.08 -0.49 -0.06
[-10.5] [-1.1] [-12.1] [-0.6]
(p-value) (0.000) (0.287) (0.000) (0.549)
fixed effects no no yes yes no no yes yes
R2 0.69 0.69 0.96 0.96 0.66 0.66 0.95 0.95
N.o. time periods 9 9 9 9 14 14 14 14
N.o. countries 25 25 25 25 25 25 25 25
N.o. total observations 182 175 182 175 228 221 228 221
Euro-area bias (for euro
area countries only)

Analysis of developments in EU capital flows in the global context
October 2016 [127]
Table 12: Panel regression results: logistic transformation of portfolio
debt securities home bias
Note: The dependent variable is the logistic transformation of debt securities home bias. World market capitalisation is based on debt securities data. A logistic transformation is applied to the euro-area bias indicator too. See other notes to Table 7.
The results provide strong support for our main hypothesis: the larger assets managed by institutional investors the lower the home bias and thereby the
greater the scope for risk sharing. All 48 estimated parameters have a negative sign and most of them are statistically significantly different from zero.
The parameter estimates of the control variables are in line with our expectations.
Higher GDP per capita seems to reduce home bias: only three of the 48 estimates have a positive sign and none of these positive estimates are
significant, while most of the negative parameter estimates are statistically significant.
On the other hand, results for the Financial Development Index (which may capture effects similar to GDP per capita) are less encouraging: the
parameter estimate is never significant and the sign of the estimated
parameter varies. The most likely reason for this result is the strong correlation between the Financial Development Index and GDP per capita
relative to the United States. In a simple panel regression, in which the Financial Development Index is regressed on GDP per capita relative to the
US, the estimated parameter is very significantly positive with a t-ratio of 12.7. This suggests that there is high level of multicollinearity between
(41) (42) (43) (44) (45) (46) (47) (48)
Assets -0.31 -0.37 -0.30 -0.28 -0.25 -0.36 -0.42 -0.37
[t-ratio] [-5.5] [-5.9] [-2.3] [-2] [-4.4] [-5.5] [-2.7] [-2.2]
(p-value) (0.000) (0.000) (0.022) (0.045) (0.000) (0.000) (0.007) (0.026)
GDP per capita -3.89 -3.97 -2.38 -3.70 -3.35 -3.48 -4.24 -4.69
[t-ratio] [-5.1] [-5.6] [-1.7] [-2.2] [-5] [-5.8] [-3] [-2.9]
(p-value) (0.000) (0.000) (0.093) (0.032) (0.000) (0.000) (0.003) (0.004)
Financial market dev. 0.18 0.10 -0.14 -0.06
[t-ratio] [1.5] [0.8] [-1] [-0.5]
(p-value) (0.125) (0.420) (0.331) (0.633)
Exports -0.49 -0.36 1.36 1.14 -0.99 -0.71 0.56 0.40
[t-ratio] [-1] [-0.7] [1.4] [1.2] [-2.2] [-1.6] [0.9] [0.6]
(p-value) (0.338) (0.472) (0.165) (0.215) (0.029) (0.113) (0.361) (0.535)
Home market cap. 0.99 1.08 0.97 0.65 0.86 1.01 0.46 0.22
[t-ratio] [7.3] [7.9] [4.9] [3] [6.7] [7.6] [2.1] [1.2]
(p-value) (0.000) (0.000) (0.000) (0.003) (0.000) (0.000) (0.033) (0.229)
World market cap. -4.47 -5.57 -1.12 0.95 -3.16 -4.60 -1.19 0.96
[t-ratio] [-3.9] [-4.7] [-0.7] [0.7] [-2.6] [-3.6] [-0.5] [0.5]
(p-value) (0.000) (0.000) (0.491) (0.515) (0.010) (0.000) (0.605) (0.632)
Pension fund restriction 0.34 0.26 0.35 0.10 0.43 0.46 0.32 0.18
[t-ratio] [1.3] [0.9] [1.1] [0.3] [1.6] [1.8] [1.4] [0.8]
(p-value) (0.206) (0.350) (0.269) (0.743) (0.102) (0.075) (0.162) (0.435)
-1.15 0.33 -1.27 0.33
[-3.2] [2.8] [-4.2] [3.1]
(p-value) (0.001) (0.005) (0.000) (0.002)
fixed effects no no yes yes no no yes yes
R2 0.42 0.42 0.97 0.97 0.38 0.38 0.96 0.96
N.o. time periods 9 9 9 9 14 14 14 14
N.o. countries 25 25 25 25 25 25 25 25
N.o. total observations 182 171 182 171 228 217 228 217
Euro-area bias (for euro
area countries only)

Analysis of developments in EU capital flows in the global context
October 2016 [128]
these two variables and therefore it is not wise to include both of them in
the same regression. Since GDP per capita proved to be a more robust explanatory variable than the Financial Development Index, we included
the latter variable in the first four versions of the regression in each table and dropped it from final four versions.
Higher trade openness is negatively associated with home bias: only twelve of the 48 parameter estimates are positive and none of these
positive estimates are significant, while most of the negative parameter estimates are statistically significant. This finding is consistent with the
argument that it is cross-border trade integration to drive financial
integration. Home market capitalisation is positively related to home bias: all 48
estimates have a positive sign and 47 estimates are statistically significant from zero. Therefore, the availability of domestically issued securities
influences the home bias: countries with larger home stock of securities diversify less.
The results of the availability of rest of the world securities are more mixed: while the estimated parameter is negative (as expected) when
portfolio equity home bias based on stock market capitalisation is used
(Table 7 and Table 8) and more than half of these estimates are statistically significant, for the national accounts data based portfolio
equity home bias parameter are sometimes negative and while sometime positive, and both of these signs are statistically significant (Table 9 and
Table 10). The parameter tends to be negative (as expected) for debt home bias (Table 11 and Table 12).
Our estimates tend to suggest that our new pension fund foreign restriction index is positively related to home bias, that is, in countries
with more restrictions home bias is higher, as expected: only six of the 48
estimated resulted in a negative parameter. The results for euro-area bias are mixed: when fixed effects are not
included, the parameter estimate of euro-area bias is always negative and statistically significant in most cases. However, when fixed effects are
included, all but one of the euro-area bias parameter estimates turn to positive, which is not surprising given that country-fixed effects can
capture euro-area specific effects too. Intuition suggests that the elimination of currency risk should boost cross-country investments,
especially in debt securities.

Analysis of developments in EU capital flows in the global context
October 2016 [129]
4.8 Data annex for Section 4
Assets of institutional investors are collected from a variety of sources in
order to achieve the widest coverage possible.
-Pension funds
Main source:
Global Pension Statistics, from the OECD; the data appears in the publication
“Pension Markets in Focus, 2015 edition” (http://www.oecd.org/finance/private-pensions/globalpensionstatistics.htm).
Dataset: Funded Pensions Indicators; Pension Plan Type: Total, by pension plan type; Definition Type: Total, by definition type; Contract Type: Pension funds
(autonomous); Variable: INVESTMENT; Indicator: Assets as a Share of GDP;
Unit: Percentage.
Additional sources:
Institutional Investors’ Assets and Liabilities, from the OECD (https://stats.oecd.org/Index.aspx?DataSetCode=QASA_7II).
Sector: Pension funds; Transaction: Financial assets; Measure: $, current prices, current exchange rates, end of period.
Structural Financial Indicators, from the ECB
(https://sdw.ecb.europa.eu/browse.do?node=9691551).
SSI.A.XX.1252.T10.1.U6.Z01.E
Dataset name: Banking structural statistical indicators; Frequency: Annual; Structural statist indicator: Total assets; Data type: Outstanding amounts at the
end of the period (stocks); Counterpart area: Domestic (home or reference area); Currency of transaction: All currencies combined; Series denominat/spec
calcul: Euro
Insurance corporations and pension funds statistics, ECB
(http://sdw.ecb.europa.eu/browse.do?node=9691121).
ICPF.A.XX.N.V.LE.N_F.S1252.A1.S.1.N.E.Z
Dataset name: Insurance Corporations & Pension Funds Statistics; Frequency: Annual; Adjustment indicator: Neither seasonally nor working day adjusted;
Valuation: Current prices; Transactions and other flows: Closing balance sheet;
Asset/instr classification: Total Assets (financial and non-financial); Counterpart area: World (all entities); Counterpart institution sector: Total economy including
Rest of the World (all sectors); Uses and resources: Debit (uses/assets); Consolidation: Non-consolidated; Denomination: Euro; Reference table
number: Not applicable (Z)
-Insurance corporations
Main source:
Institutional Investors’ Assets and Liabilities, from the OECD
(https://stats.oecd.org/Index.aspx?DataSetCode=QASA_7II). Sector: Insurance corporations; Transaction: Financial assets; Measure: $,
current prices, current exchange rates, end of period.

Analysis of developments in EU capital flows in the global context
October 2016 [130]
Additional sources:
Structural Financial Indicators, from the ECB
(https://sdw.ecb.europa.eu/browse.do?node=9691551). SSI.A.XX.1251.T10.1.U6.Z01.E
Dataset name: Banking structural statistical indicators; Frequency: Annual;
Structural statist indicator: Total assets; Data type: Outstanding amounts at the end of the period (stocks); Counterpart area: Domestic (home or reference
area); Currency of transaction: All currencies combined; Series denominat/spec
calcul: Euro
Insurance corporations and pension funds statistics, ECB (http://sdw.ecb.europa.eu/browse.do?node=9691121).
ICPF.A.XX.N.V.LE.N_F.S1251.A1.S.1.N.E.Z
Dataset name: Insurance Corporations & Pension Funds Statistics; Frequency: Annual; Adjustment indicator: Neither seasonally nor working day adjusted;
Valuation: Current prices; Transactions and other flows: Closing balance sheet;
Asset/instr classification: Total Assets (financial and non-financial); Counterpart area: World (all entities); Counterpart institution sector: Total economy including
Rest of the World (all sectors); Uses and resources: Debit (uses/assets); Consolidation: Non-consolidated; Denomination: Euro; Reference table
number: Not applicable (Z)
-Investment Funds
Institutional Investors’ Assets and Liabilities, from the OECD
(https://stats.oecd.org/Index.aspx?DataSetCode=QASA_7II). Sector: Investment Funds; Transaction: Financial assets; Measure: $, current
prices, current exchange rates, end of period.
Additional sources:
Investment funds balance sheet statistics, ECB (http://sdw.ecb.europa.eu/browse.do?node=9691120).
IVF.Q.XX.N.T0.T00.A.1.Z5.0000.Z01.E
Dataset name: Investment Funds Balance Sheet Statistics; Frequency: Quarterly;
Adjustment indicator: Neither seasonally nor working day adjusted; Investment funds reporting sector: Total investment funds; Investment funds item: Total
assets/liabilities; Original maturity: Total; Data type: amounts at the end of the period (stocks); Counterpart area: World not allocated (geographically); BS
counterpart sector: Unspecified counterpart sector; Currency of transaction: All currencies combined; Balance sheet suffix: Euro.
Swiss National Bank, Swiss open collective capital investments (https://data.snb.ch/en/topics/finma#!/cube/capcollvf).
Claims and liabilities: Total assets; Key figures: Total.
Asset Management Survey, the Investment Association (http://www.theinvestmentassociation.org/investment-industry-
information/research-and-publications/asset-management-survey/previous-surveys.html). The series used is “Assets under management in the UK”.
*Values in EUR and CHF are converted into USD using end of year exchange rates obtained from the ECB and SNB databases.

Analysis of developments in EU capital flows in the global context
October 2016 [131]
Debt Securities
Main Source:
Debt securities statistics, from the Bank of International Settlements (http://stats.bis.org/bis-stats-
tool/org.bis.stats.ui.StatsApplication/StatsApplication.html).
Q:XX:3P:Y:1:1:A:A:TO1:A:A:A:A:A:I, where XX is the country code and Y stands
for the sector: 2 for General Government, B for Financial corporations and J for Non-financial corporations.
Issue type: All issue types; Default risk: All credit ratings; Collateral type: All issues; Issuer nationality: All countries excluding residents; Issuer sector –
ultimate borrower: All issuers; Issue markets: All markets; Issue currency: All currencies; Original maturity: All maturities; Remaining maturity: All maturities;
Rate type: All rate types; Measure: Amounts outstanding.
For Iceland and Switzerland:
Financial Balance Sheets, ESA 2010 (Unconsolidated) from Eurostat
[nasa_10_f_bs] ( http://appsso.eurostat.ec.europa.eu/nui/show.do?dataset=nasa_10_f_bs&lang=e
n). UNIT: Million euro; CO_NCO: Non-consolidated; SECTOR: Total economy;
FINPOS: Liabilities; NA_ITEM: Debt securities
Stock Market Capitalization
World Development Indicators, from the World Bank (original source in World
Federation of Exchanges).
National Accounts (equity)
Main source:
Financial Balance Sheets, SNA 2008 (non-nconsolidated) from the OECD
(http://stats.oecd.org/#). Dataset: 720. Financial balance sheets - non consolidated - SNA 2008; Sector:
Total economy; Measure: US $, current prices, current exchange rates, end of period; Transaction: Financial liabilities, Equity and investment fund shares/units
(AF5).
Dataset: 720. Financial balance sheets - non consolidated - SNA 2008; Sector: Rest of the world; Measure: US $, current prices, current exchange rates, end of
period; Transaction: Financial assets, Equity and investment fund shares/units
(AF5).
Additional sources:
Financial Balance Sheets, ESA 2010 (Unconsolidated) from Eurostat [nasa_10_f_bs] (
http://appsso.eurostat.ec.europa.eu/nui/show.do?dataset=nasa_10_f_bs&lang=en).
UNIT: Million euro; CO_NCO: Non-consolidated; SECTOR: Total economy; FINPOS: Liabilities; NA_ITEM: Equity and investment fund shares

Analysis of developments in EU capital flows in the global context
October 2016 [132]
UNIT: Million euro; CO_NCO: Non-consolidated; SECTOR: Rest of the world;
FINPOS: Assets; NA_ITEM: Equity and investment fund shares
Japan
Financial Balance Sheets, SNA 1993 (Unconsolidated) from the OECD (http://stats.oecd.org/#).
Dataset: 720. Financial balance sheets - non consolidated; Sector: Total
economy; Measure: US $, current prices, current exchange rates, end of period;
Transaction: Financial liabilities, Shares and other equity.
Dataset: 720. Financial balance sheets - non consolidated; Sector: Rest of the world; Measure: US $, current prices, current exchange rates, end of period;
Transaction: Financial assets, Shares and other equity.
Australia
Financial Balance Sheets, SNA 2008 (Consolidated) from the OECD
(http://stats.oecd.org/#).
Dataset: 710. Financial balance sheets - consolidated - SNA 2008; Sector(s): Non-financial corporations, Financial corporations, General Government,
Households and NPISH (summed); Measure: US $, current prices, current exchange rates, end of period; Transaction: Financial liabilities, Equity and
investment fund shares/units (AF5).
Dataset: 710. Financial balance sheets - consolidated - SNA 2008; Sector: Rest of
the world; Measure: US $, current prices, current exchange rates, end of period; Transaction: Financial assets, Equity and investment fund shares/units (AF5).
Russia
Financial Balance Sheets, SNA 2008 (Unconsolidated) form the Bank of Russia (https://www.cbr.ru/eng/statistics/?PrtId=fafbs).
Sector: Total economy (S1); Liabilities, Equity and investment fund shares/units
(AF5).
Sector: Rest of the World (S2); Financial assets, Equity and investment fund
shares/units (AF5).
*For the stock market capitalization, we consider the item Listed (Equity) liabilities of the Total Economy sector.
*For domestic equity holdings of residents, we consider equity and investment
fund shares/units liabilities of the total economy sector minus equity and
investment fund shares/units assets of the rest of the world sector.
*Values in EUR are converted into USD using end of year exchange rates obtained from the ECB SDW database. Values in RUB are converted into USD
using end of year exchange rates obtained from the IMF’s International Financial Statistics.
Exchange Rates
RUB/USD: International Financial Statistics from the IMF (CD-ROM, August 2016).

Analysis of developments in EU capital flows in the global context
October 2016 [133]
[SERIES_CODE: 922..AG.ZF...]
USD/CHF: Foreign exchange rates from the Swiss National Bank
(https://data.snb.ch/en/topics/ziredev#!/cube/devkum). End of month (December).
EUR/USD: Exchange Rates from the ECB
(https://sdw.ecb.europa.eu/browseSelection.do?type=series&ec=&rc=&oc=&df=&SERIES_KEY=120.EXR.A.USD.EUR.SP00.E&dc=&cv=&node=SEARCHRESULTS&
q=EXR.A.USD.EUR.SP00.E&pb=&trans=N).
Dataset name: Exchange Rates; Frequency: Annual; Currency: US dollar;
Currency denominator: Euro; Exchange rate type: Spot; Series variation - EXR context: End-of-period
GDP and GDP per capita
World Economic Outlook, International Monetary Fund (April 2016 edition)
(https://www.imf.org/external/pubs/ft/weo/2016/01/weodata/weoselgr.aspx).
Gross domestic product, current prices; USD
Gross domestic product based on purchasing-power-parity (PPP) per capita GDP;
Current international dollar
Exports
World Development Indicators, World Bank
(http://databank.worldbank.org/data/reports.aspx?source=world-development-indicators#).
Exports of goods and services (current US$)
Financial Development Index
The Global Competitiveness Index, World Economic Forum
(http://reports.weforum.org/global-competitiveness-index/downloads/).
*The overall score in the “8th pillar: Financial market development” is considered.
Pension Fund regulation index
The index is based on the: Annual Survey of Investment Regulation of Pension Funds database from the OECD (http://www.oecd.org/finance/private-
pensions/annualsurveyofinvestmentregulationofpensionfunds.htm).

Analysis of developments in EU capital flows in the global context
October 2016 [134]
References
Adam, K., K. Pei and M, Albert (2011) ‘House Price Booms and the Current Account’, NBER Working Paper No. 17224
Afonso, Antonio and Furceri Davide (2007), ‘Business Cycle Sychronization and
Insurance Mechanisms in the EU’, ECB Working Paper Series No. 844
Aggarwal, Reena, Leora Klapper and Peter D. Wysocki (2005), ‘Portfolio preferences of foreign institutional investors’, Journal of Banking and Finance,
29(12), 2919–2946.
Ahearne, Alan G., William L. Griever and Francis E. Warnock (2004) ‘Information costs and home bias: an analysis of US holdings of foreign equities’, Journal of
International Economics 62, 313–336
Aizenman, J. and J. Yothin (2009) ‘Current Account Patterns and National Real Estate Markets’, Journal of Urban Economics 66(2), 75-89
Alcidi, C. and D. Gros (2013) 'Country adjustment to a ‘sudden stop’: does the
euro make a difference?’, European Commission Economic Papers 492, April
Anderson, Christopher W., Mark Fedenia, Mark Hirschey and Hilla Skiba (2011), ‘Cultural Influences on Home Bias and International Diversification by Institutional
Investors’, Journal of Banking and Finance, 35(4), 916-934.
Angeloni, Ignazio, Agnès Bénassy-Quéré, Benjamin Carton, Christophe Destais, Zsolt Darvas, Jean Pisani-Ferry, André Sapir, and Shahin Vallée (2011), ‘Global
currencies for tomorrow: a European perspective’, July 2011, Bruegel Blueprint Volume XIII.
Asdrubali, Pierfederico, Bent E. Sorensen and Oved Yosha (1996), ‘Channels of
Interstate Risk Sharing: United States 1963-1990’, The Quarterly Journal of Economics, Volume 111, Issue 4 (Nov.,1996), 1081-110.
Baele, L., Ferrando, A., Hördal, P, Krylova, E. and Cyril Monnet (2004) –
“Measuring financial integration in the Euro area”, ECB Occasional Paper Series No. 14, April
Bayoumi, T., L. Jaewoo and Jayanthi, S. (2006) ‘New Rates from New Weights’,
IMF Staff Papers 53(2), 272-305 http://www.imf.org/External/Pubs/FT/staffp/2006/02/pdf/bayoumi.pdf
Bekaert, Geert, Campbell R. Harvey, Christian T. Lundblad and Stephan Siegel
(2013) ‘The European Union, the Euro, and equity market integration’, Journal of Financial Economics 109(3), 583-603.
Becker, Torbjorn, Daniel Daianu, Zsolt Darvas, Vladimir Gligorov, Michael
Landesmann, Pavle Petrovic, Jean Pisani-Ferry, Darius Rosati, André Sapir and Beatrice Weder Di Mauro (2010) ‘Whither growth in central and eastern Europe?
Policy lessons for an integrated Europe’, Bruegel Blueprint Series, Volume XI
Blanchard, O. and Francesco, G. (2002) ‘Current Account Deficits in the Euro Area. The End of the Feldstein Horioka Puzzle?’, Brookings Papers on Economic

Analysis of developments in EU capital flows in the global context
October 2016 [135]
Activity, Economic Studies Program, The Brookings Institution, vol. 33(2), pages
147-210
Blanchard, O. and F. Giavazzi (2002) – “Current account deficits in the Euro area:
the end of the Feldstein-Horioka puzzle?”, Brookings
Borio, C. (2012) ‘The financial cycle and macroeconomics: what have we learnt?’, BIS working paper n.395, December
Borio, C. and P. Disyatat (2011), ‘Global imbalances and the financial crisis: Link
or no link?’, BIS Working Papers No 346, Monetary and Economic Department, May
Borio, C., M. Drehmann and Tsatsaronis, K. (2012) ‘Characterising the financial
cycle: don’t lose sight of the medium term!’, BIS working paper n. 380, June
Borio, C., R. McCauley and McGuire, P. (2011) ‘Global credit and domestic credit booms’, BIS Quarterly Review, September
Brent E. Sørensen and Oved Yosha (1998) ‘International risk sharing and
European monetary unification’, Journal of International Economics, 45, 211-238.
Brunnermeier, M., B. Eichengreen, El-Erian, M., A. Fraga, De Gregorio, J., T. Ito, Pisani-Ferry, J., P. Lane, Prasad, E., R. Rajan, Ramos, M., H. Rey, Rodrik, D., K.
Rogoff, Shin H. S., A. Velasco, Weder di Mauro B., Y. Yongding (2012) ‘Banks and international capical flows: policy challenges and regulatory responses’, CEPR,
September
Bruno, V. and H. S. Shin (2012), ‘Capital Flows and the Risk-Taking Channel of Monetary Policy,’ paper for the 11th BIS Annual Conference, June 21-22
Cerutti, E., S. Claessens, and Laeven, L. (2015) “The Use and Effectiveness of
Macroprudential Policies: New Evidence”, IMF Working Paper WP/15/61
Chan, Kalok, Vicentiu Covrig and Lilian Ng (2005), ‘What Determines the Domestic Bias and Foreign Bias? Evidence from Mutual Fund Equity Allocations
Worldwide’, The Journal of Finance, LX(3), 1495-1534.
Chen, R., G. M. Milesi-Ferretti and T. Tressel (2013) ‘External Imbalances in the Euro Area’, Economic Policy 28(73), 101–142
Chinn, Menzie D. and Hiro Ito (2006) ‘What matters for financial development?
Capital controls, institutions, and interactions’, Journal of Development Economics, 81(1), 163-192 (weblink)
Chitu, L., B. Eichengreen and Mehl, A. (2013) History, Gravity and International
Finance (January 2013). NBER Working Paper No. w18697.
Claessens, S., G. Swat and Mihet, R. (2013) ‘Macroprudential Policies to Mitigate Financial System Vulnerabilities’, Journal of International Money and Finance,
39:153–185
Claeys, G. and Z. Darvas (2015) ‘The financial stability risks of ultra-loose monetary policy’, 26 March, Bruegel Policy Contribution 2015/03

Analysis of developments in EU capital flows in the global context
October 2016 [136]
Coeurdacier, Nicolas, Hélène Rey and Pablo Winant (2015) ‘Financial Integration
and Growth in a Risky World’, NBER Working Paper No. 21817
Cohen-Setton, J. (2015) ‘Reserves depletion and quantitative tightening’, Bruegel
blog 21 September 2015, http://bruegel.org/2015/09/reserves-depletion-and-
quantitative-tightening/
Columba, F., A. Costa, Kongsamut, P. C. Lim, Otani, A., M. Saiyid, Wezel, T. and
Wu, X. (2011) ‘Macroprudential Policy: what instruments and how to use them?
Lessons from country experiences’, IMF Working Paper 11/238
Constâncio, V. (2015) ‘Strengthening macroprudential policy in Europe’ - Speech
at the Conference on ‘The macroprudential toolkit in Europe and credit flow
restrictions’, organised by Lietuvos Bankas, Vilnius, July
Dabrowski, M. (2015) ‘The slow-reform trap’, Bruegel blog contribution,
accessible under http://bruegel.org/2015/06/the-slow-reform-trap/
Dabrowski, Marek (2014) ‘Ukraine: Can meaningful reform come out of conflict?’, Bruegel Policy Contribution 2014/08
Darvas, Z. (2012a) ‘Intra-Euro rebalancing is inevitable, but insufficient’, Bruegel
Policy Contribution, 2012/15
Darvas, Z. (2012b), ‘The euro crisis: ten roots, but fewer solutions’, Bruegel Policy Contribution, 2012/17
Darvas, Z. and G. Szapáry (2008), ‘Euro Area Enlargement and Euro Adoption
Strategies’, European Economy, Economic Papers 304, February
Darvas, Z. and S. Merler (2013) – ‘The ECB in the age of Banking Union’, Bruegel Policy Contribution
Darvas, Z., C. De Sousa, Huettl, P., S. Merler and Walsh, T. (2014) ‘Analysis of
developments in EU capital flows in the global context’, Study for the DG MARKT of the European Commission, http://bruegel.org/wp-
content/uploads/imported/publications/Analysis_of_developments_in_EU.pdf
Darvas, Zsolt, Pia Hüttl, Silvia Merler and Thomas Walsh (2015) ‘Analysis of developments in EU capital flows in the global context – second annual report’,
Study for the DG FISMA of the European Commission, http://bruegel.org/wp-content/uploads/2016/01/151103-study_en.pdf
Darvas, Zsolt (2015) ‘Does money matter in the euro area? Evidence from a new
Divisia index’, Economics Letters 133, 123-126
EBCI Vienna Initiative (2015) ‘CESEE Deleveraging and credit monitor’, accessible under https://www.imf.org/external/np/pp/eng/2015/062915.pdf
ECB (2016) ‘Financial stability report’, May.
Edison, Hali J. and Francis E. Warnock (2004), ‘U.S. investors’ Emerging Market
Equity Portfolios: A Security Level Analysis’, The Review of Economics and Statistics, 86, Pages 691-704

Analysis of developments in EU capital flows in the global context
October 2016 [137]
Eller, M., Huber, F. And H. Schuberth (2016) ‘Understanding the drivers of caital
flows into the CESEE countries’, Focus on European Economic Integration Q2/16
European Commission (2012) ‘Current account surpluses in the EU’, European
Economy 9/2012
European Commission (2013) ‘The Economic Adjustment Programme for Cyprus’, Occasional Papers 149, May
European Commission (2015) ‘Green Paper: Building a Capital Markets Union’,
COM(2015)63, February
Favilukis, J., D. Kohn, Ludvigson, S. C. and S. Van Nieuwerburgh, (2012) ‘International Capital Flows and House Prices: Theory and Evidence’, NBER
Working Paper No. 17751
Fidora, Michael, Marcel Fratzscher and Christian Thimann (2006) ‘Home bias in global bond and equity markets. The role of real exchange rate volatility’,
Working Paper No. 685, European Central Bank
Furceri, Davide and Aleksandra Zdzienicka (2013) ‘The Euro Area Crisis: Need for a Supranational Fiscal Risk Sharing Mechanism?’, IMF Working Paper WP/13/198.
Giavazzi, F. and L. Spaventa (2010) ‘Why the current account may matter in a
monetary union: Lessons from the financial crisis in the Euro area,’ CEPR Discussion Papers 8008, C.E.P.R. Discussion Papers
Giucci, R. and G. Zachmann (2014), ‘Eastern promises: The IMF-Ukraine bailout’,
Bruegel, http://www.bruegel.org/nc/blog/detail/article/1288-eastern-promises-the-imf-ukraine-bailout/
Gourinchas, P. O., H. Rey and Govillot, N. (2010) ‘Exorbitant Privilege and
Exorbitant Duty’, IMES Discussion Paper Series 10-E-20, Institute for Monetary and Economic Studies, Bank of Japan
Gourinchas, P. O., H. Rey and Truempler, K. (2011) ‘The Financial Crisis and The
Geography of Wealth Transfers,’ NBER Working Papers 17353, National Bureau of Economic Research
Gros, D. (2012) ‘Macroeconomic Imbalances in the Euro Area: Symptom or cause
of the crisis?’ CEPS Policy Brief, No. 266, April
Gros, D. and C. Alcidi (2013), ‘Country adjustment to a ‘sudden stop’: Does the euro make a difference?’, European Economy. Economic Papers 492, April,
Brussels
Hale, G. and M. Obstfeld (2014) ‘The Euro and the Geography of International Debt Flows’, NBER Working Paper No. 20033
Hale, G. and M. Obstfeld (2014), ‘The euro and the geography of international
debt flows’, Working Paper Series 2014-10, Federal Reserve Bank of San Francisco.
Hartmann, P. (2015) ‘Real Estate Markets and Macroprudential Policy in Europe’,
ECB Working Paper Series 1796/May 2015

Analysis of developments in EU capital flows in the global context
October 2016 [138]
Hau, Harald and Helene Rey (2008), ‘Home Bias at the Fund Level’, American
Economic Review, 98(2), 333-38.
Heada, K. and T. Mayer (2014) ‘Gravity Equations: Workhorse, Toolkit, and
Cookbook’, Chapter 3 in Handbook of International Economics, vol IV, edited by
Gopinath, G, E. Helpman and Rogoff, K. pages 131-195
Hobza, Alexandr and Stefan Zeugner (2014a) ‘The ‘imbalanced balance’ and its
unravelling: current accounts and bilateral financial flows in the euro area‘,
European Economy- Economic Papers 520, July 2014, Directorate-General for Economic and Financial Affairs, European Commission
Hobza, Alexandr and Stefan Zeugner (2014b) ‘Current accounts and financial
flows in the euro area’, Journal of International Money and Finance 48, 291-313
Hüttl, Pia (2014), ‘Negative deposit rates: The Danish experience’, Bruegel blog,
http://www.bruegel.org/nc/blog/detail/article/1339-negative-deposit-rates-the-
danish-experience/
IMF (2009) ‘Balance of Payments and International Investment Position Manual’,
6th edition
IMF (2014a) ‘Request for a stand-by arrangement – staff report, supplement, staff statement, press release, and statement by the executive director for
Ukraine’, IMF Country Report No. 14/106, April
IMF (2014b) ‘Emerging Market volatitility: lessons from the taper tandrum’, IMF Staff Discussion Note, SDN/14/09
IMF (2016) ‘Understanding the slowdown in capital flows to emerging markets’,
Chapter 2 in ‘World Economic Outlook: too slow for too long’, April
Ingram, J. C. (1973) ‘The case for European monetary integration,’ Essays in International Finance 98, Princeton University
Kalemli-Ozcan, E. S. Papaioannou and Peydró, J. L. (2010) ‘What lies beneath
the euro's effect on financial integration? Currency risk, legal harmonization, or trade?’, Journal of International Economics 81, 75-88
Kubelec, C. and F. Sá (2012),’The Geographical Composition of National External
Balance Sheets: 1980-2005’, International Journal of Central Banking, June
Lane, Philip R. (2013) ‘Capital Flows in the Euro Area,’ European Economy - Economic Papers 497, Directorate General Economic and Monetary Affairs (DG
ECFIN), European Commission
Lane, Philip R. and G. M. Milesi-Ferretti (2007) ‘The external wealth of nations mark II: Revised and extended estimates of foreign assets and liabilities, 1970–
2004’, Journal of International Economics 73(2), 223–250
Lane, Philip R. and G. M. Milesi-Ferretti (2008) ‘The Drivers of Financial Globalization,’ The Institute for International Integration Studies Discussion Paper
Series iiisdp238, IIIS

Analysis of developments in EU capital flows in the global context
October 2016 [139]
Lane, Philip R. and G. M. Milesi-Ferretti (2009) ‘Where did all the borrowing go? a
forensic analysis of the U.S. external position’, Journal of the Japanese and International Economies, 23(2):177–199
Lane, Philip R. and G. Milesi-Ferretti (2003) ‘International Financial Integration’,
IIIS Discussion Papers n. 3, January
Lane, Philip R. and J. C. Shambaugh (2010) ‘Financial Exchange Rates and
International Currency Exposures’, American Economic Review 100(1), 518-540
Lane, Philip R. and P. McQuade (2012) ‘Domestic Credit Growth and International Capital Flows’, mimeo, Trinity College Dublin
Lane, Philip R. and P. McQuade (2013) ‘Domestic credit growth and International
capital flows’, ECB working papers n. 1566, July
Lane, Philip R. and P. McQuade (2013) ‘Domestic Credit Growth and International Capital Flows,’ The Institute for International Integration Studies Discussion Paper
Series iiisdp428, IIIS
Lucas, R. (1990) ‘Why doesn’t capital flow from Rich to Poor Countries?’, American Economic Review 80(2), 92-96
Mayer, T. and S. Zignago (2011) ‘Notes on CEPII’s distances measures: The
GeoDist database’, CEPII Working Paper No 2011–25
Mendoza, E. (2010) ‘Sudden Stops, Financial Crises, and Leverage,’ American Economic Review, American Economic Association 100(5), 1941-66
Mendoza, E. and M. E. Terrones (2012) ‘An Anatomy of Credits Booms and their
Demise,’ Journal Economia Chilena (The Chilean Economy), Central Bank of Chile, vol. 15(2), pages 04-32, August
Merler, S. (2014) – “ Home-(Sweet-Home)-Bias and other stories”, Bruegel Blog,
January
Merler, S. and J. Pisani-Ferry, (2012). ‘Sudden Stops in The Euro Area’, Bruegel Policy Contribution, March 2012/06
Merler, S., and J. Pisani-Ferry, (2012) ‘Who’s afraid of government bonds?’
Milesi-Ferretti, G. M. and C. Tille, (2011) ‘The Great Retrenchment: International Capital Flows During the Global Financial Crisis’. Working Papers 382011, Hong
Kong Institute for Monetary Research
Milesi-Ferretti, G. M., N. T. Tamirisa and Strobbe, F. (2010) ‘Bilateral Financial Linkages and Global Imbalances,’ IMF Working Papers 10/257, International
Monetary Fund
Mitra Pritha (2011) ‘Capital Flows to EU New Member States: Does Sector Destination Matter?’, IMF Working Paper, WP/11/67, March

Analysis of developments in EU capital flows in the global context
October 2016 [140]
Obstfeld, Maurice and K. Rogoff (2005), ‘Global Current Account Imbalances and
Exchange Rate Adjustments,’ Brookings Papers on Economic Activity, Economic Studies Program, The Brookings Institution, vol. 36(1), pages 67-146
Okawa, Yohei and E. Van Wincoop (2012) ‘Gravity in International Finance’,
Journal of International Economics 87, 205-215
Portes, Richard and H. Rey (2005) ‘The determinants of cross-border equity
flows’, Journal of Financial Economics 65, 269–296
Reis, R. (2013) ‘The Portuguese Slump and Crash and the Euro Crisis’, Brookings Papers on Economic Activity, forthcoming
Rose, A., (2000) ‘One Money One Market: Estimating the Effects of Common
Currencies on Trade’, Economic Policy (15), 9-48
Rubbaniy, Ghulame, Iman van Lelyveld and Willem F. C. Verschoor (2014), ‘Home Bias and Dutch Pension Funds’ Investment Behavior’, The European
Journal of Finance, 20(11), 978-993.
Santos Silva, J., and S. Tenreyro (2010) ‘Currency Unions in Prospect and Retrospect’, Annual Review of Economics 2, 51-74
Schoenmaker, Dirk and Thijs Bosch (2008) ‘Is the Home Bias in Equities and
Bonds Declining in Europe?’, Investment Management and Financial Innovations, 5, 90-102.
Smets, F. (2014) ‘Financial Stability and Monetary Policy: How Closely
Interlinked?’, International Journal of Central Banking
Strong, Norman and Xinzhong Xu (2003), ‘Understanding the Equity Home Bias: Evidence from Survey Data’, The Review of Economics and Statistics, 85, 307-
312.
Suh, Jungwon (2005), ‘Home Bias Among institutional Investors: A Study of the Economist Quarterly Portfolio Poll’, Journal of the Japanese and international
Economies, 19(1), 72-95.
Valiante, Diego (2016), ‘Europe's Untapped Capital Market: Rethinking financial integration after the crisis’, CEPS Paperback, London: Rowman & Littlefield
International.
Veron, N. and G. B. Wolff (2015) ‘Capital Markets Union: a vision for the long term’, Bruegel policy contribution, 2015/5,April
Véron, Nicolas and Guntram B. Wolff (2015), ‘Capital Markets Union: a vision for
the long term’, Policy Contribution 2015/05, Bruegel
Waysand, C., K. Ross and Guzman, J. (2010) ‘European Financial Linkages: a new look at imbalances’, International Monetary Fund Working Paper 10/295
World bank (2015) ‘Linkages between China and Sub-Saharan Africa’, Chapter 2
in ‘Global Economic Prospects’, June

Analysis of developments in EU capital flows in the global context
October 2016 [141]
Wu, J. C. and F. D. Xia (2015) ‘Measuring the Macroeconomic Impact of Monetary
Policy at the Zero Lower Bound’, Journal of Money, Credit, and Banking, forthcoming
Yuliya Demyanyk, Charlotte Ostergaard and Bent E. Sørensen (2008) ‘Risk
sharing and portfolio allocation in EMU’, European Economy. Economic Papers 334.
Zucman, Gabriel (2013) ‘The Missing Wealth of Nations: Are Europe and the U.S.
net Debtors or net Creditors?’, The Quarterly Journal of Economics, Oxford University Press, vol. 128(3), pages 1321-1364